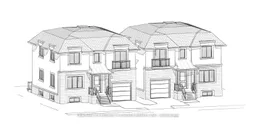
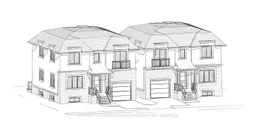
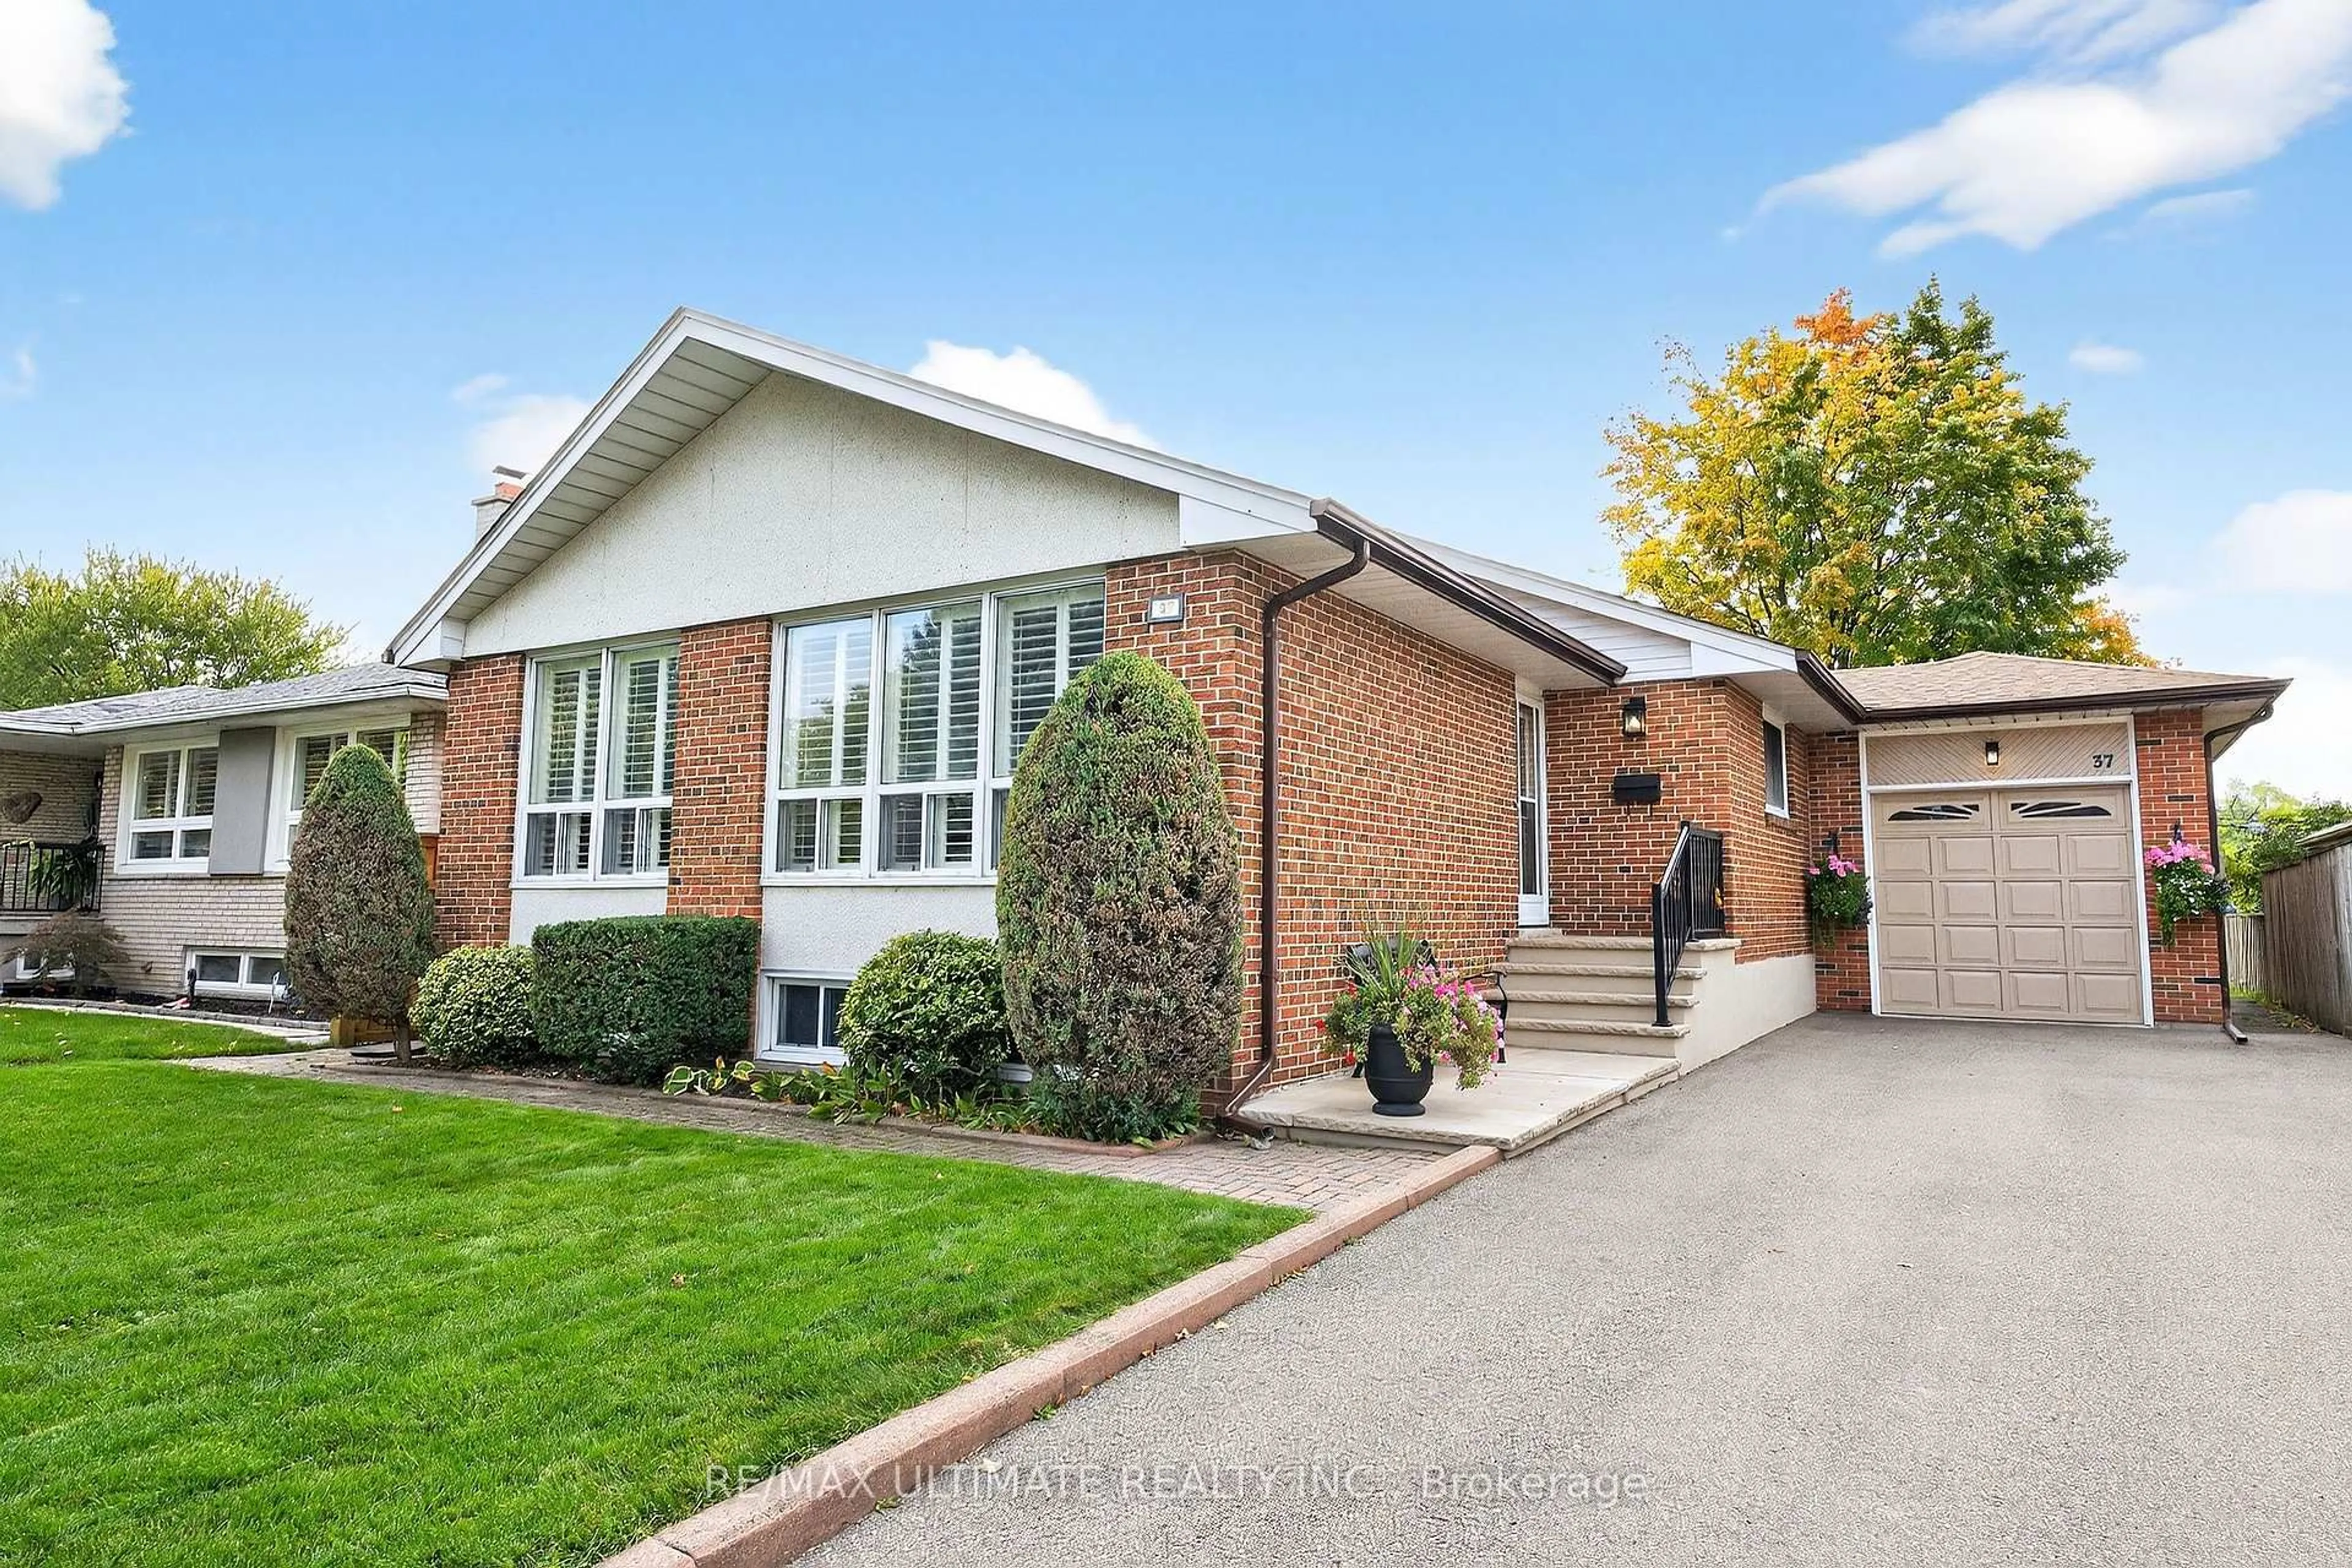
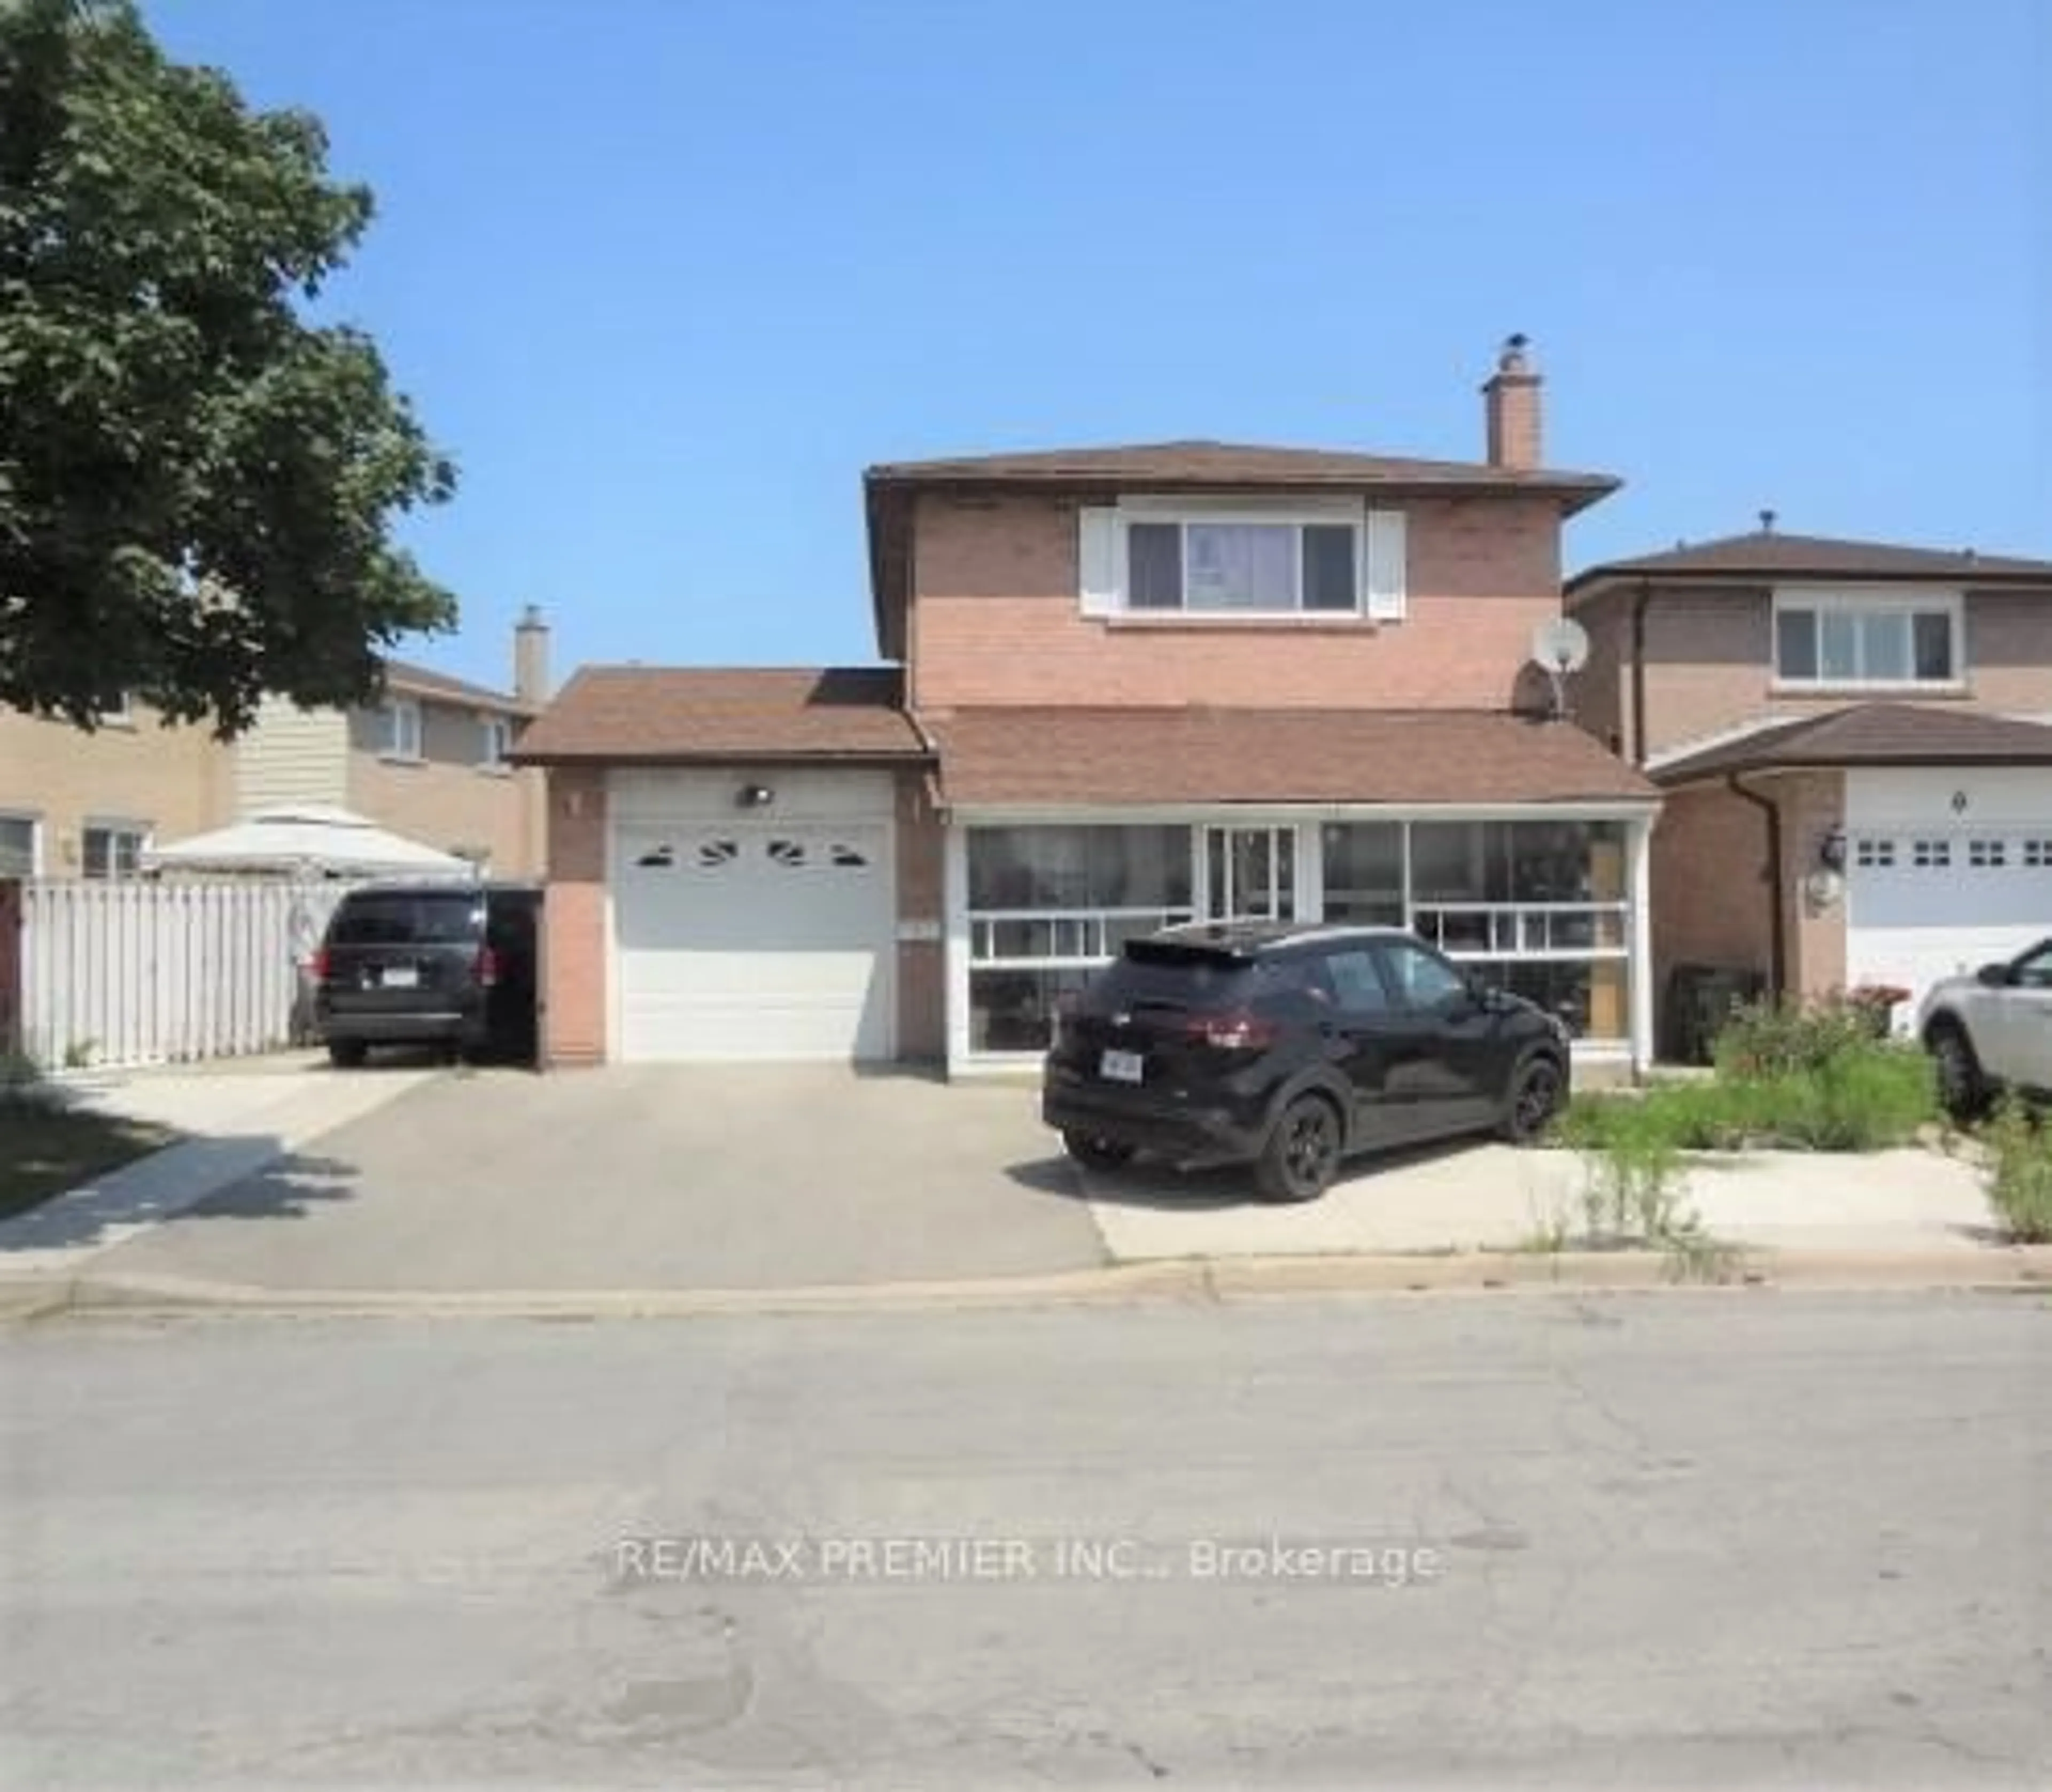
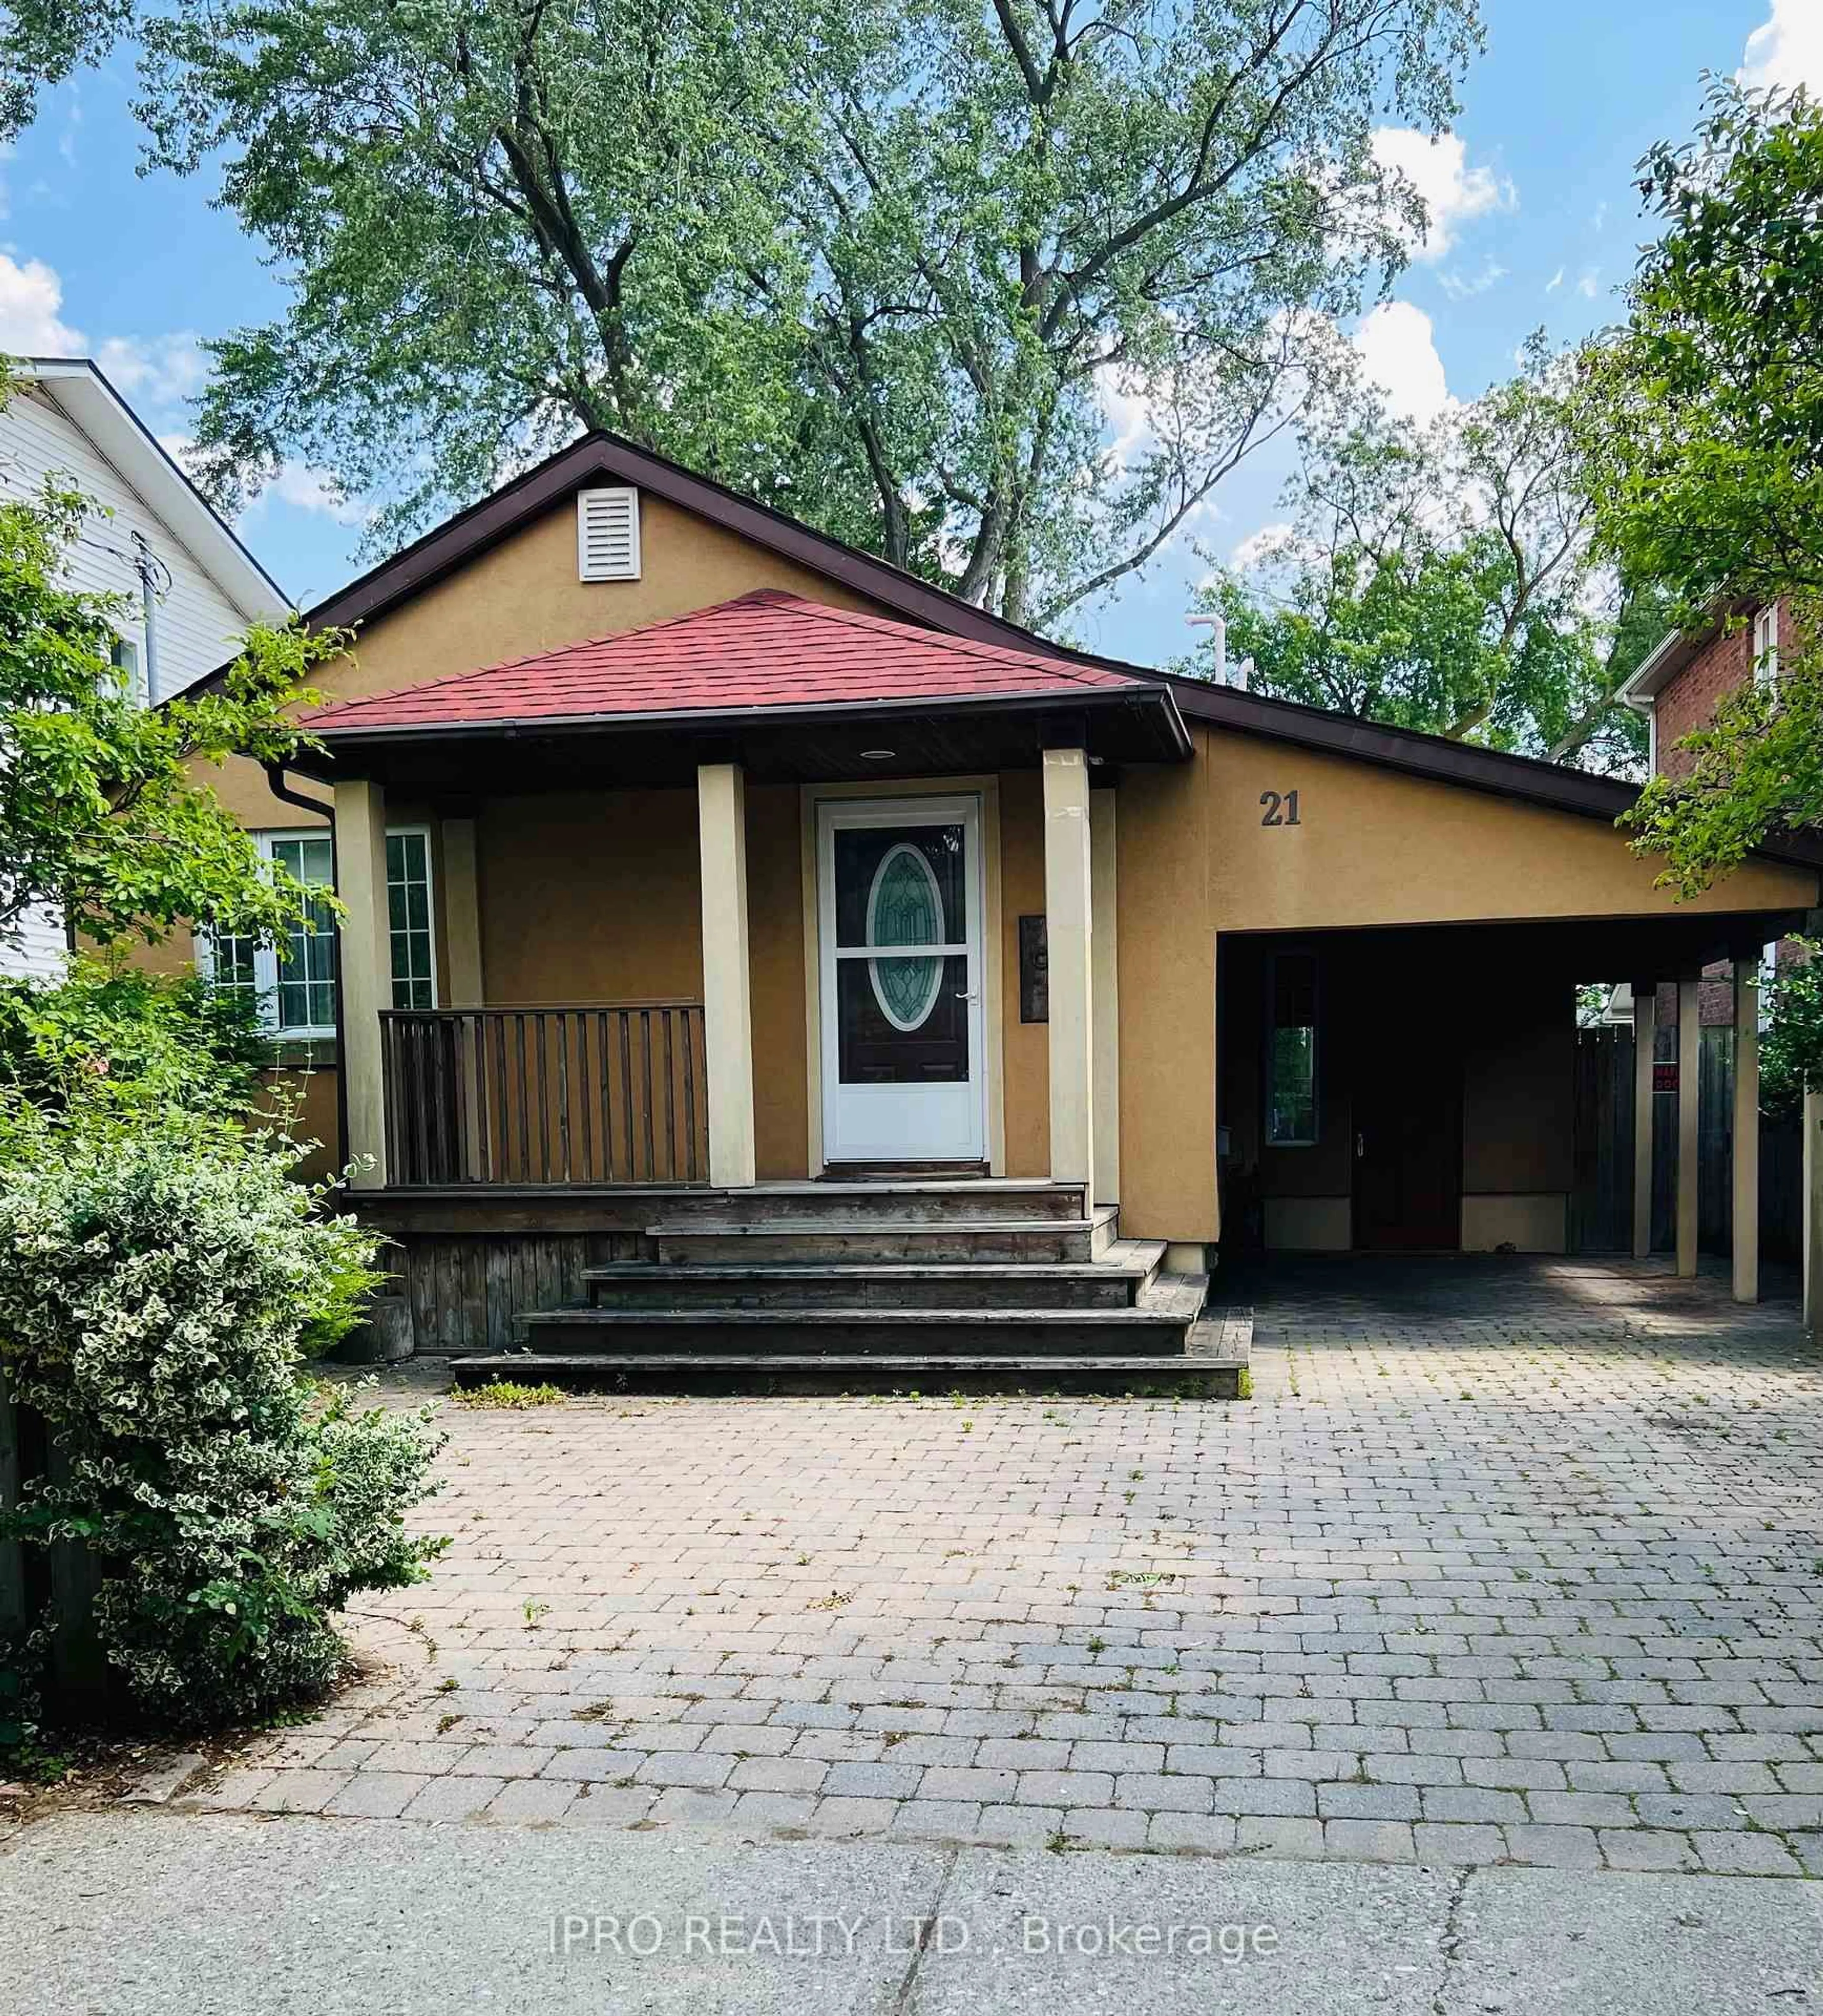
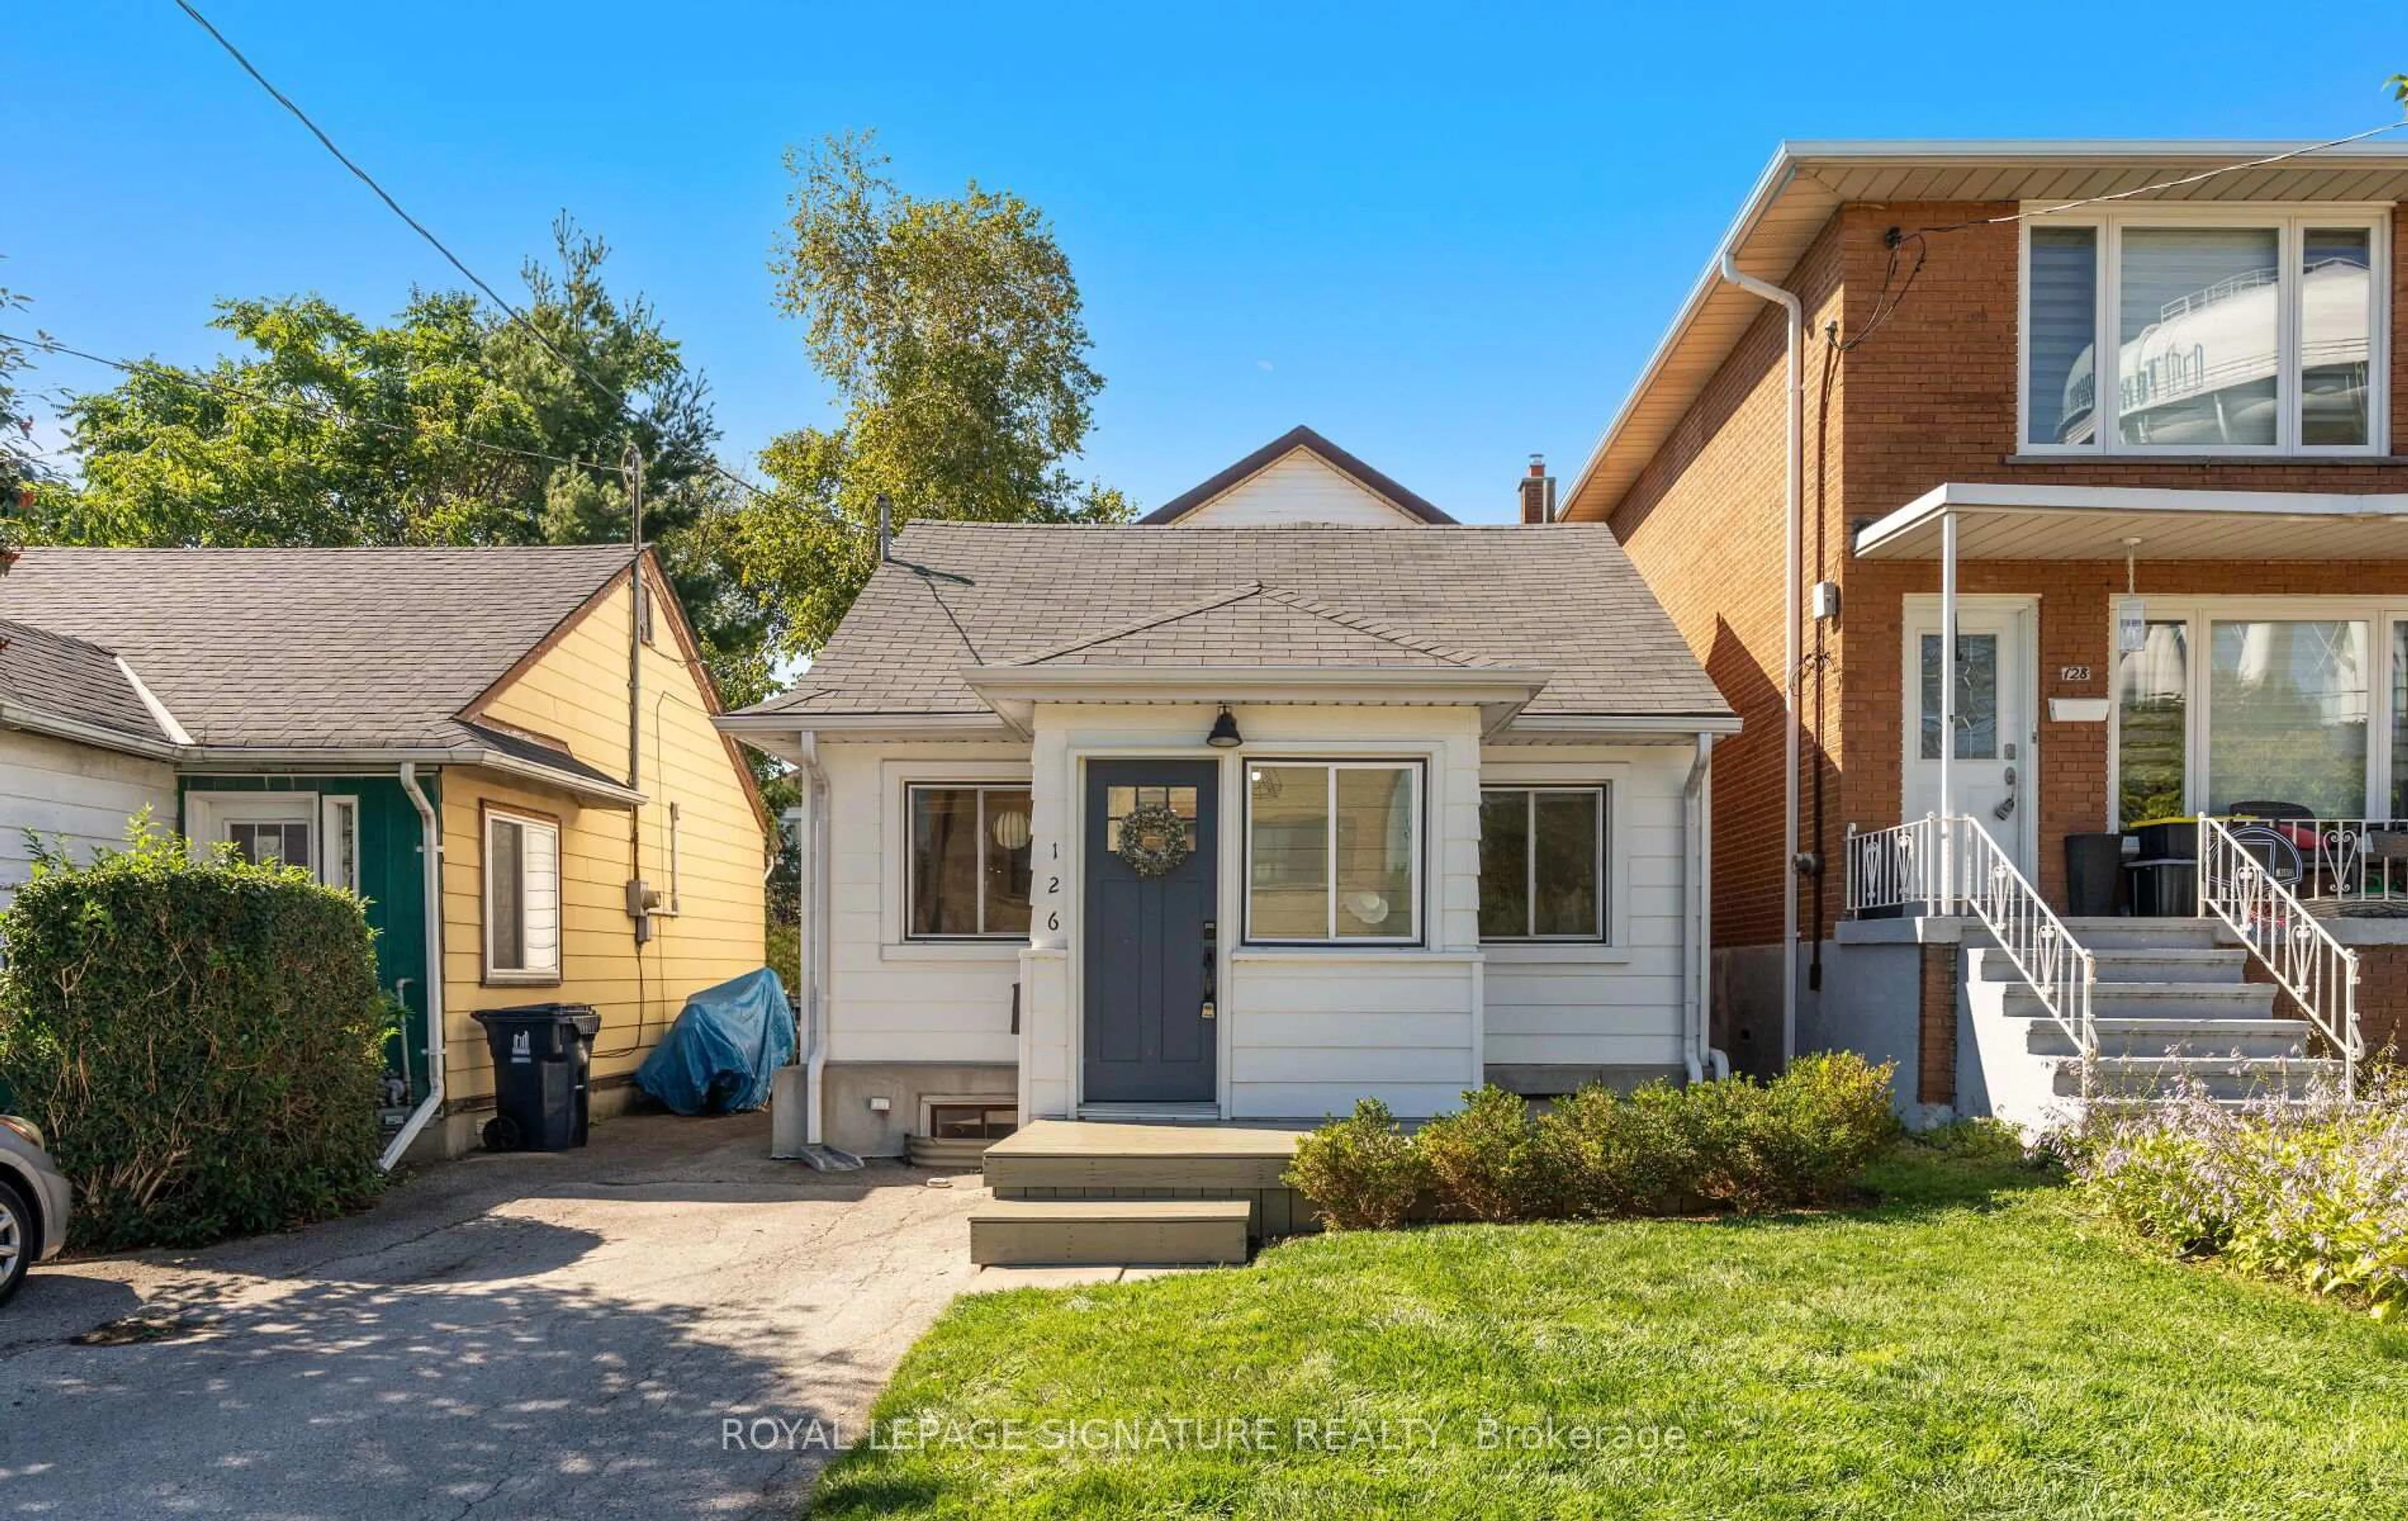
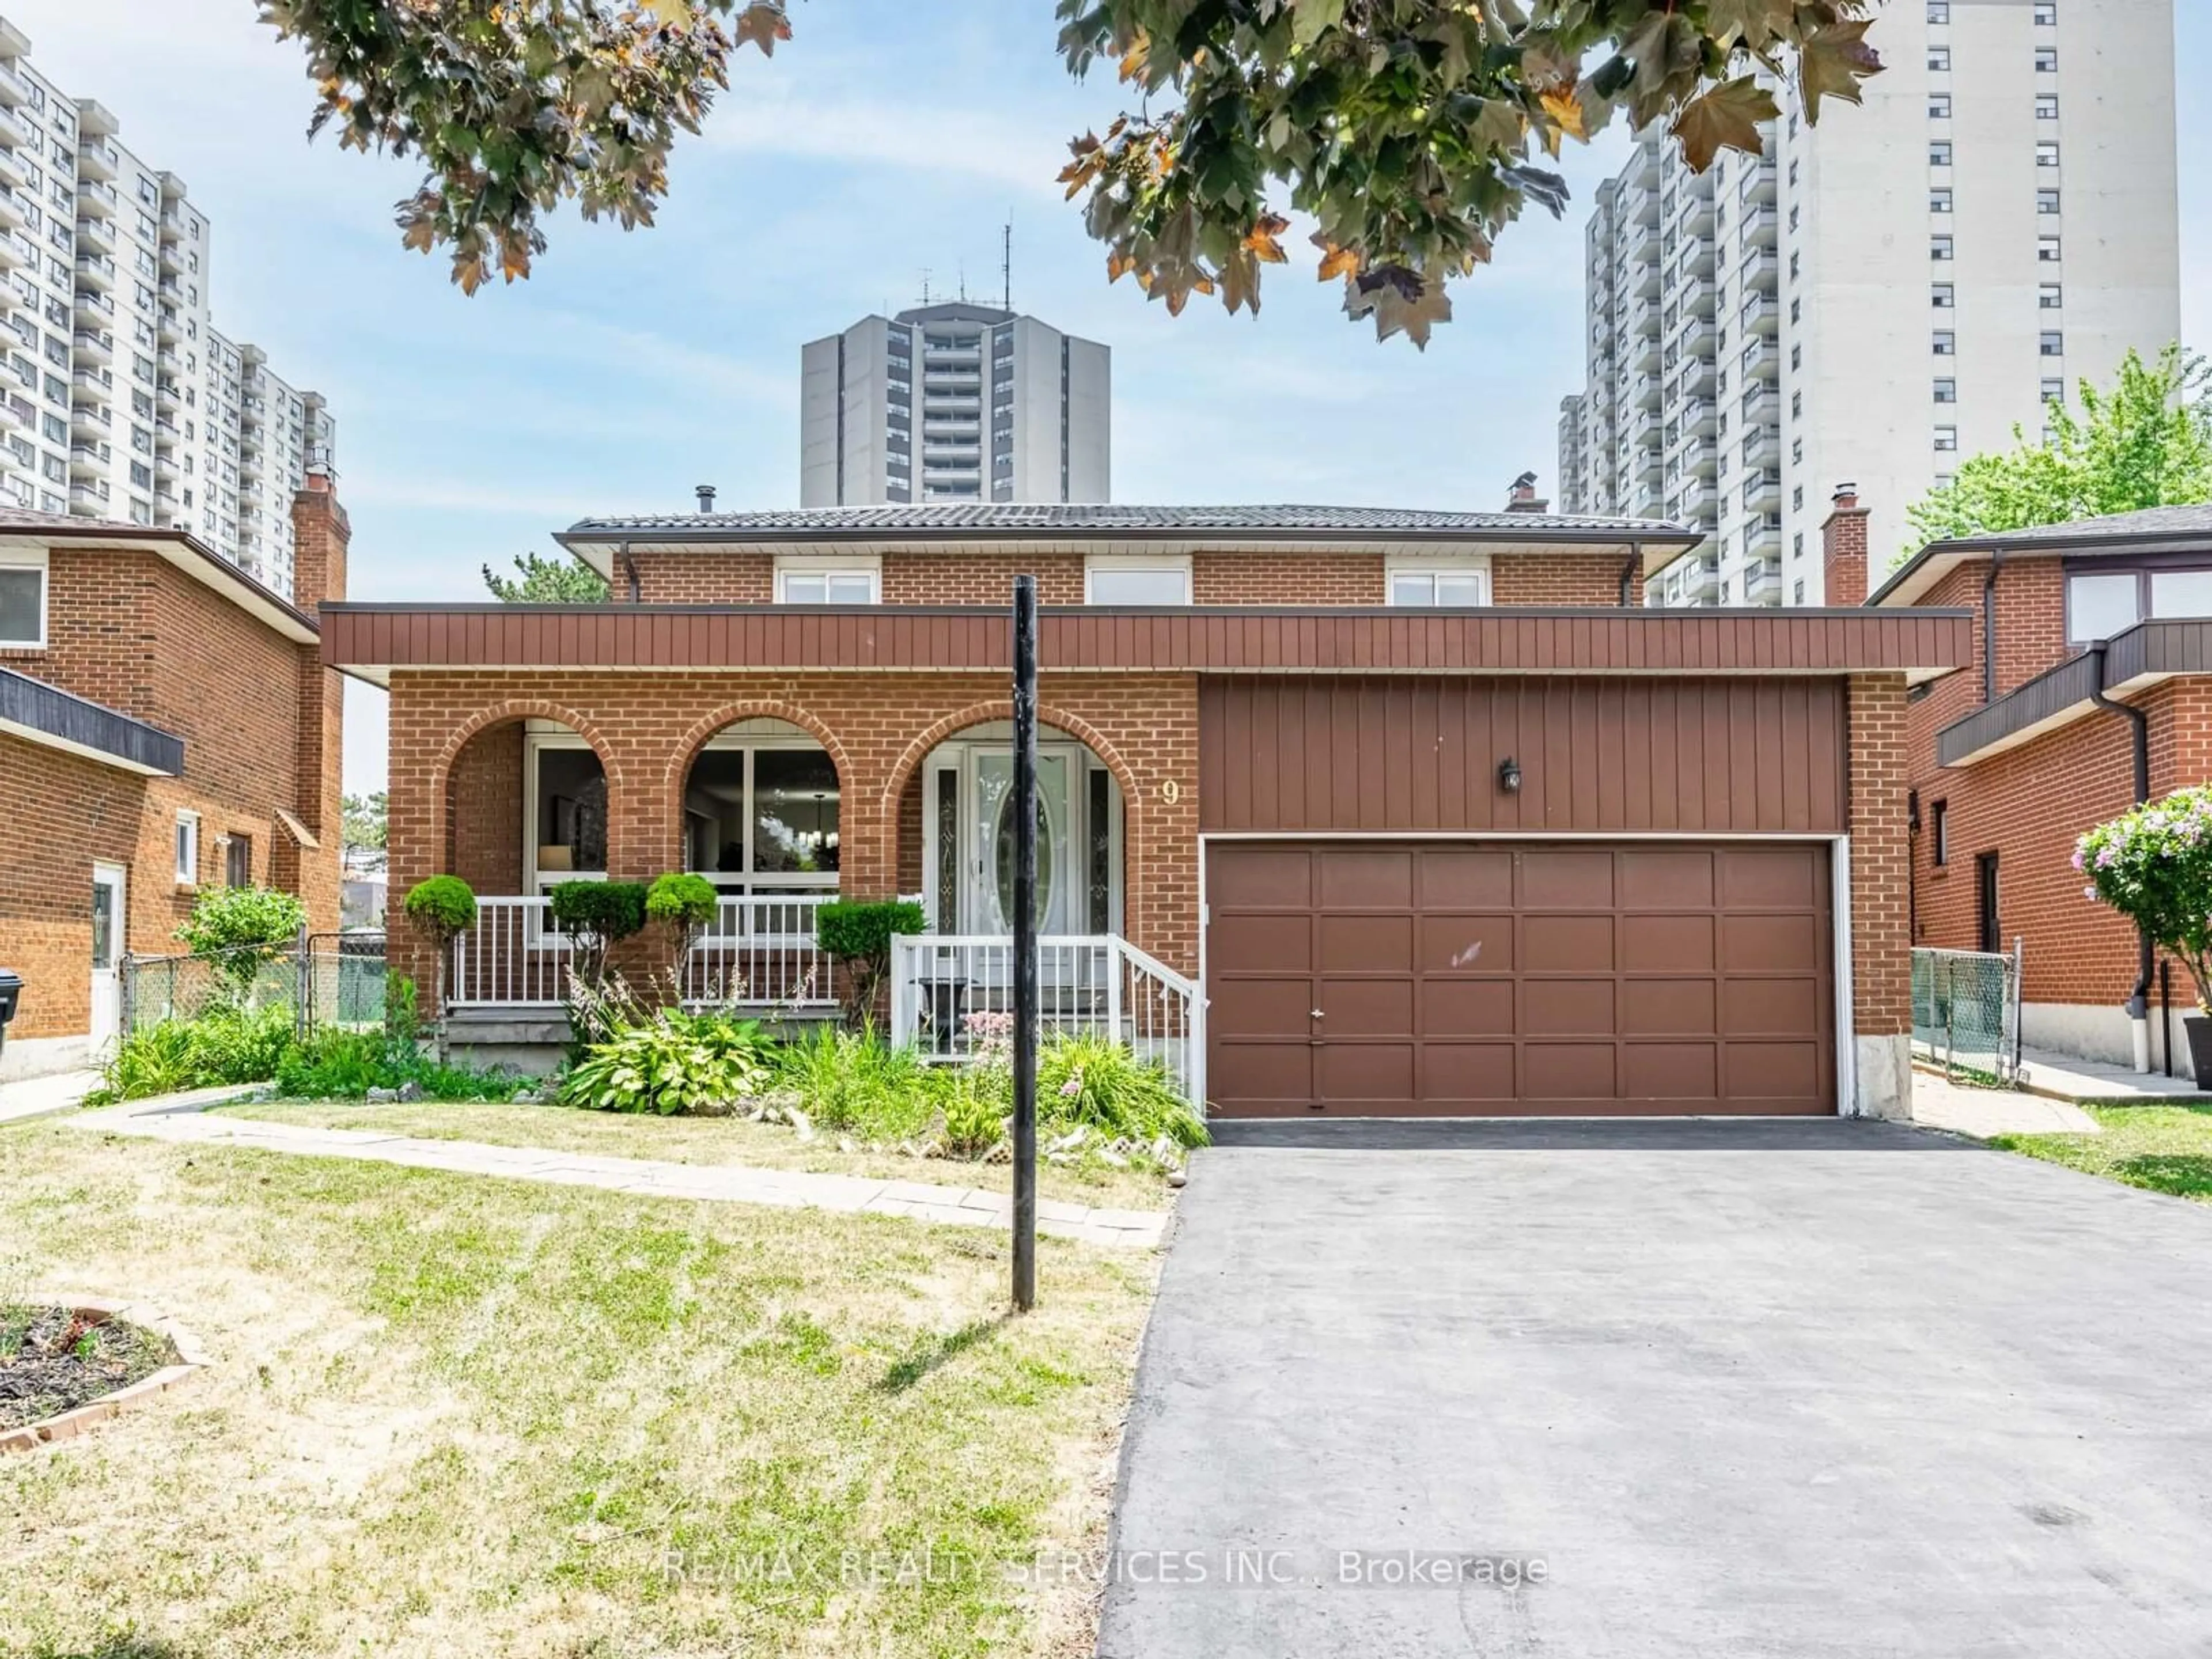
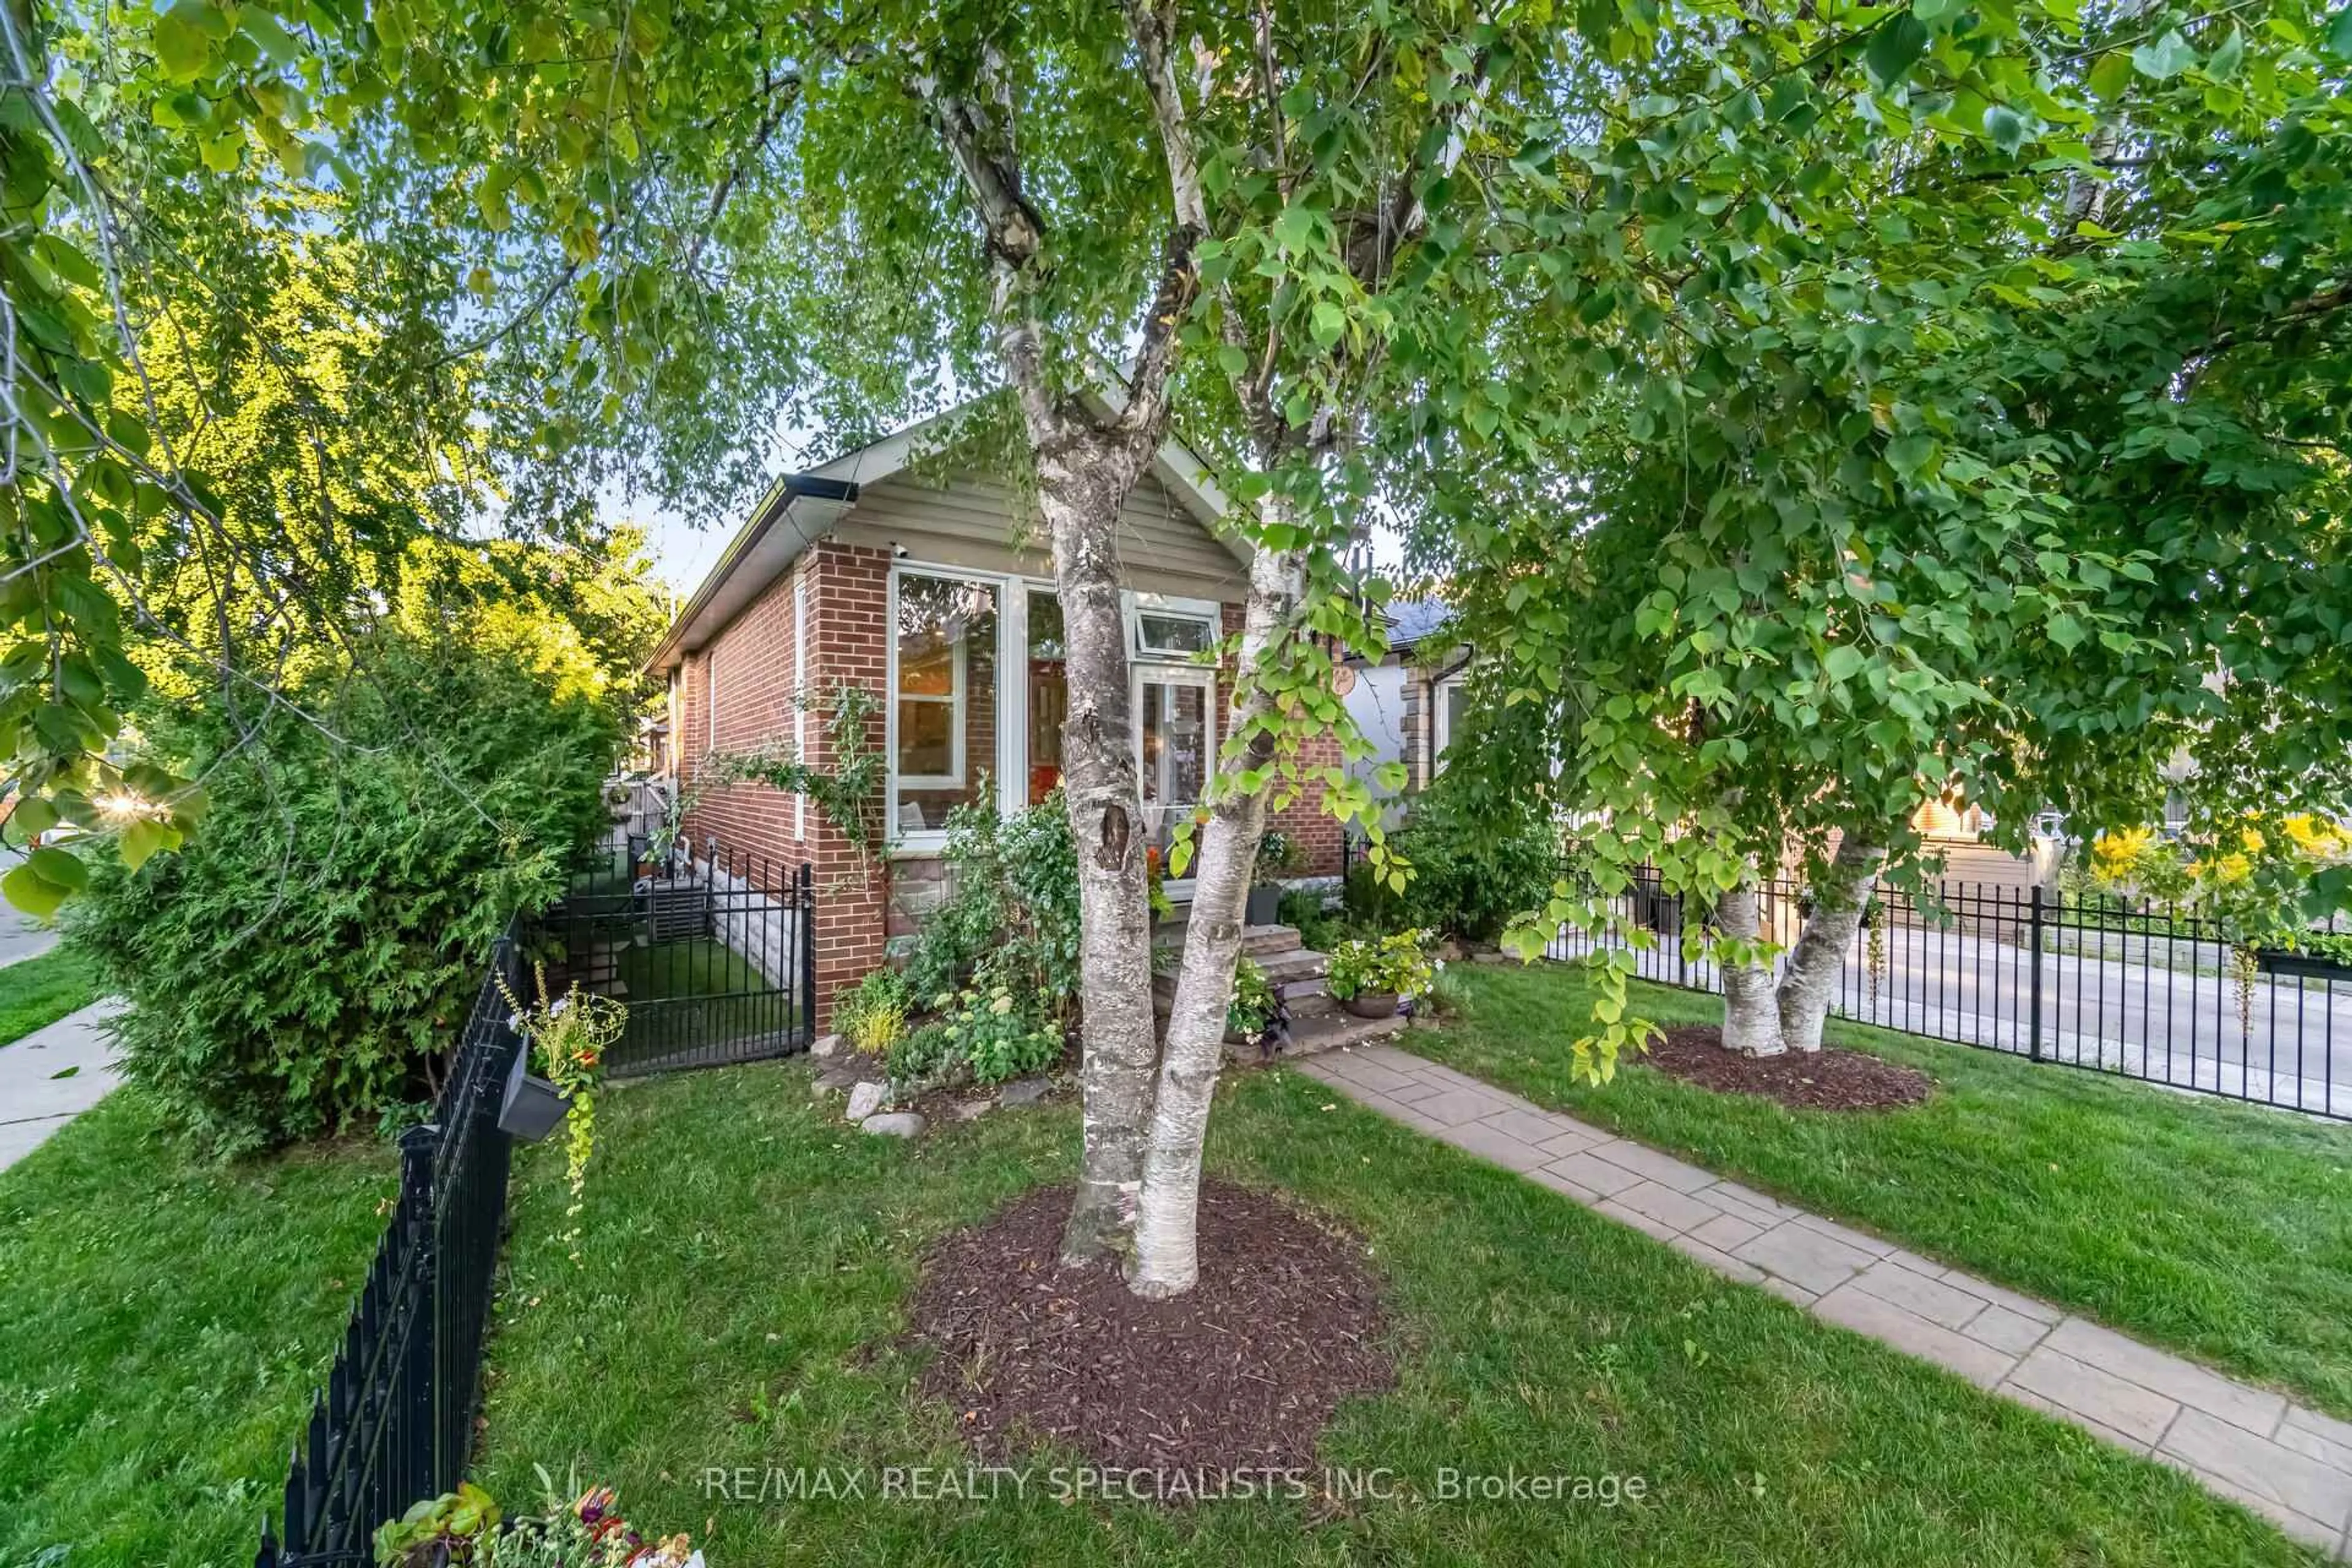
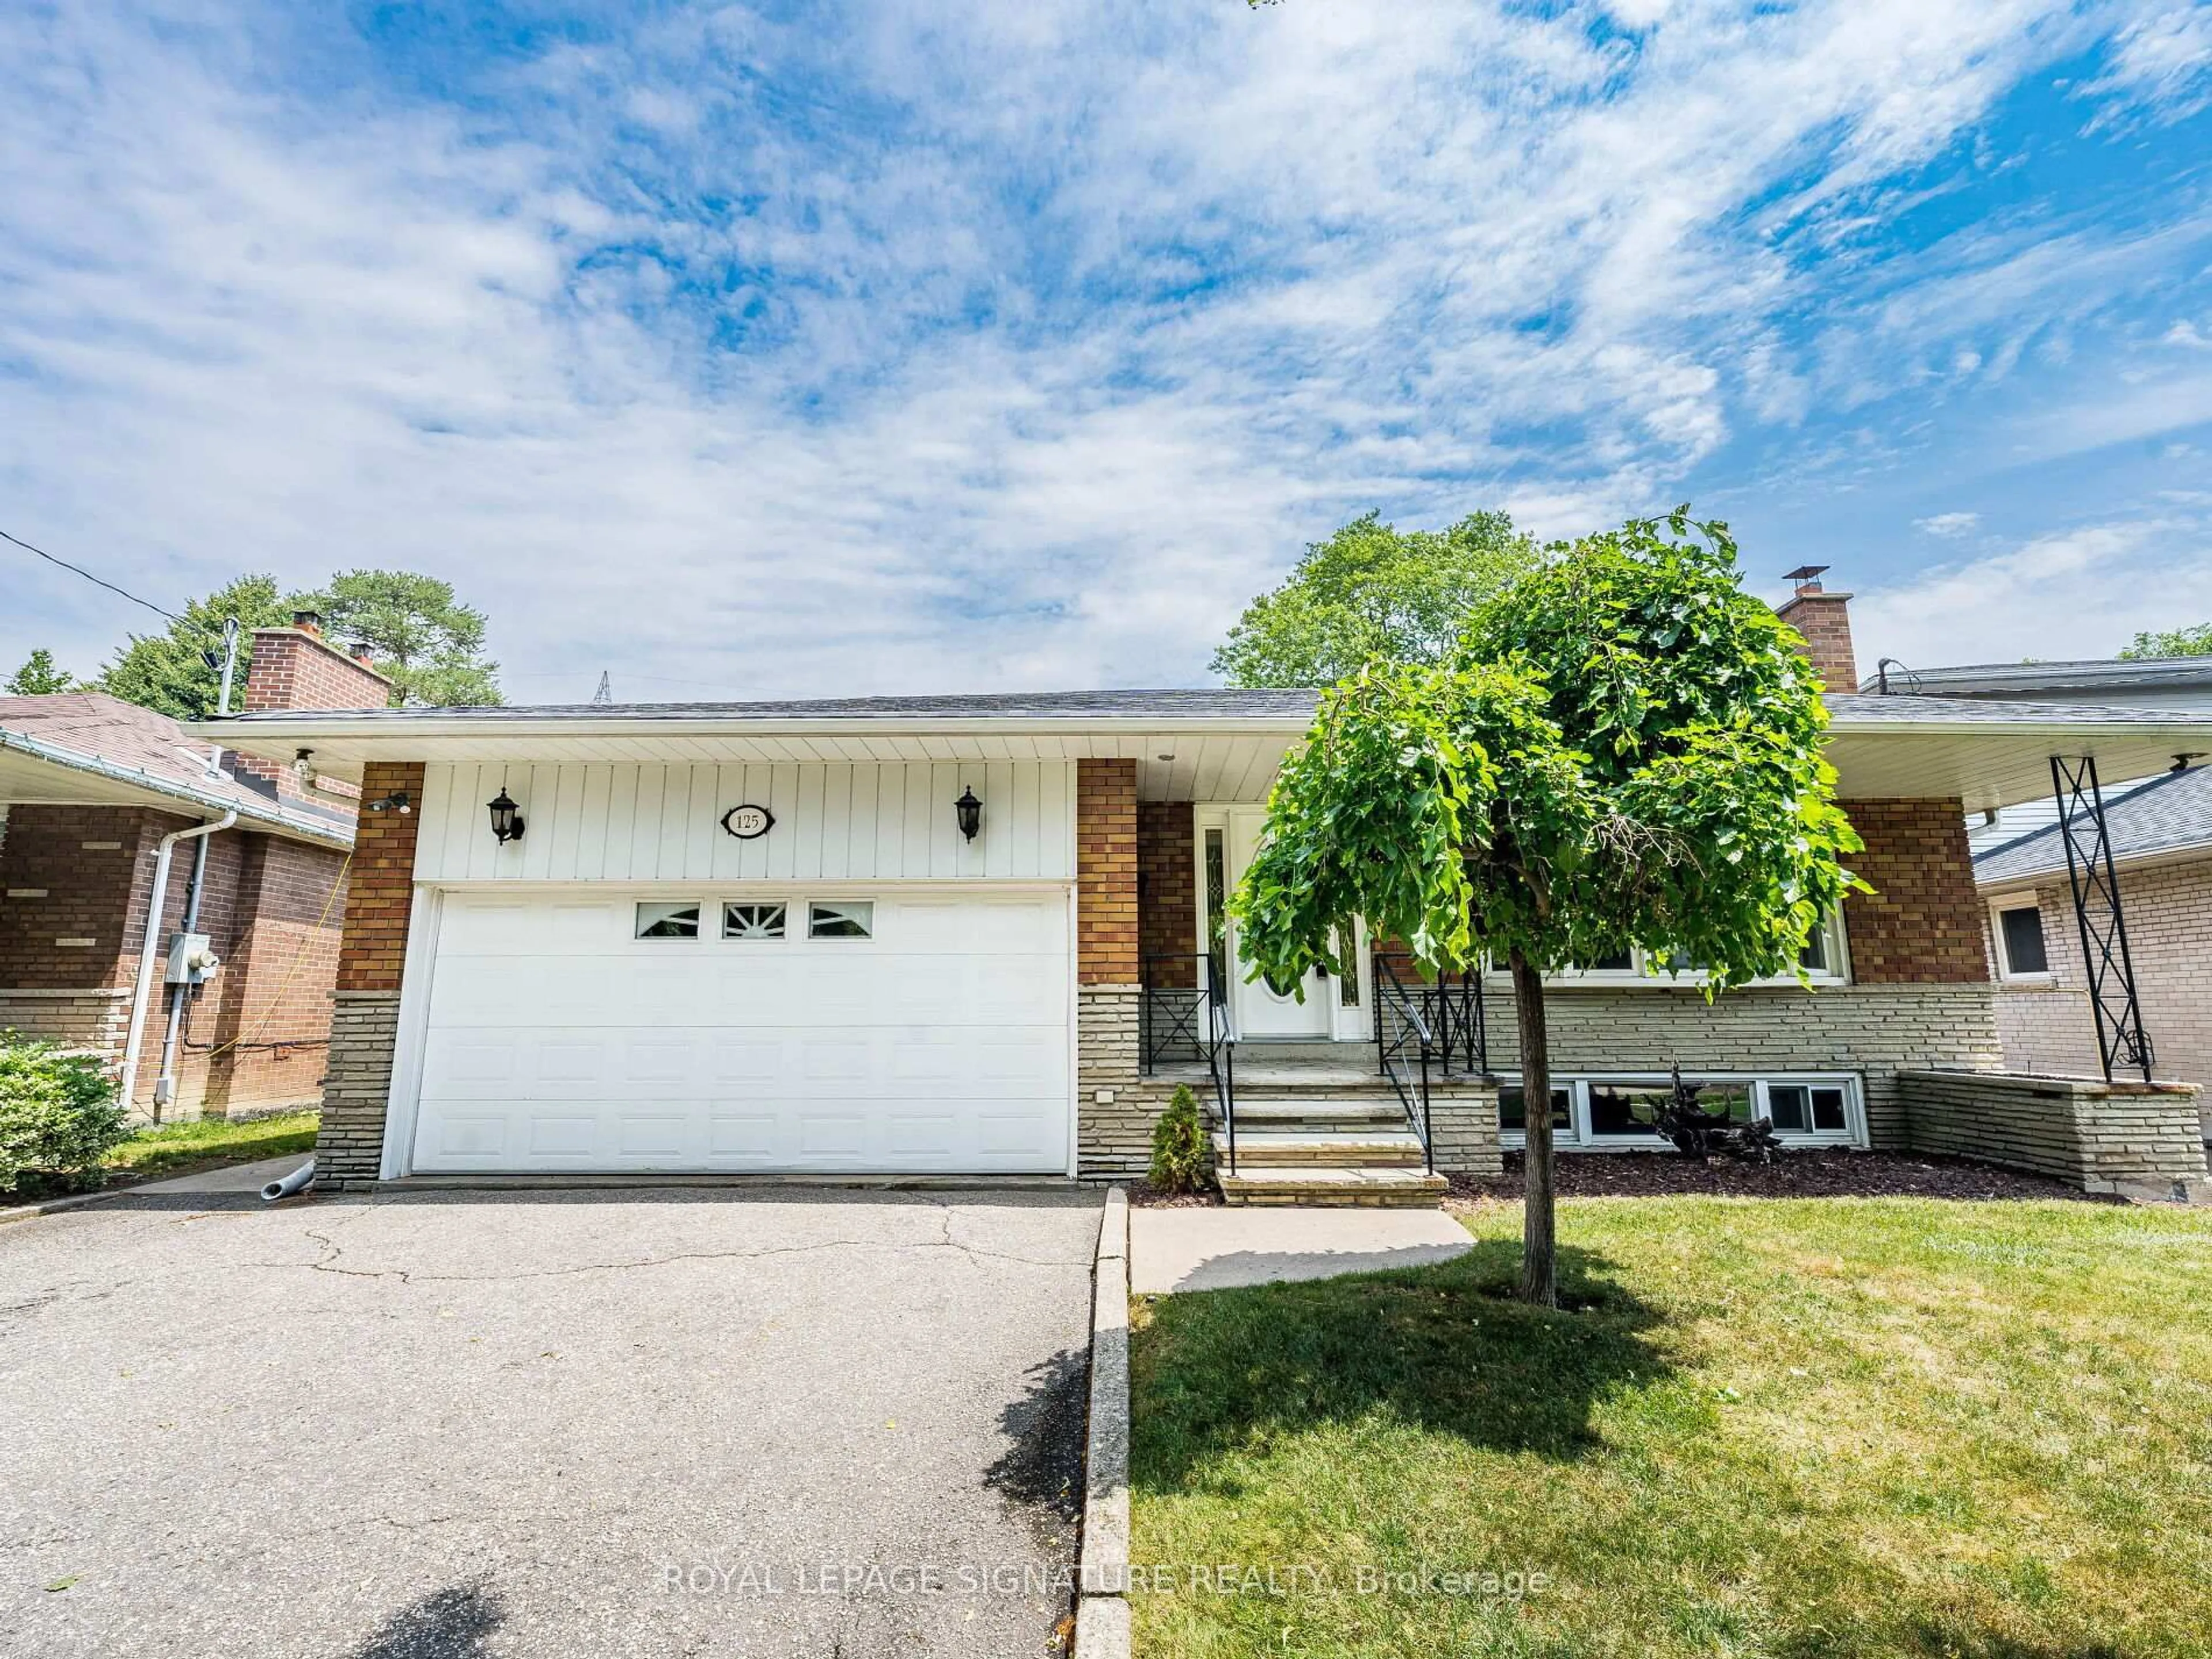
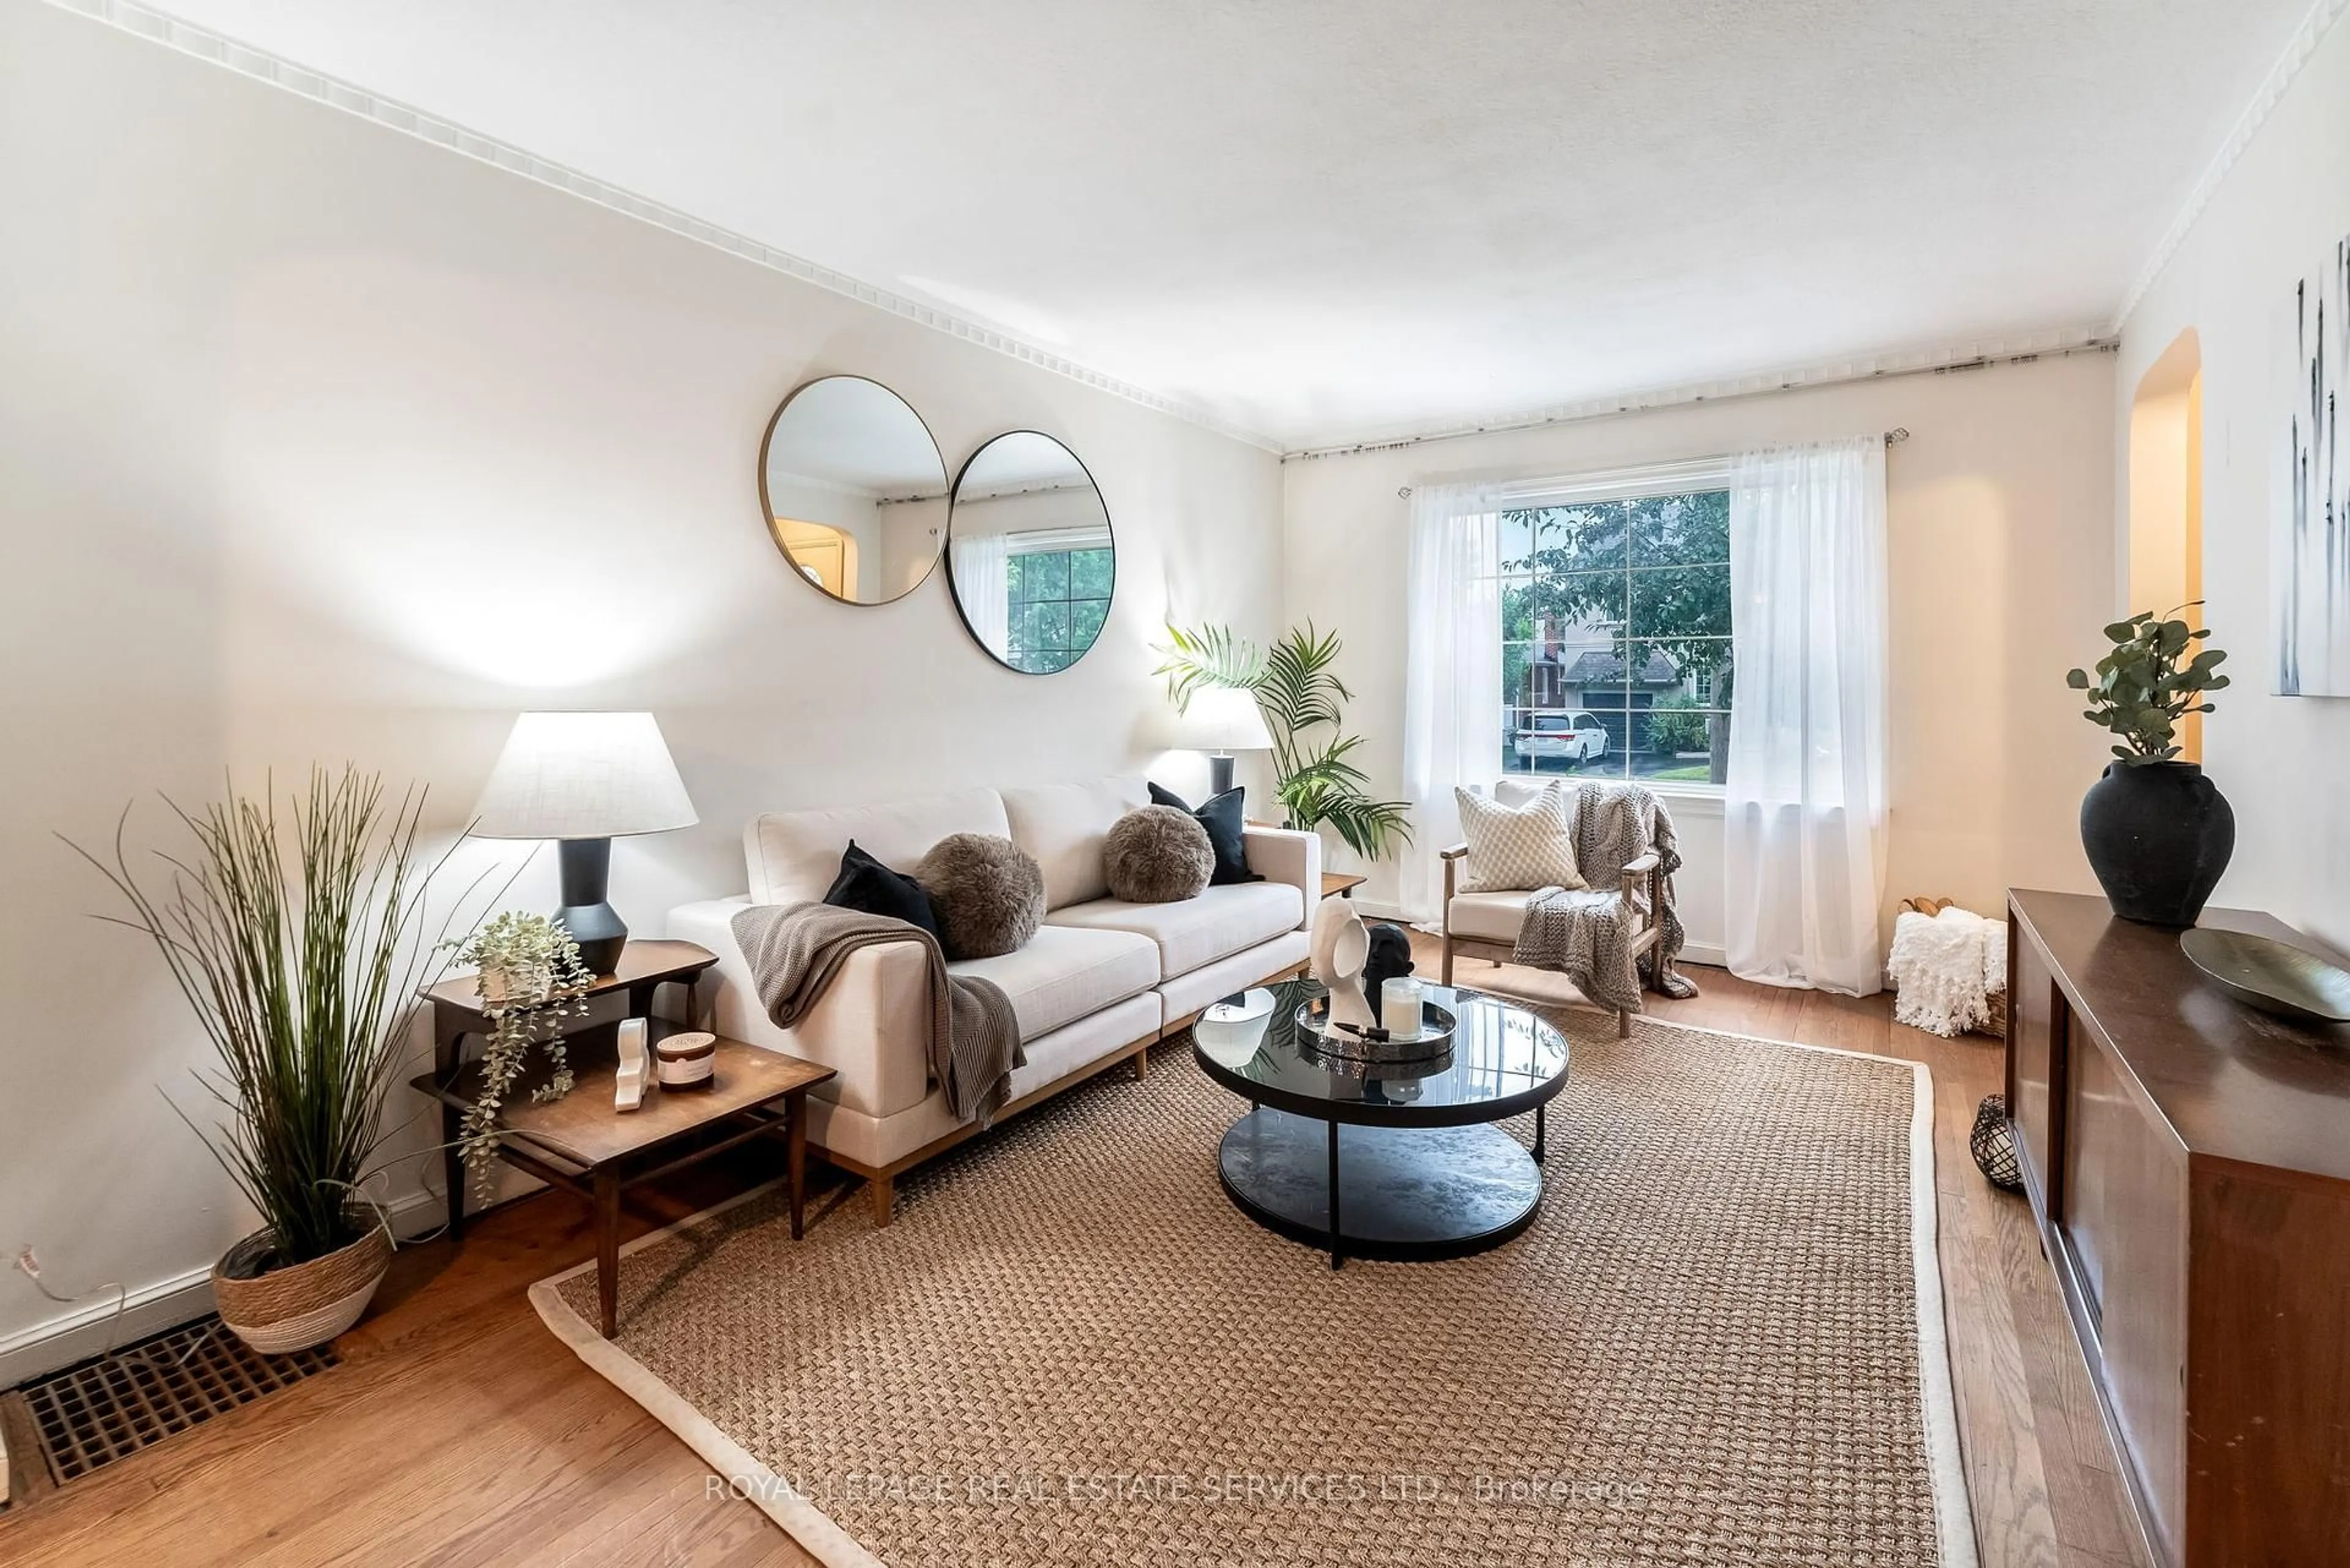
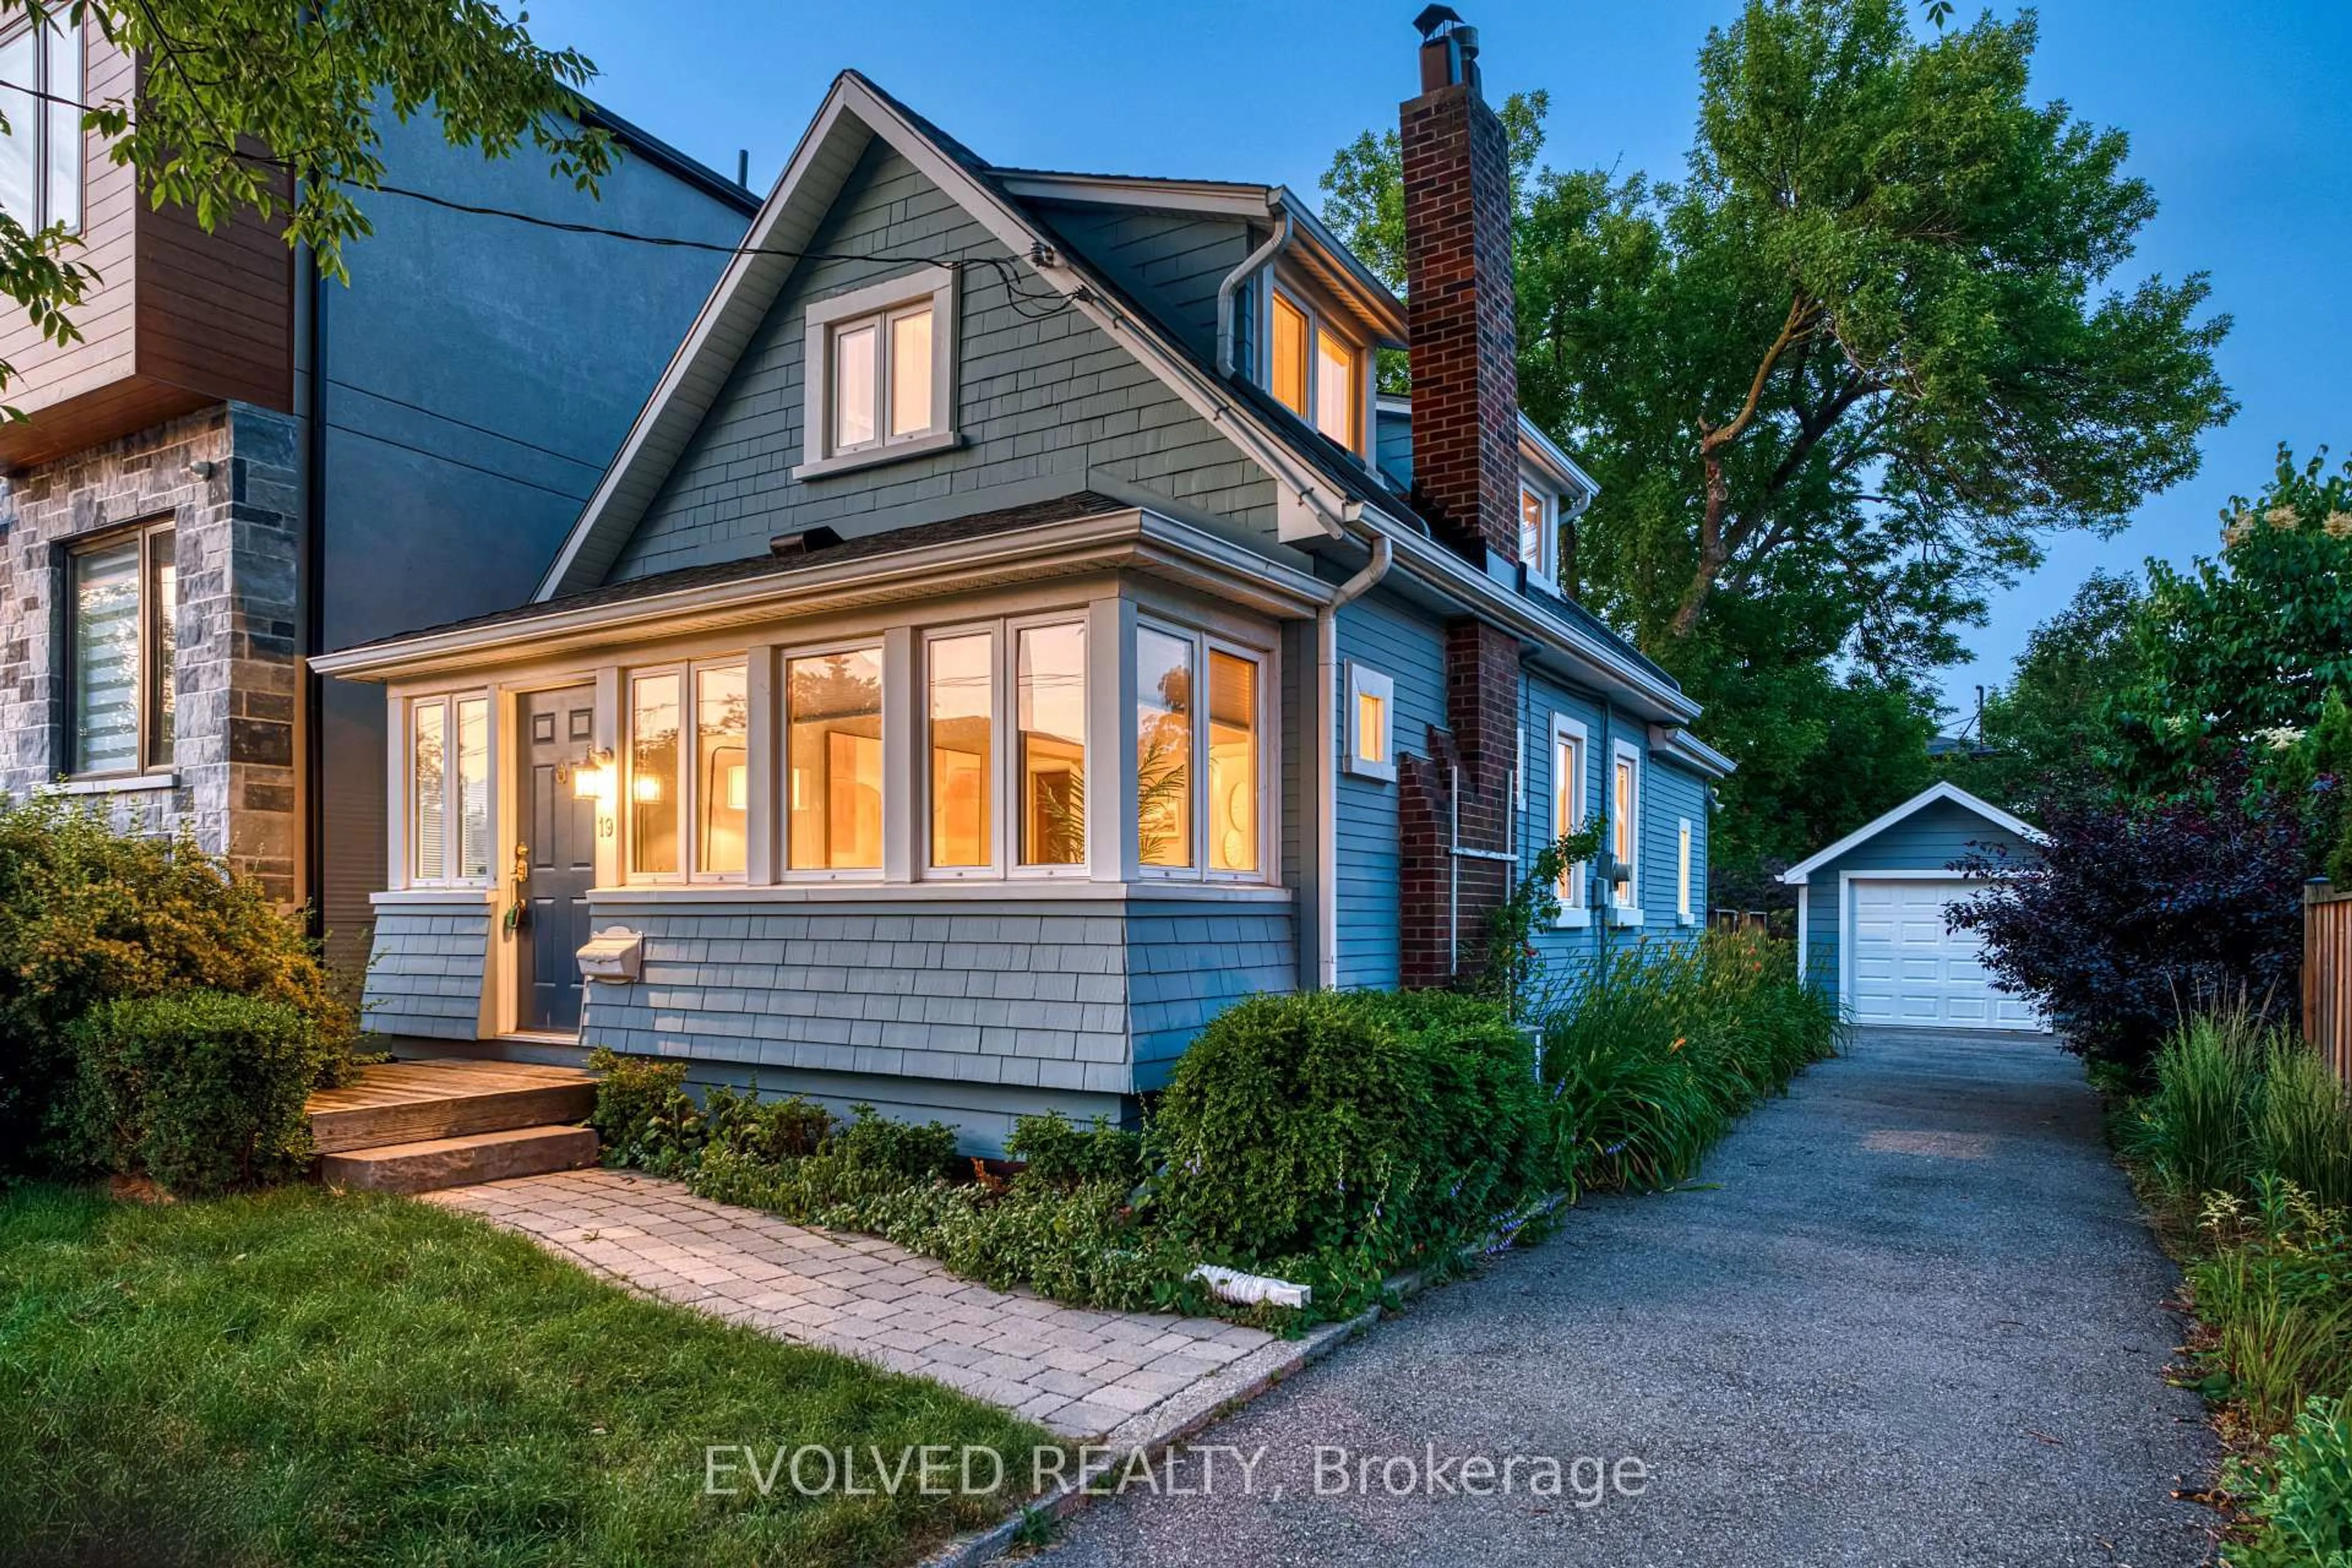
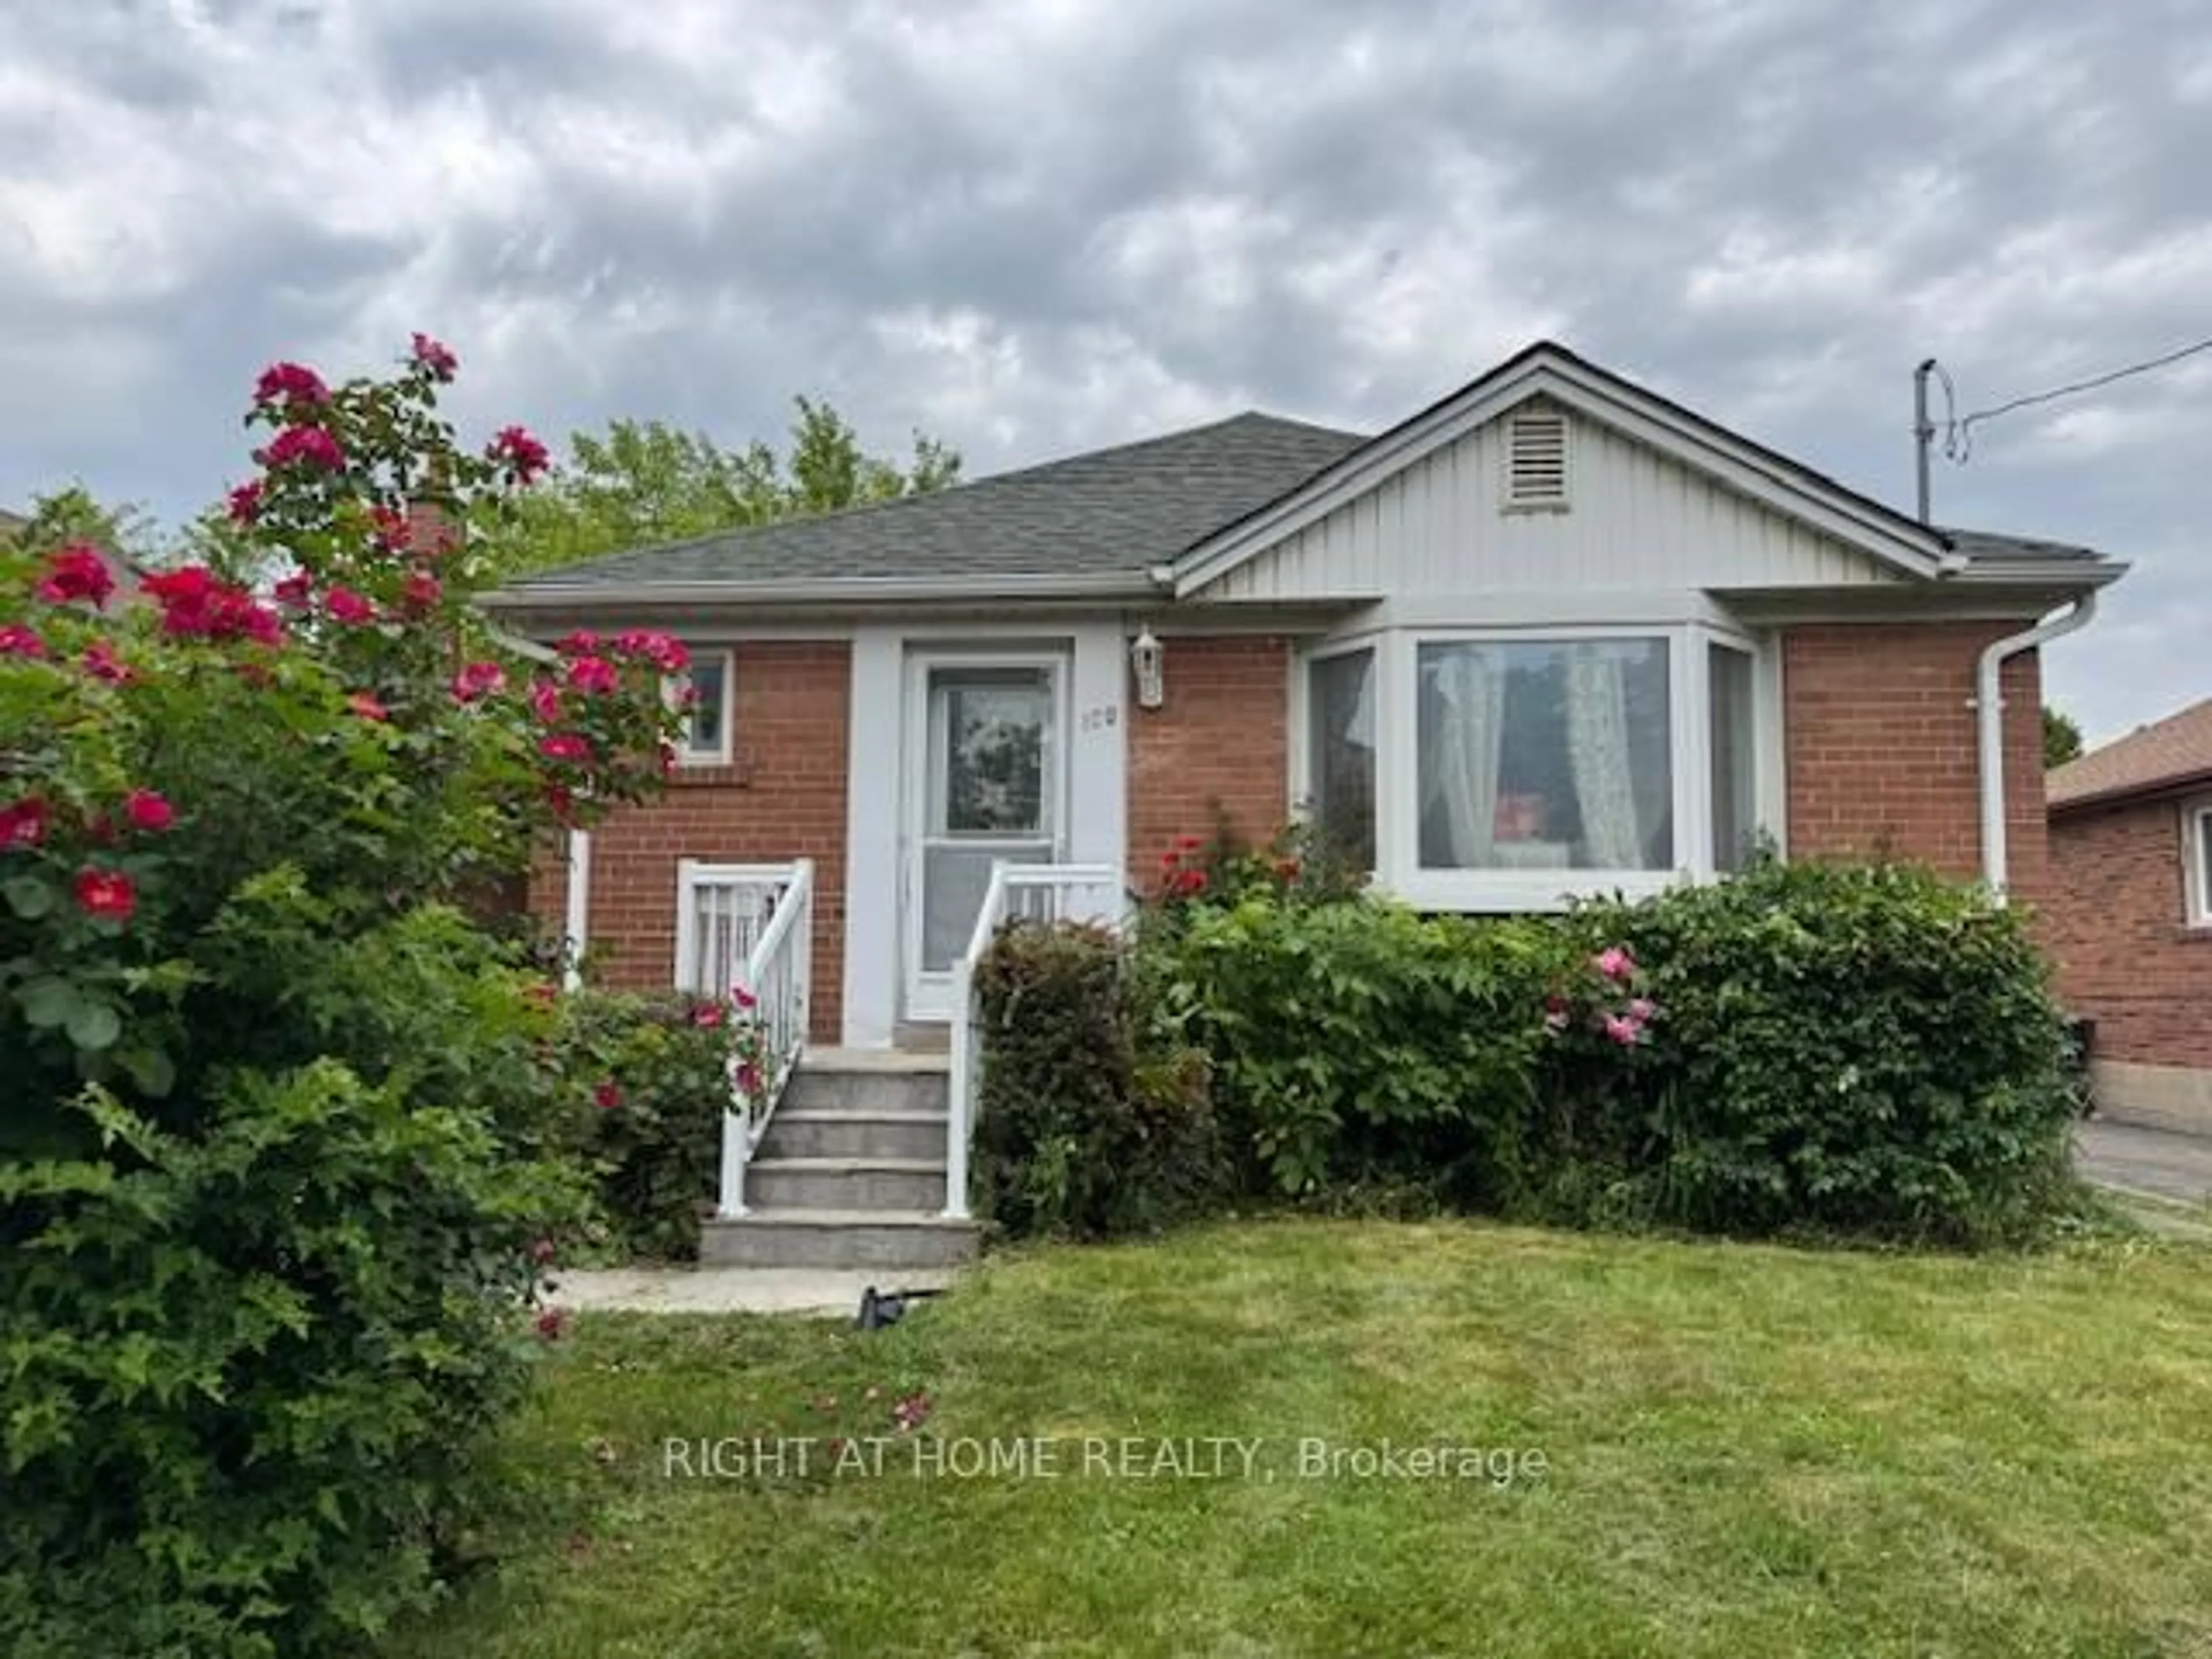
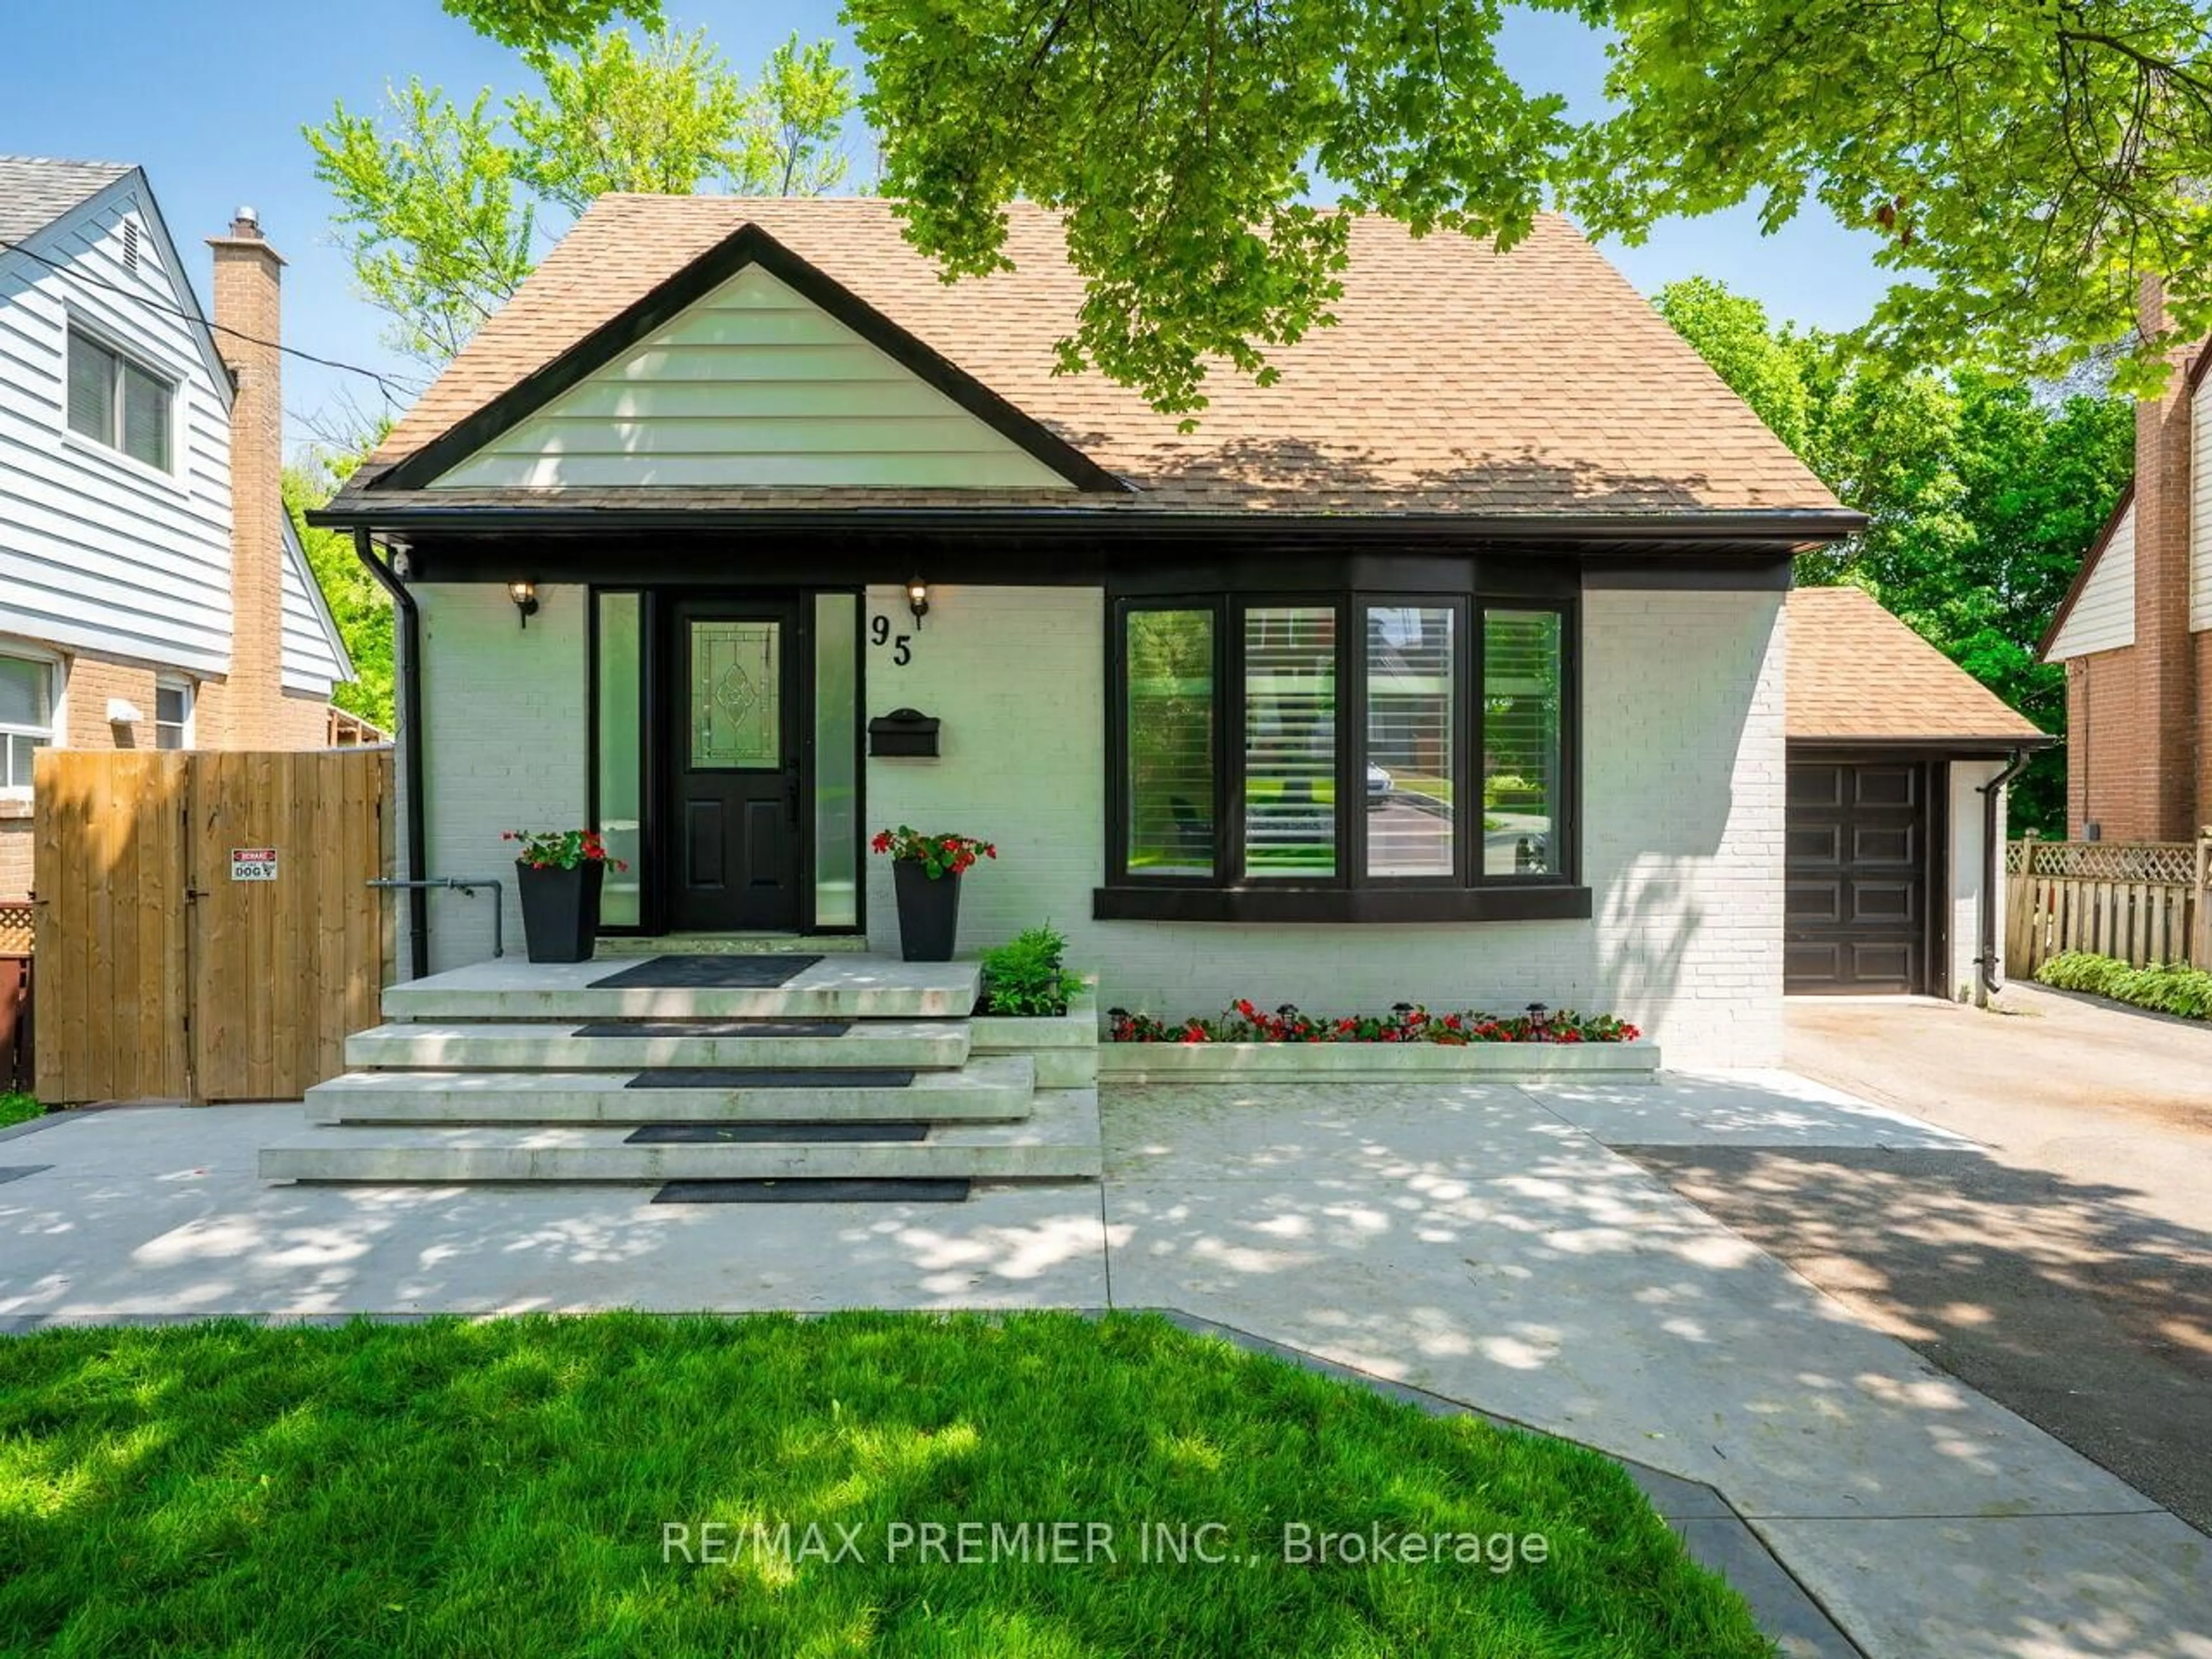
Frontside or backside of a home, the street view for 564 Horner Ave, Toronto Ontario M8W 2C4
47 days on Market

564 Horner Ave, Toronto, Ontario M8W 2C4

Detached
3 + 1
2
- sqft
$1,399,000
Get pre-approvedPowered by Rocket Mortgage
Buy with Wahi to get
Up to
$13,990Cashback
Detached
3 + 1
2
- sqft

Contact us about this property

Call

Highlights

Estimated ValueNot available

Price/Sqft-

Est. Mortgage$6,008/mo

Tax Amount (2024)$3,798/yr

Days On Market47 days


Description

Attention Builders/Investors/End Users. Severence approved for two detached home, each with 4 bdrm & 5 washrooms. Bsmt has separate entrance site plan copy attached, walk to Etobicoke Creek, Marie Curtis Park, Long branch go train, School, Shop, Best Pocket in Aderwood.


Property Details

StyleBungalow
View-
Age of property-
SqFt-
Lot Size6,396 SqFt(78 x 82)
Parking Spaces5
MLS ®NumberW10406575
Community NameAlderwood
Data SourceTRREB
Listing byCENTURY 21 PEOPLE`S CHOICE REALTY INC.

Features

Heating: Water
Basement: Finished, Sep Entrance

Main Floor

Living

3.96 x 3.97

Hardwood Floor / Crown Moulding / Window

Dining

3.62 x 1.48

Hardwood Floor / Bay Window / Picture Window

Kitchen

4.50 x 3.28

Ceramic Floor / Eat-In Kitchen / Window

Prim Bdrm

3.71 x 2.98

Hardwood Floor / Closet / O/Looks Backyard


Features

Lot size: 6,396 SqFt

Parking

Garage spaces -

Garage type -

Total parking spaces 5


Property listed by CENTURY 21 PEOPLE`S CHOICE REALTY INC., Brokerage

Get up to 1% cashback when you buy your dream home with Wahi Cashback

Cashback Banner Image

A new way to buy a home that puts cash back in your pocket.

  • Our in-house Realtors do more deals and bring that negotiating power into your corner
  • We leverage technology to get you more insights, move faster and simplify the process
  • Our digital business model means we pass the savings onto you, with up to 1% cashback on the purchase of your home

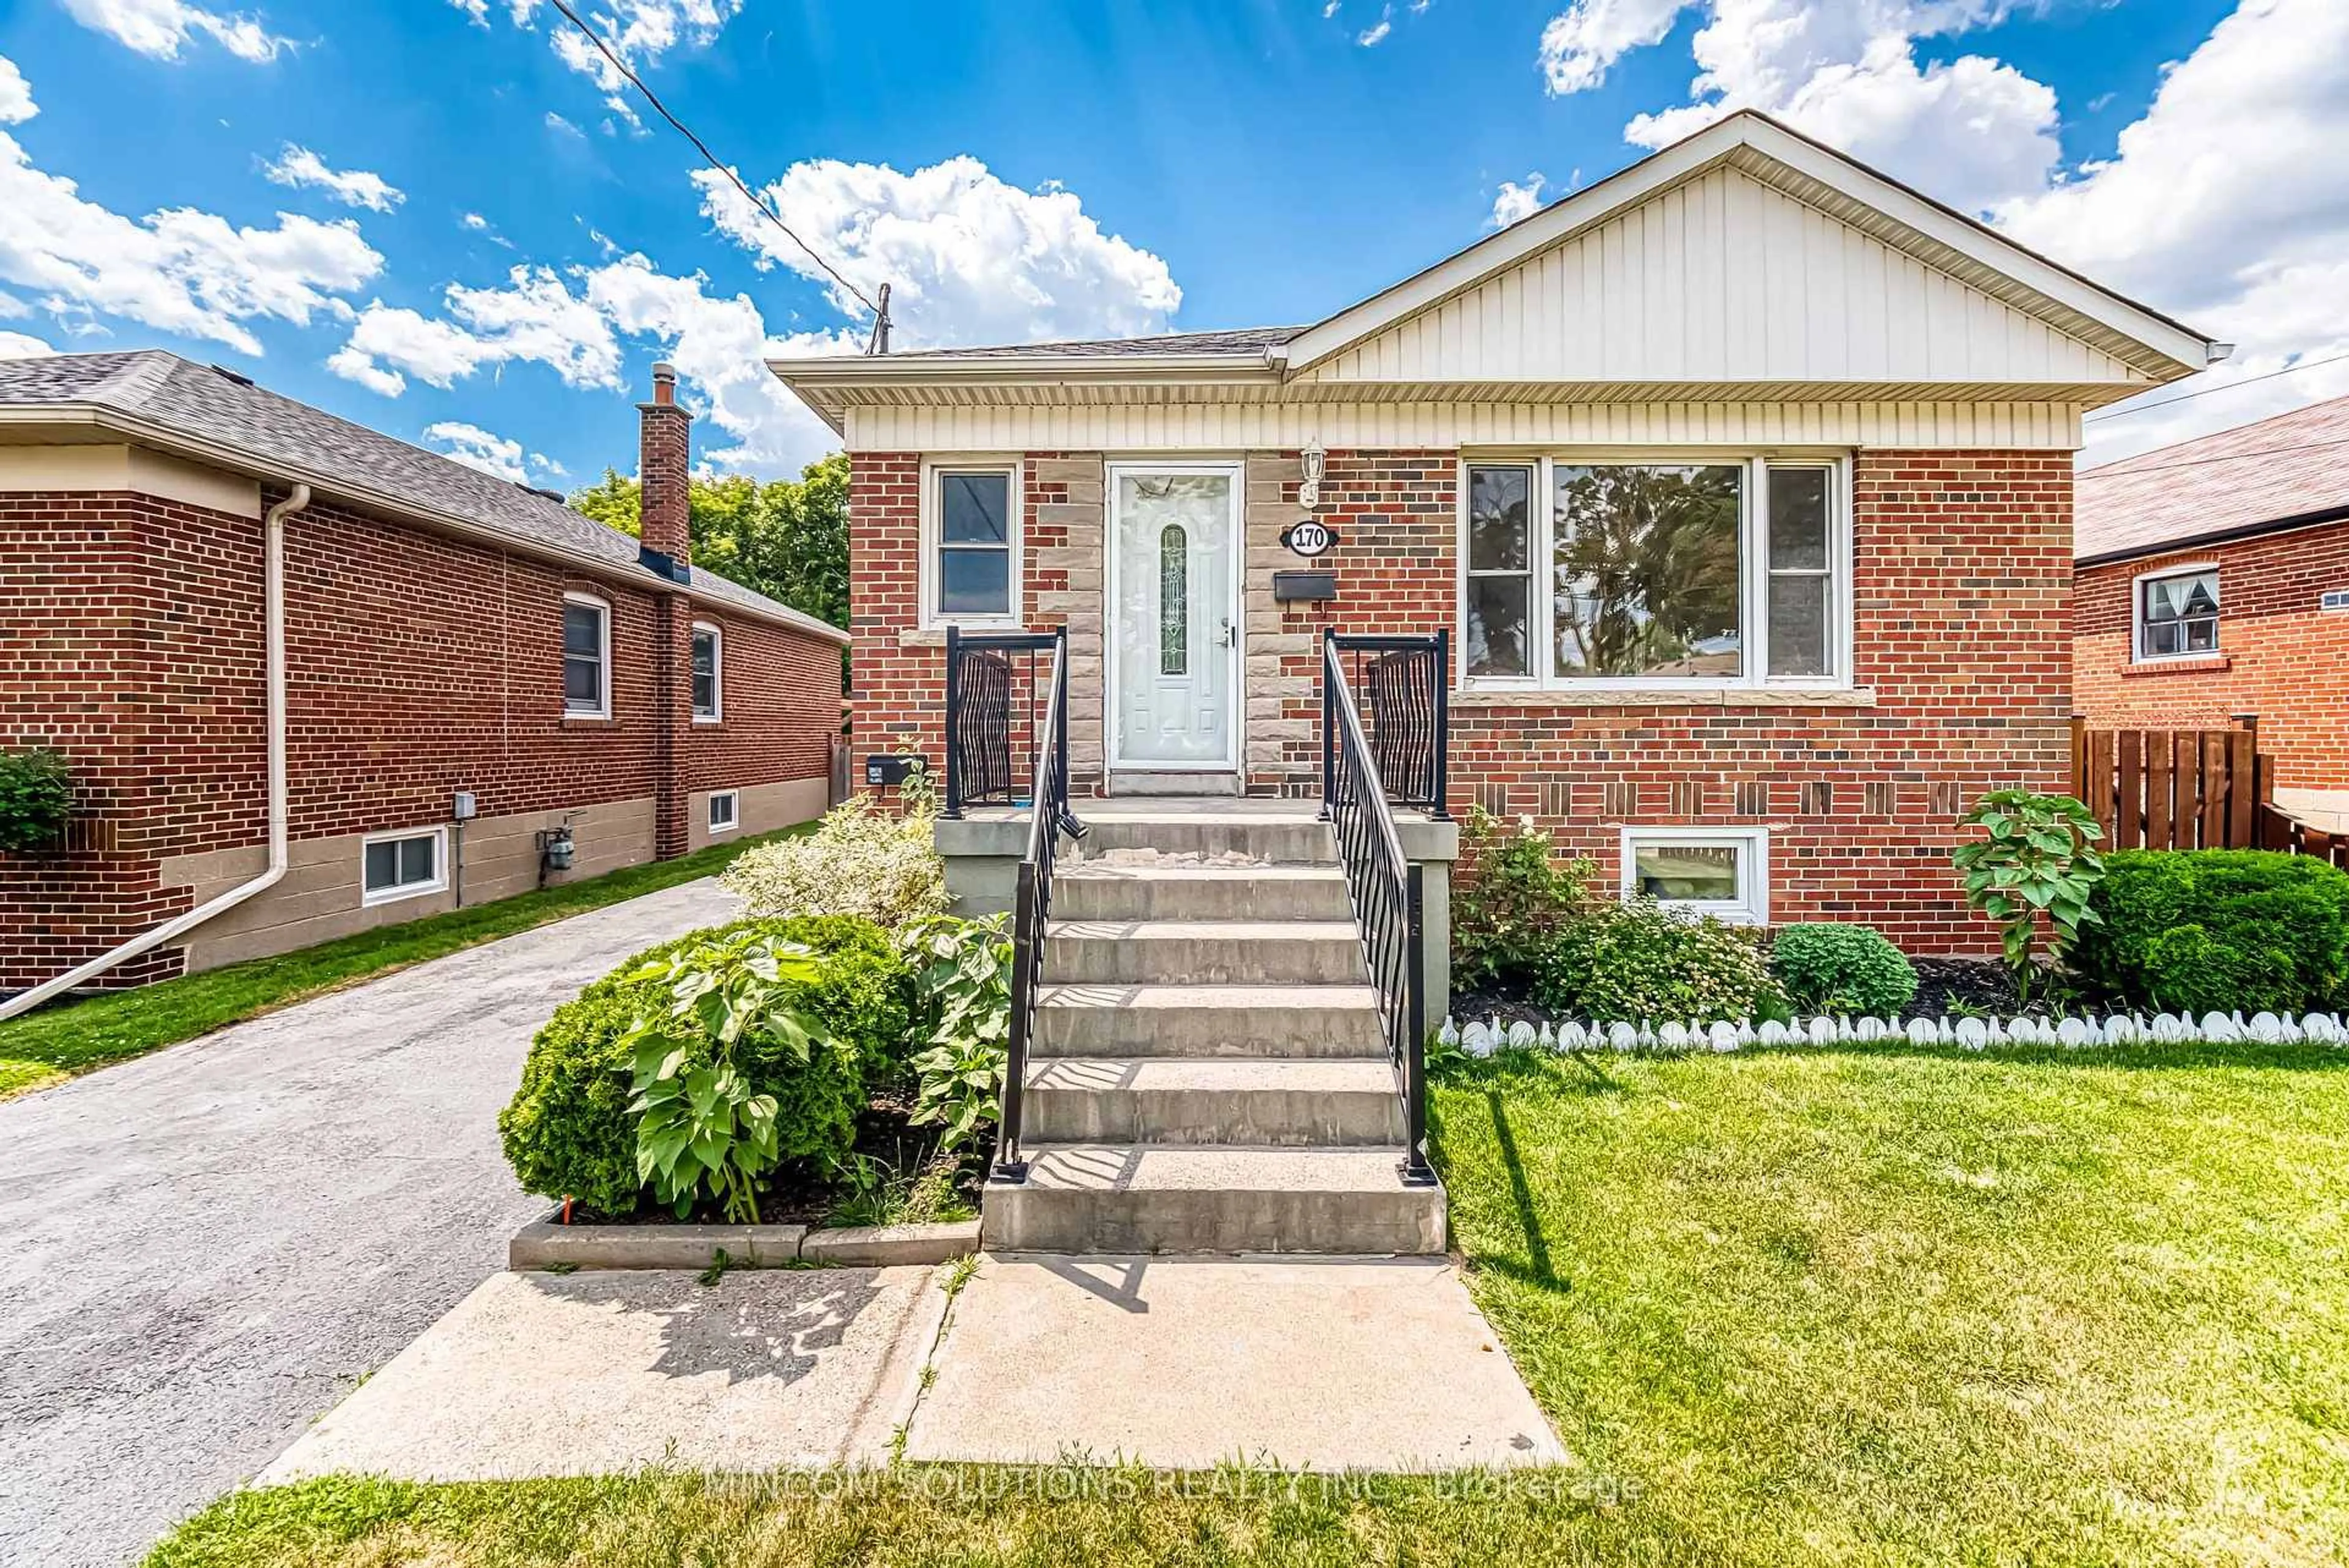
Market Data - Alderwood

Seller's Market

Detached house - for the past 30 days

Buyer's market Seller's market

Avg. Days on Market

Past 30 days

28 days

Compared to

2023

14 days

2022

6 days

2021

25 days

New Listings

Past 30 days

19 listings

Compared to

2023

19 listings

2022

13 listings

2021

5 listings

Units sold

Past 30 days

9 units

Compared to

2023

4 units

2022

3 units

2021

6 units

Median Sold Price

Past 30 days

$1,195,000

Compared to

2023

$1,162,500

2022

$1,075,000

2021

$1,596,350


Population and Demographics

Overview

Total population 13456
Average household income $147,066

Age (%)

35 to 49
23%
20 to 34
21%
50 to 64
21%
0 to 19
18%
65 and plus
16%

Household composition (%)

Single family
65%
Single person
29%
Multi person
5%
Multi family
1%

Mother tongue (%)

English
69%
Polish
5%
Italian
4%
Portuguese
4%
Others
3%
Tibetan
3%
Spanish
2%
Tagalog (Pilipino, Filipino)
2%
Ukrainian
2%
Russian
1%

House tenancy (%)

Owners
74%
Renters
26%

Schools and amenities

Estimated Budget