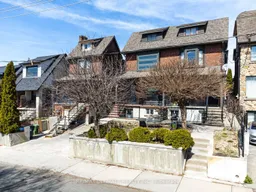
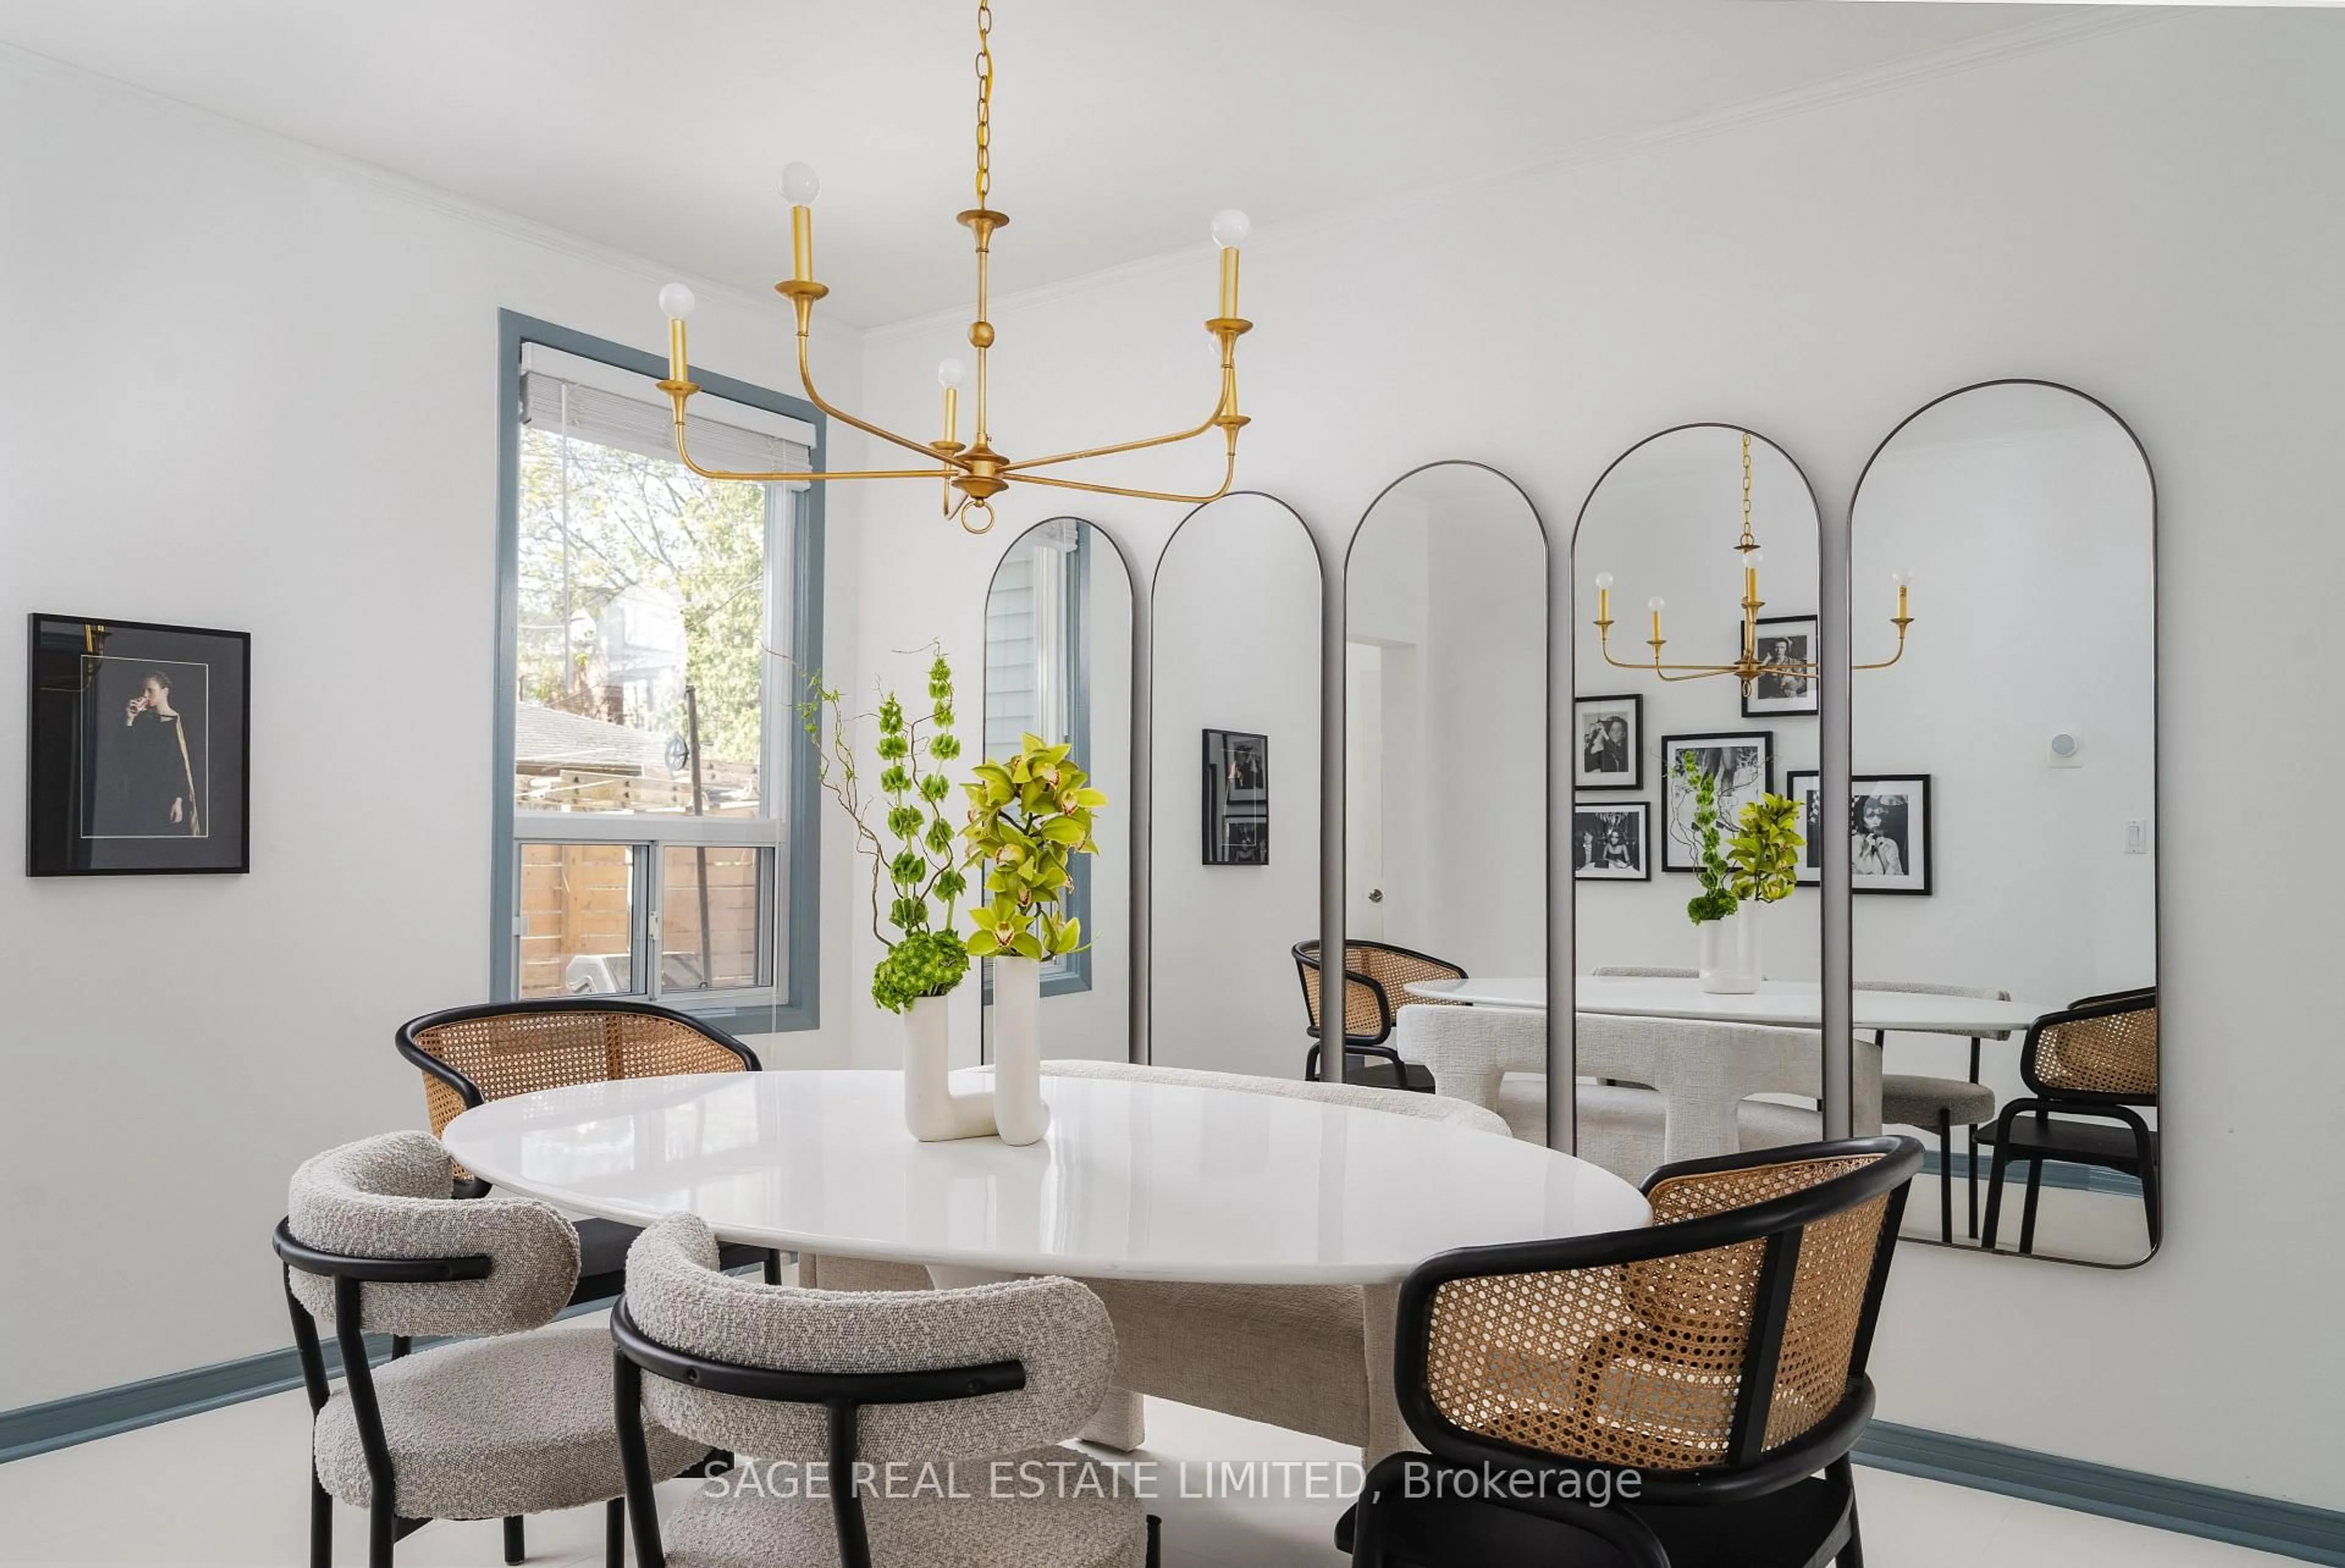
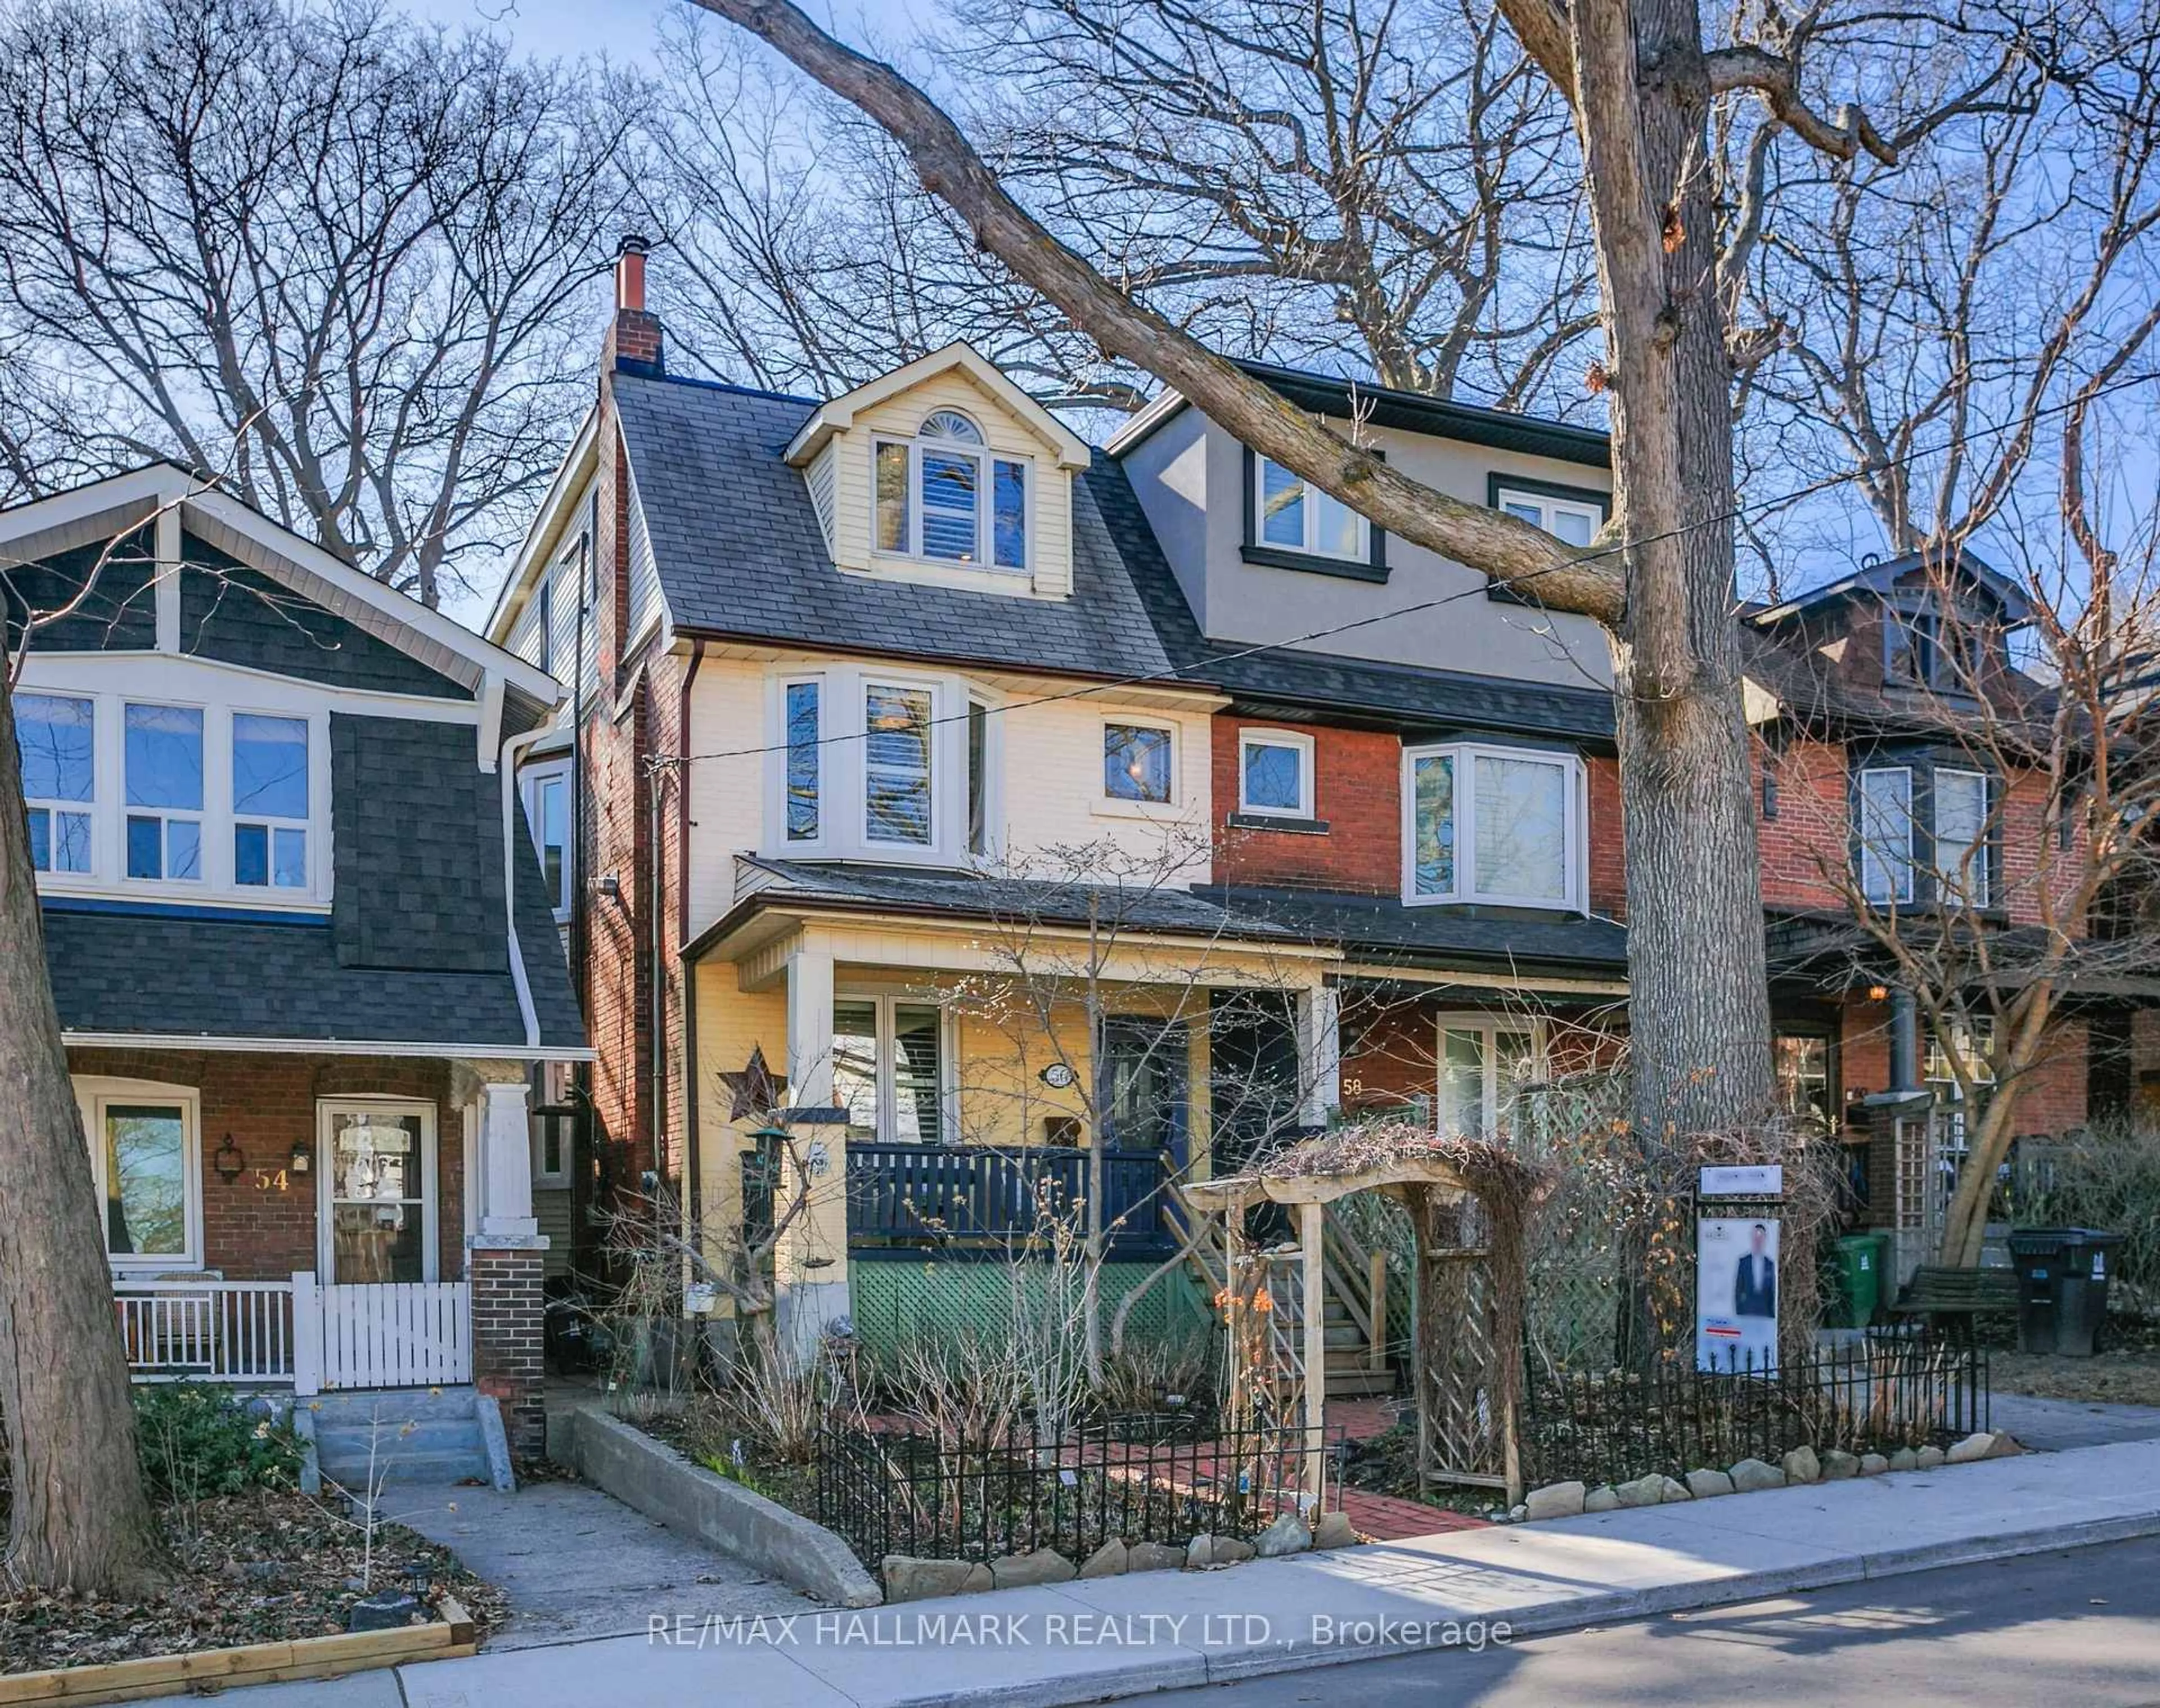
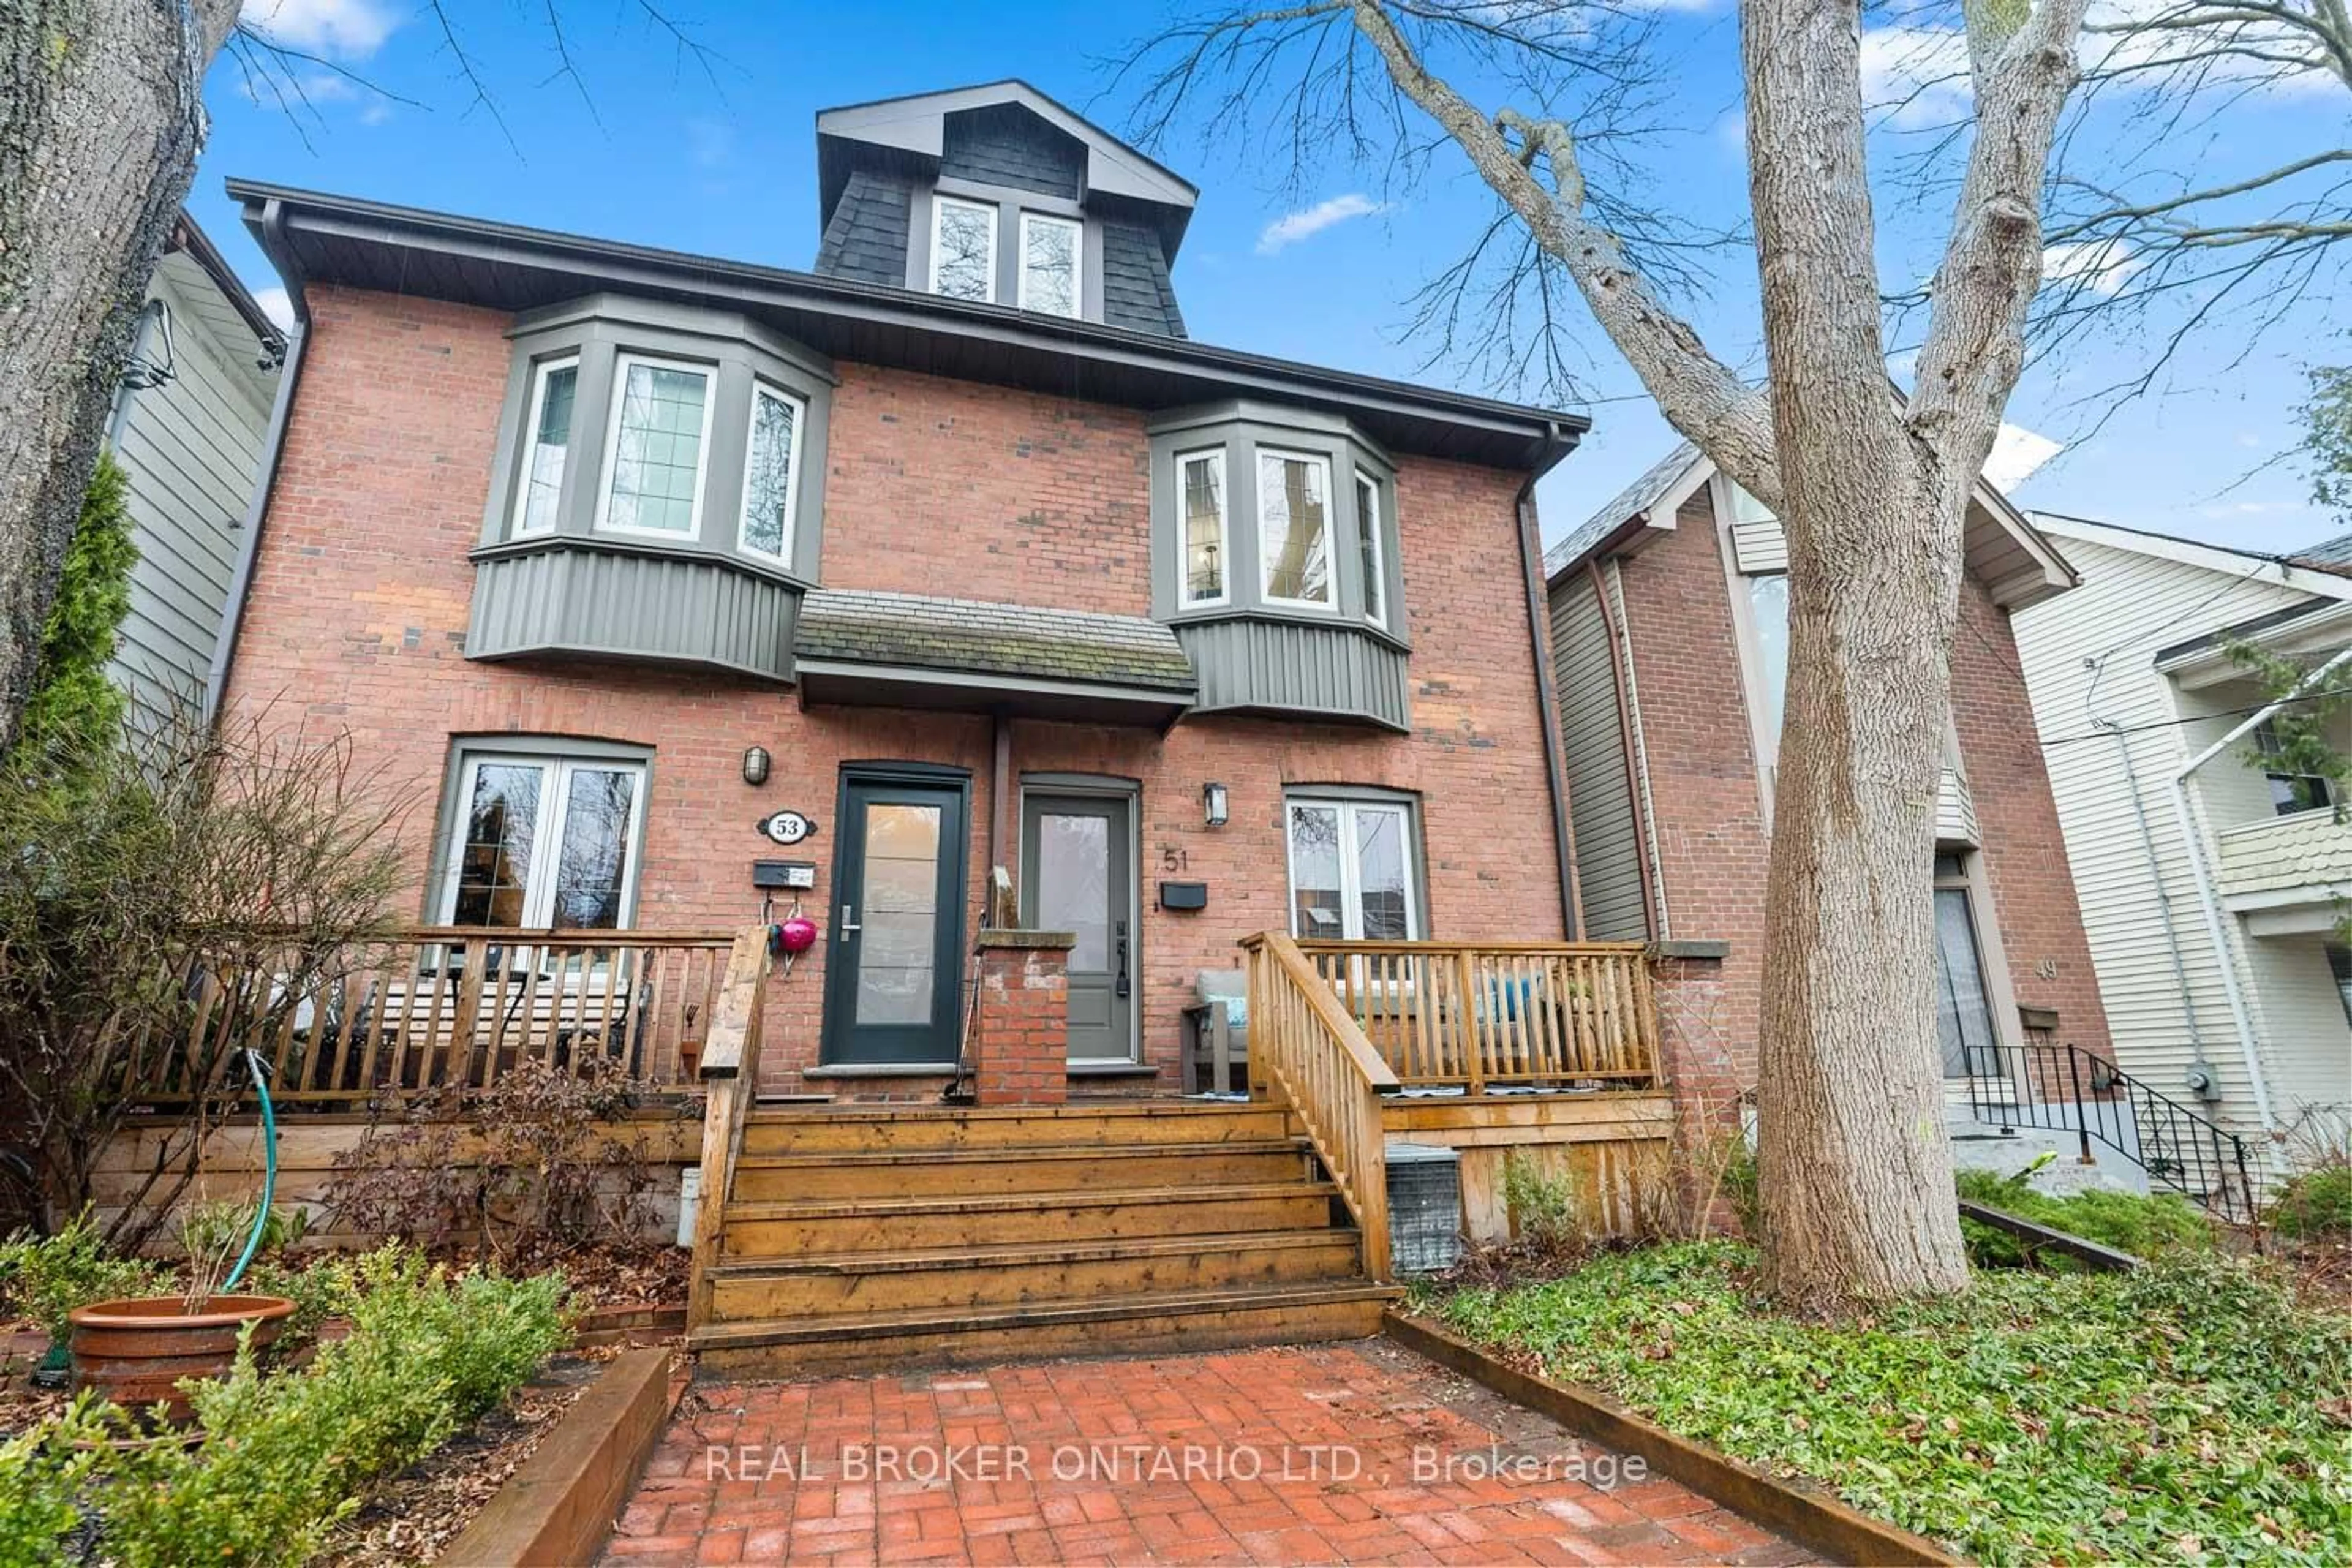
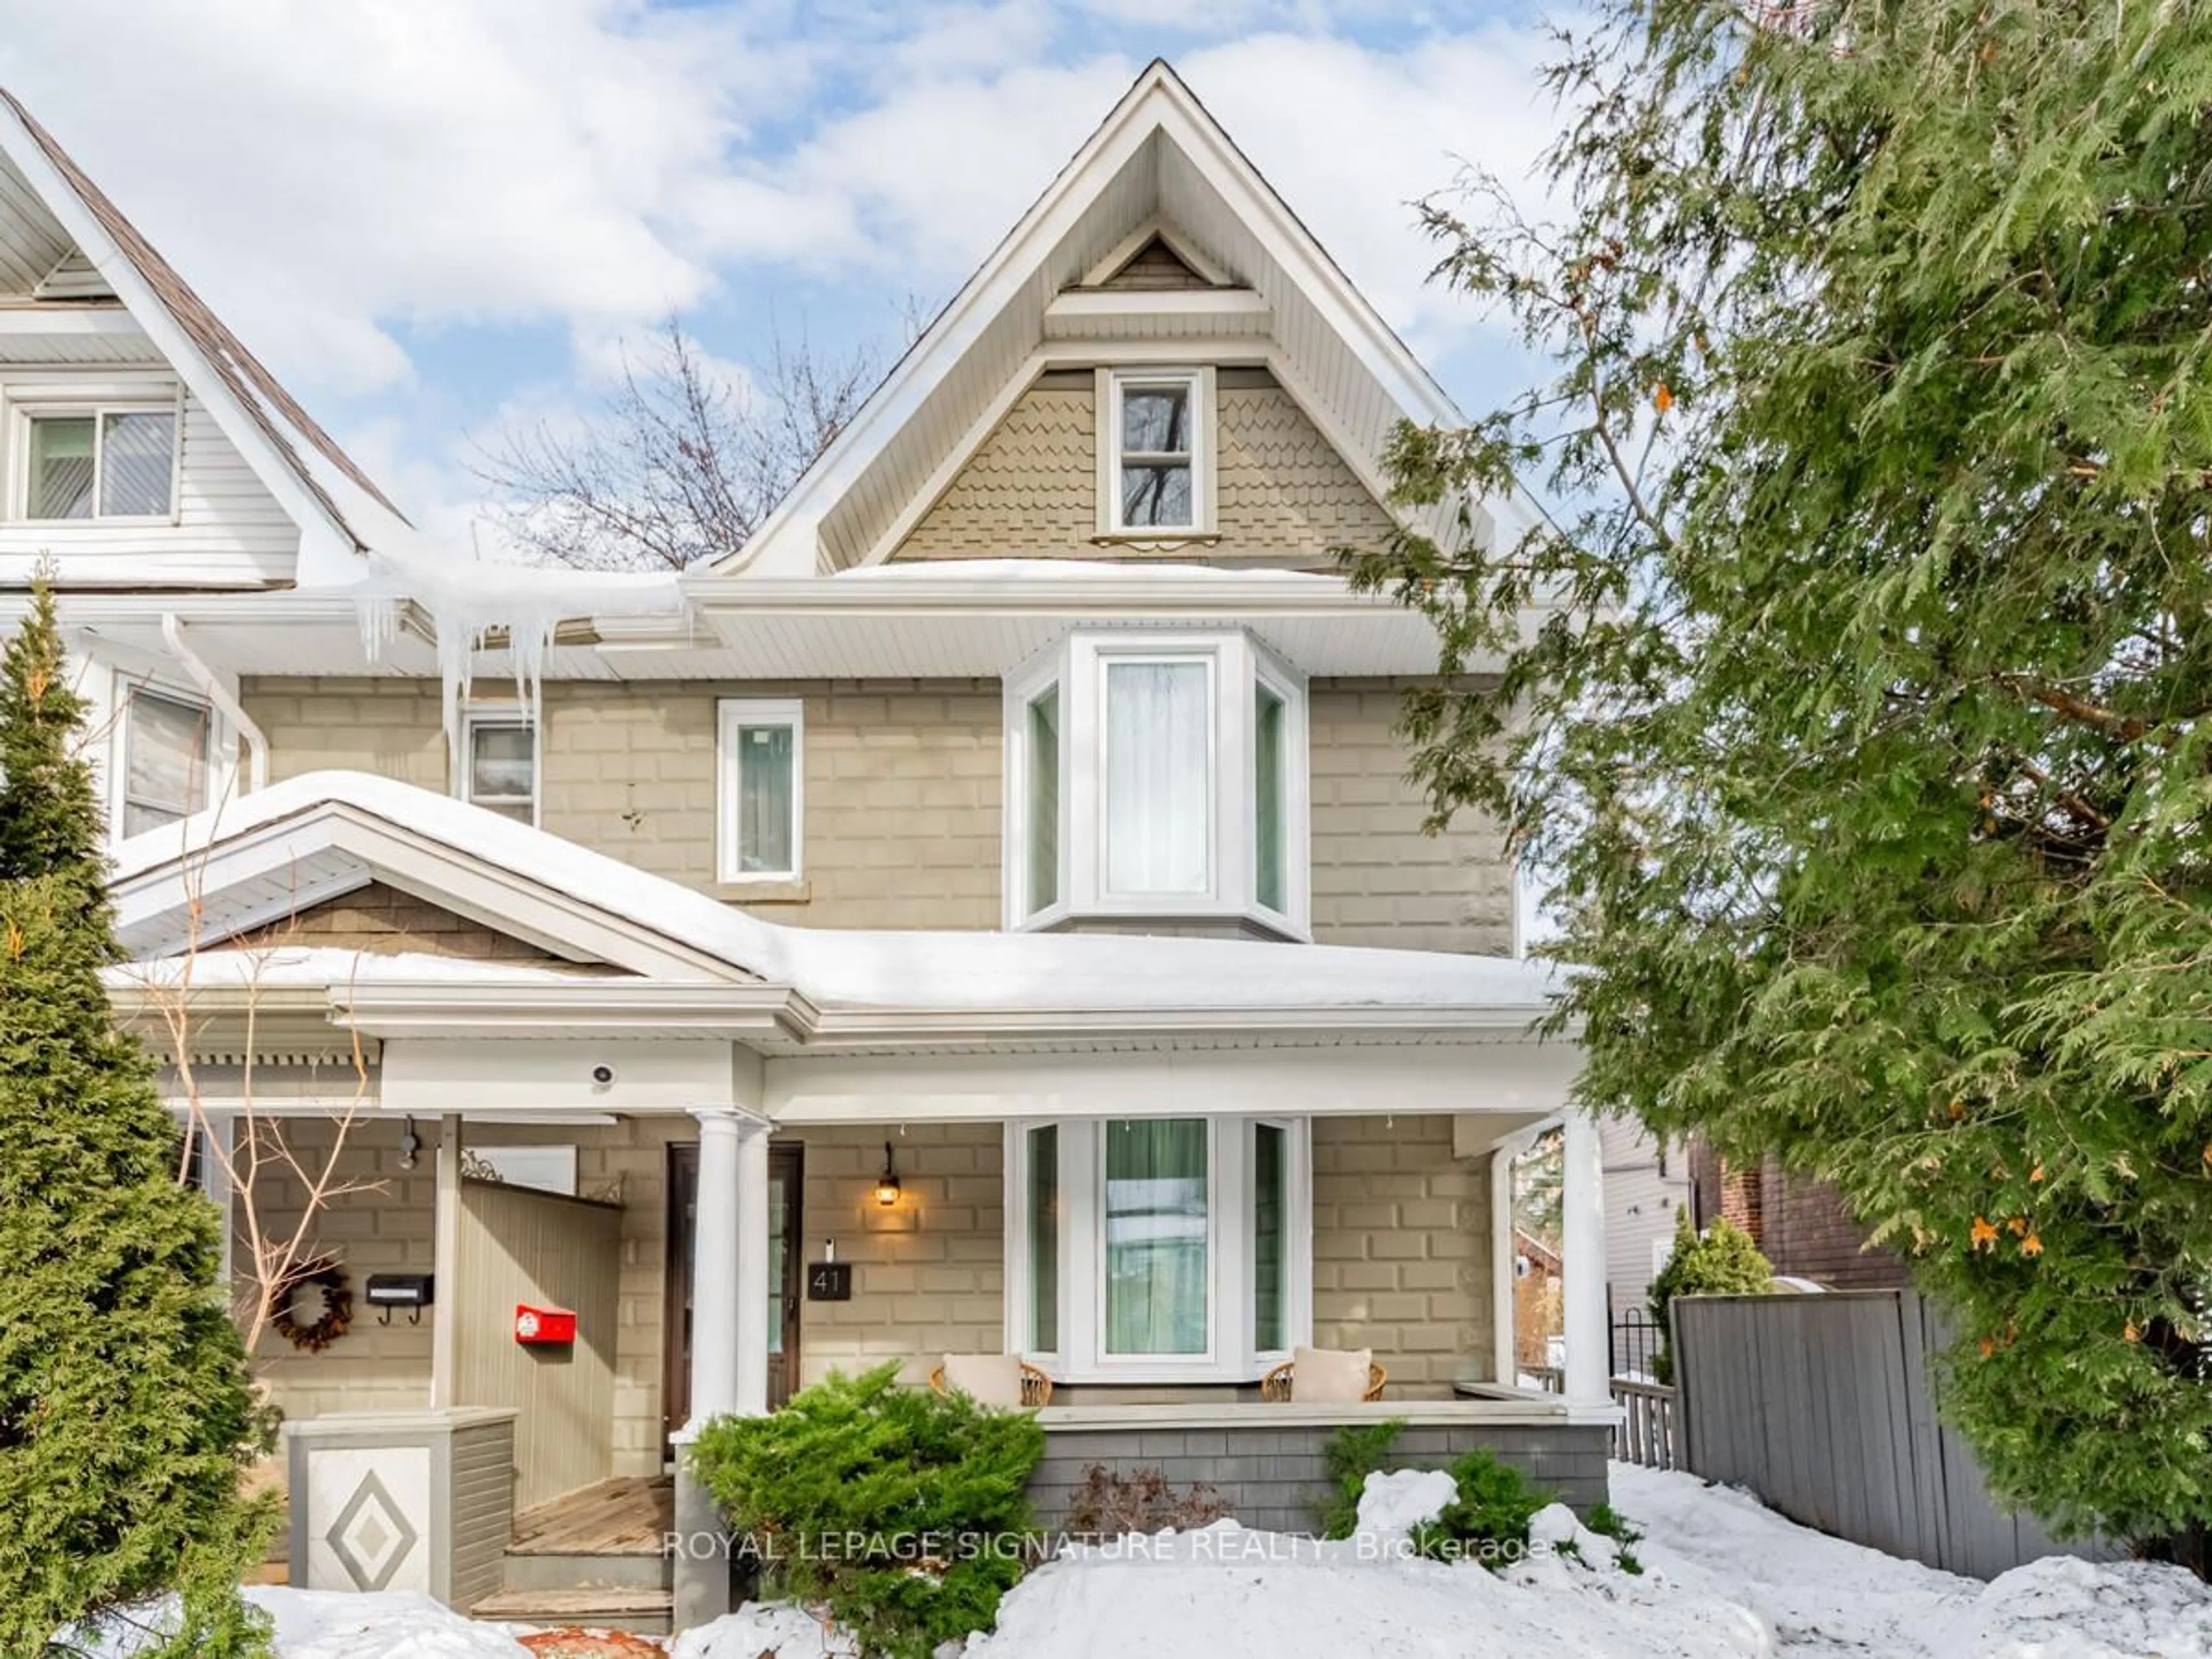
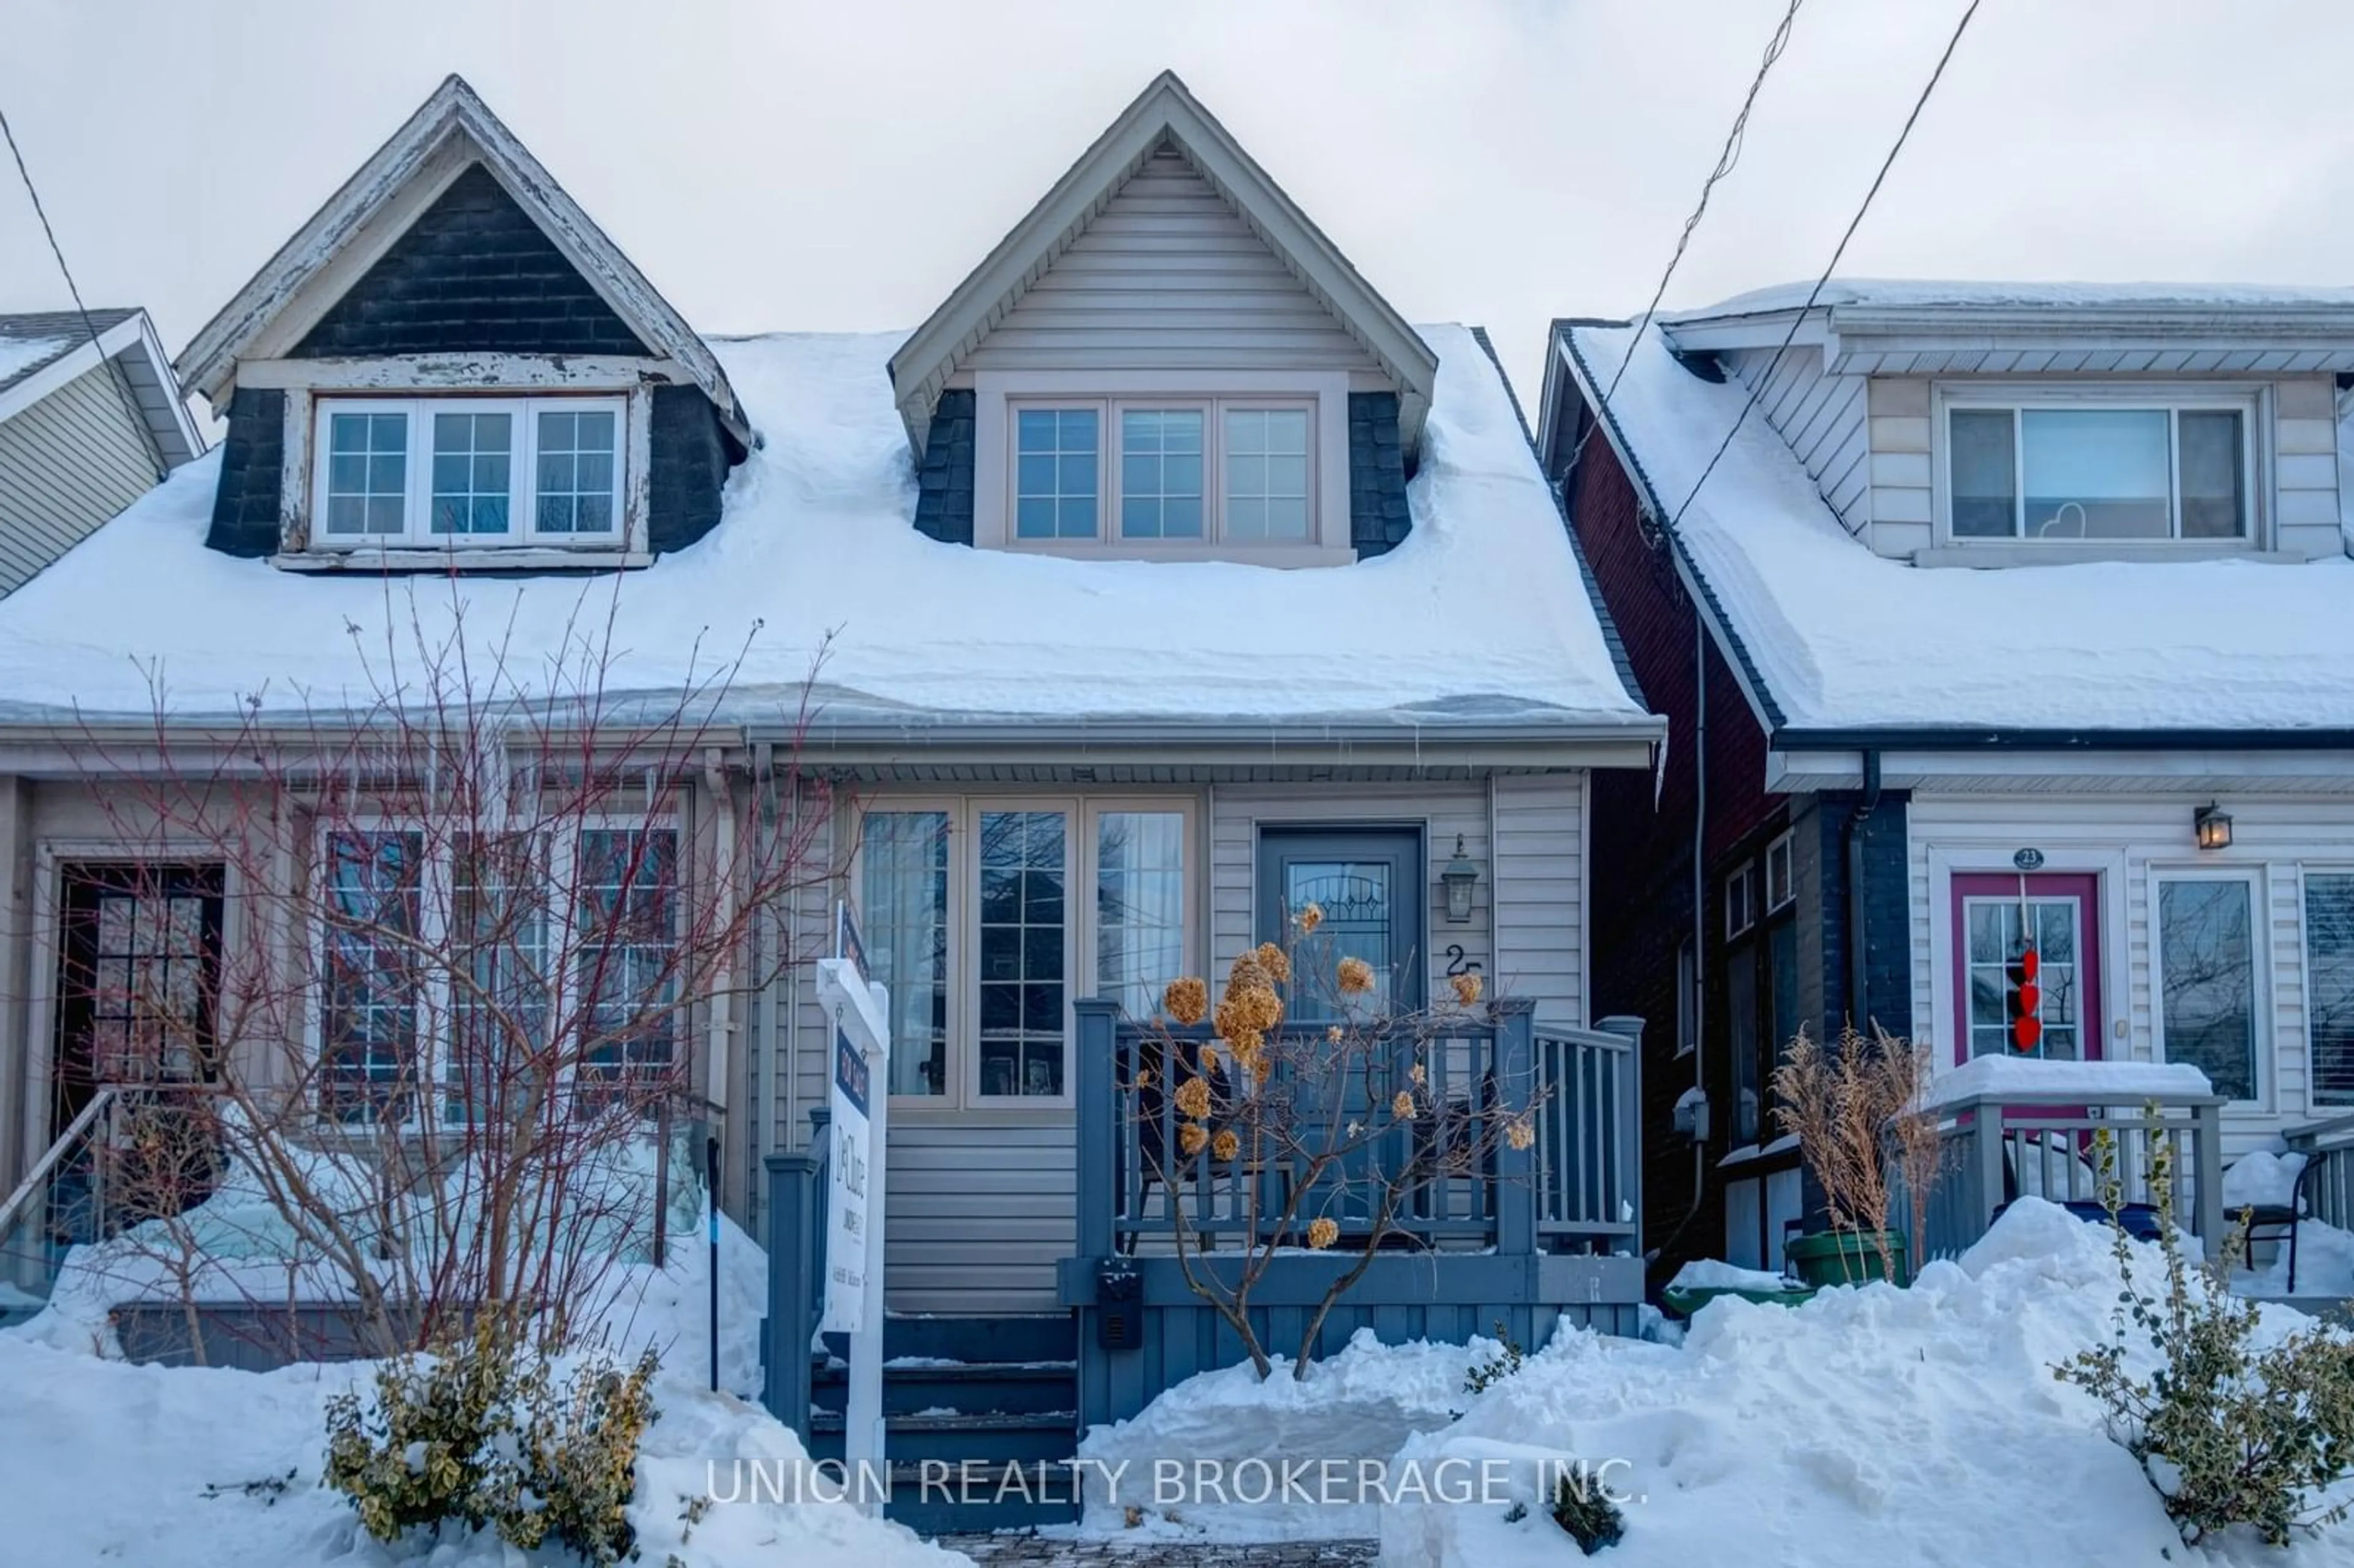
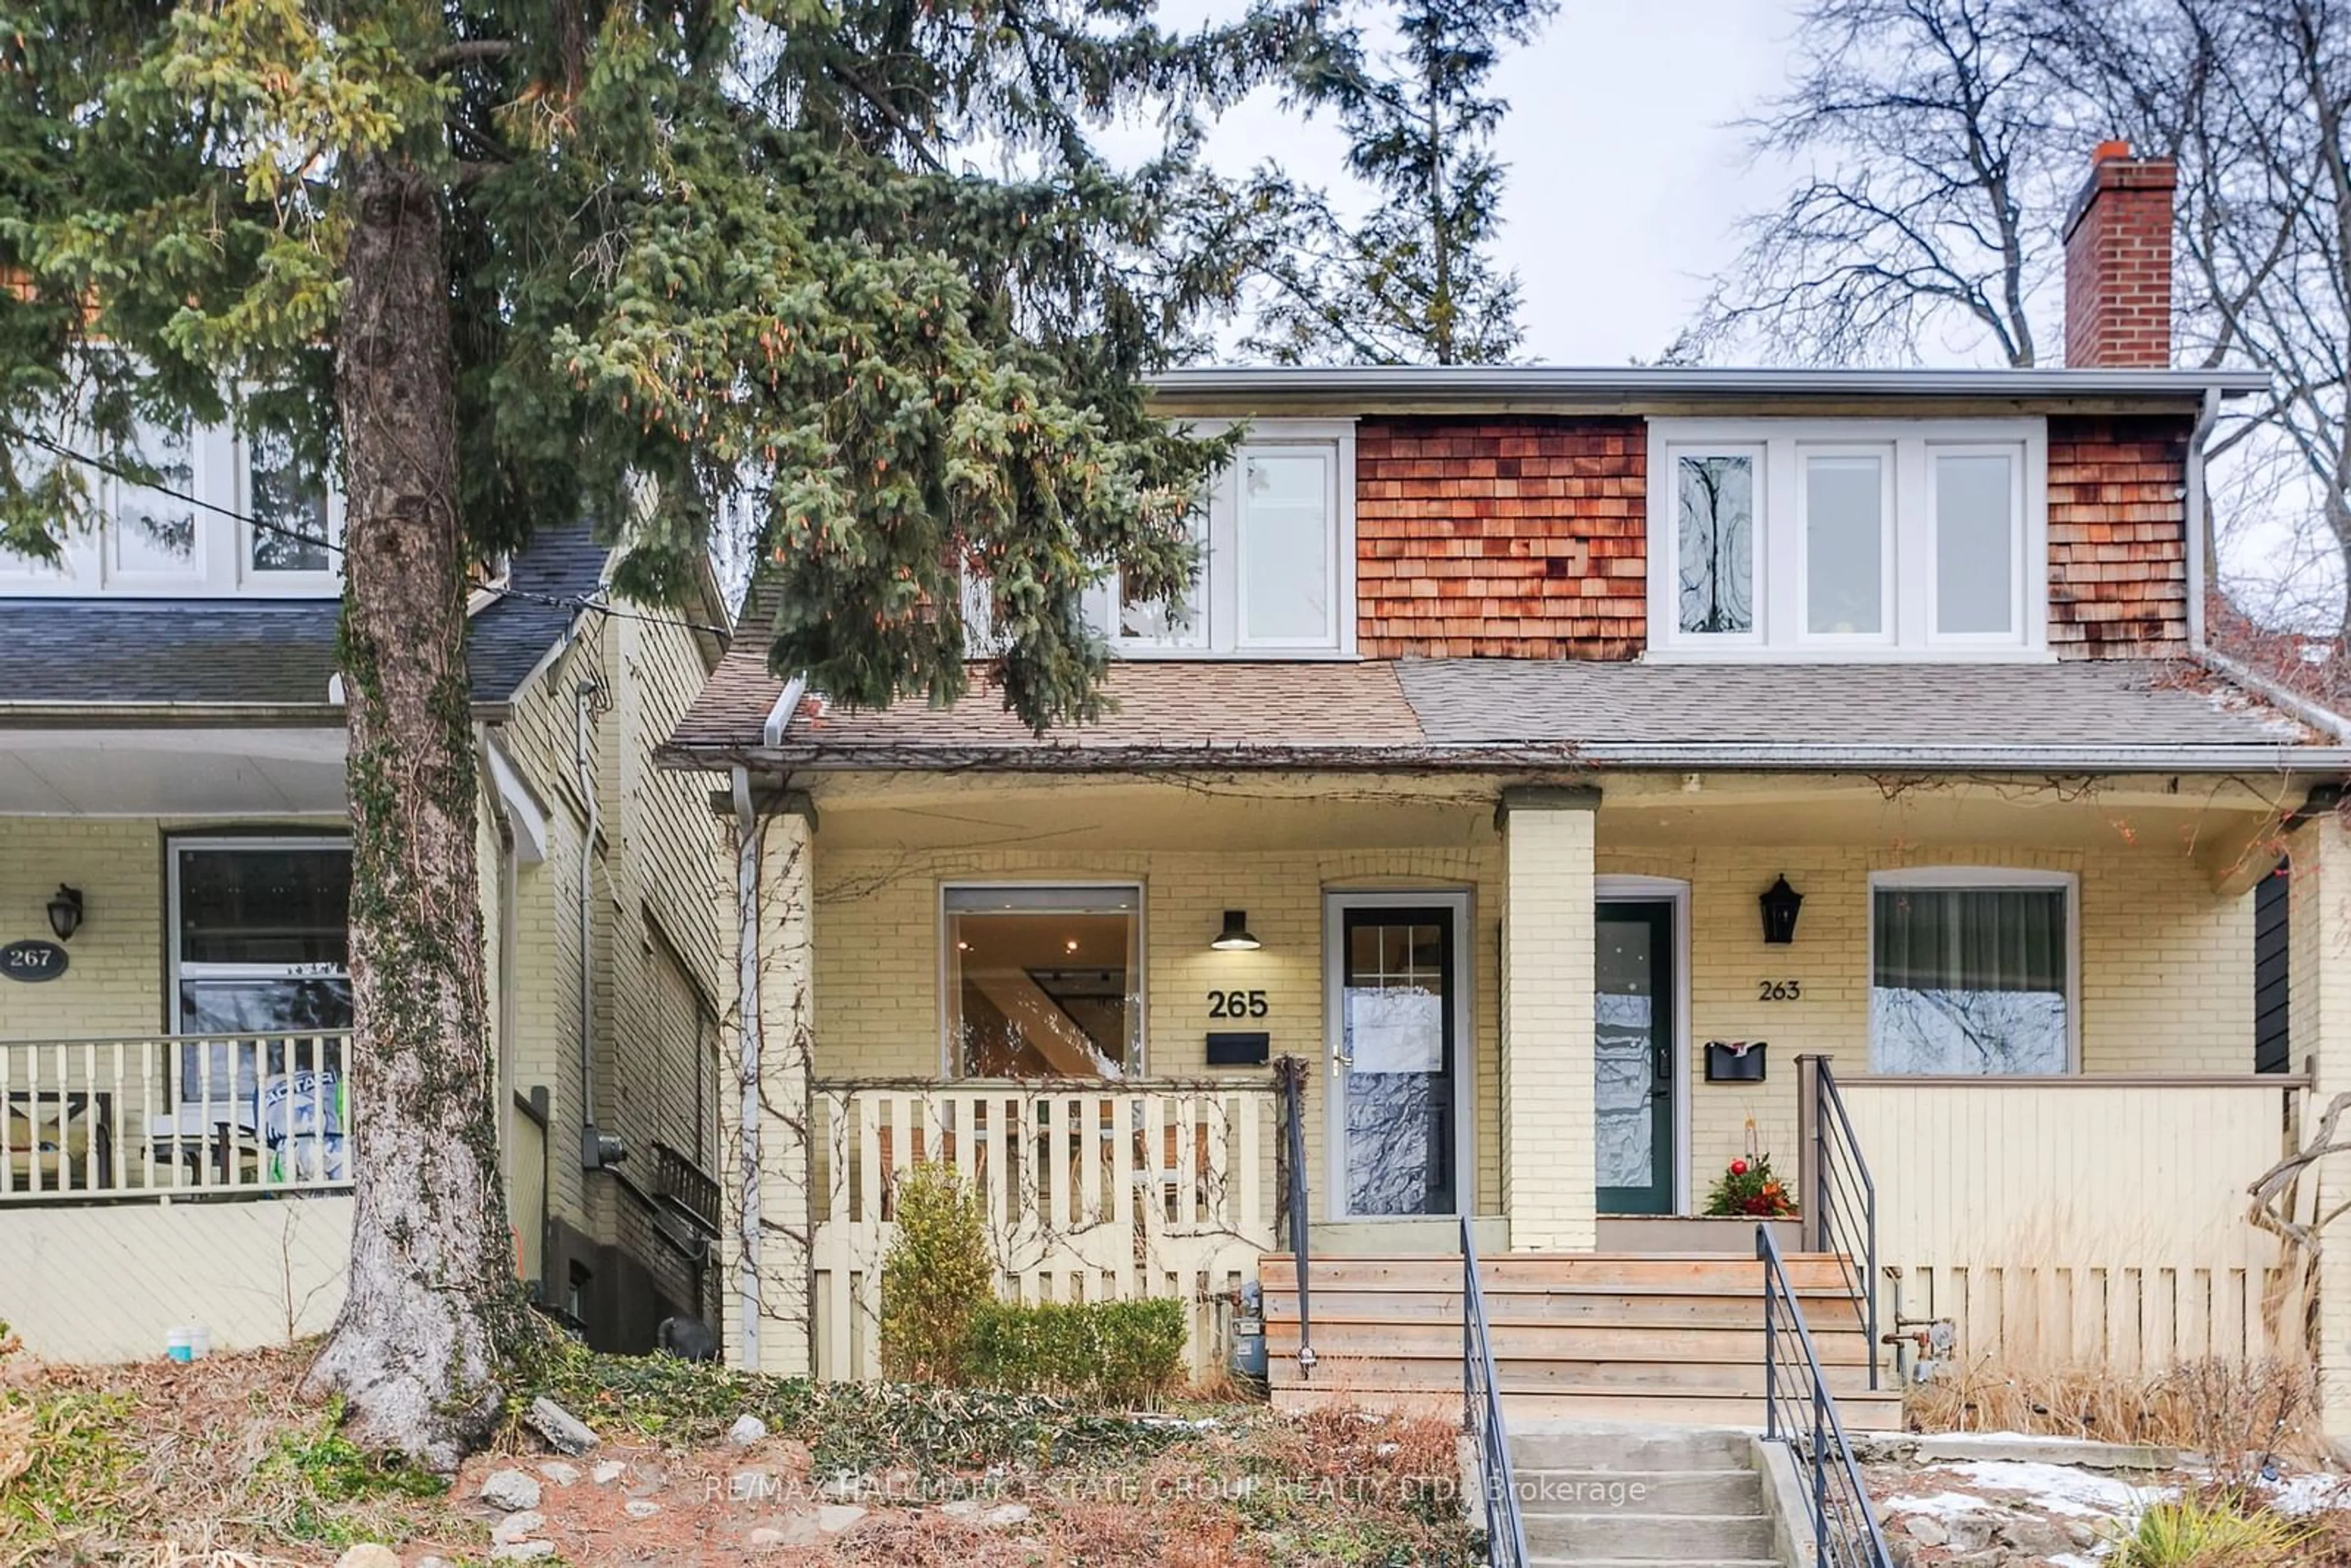
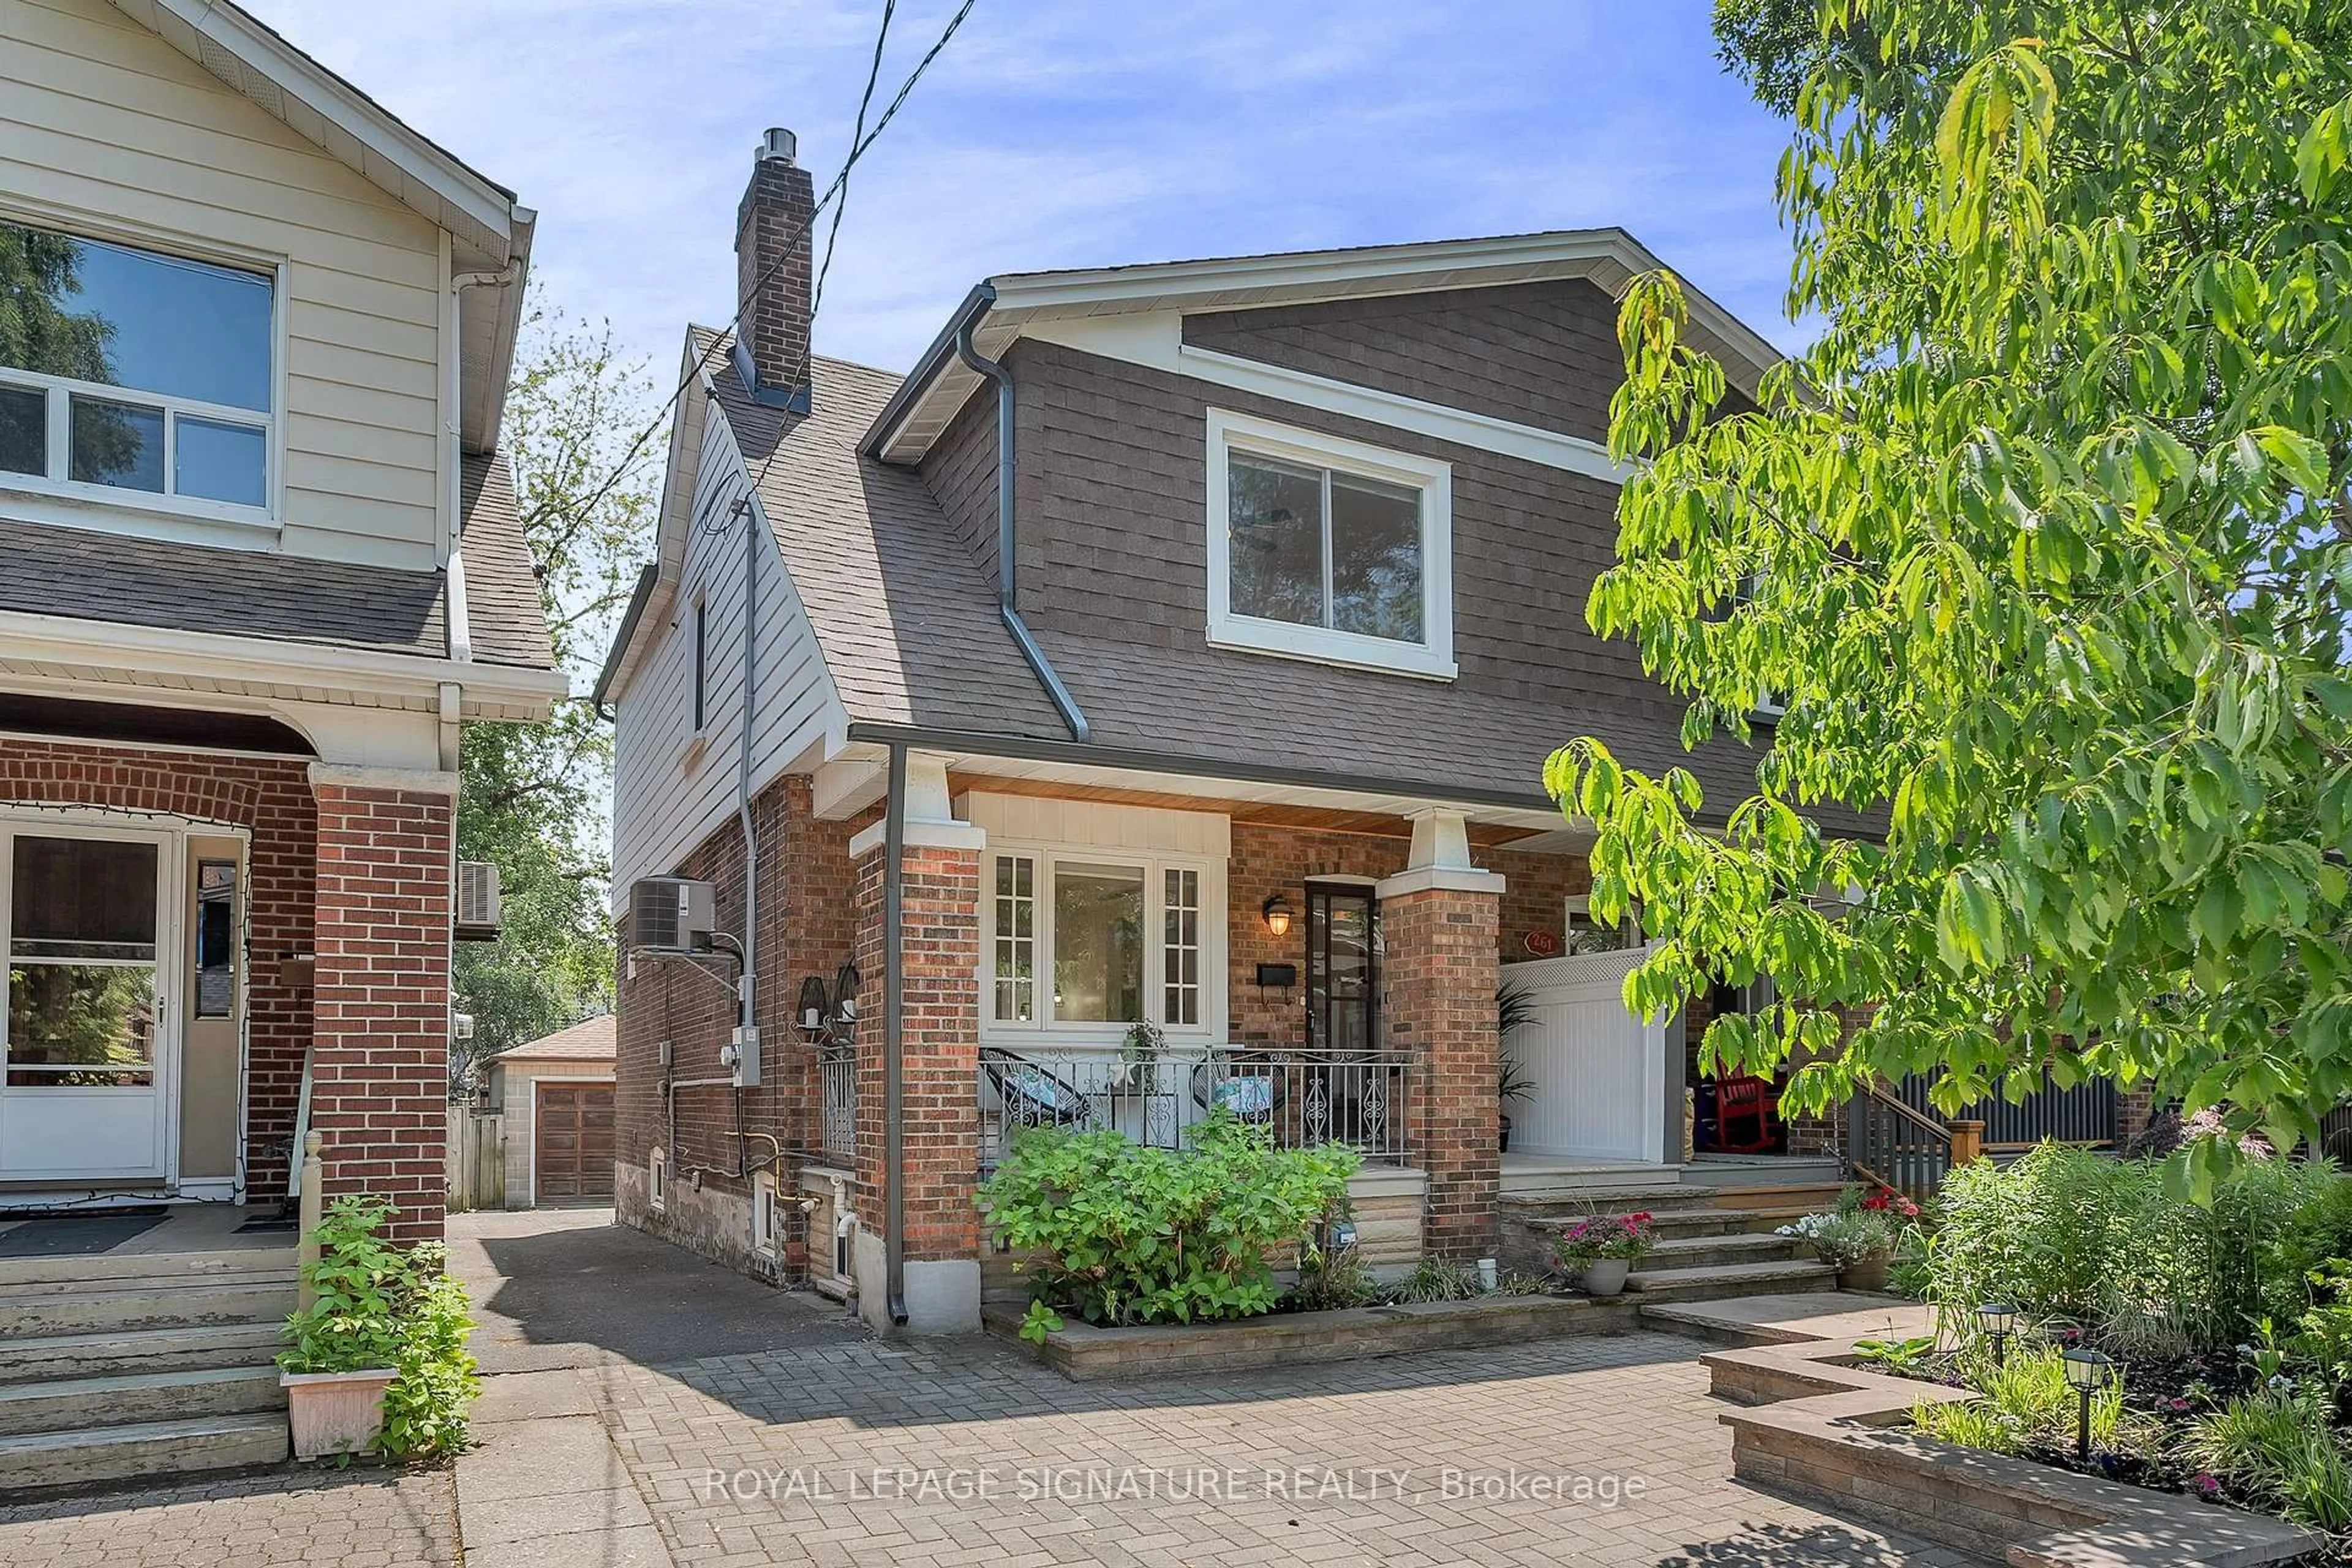
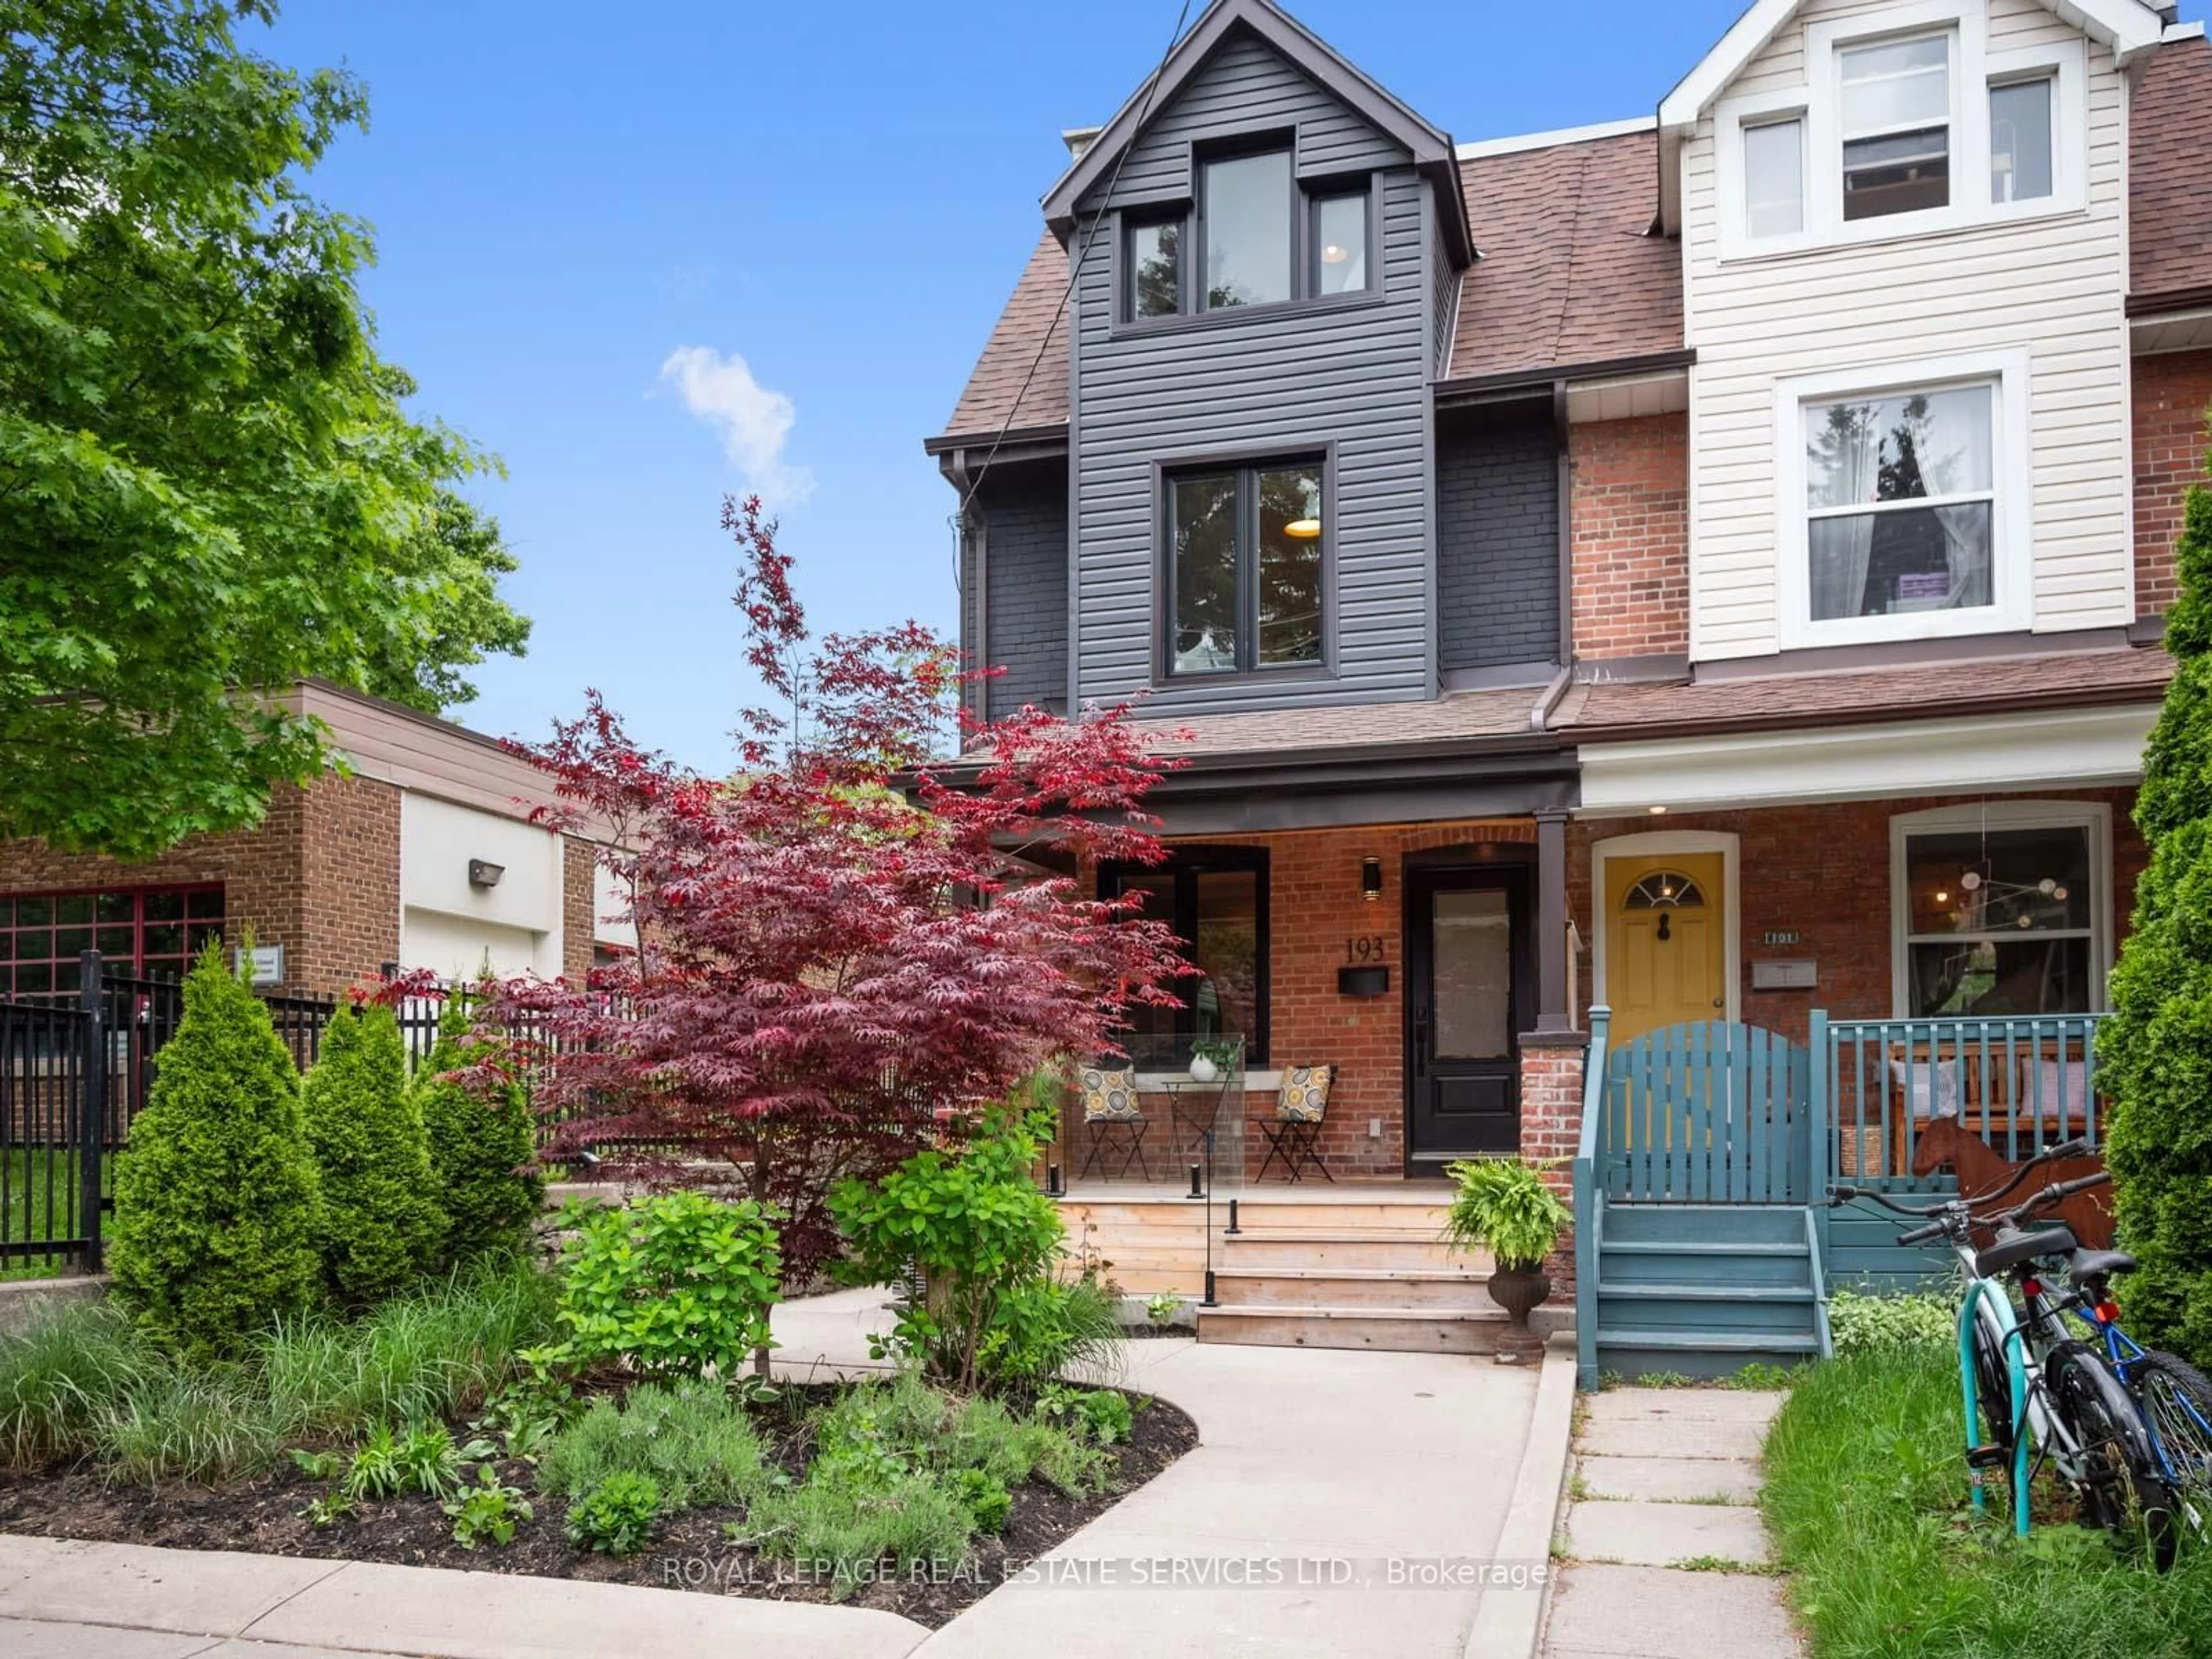
A pic from outside/outdoor area/front of a property/back of a property/a pic from drone, street for 176 Rosemount Ave, Toronto Ontario M6H 2M9
7 days on Market

176 Rosemount Ave, Toronto, Ontario M6H 2M9

Semi-Detached
3 + 1
3
- sqft
$1,089,000
Get pre-qualifiedPowered by Neo Mortgage
Buy with Wahi to get
Up to
$10,890Cashback
Semi-Detached
3 + 1
3
- sqft

Contact us about this property

Call

Highlights

Estimated ValueNot available

Price/Sqft-

Est. Mortgage$4,677/mo

Tax Amount (2024)$4,736/yr

Days On Market7 days


Description

Triplex in the Corso Italia / Regal Heights area of Toronto. This semi-detached is set up as 3 residential units. The three units are currently tenanted. December 2024 New Furnace , 2 car garage. Each unit is a good size. On-site shared coin-operated laundry facilities. Direct access to the park across the street.


Property Details

Style2 1/2 Storey
View-
Age of property-
SqFt-
Lot Size2,120 SqFt(120 x 17.67)
Parking Spaces4
MLS ®NumberW11898719
Community NameSt. Clair West
Data SourceTRREB
Listing byRE/MAX PROFESSIONALS INC.

Features

Heating: Forced Air
Cooling: Central Air
Basement: Apartment, Finished

Bsmt Floor

Br

3.90 x 2.80

Ceramic Floor / Window / Closet

Kitchen

4.70 x 4.10

Ceramic Floor / Centre Island / Open Concept

Living

4.20 x 2.70

Ceramic Floor / Open Concept / Window


Features

Lot size: 2,120 SqFt

Parking

Garage spaces 2

Garage type Detached

Other parking spaces 2

Total parking spaces 4


Property listed by RE/MAX PROFESSIONALS INC., Brokerage

Get up to 1% cashback when you buy your dream home with Wahi Cashback

Cashback Banner Image

A new way to buy a home that puts cash back in your pocket.

  • Our in-house Realtors do more deals and bring that negotiating power into your corner
  • We leverage technology to get you more insights, move faster and simplify the process
  • Our digital business model means we pass the savings onto you, with up to 1% cashback on the purchase of your home

Market Data - St. Clair West

Balanced Market

Semi-Detached house - for the past 30 days

Buyer's market Seller's market

Avg. Days on Market

Past 30 days

42 days

Compared to

2023

37 days

2022

31 days

2021

5 days

New Listings

Past 30 days

12 listings

Compared to

2023

3 listings

2022

5 listings

2021

2 listings

Units sold

Past 30 days

3 units

Compared to

2023

5 units

2022

1 unit

2021

3 units

Median Sold Price

Past 30 days

$870,000

Compared to

2023

$1,000,000

2022

$640,000

2021

$1,165,000


Population and Demographics

Overview

Total population 19772
Average household income $133,834

Age (%)

35 to 49
24%
20 to 34
22%
50 to 64
20%
0 to 19
18%
65 and plus
16%

Household composition (%)

Single family
64%
Single person
27%
Multi person
7%
Multi family
1%

Mother tongue (%)

English
56%
Portuguese
17%
Italian
8%
Spanish
7%
Yue (Cantonese)
2%
Tagalog (Pilipino, Filipino)
1%
Others
1%
French
1%
Vietnamese
1%

House tenancy (%)

Owners
62%
Renters
38%

Schools and amenities

Estimated Budget