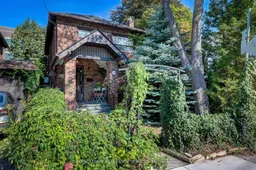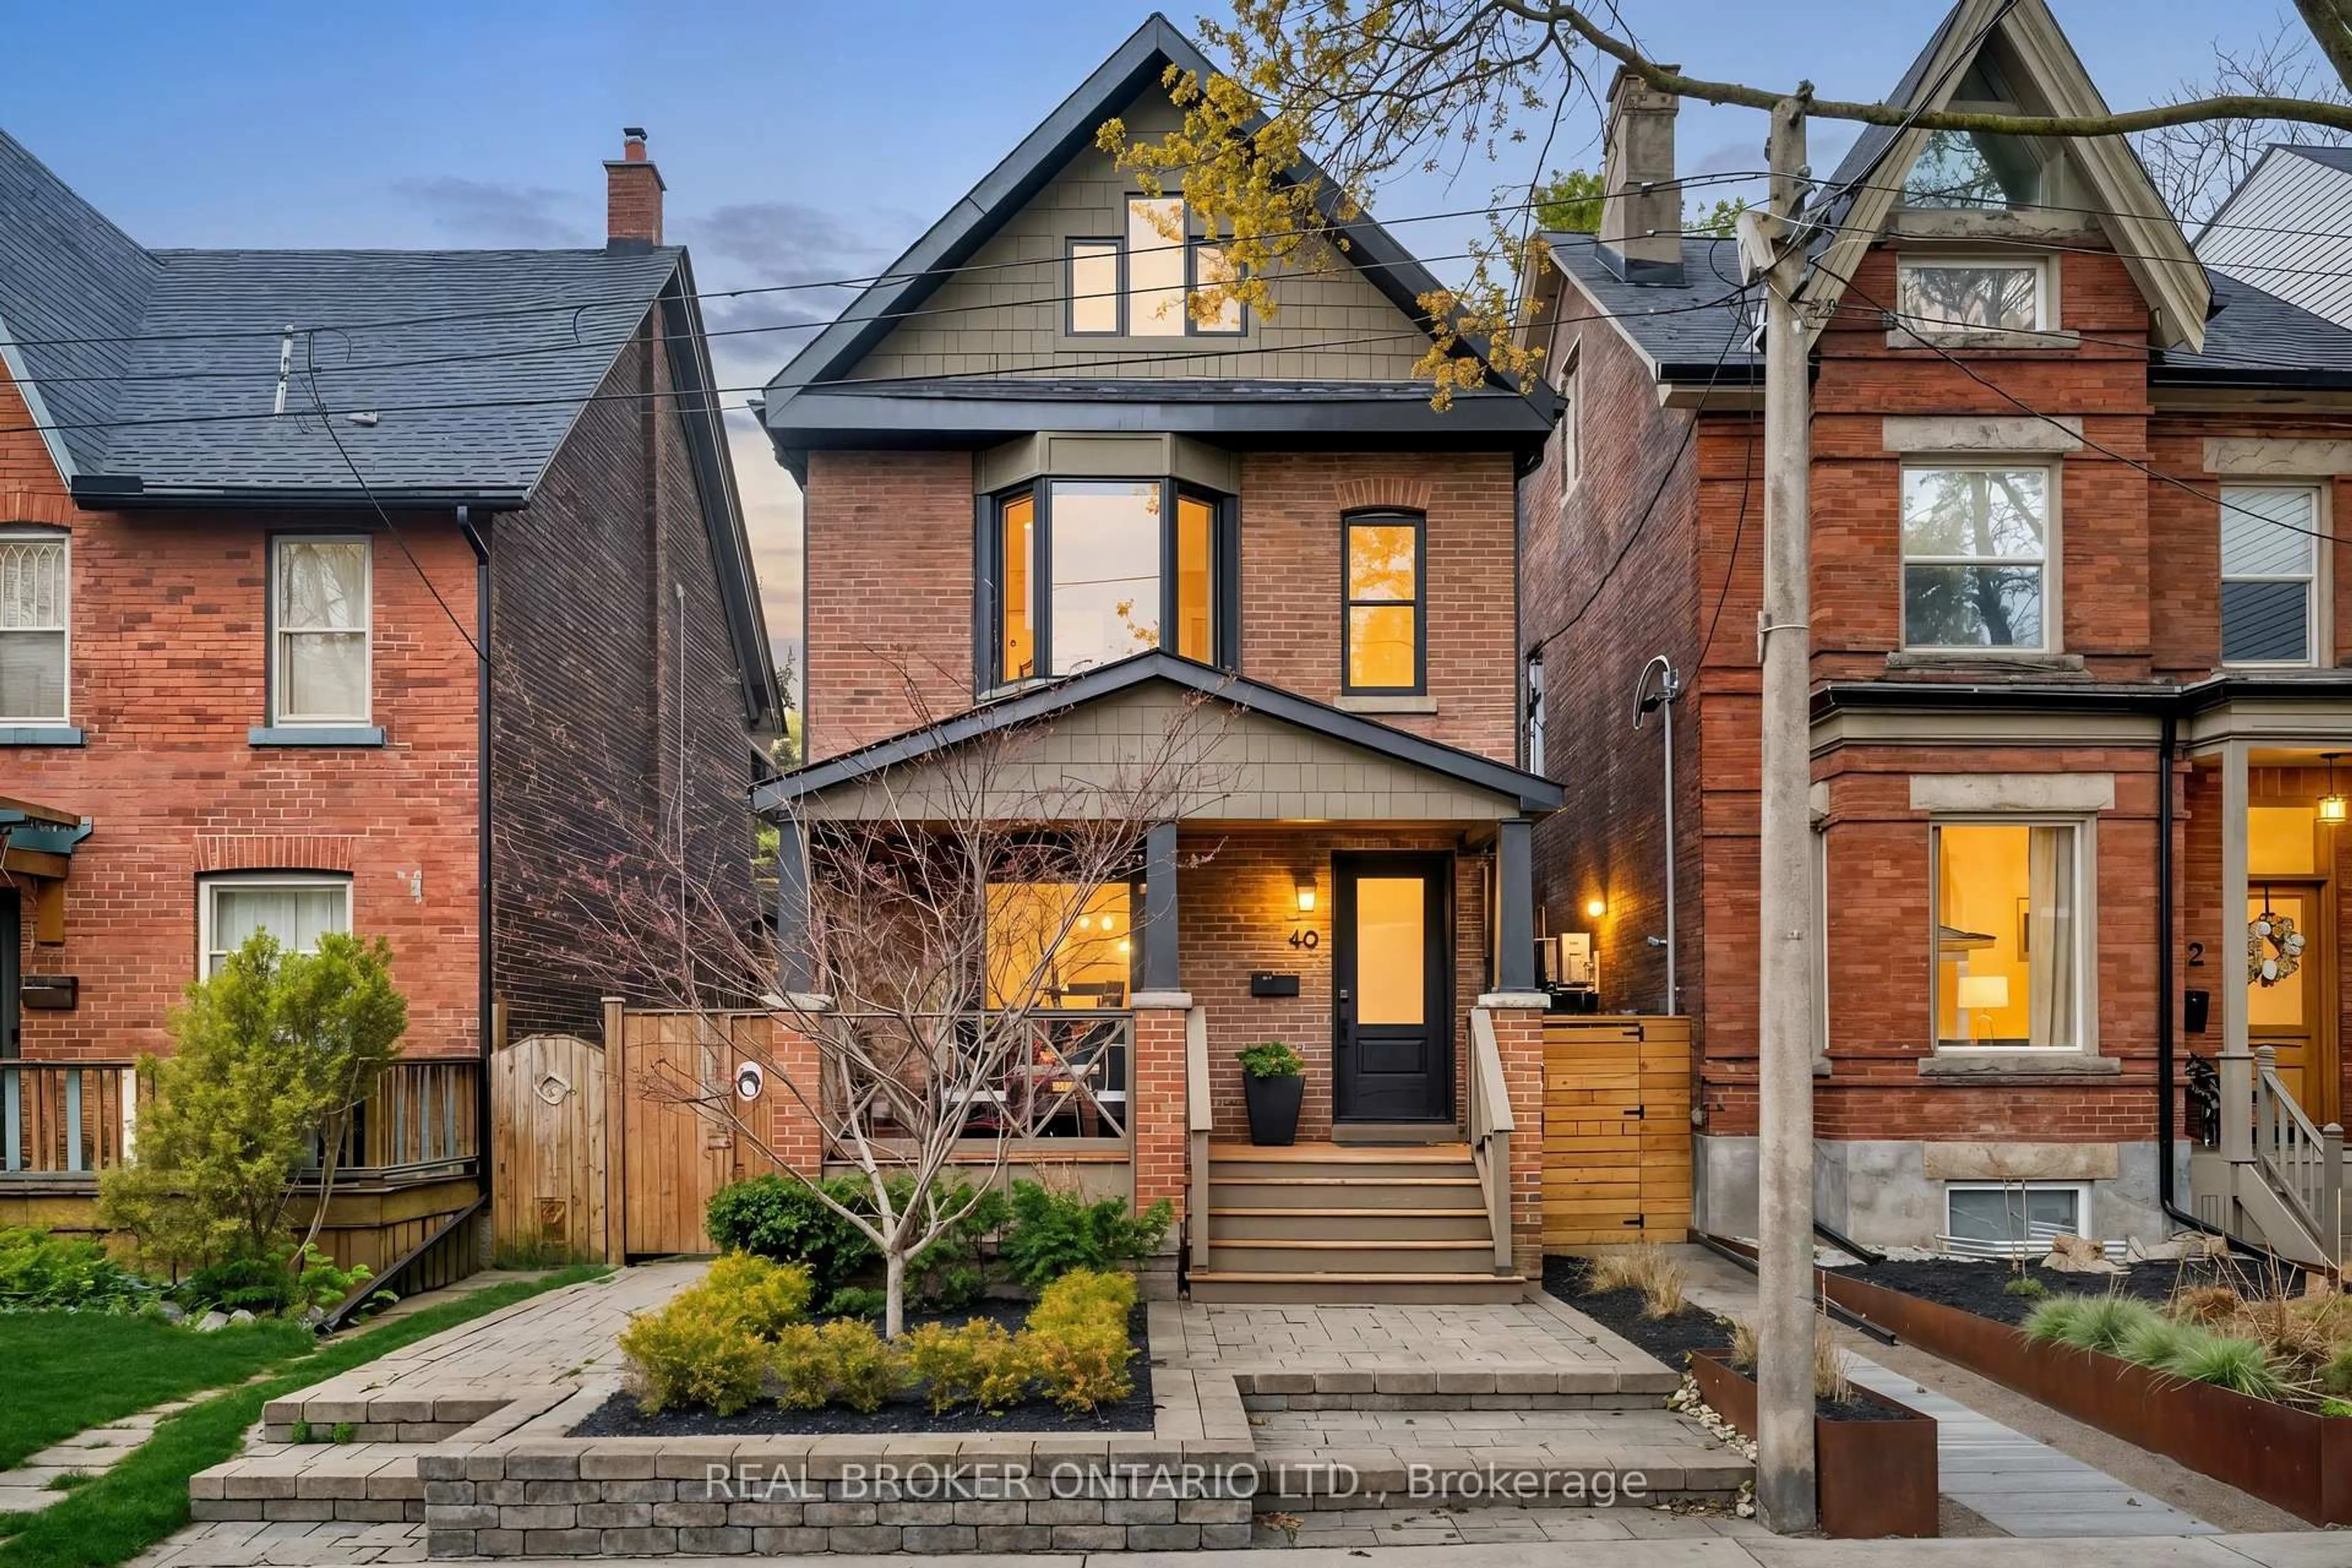
21 Lorindale Ave, Toronto, Ontario M5M 3C3
Contact us about this property
Highlights
Estimated valueThis is the price Wahi expects this property to sell for.
The calculation is powered by our Instant Home Value Estimate, which uses current market and property price trends to estimate your home’s value with a 90% accuracy rate.Not available
Price/Sqft$1,331/sqft
Monthly cost
Open Calculator
Description
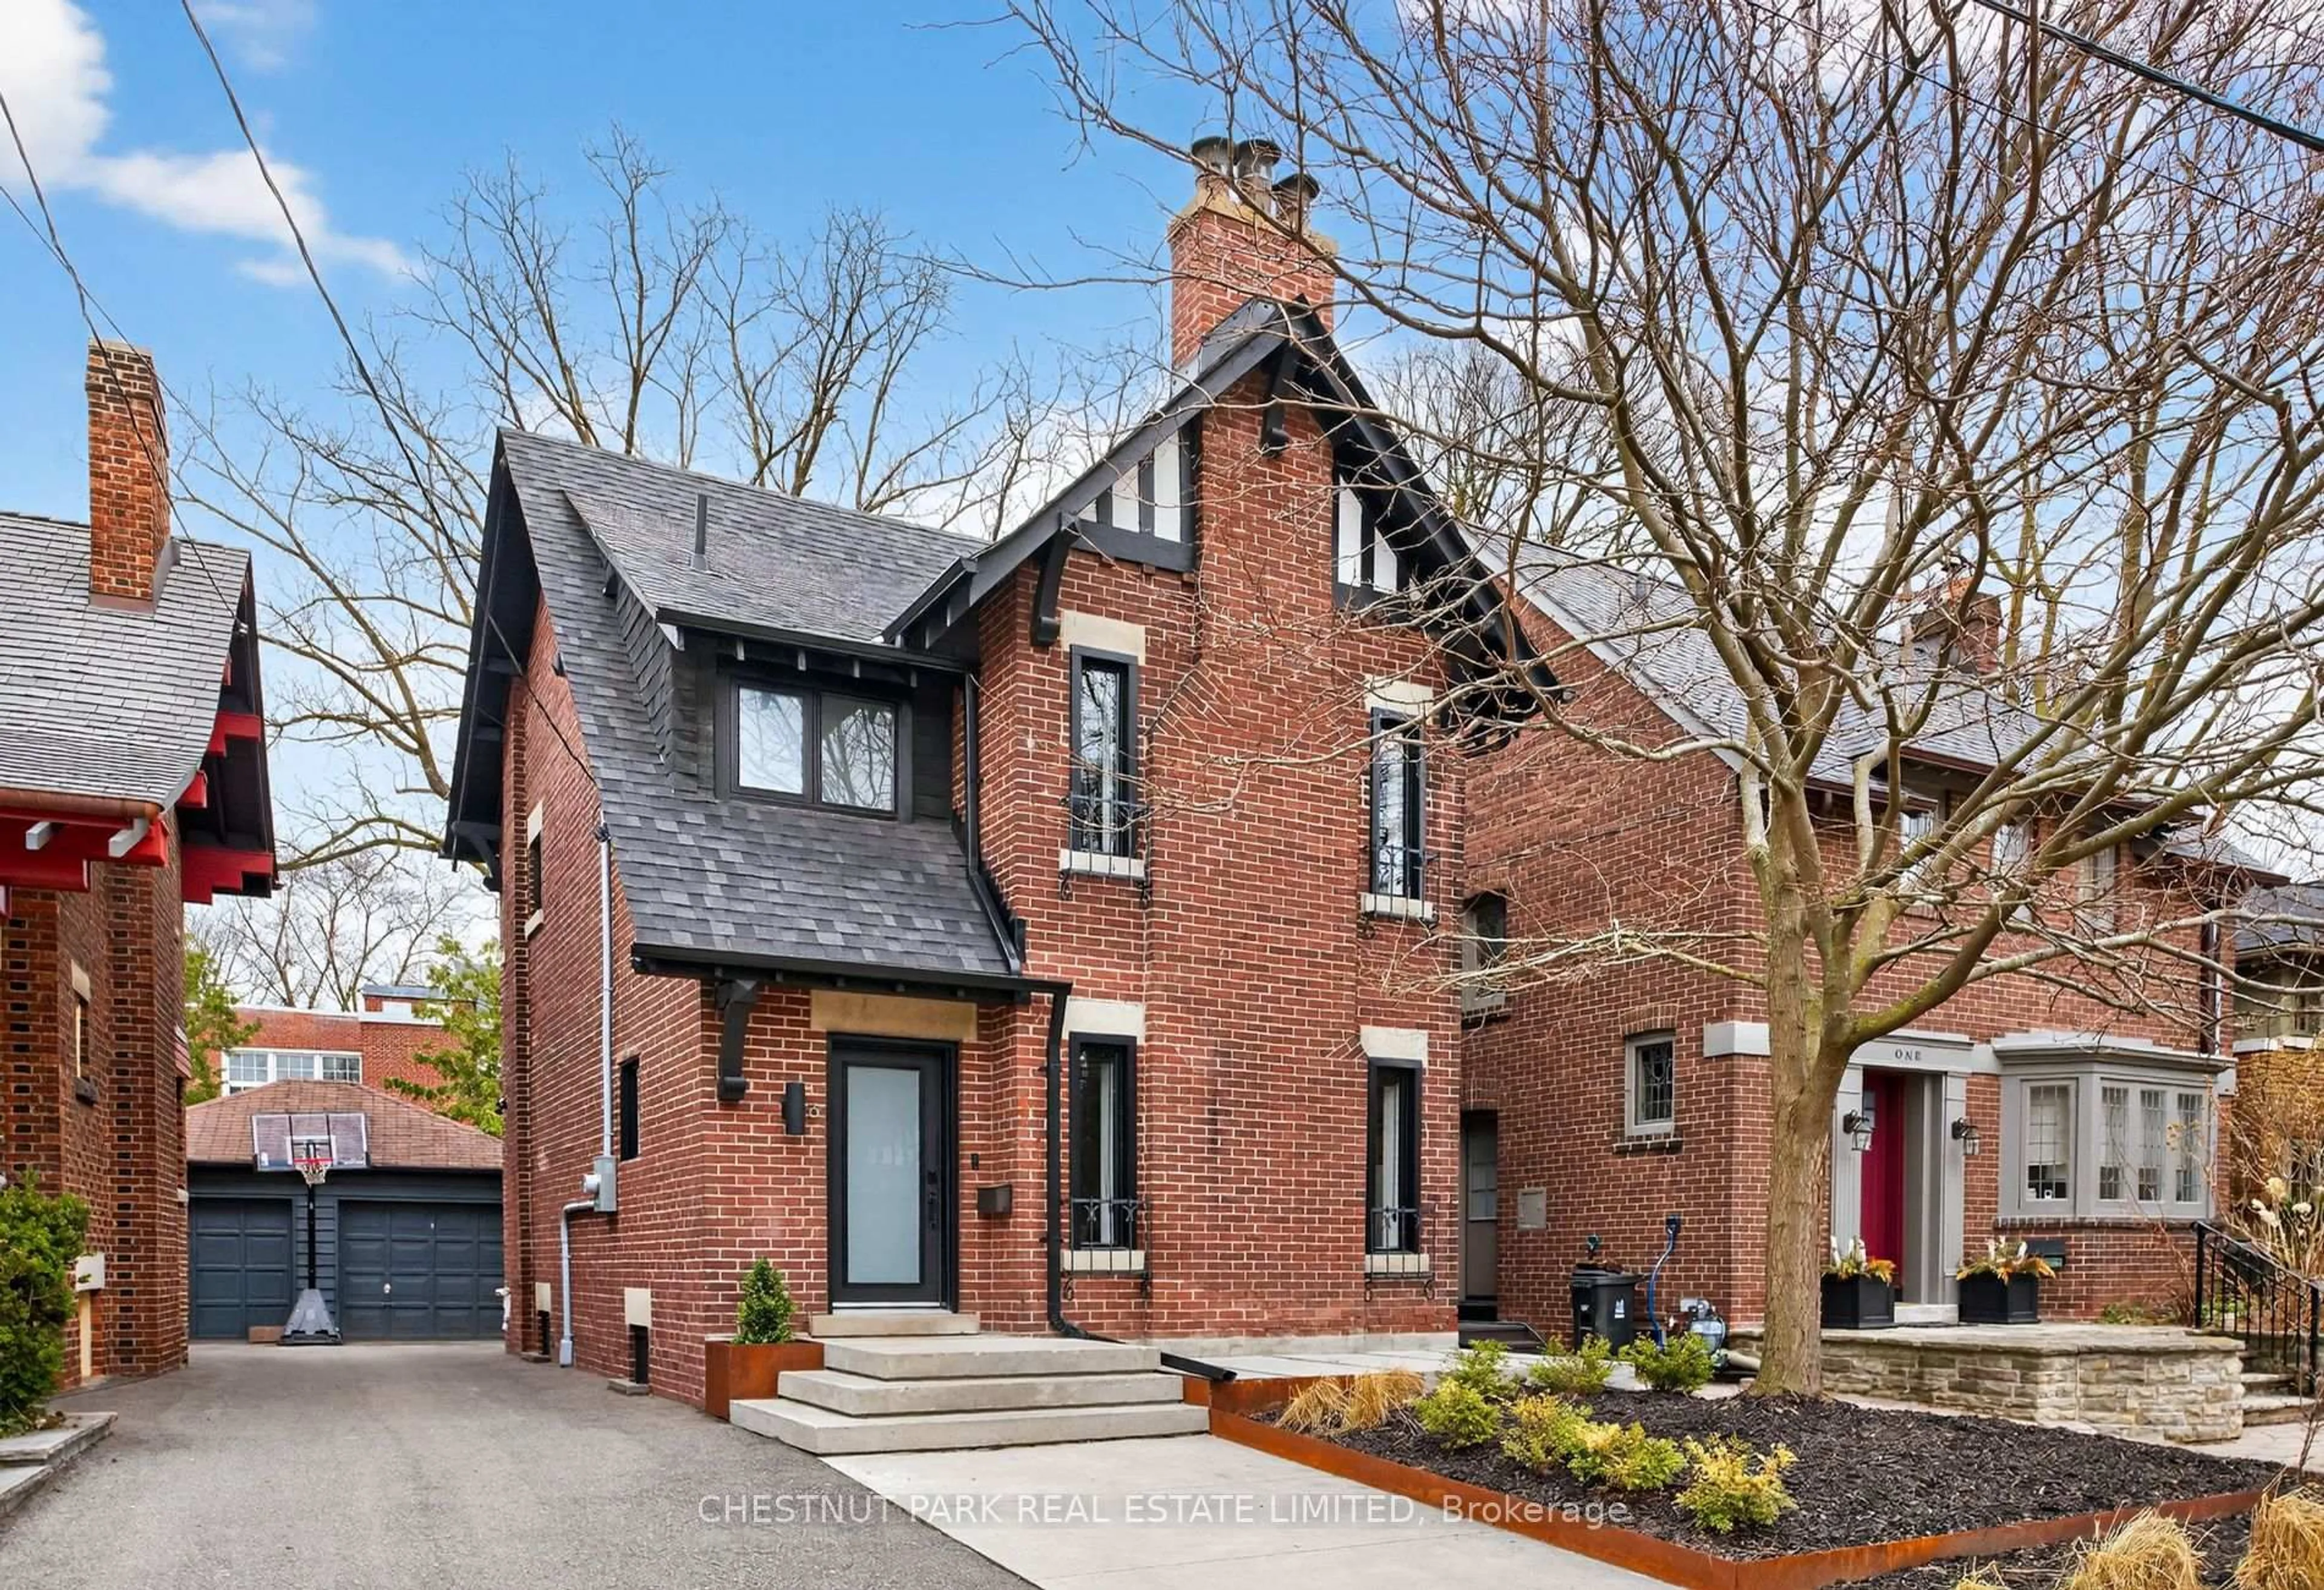
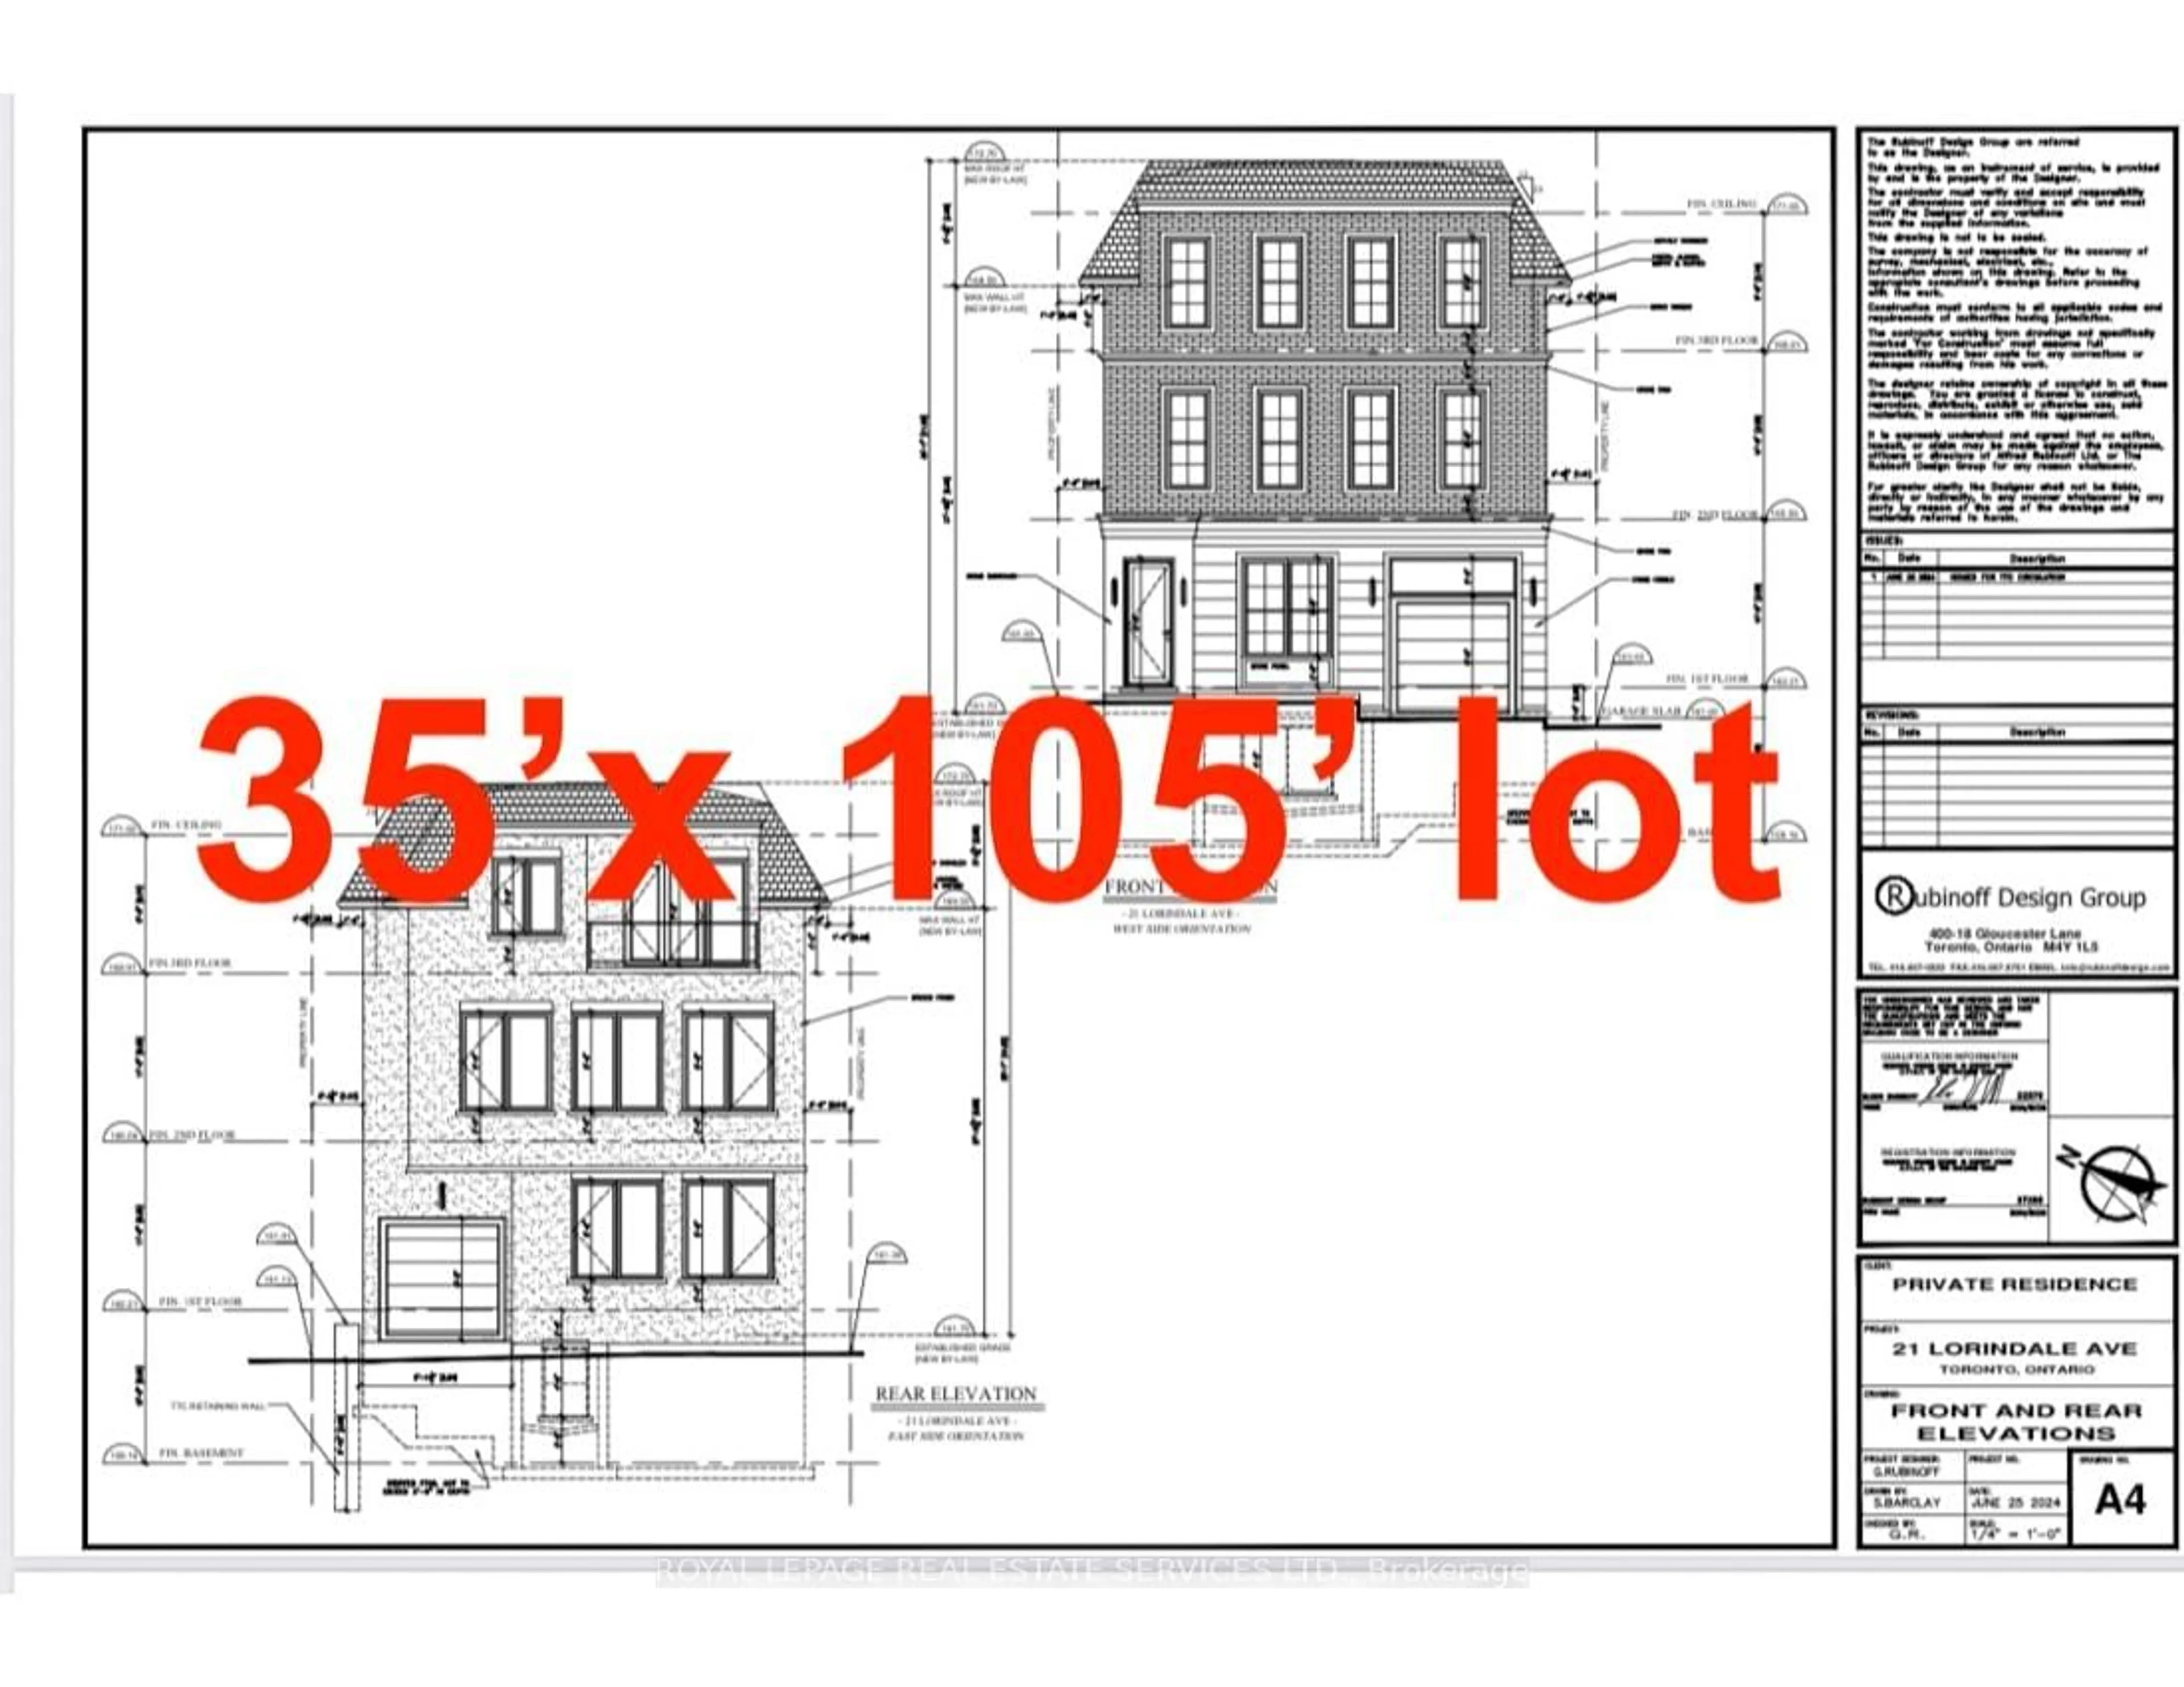
Calling all builders, Investors & Visionary End-Users-this is a rare, shovel-ready offering on a premium 35 x 105 ft lot tucked away on a quiet cul-de-sac, just steps from Yonge & Lawrence. Approved permits in place for a luxury triplex, allowing you to build immediately in one of Toronto's most prestigious neighbourhoods. Features a separate entrance to a finished lower level, ideal for those looking to hold, rent, or phase their development strategically. A refined, high-upside opportunity to develop a luxury multi-unit residence or build your custom home. Surrounded by elite schools incl John Wanless PS, Lawrence Park CI, TFS, Havergal College & UCC, this address offers unmatched lifestyle appeal. Walk to the subway, boutique shops, fine dining, parks, and daily essentials. Property Sold "As Is".
Property Details
Interior
Features
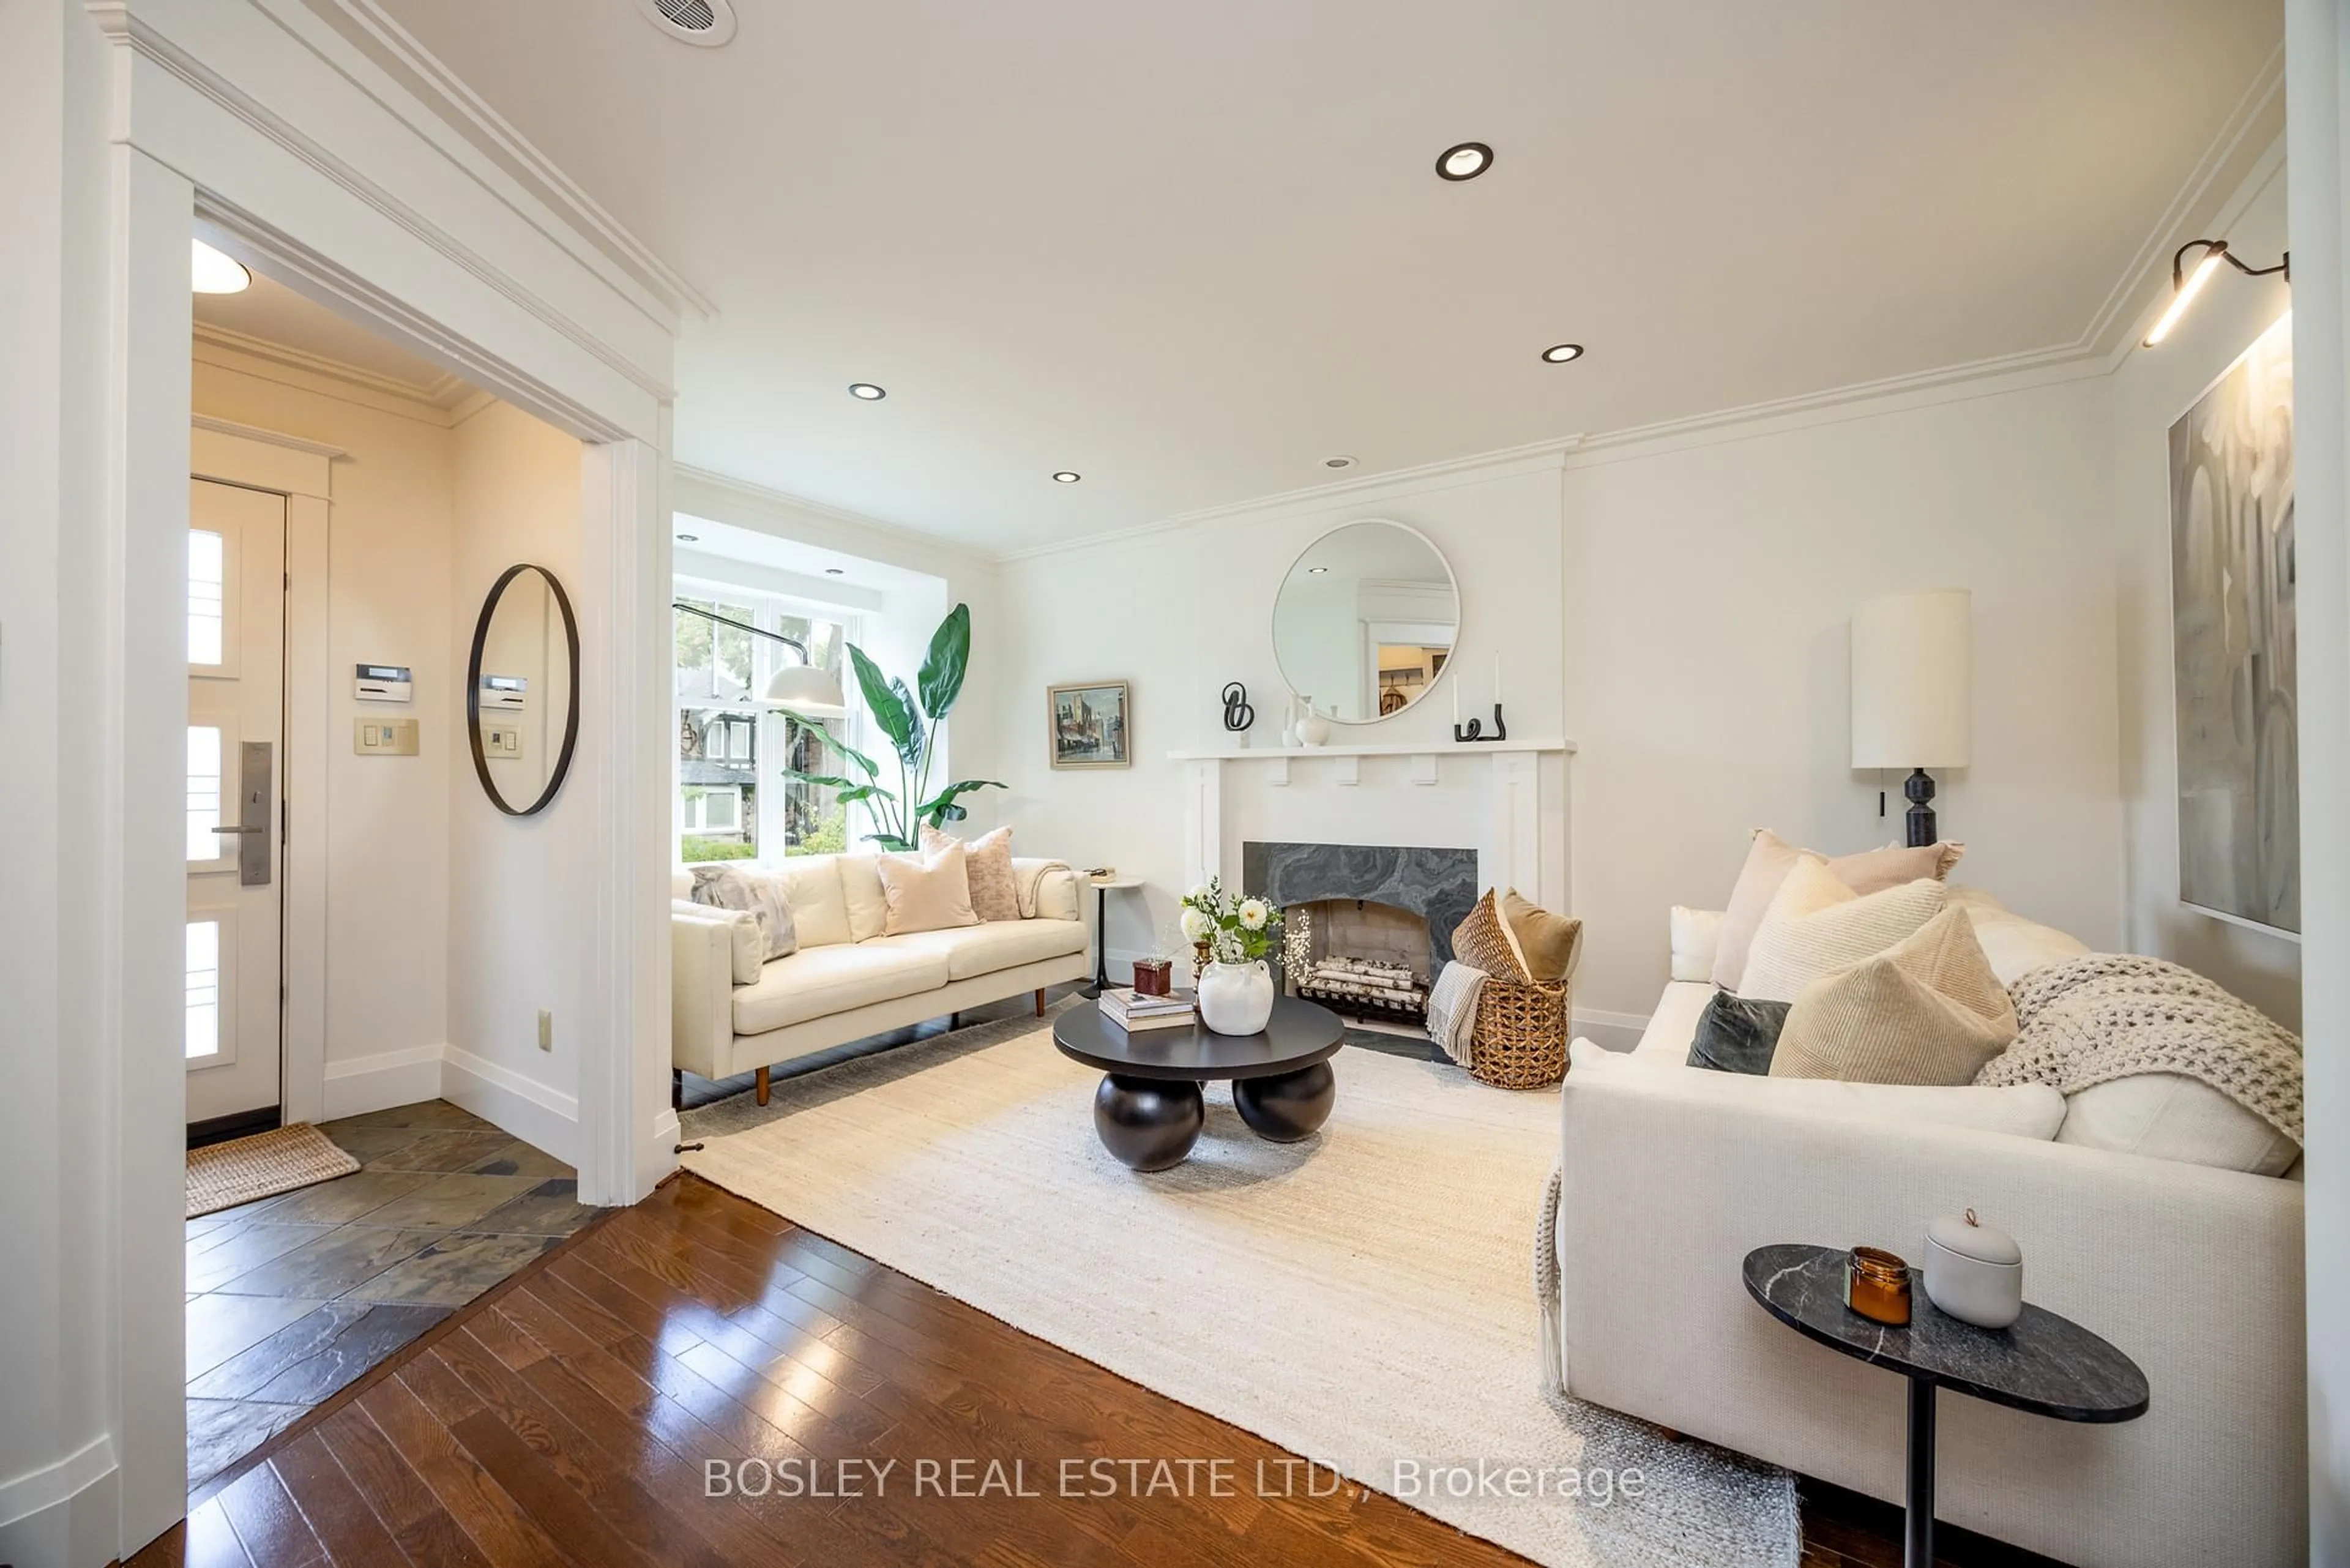
Main Floor
Dining
3.8 x 3.2hardwood floor / W/O To Sundeck / O/Looks Garden
Kitchen
3.7 x 2.45Eat-In Kitchen / O/Looks Garden
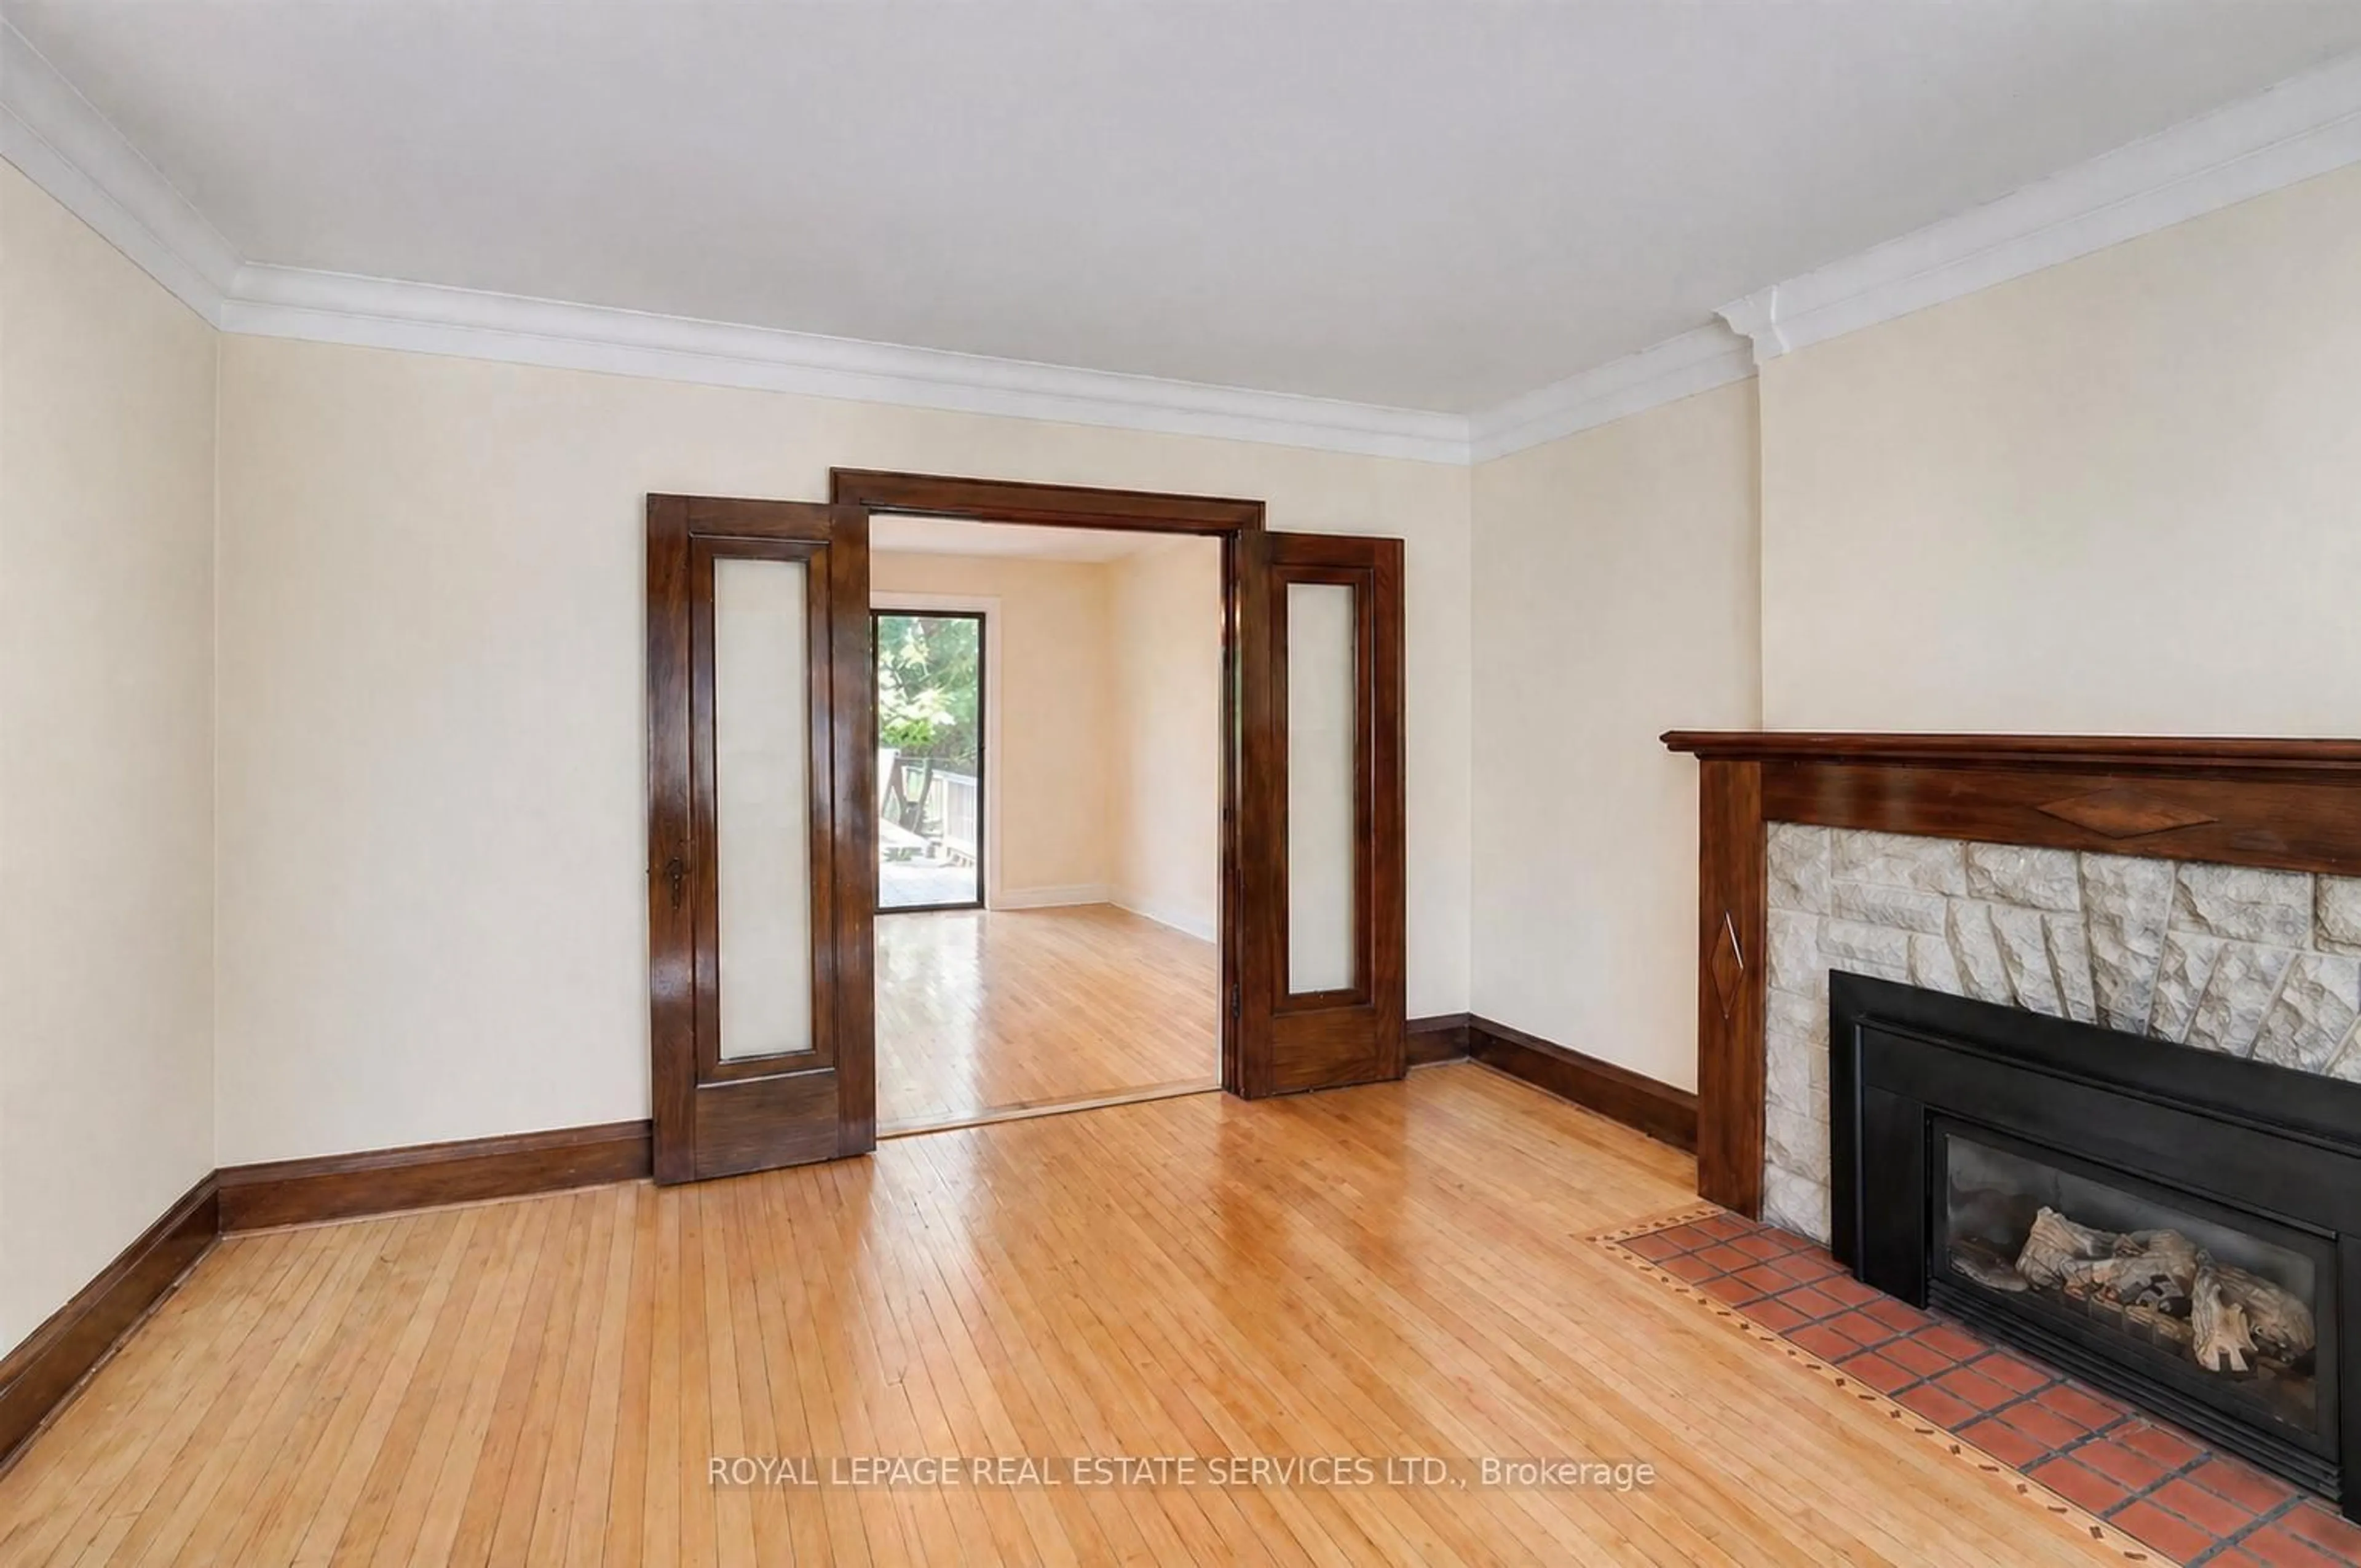
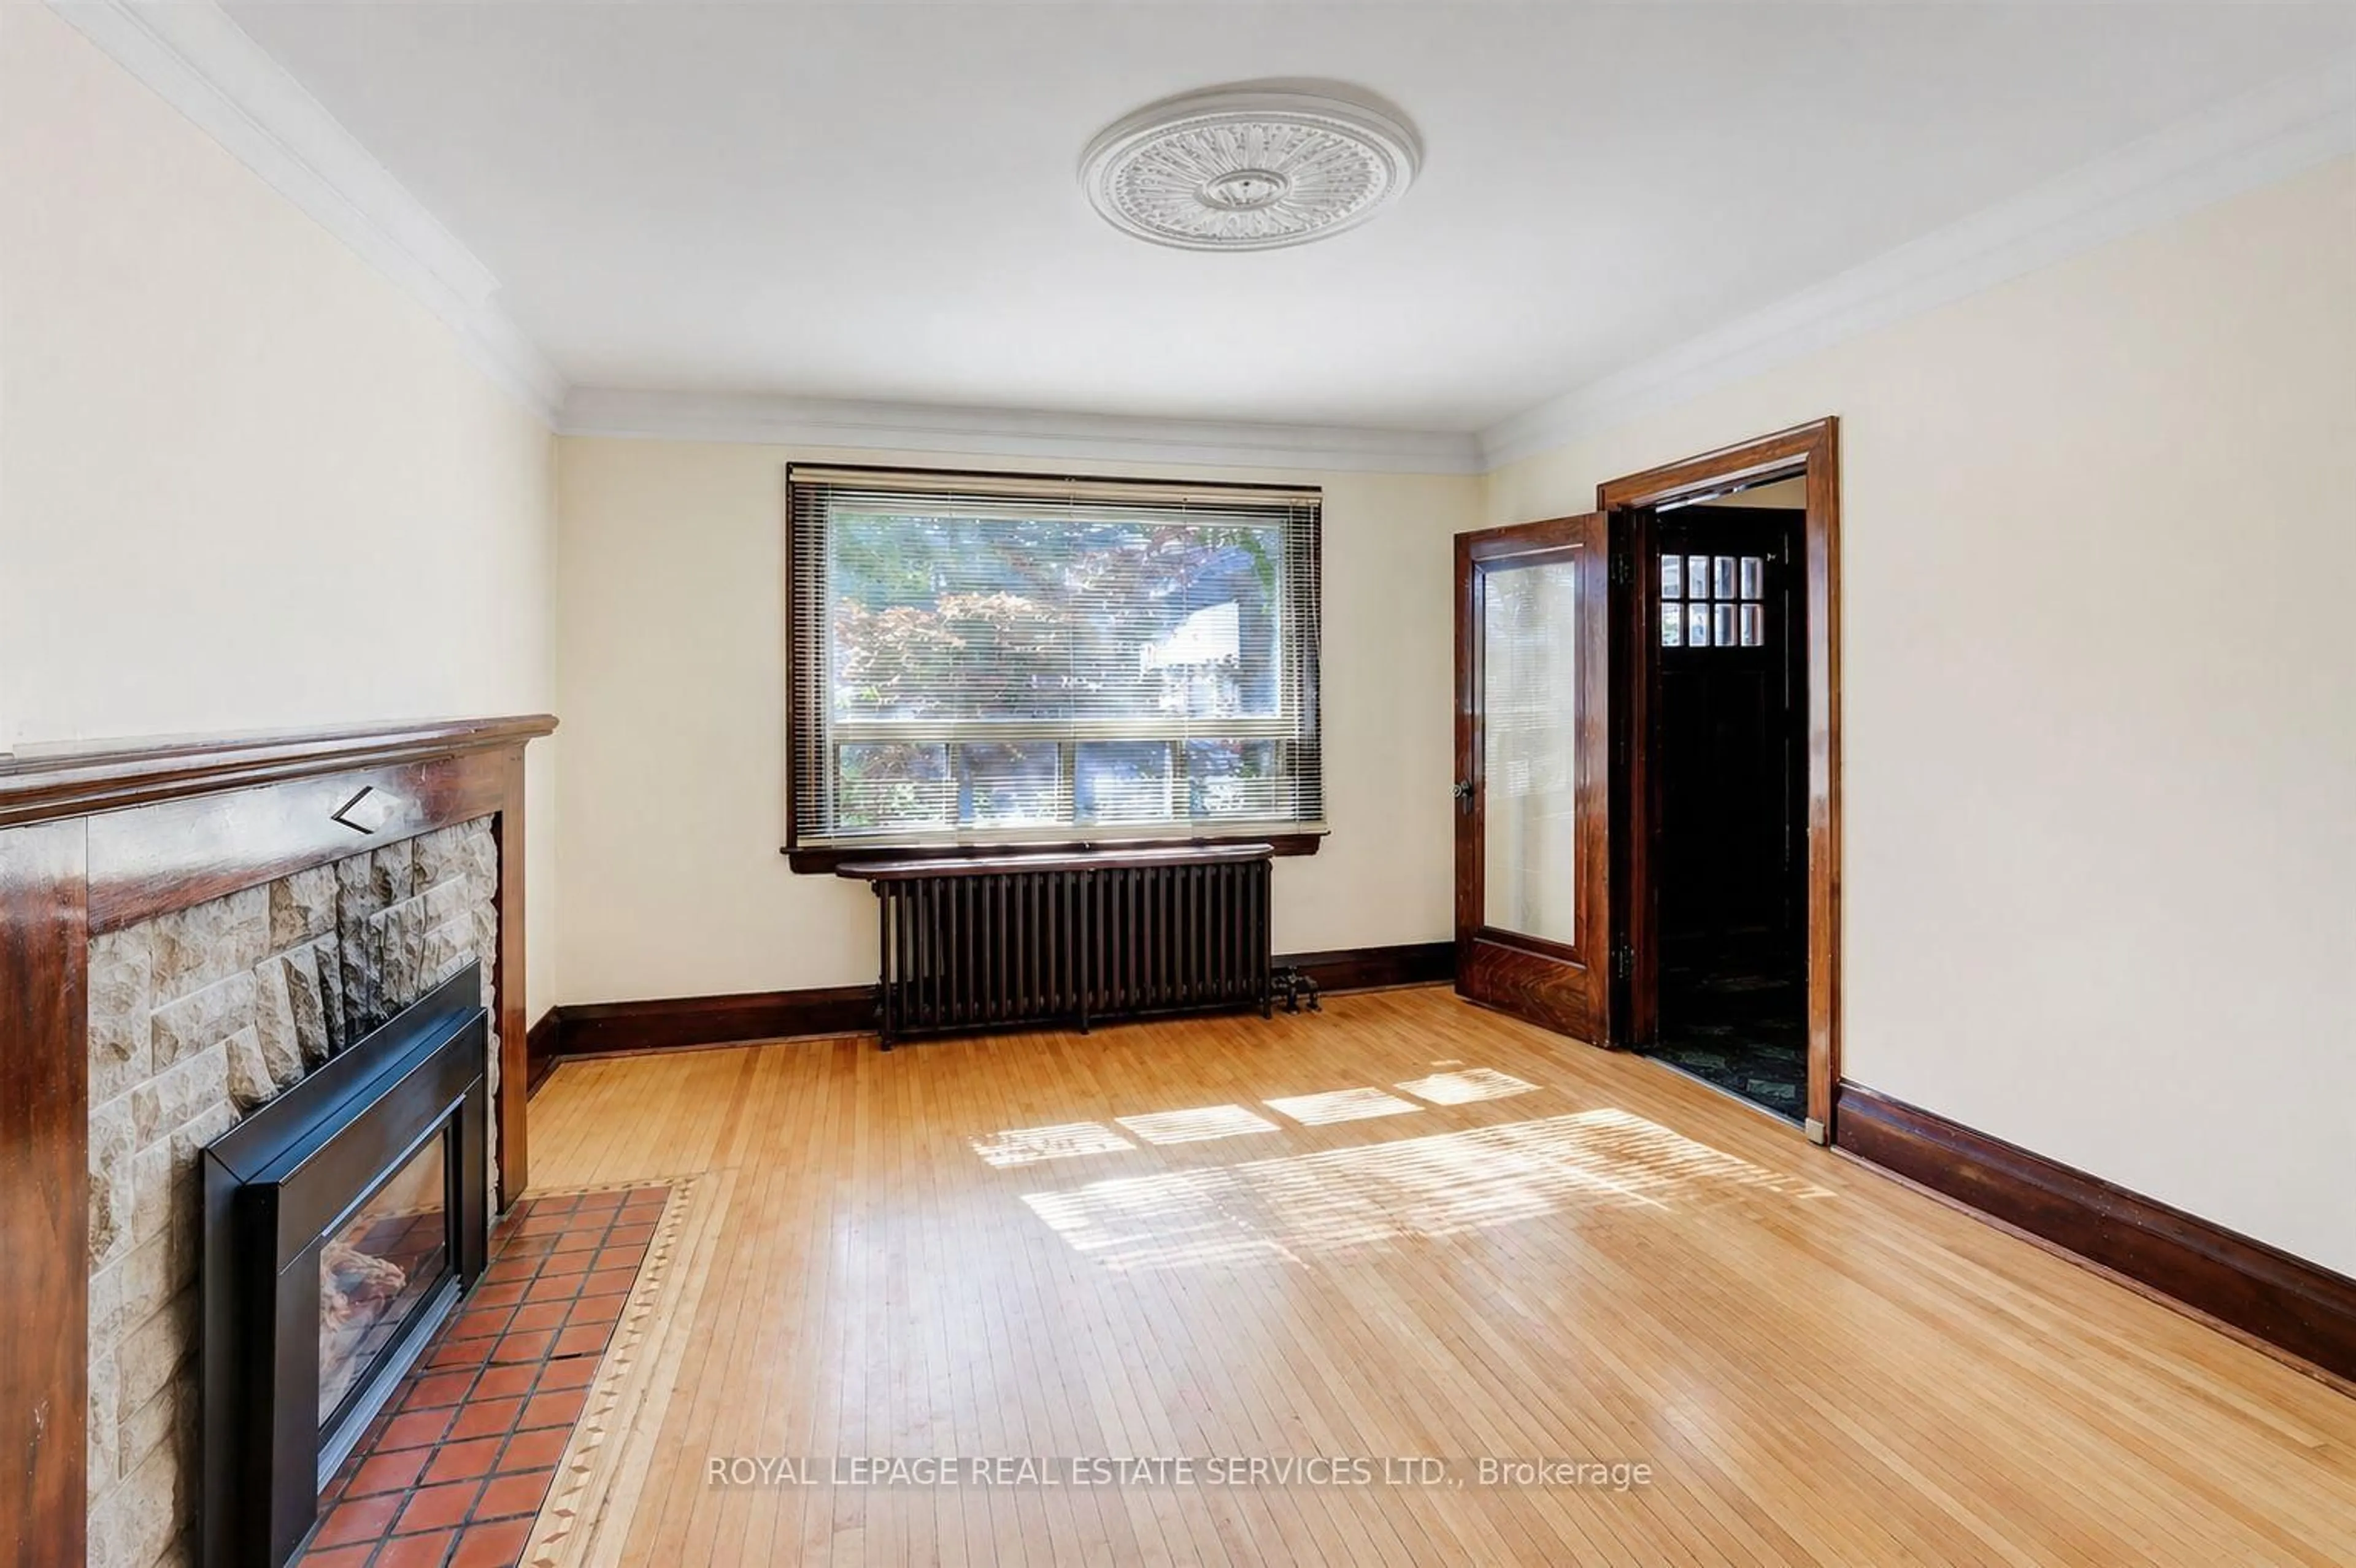
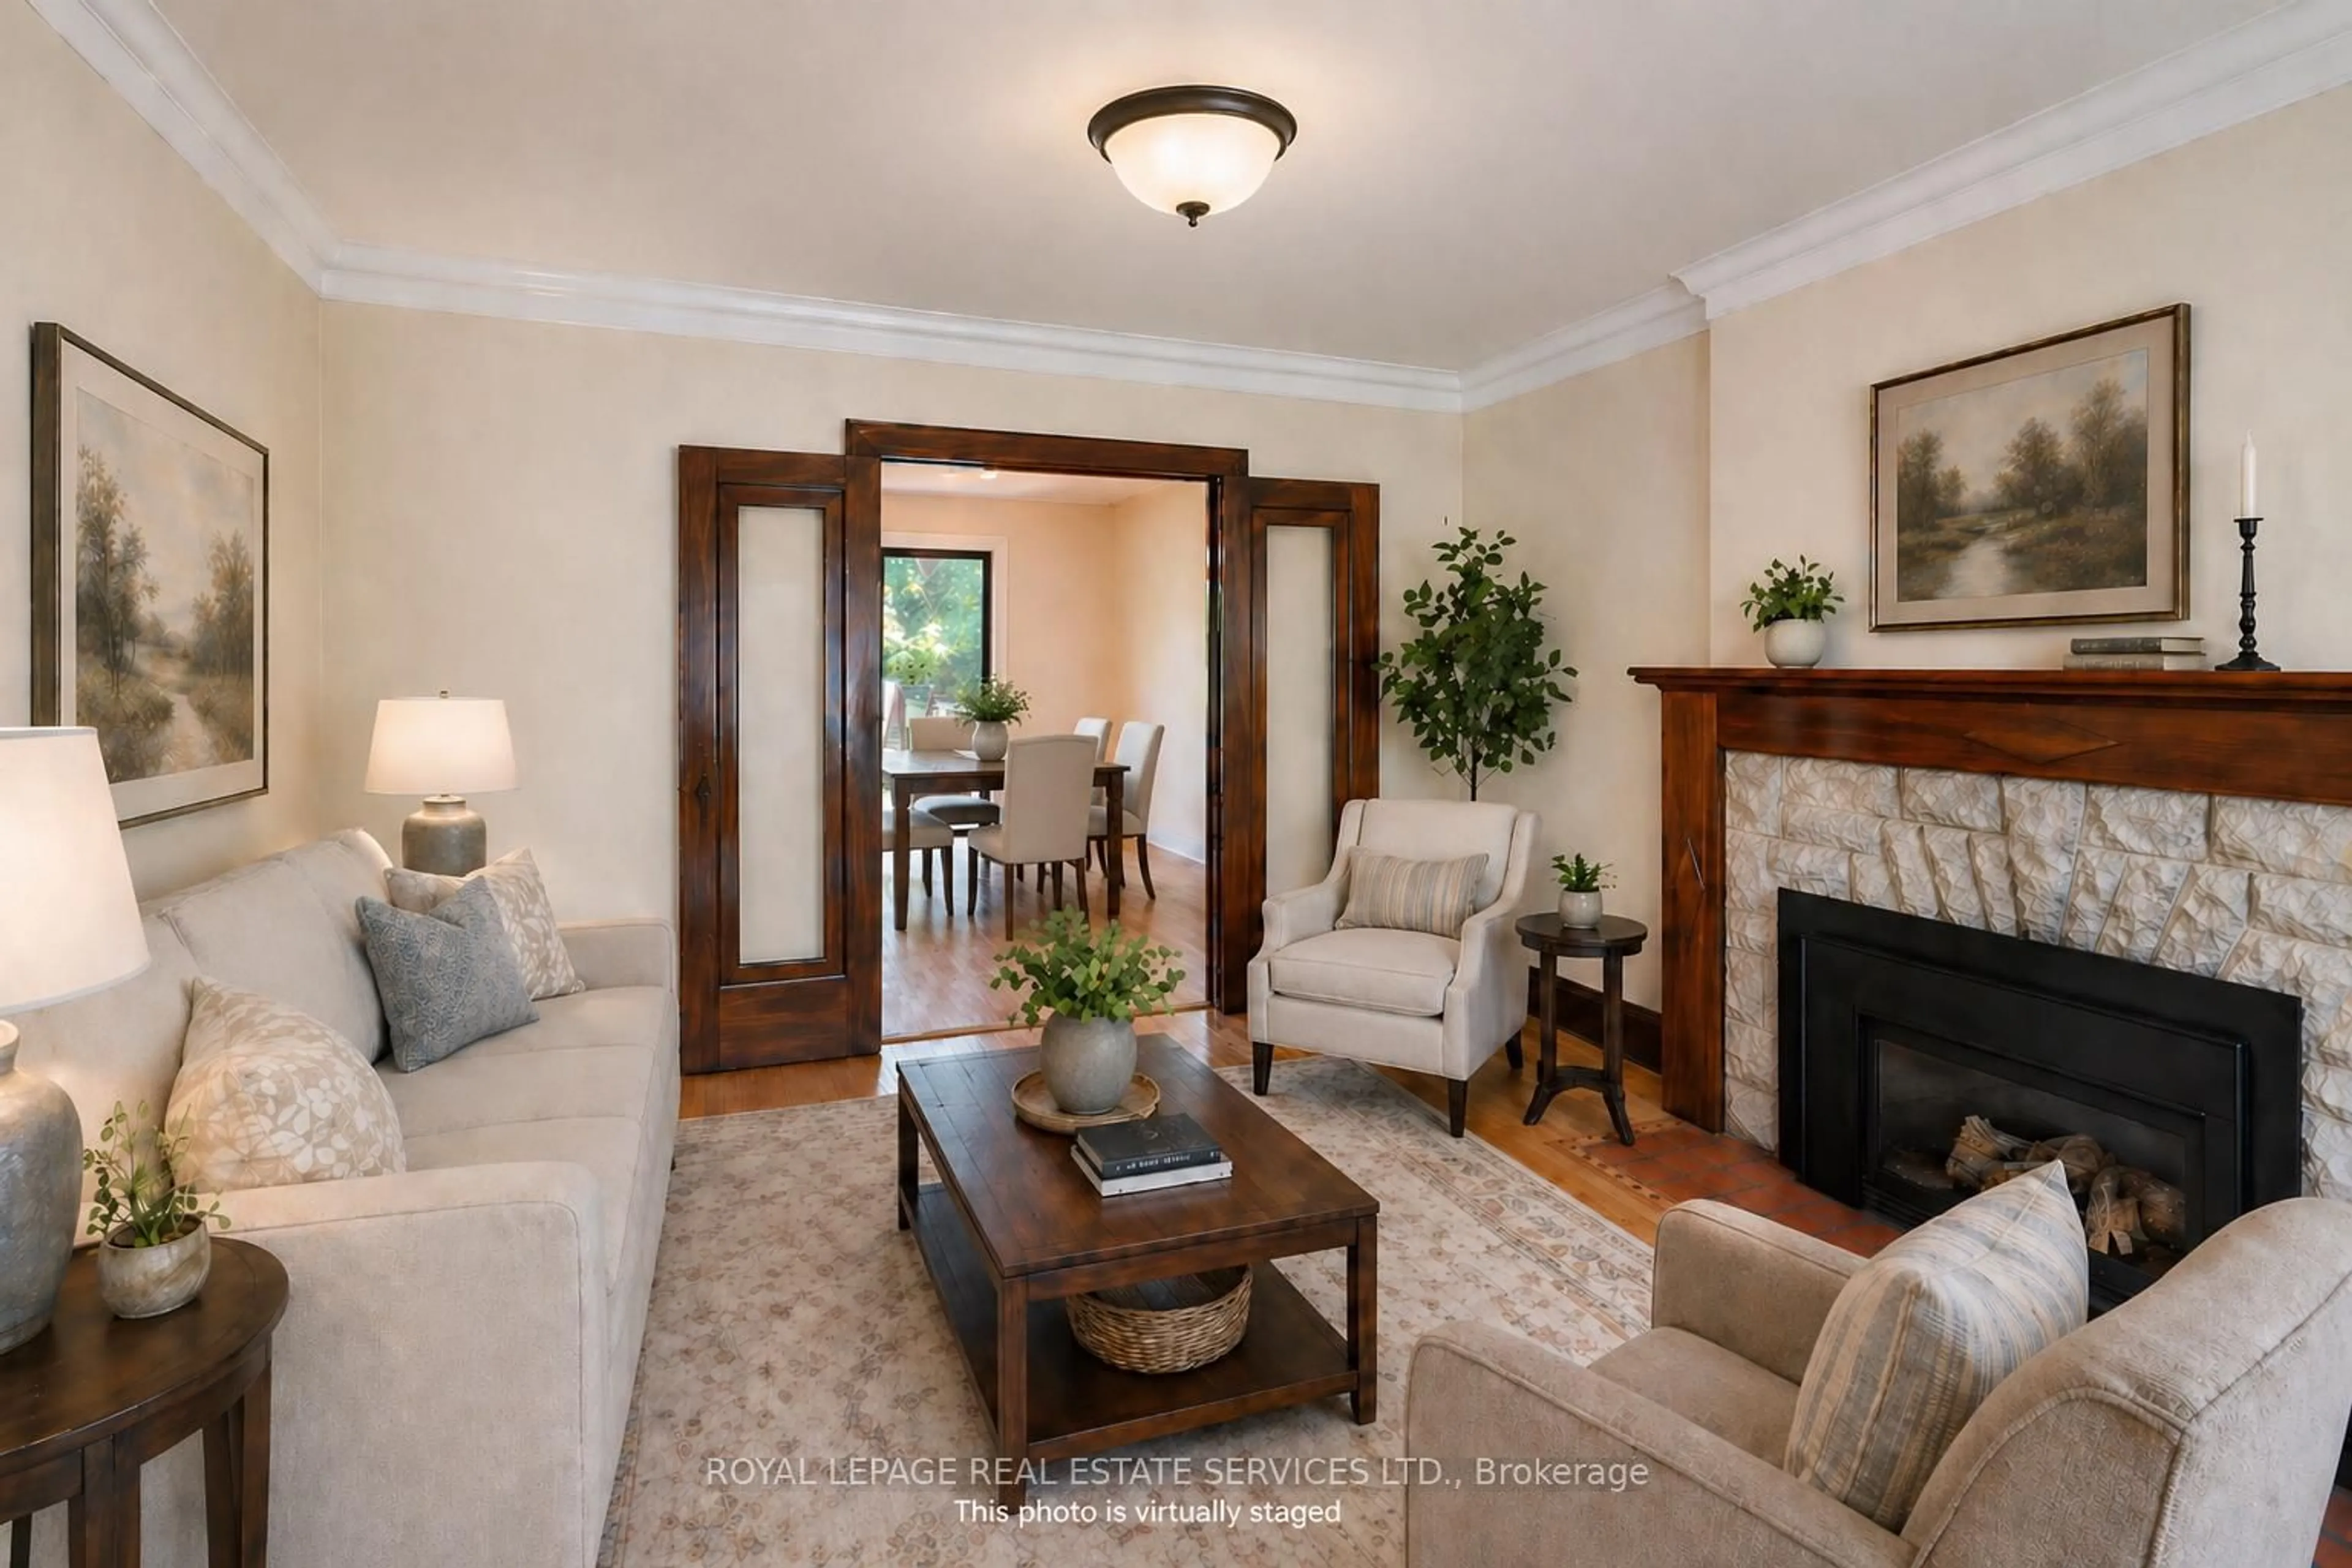
Living
4.3 x 3.65hardwood floor / Fireplace Insert / Large Window
Exterior
Features
Parking
Garage spaces -
Garage type -
Total parking spaces 3
Property History
 21
21