150 days on Market
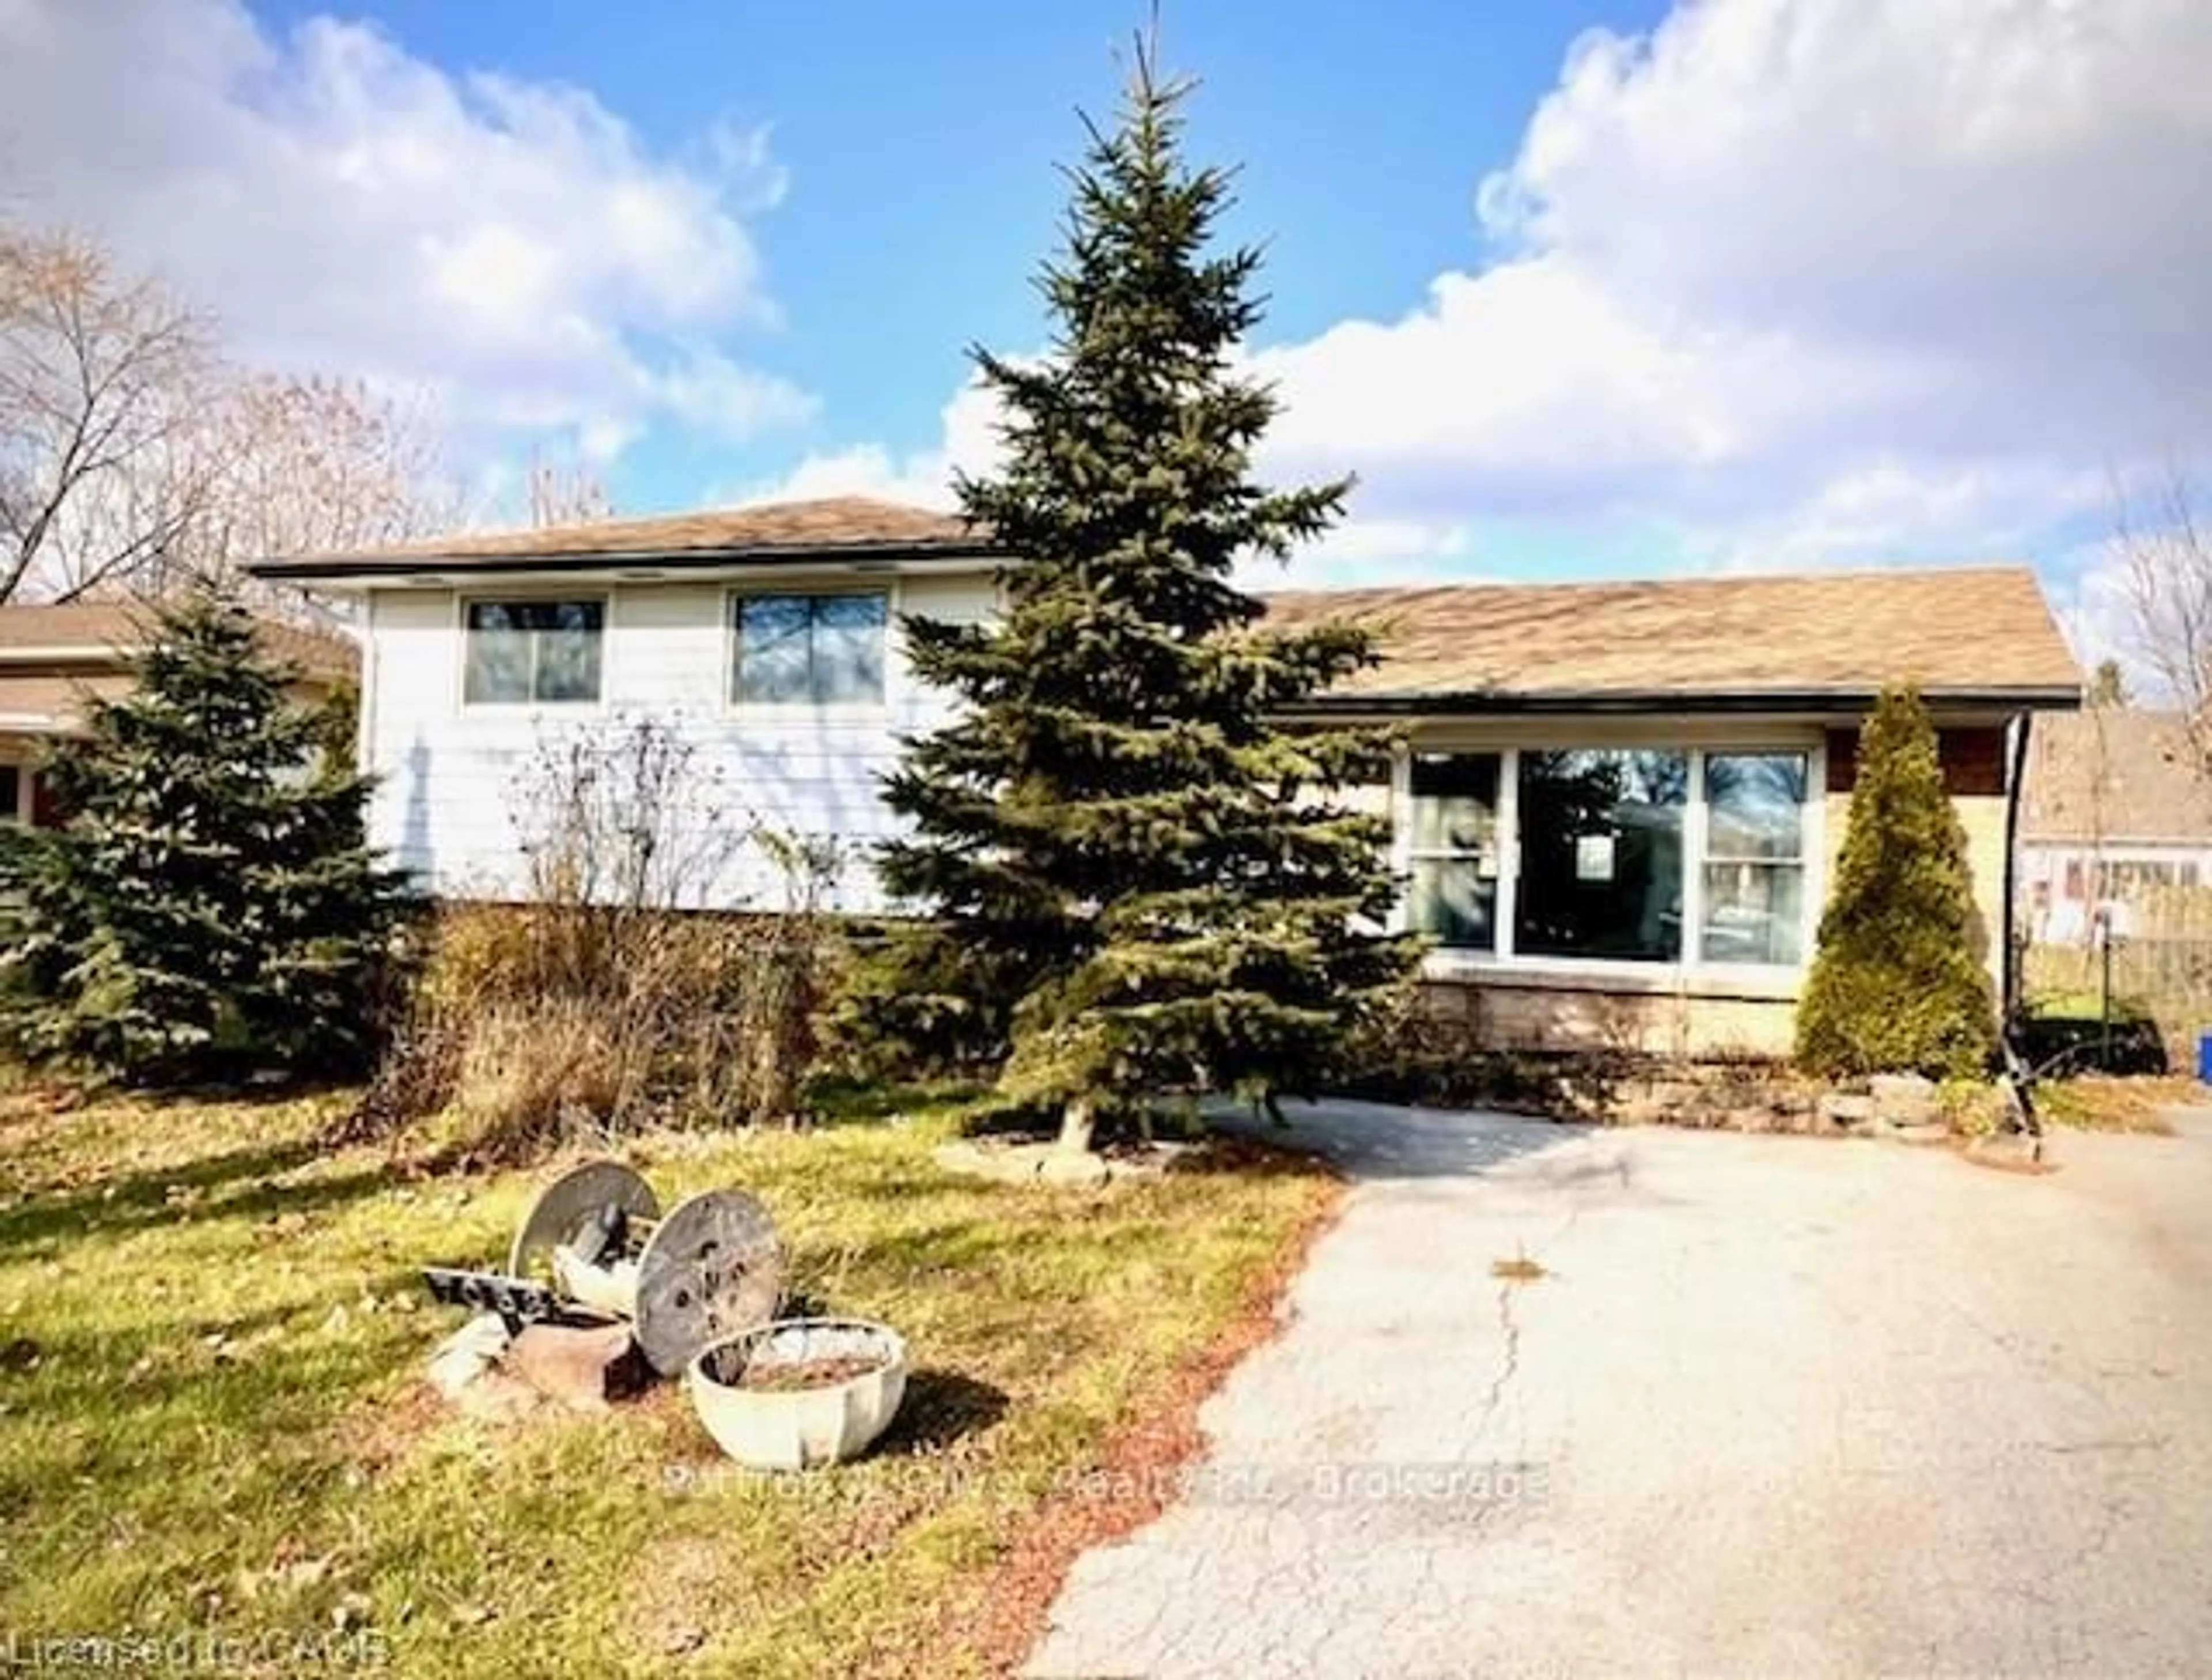
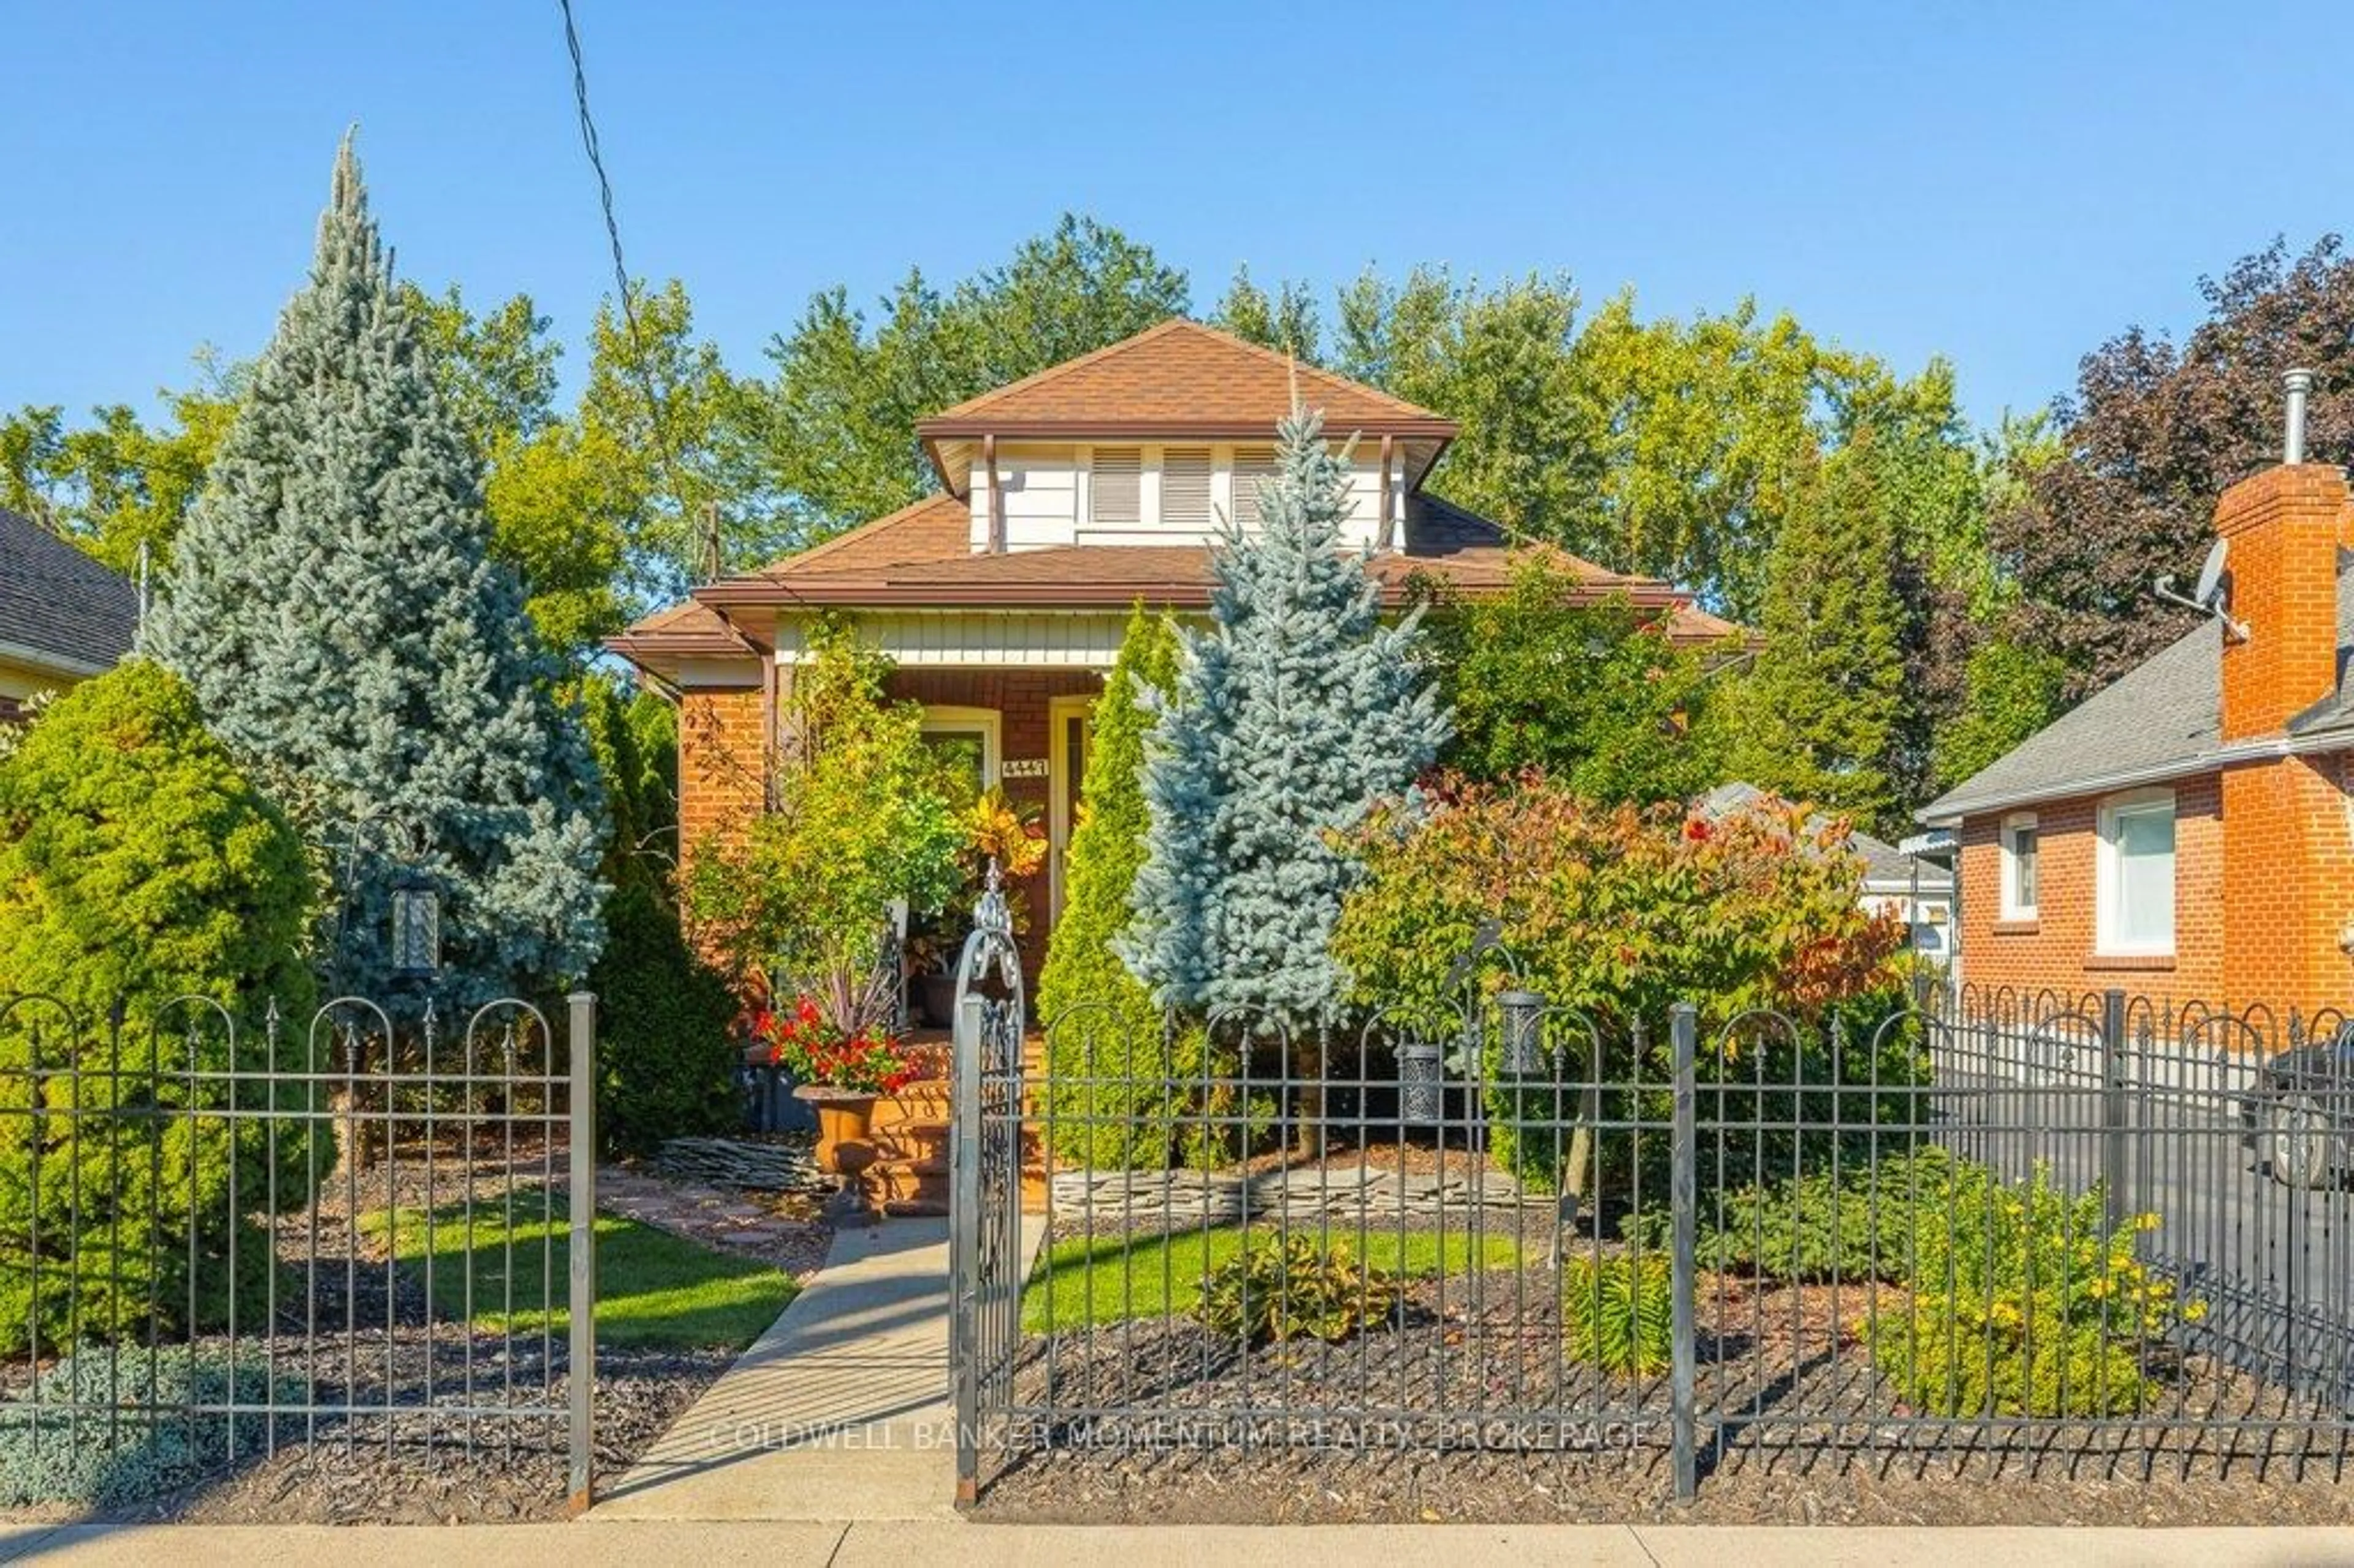
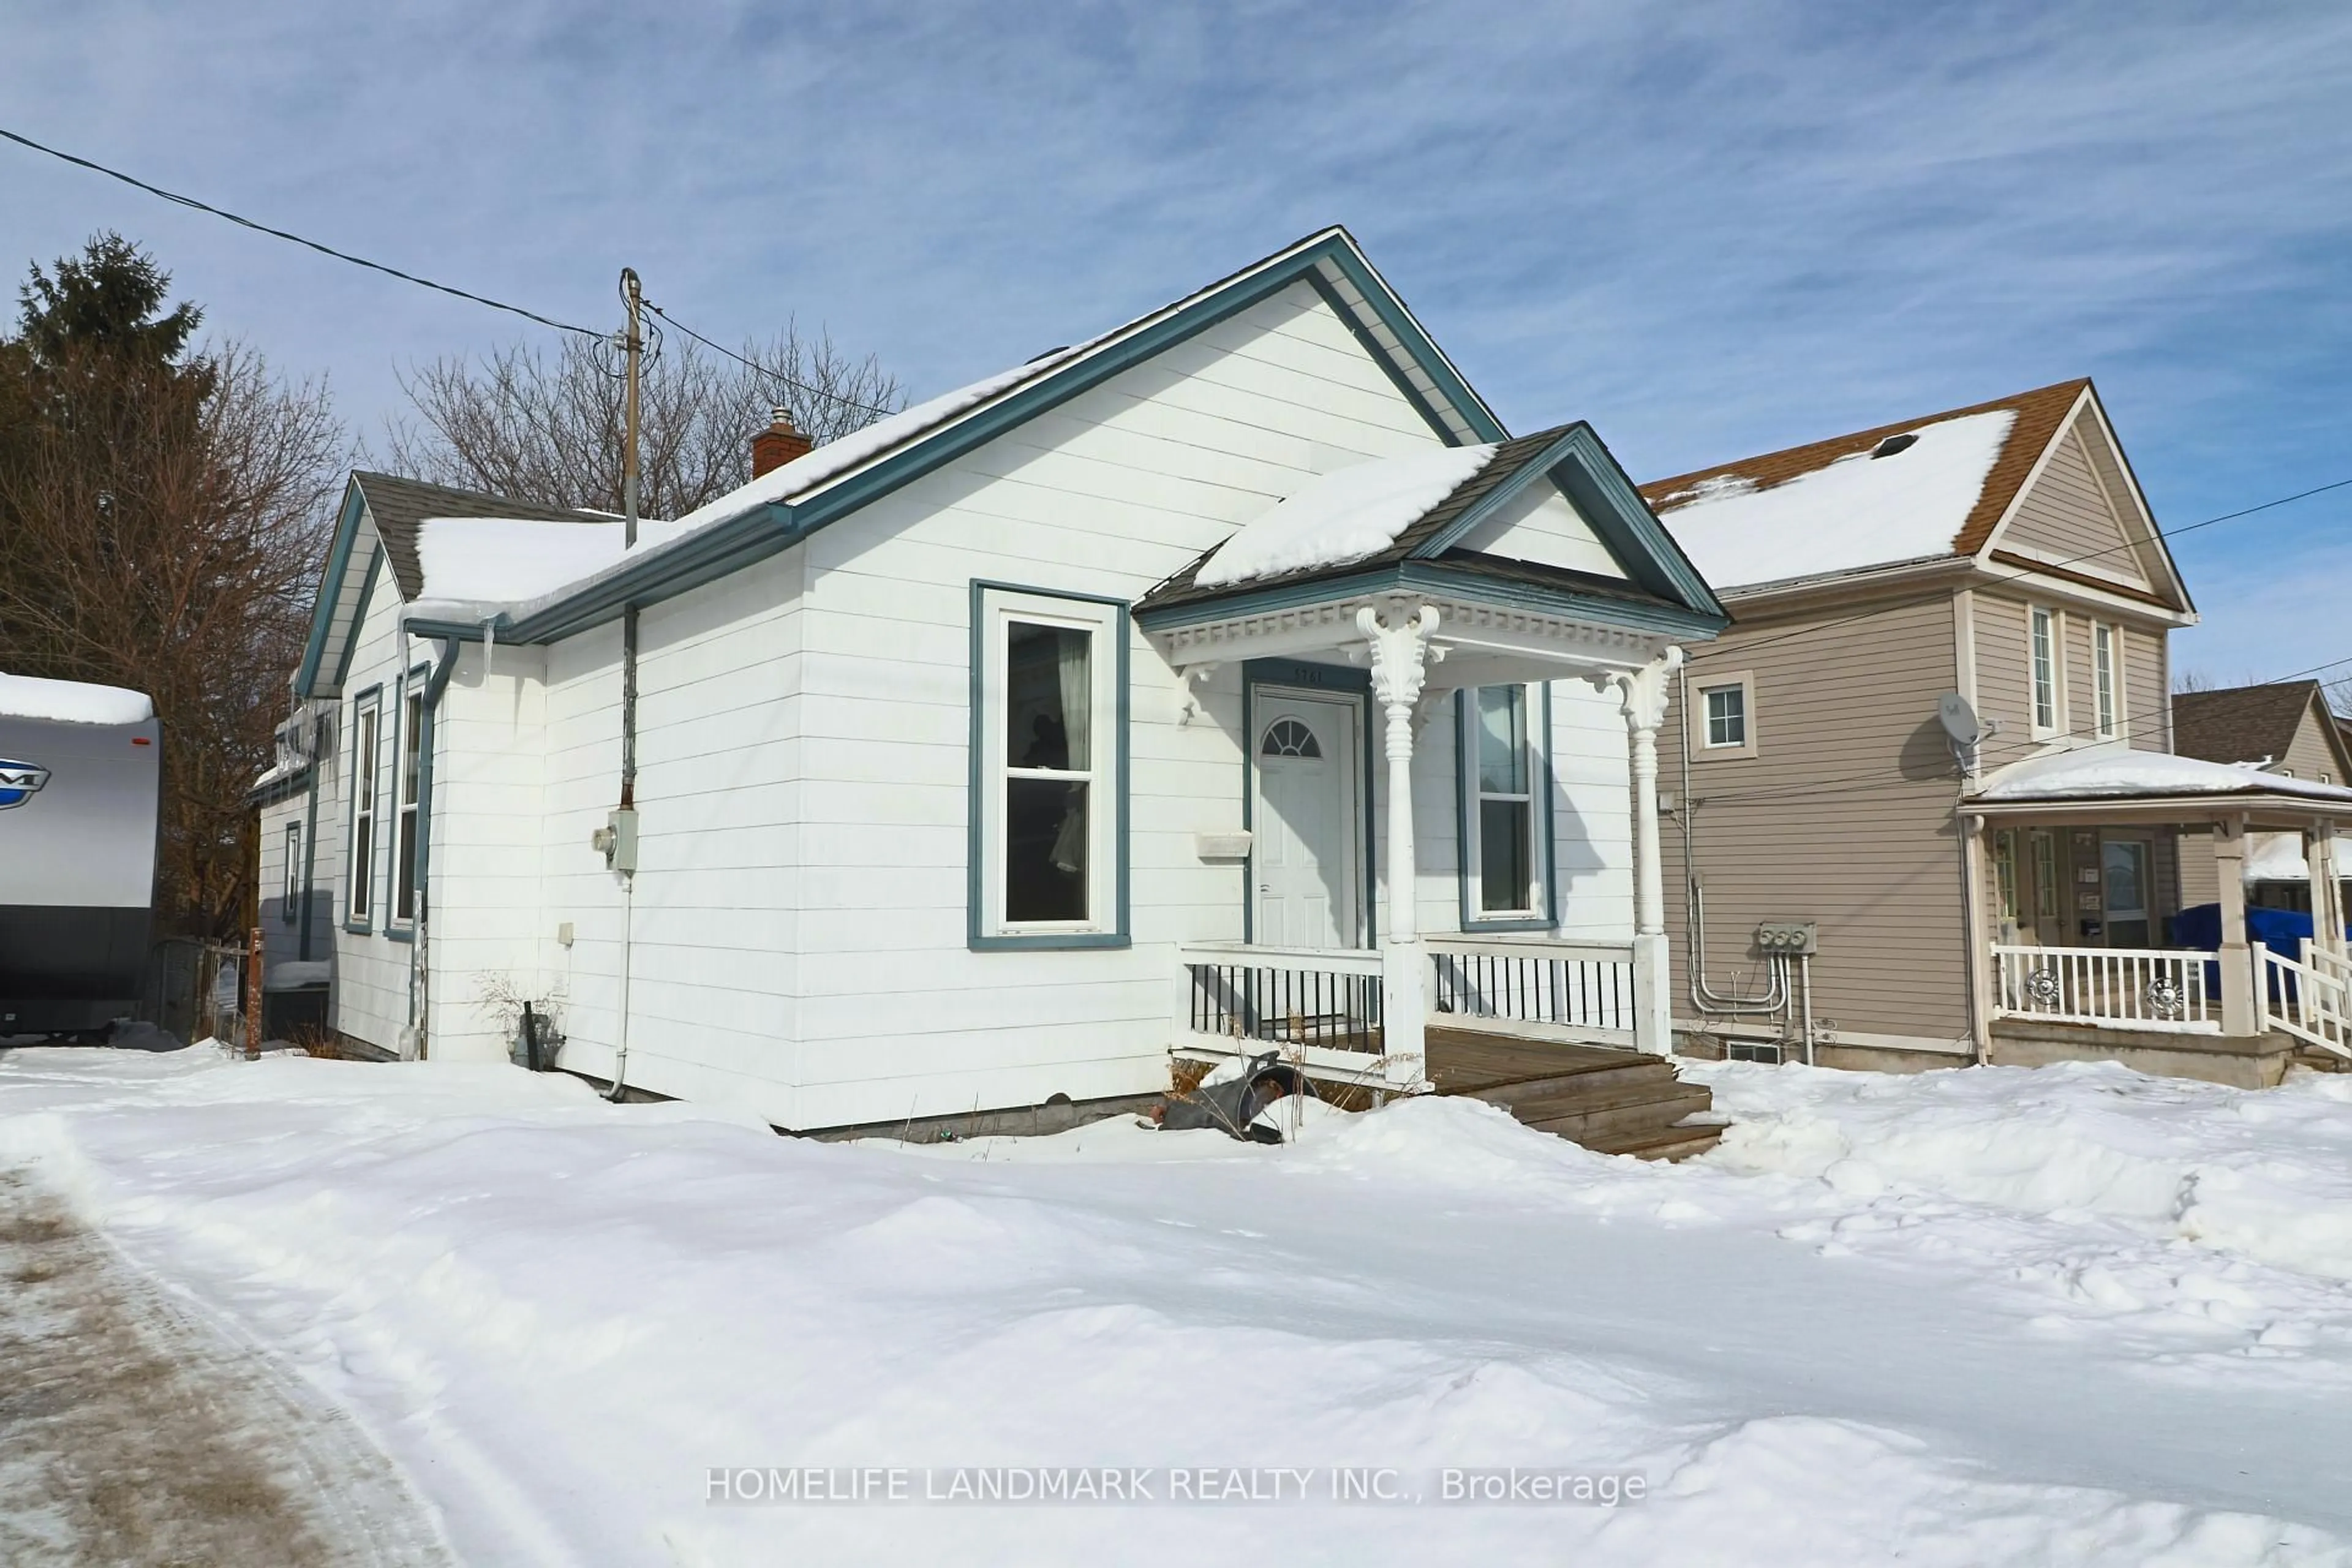
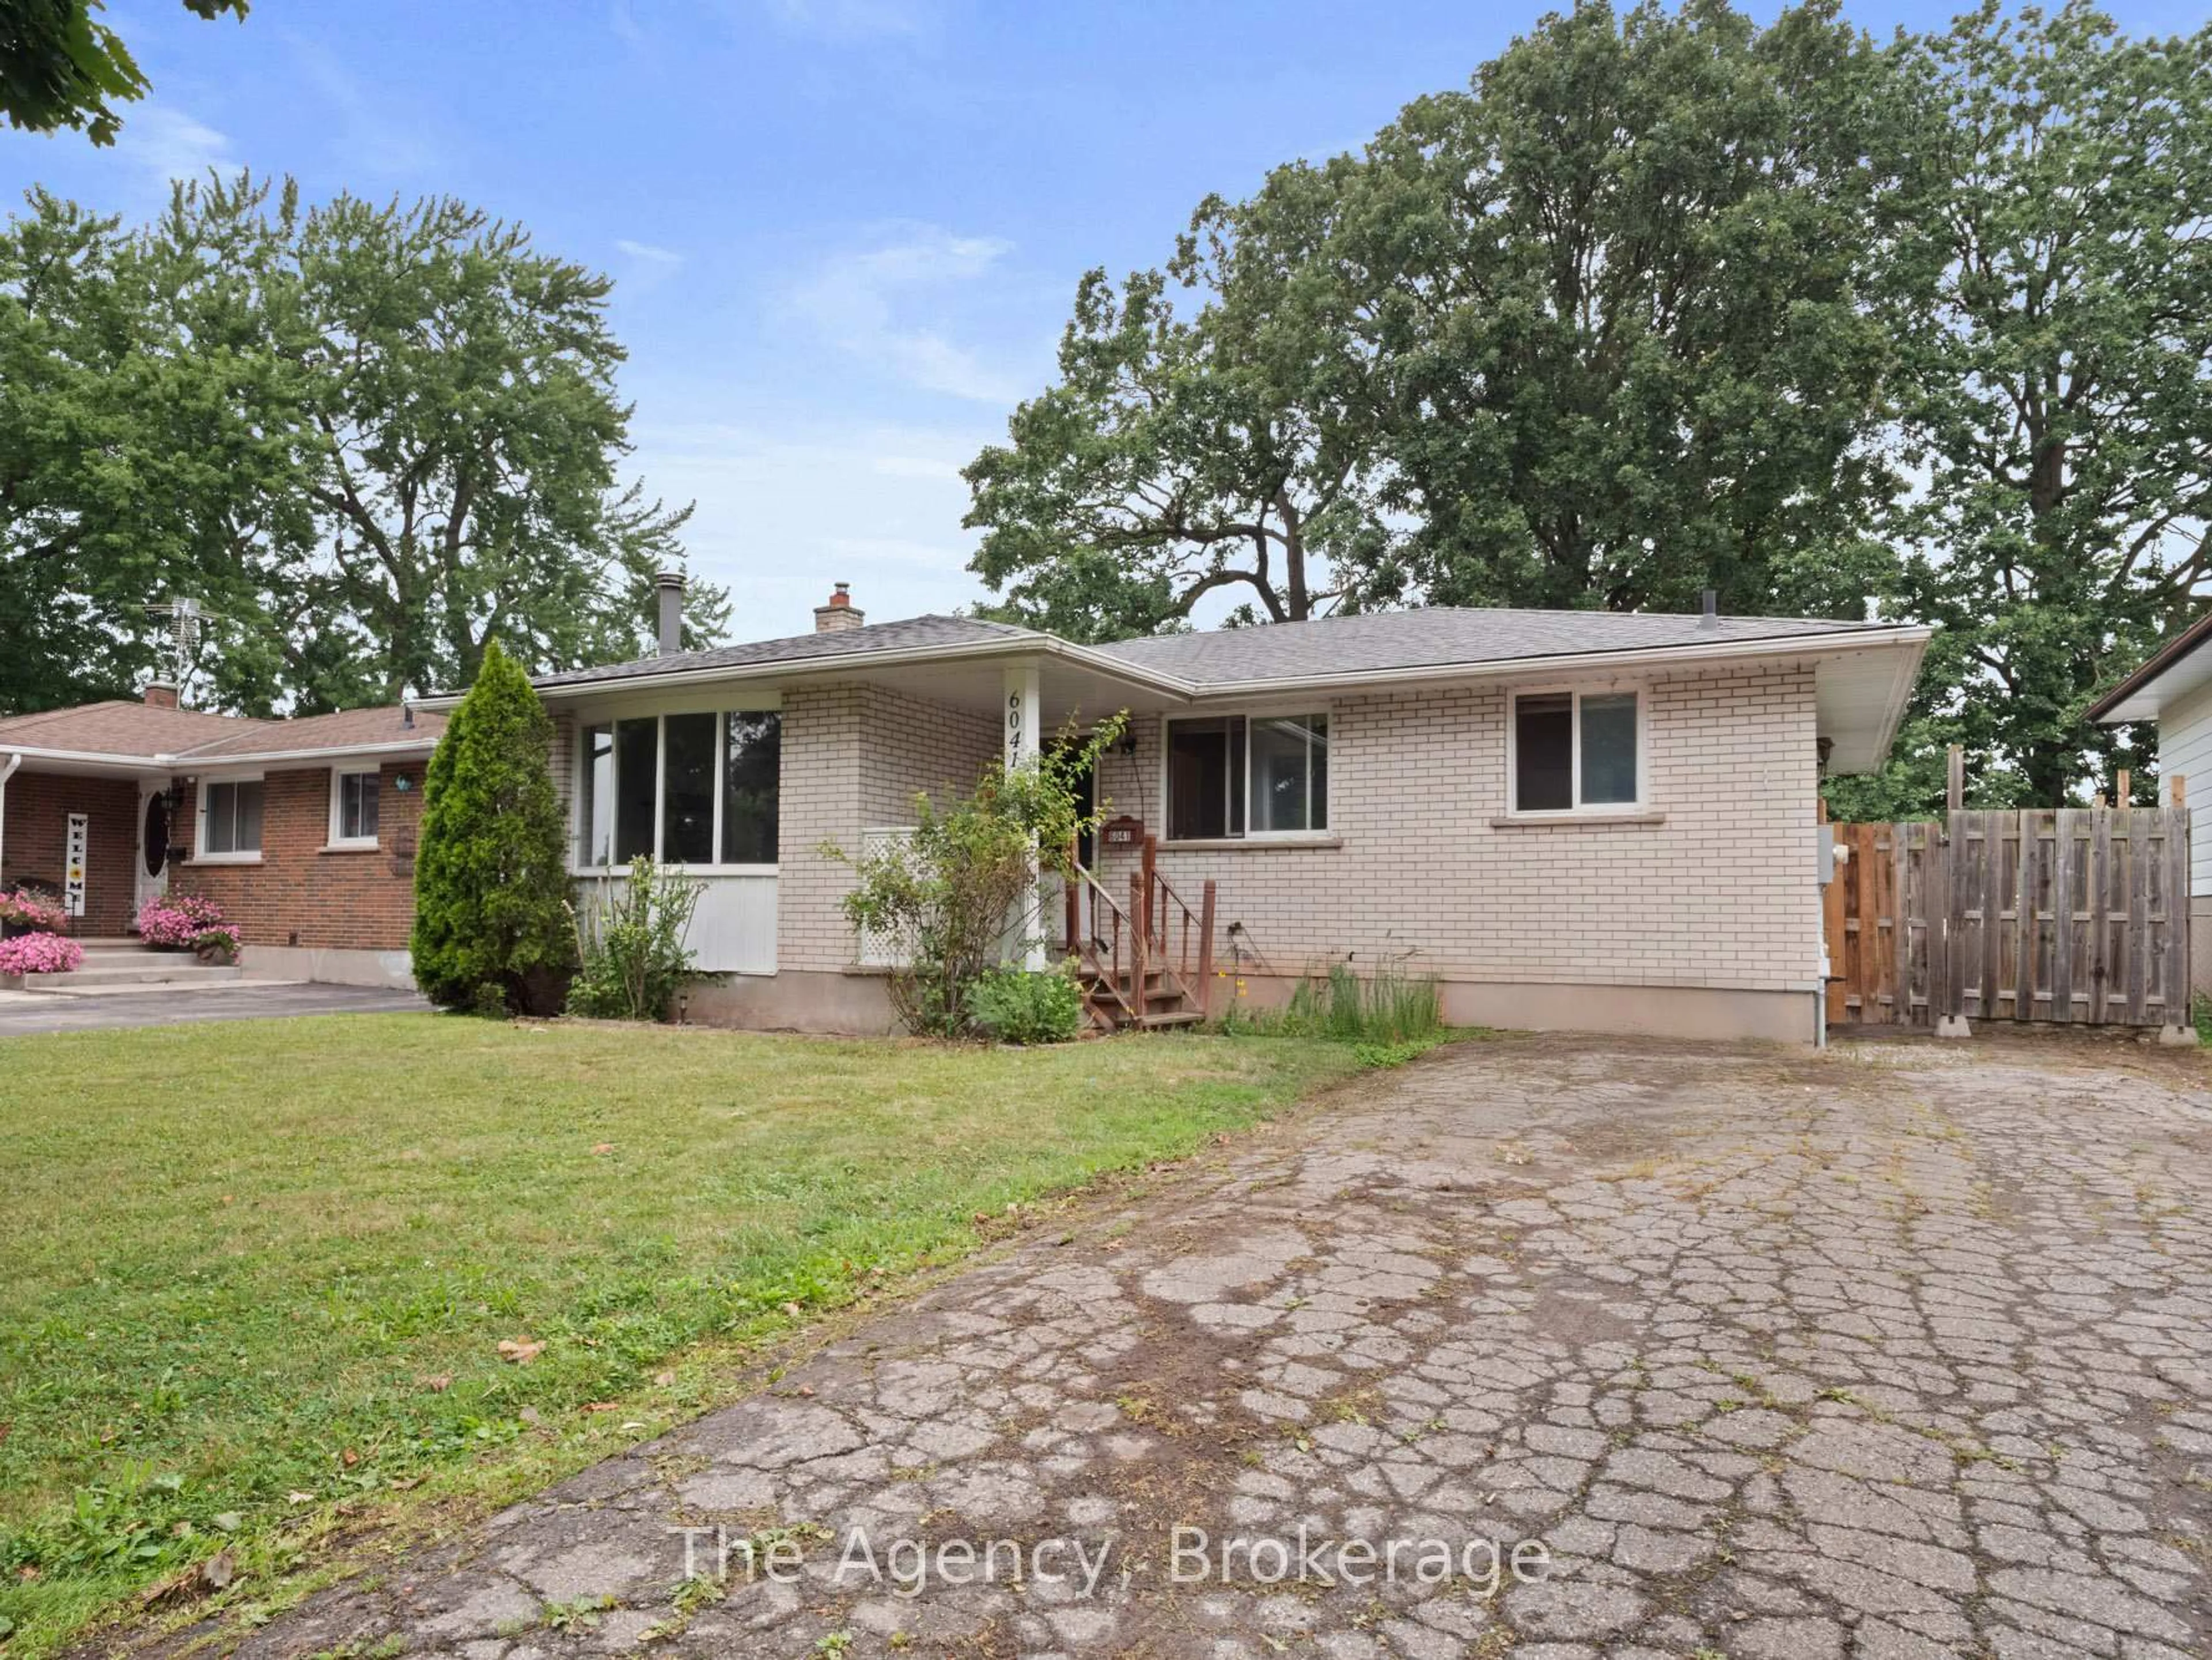
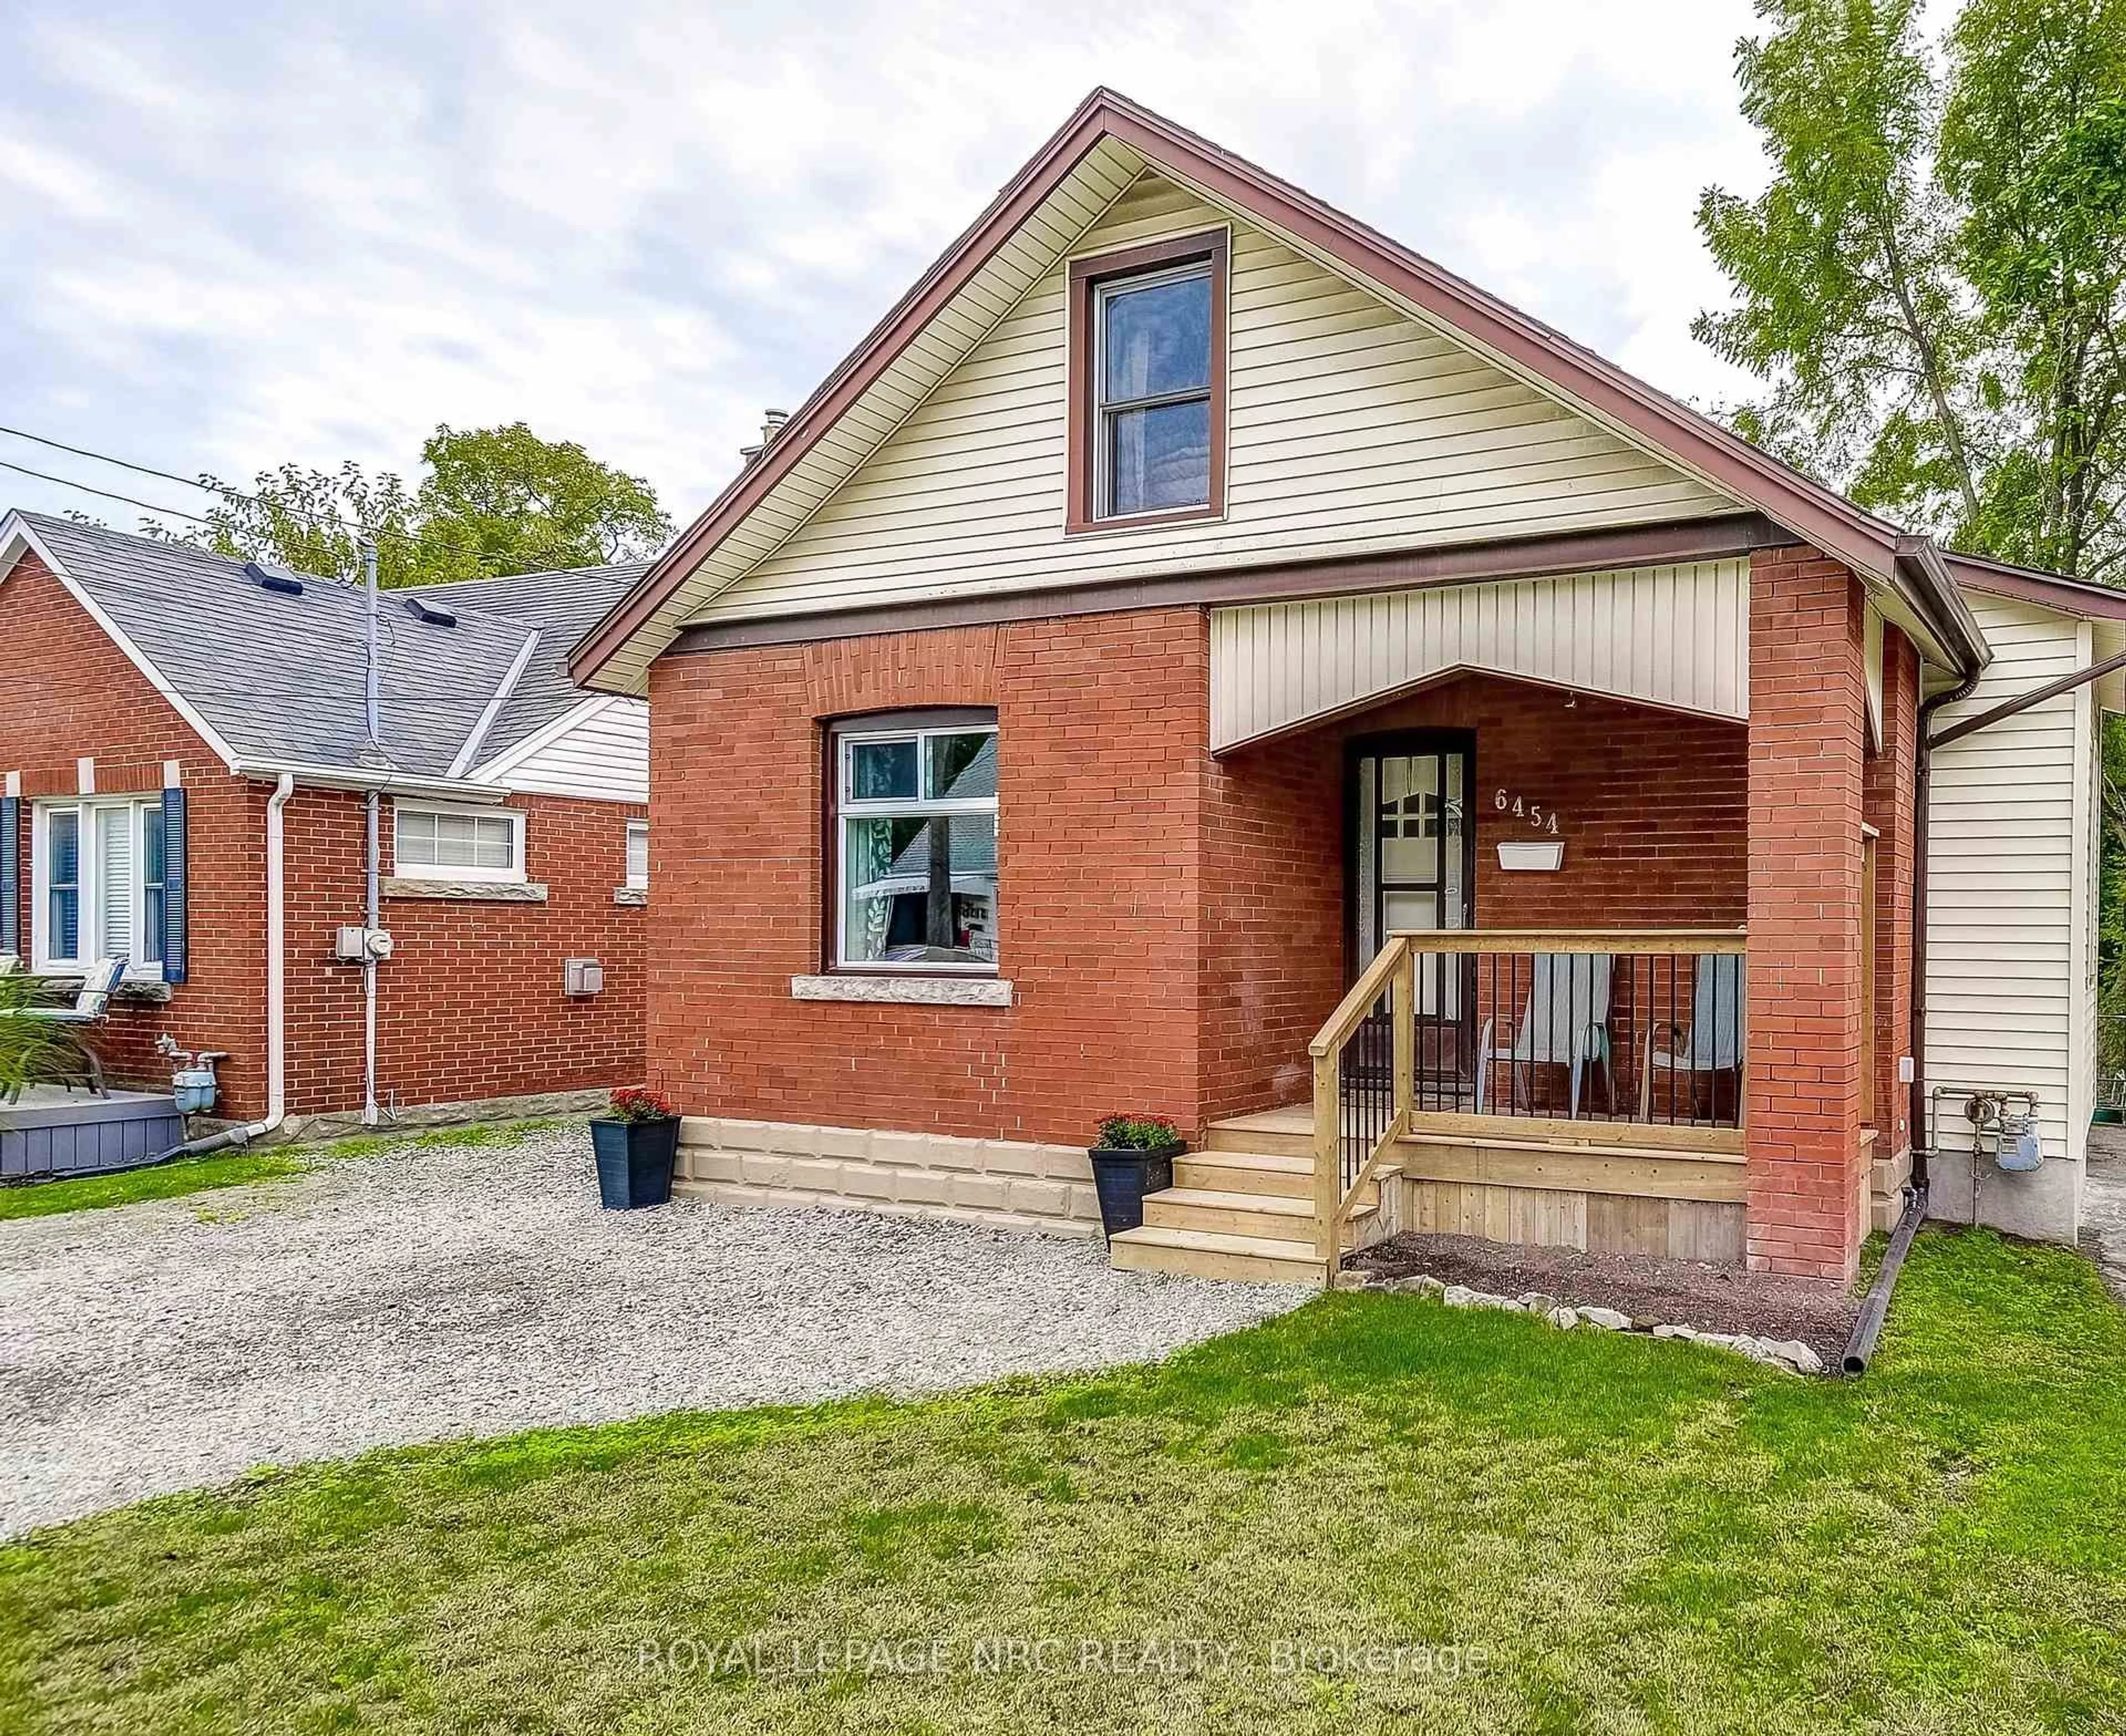
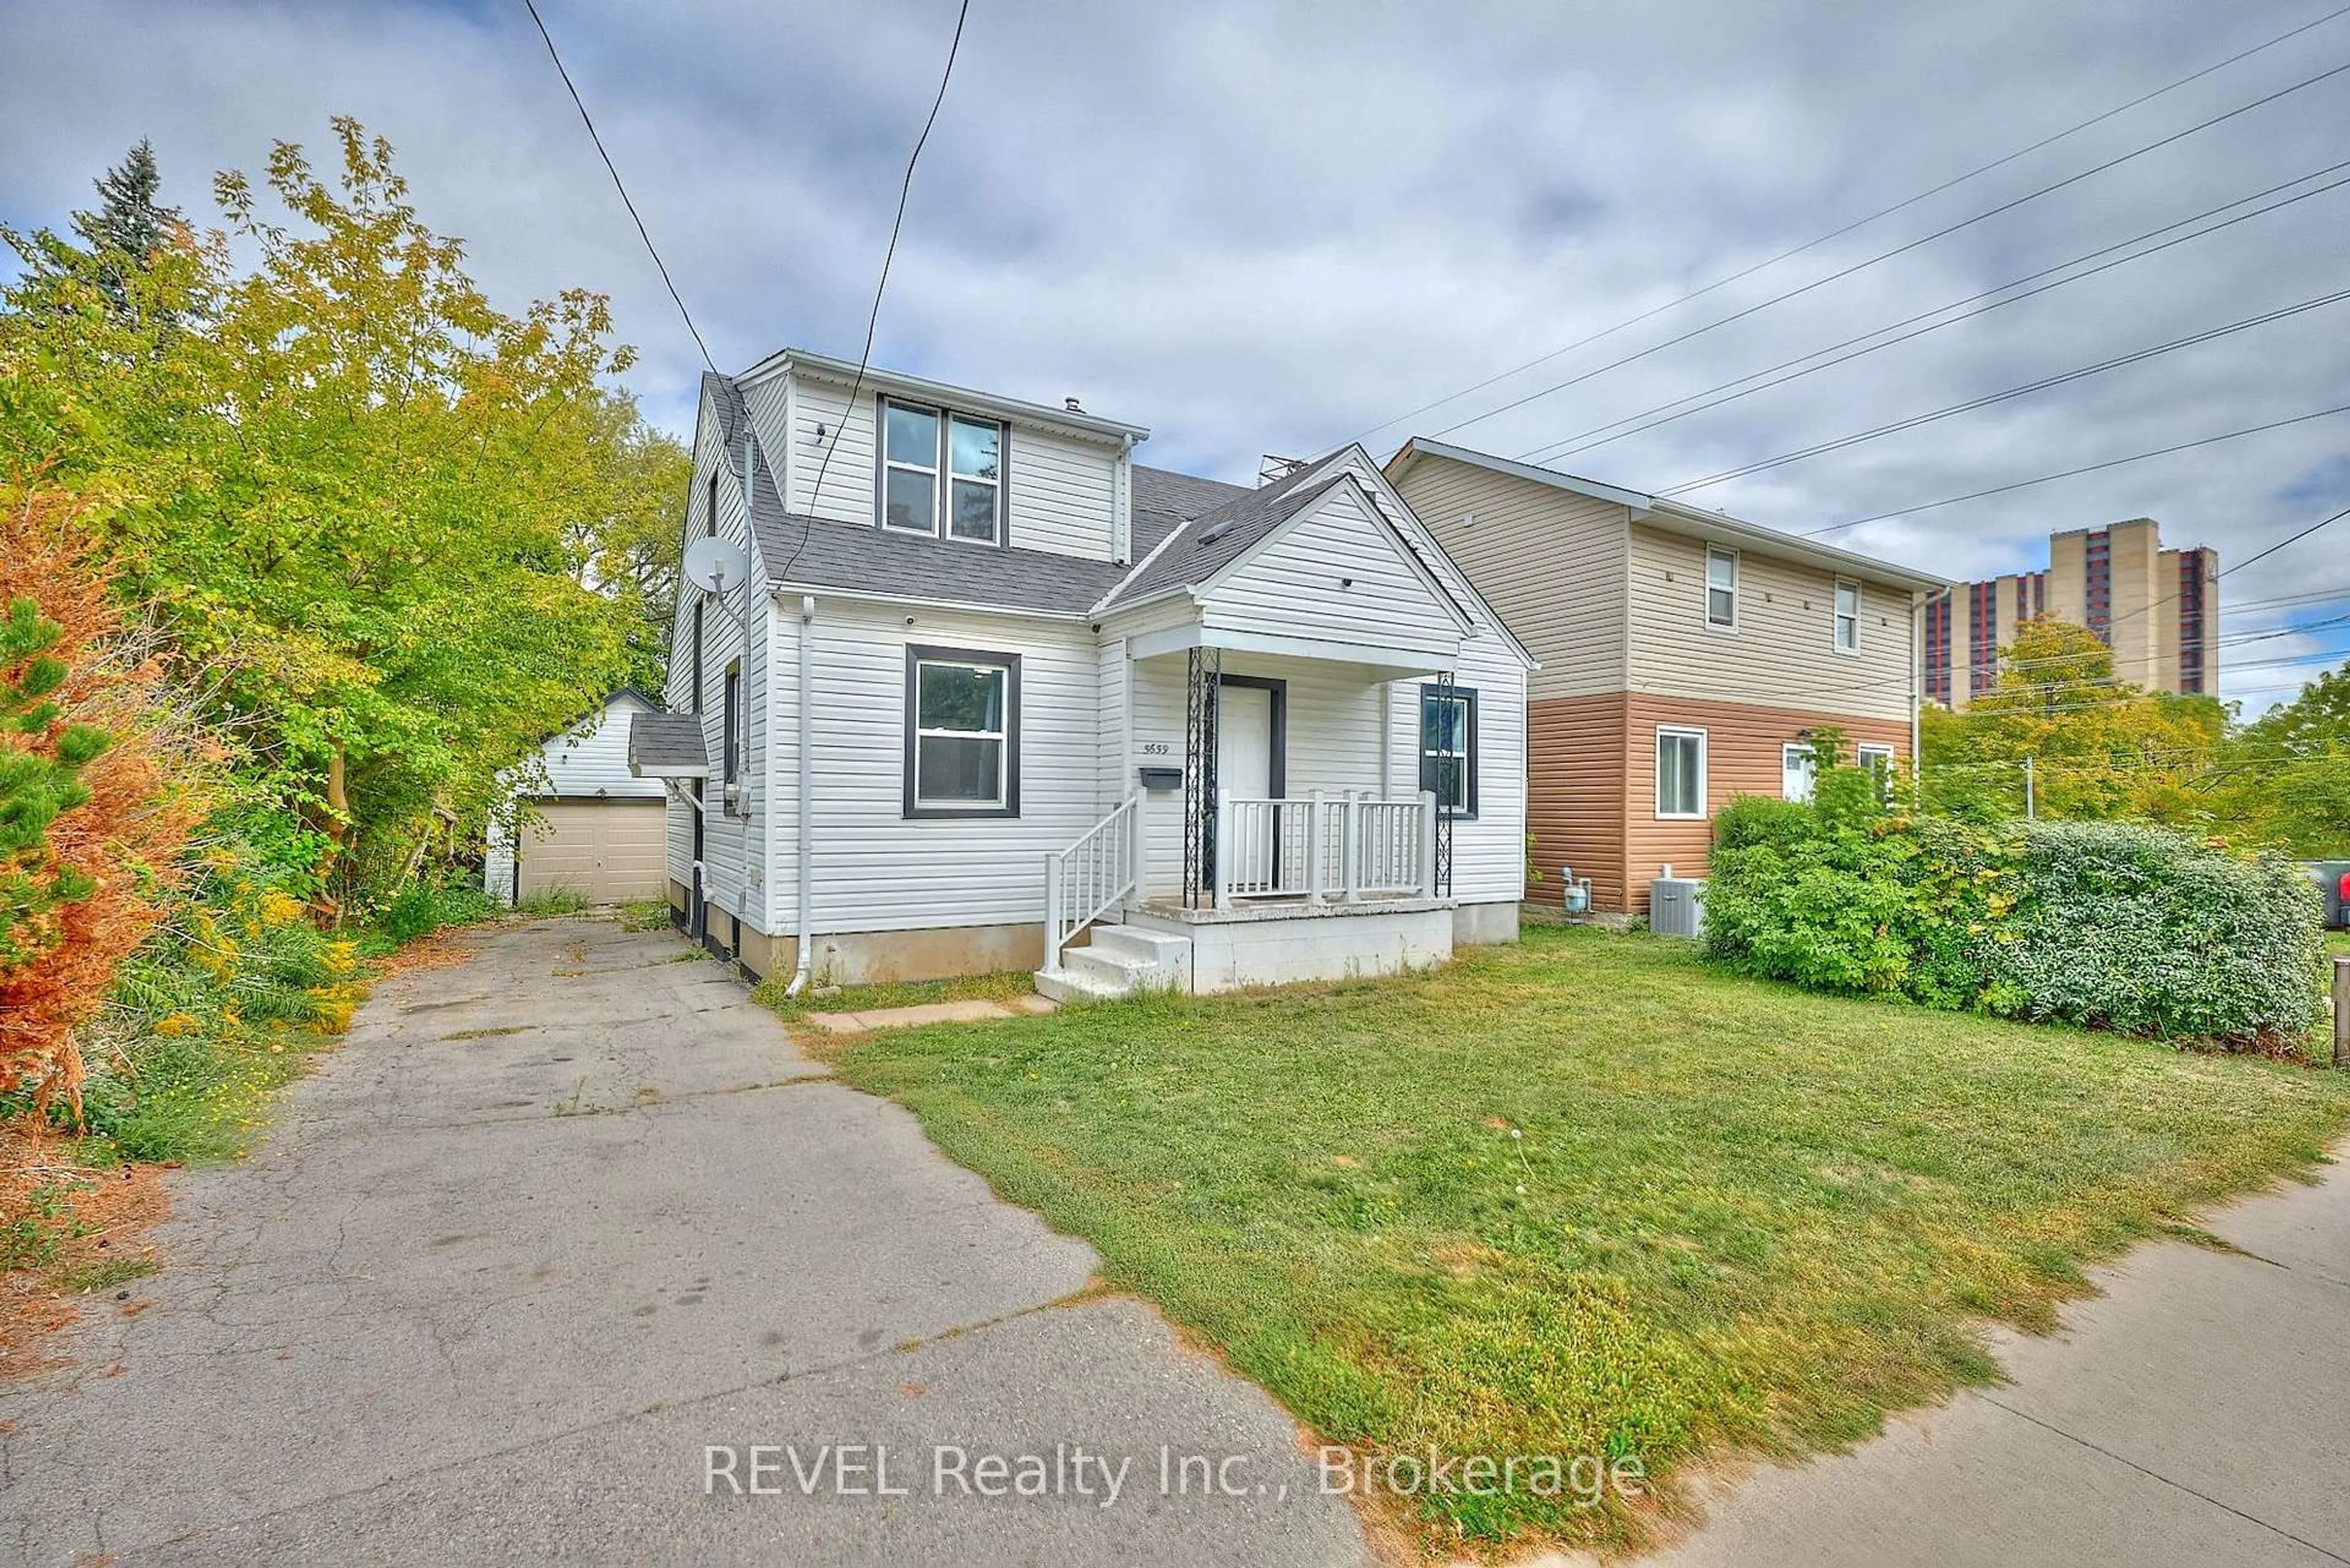
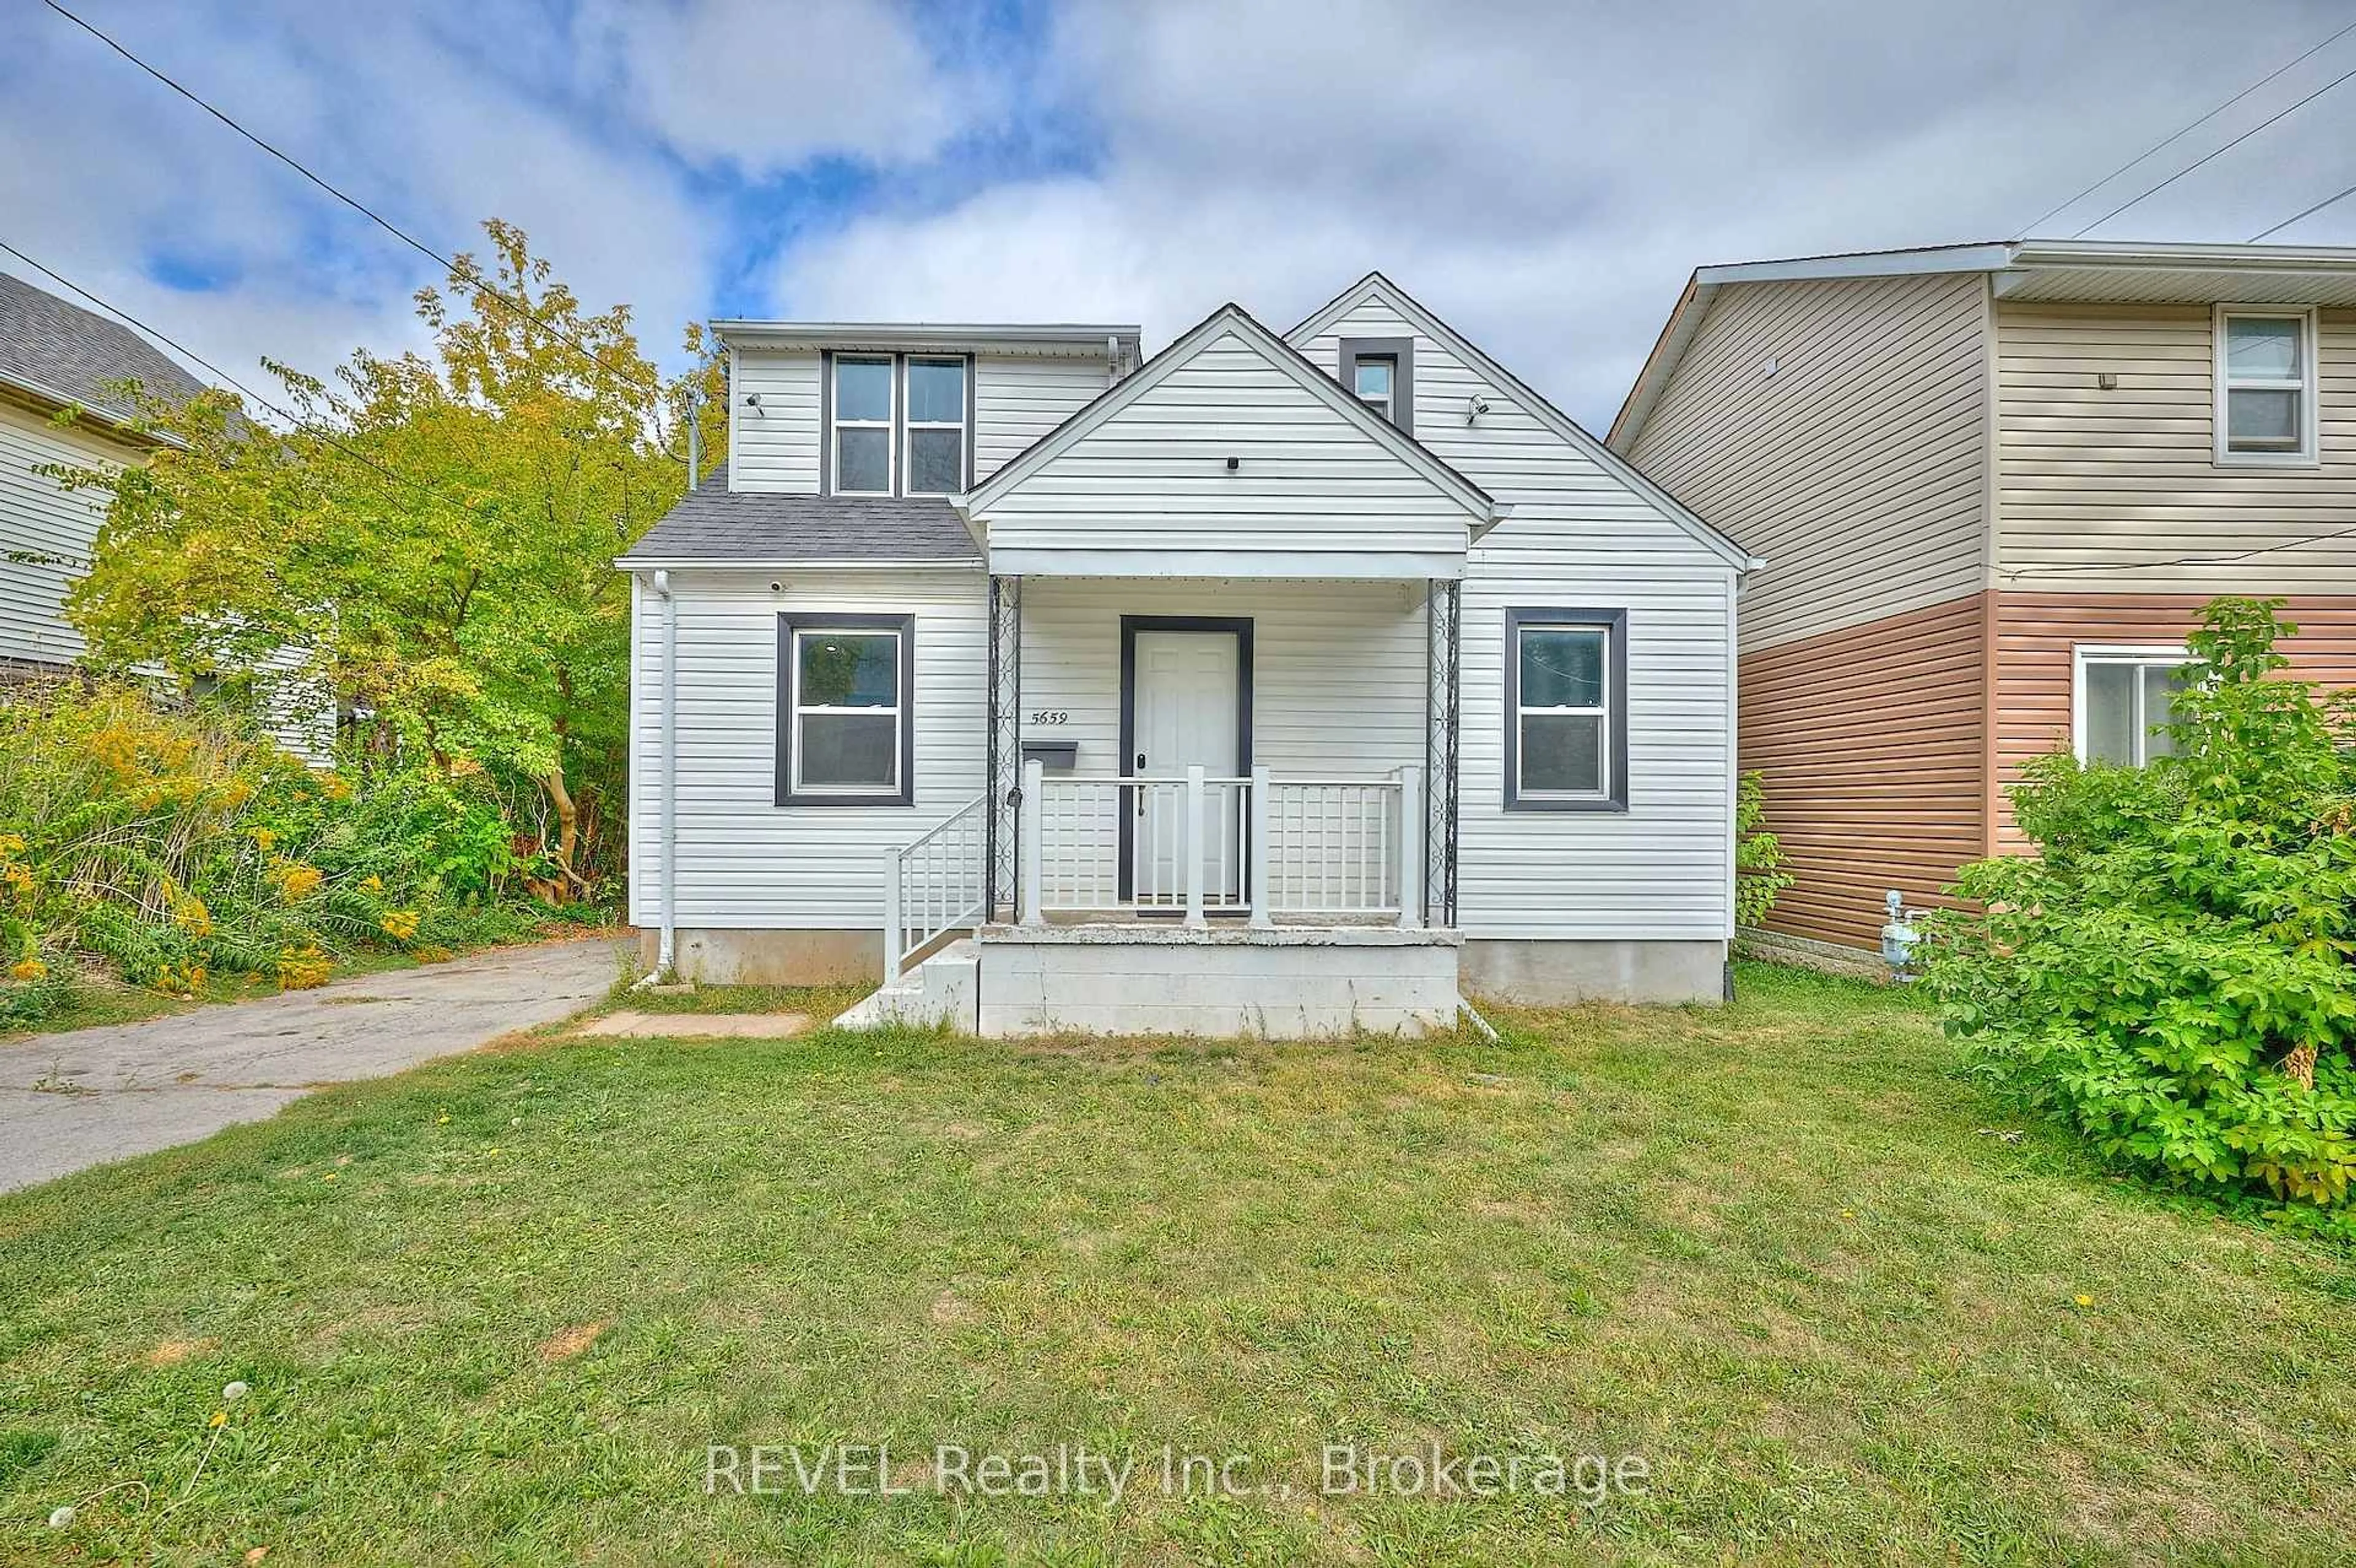
5659 Robinson St, Niagara Falls, Ontario L2G 2B1
Detached
6
3
~< 700 sqft
$•••,•••
$629,000Get pre-qualifiedPowered by nesto
Detached
6
3
~< 700 sqft
Contact us about this property
Highlights
Days on market150 days
Estimated valueThis is the price Wahi expects this property to sell for.
The calculation is powered by our Instant Home Value Estimate, which uses current market and property price trends to estimate your home’s value with a 90% accuracy rate.Not available
Price/Sqft$449/sqft
Monthly cost
Open Calculator
Description
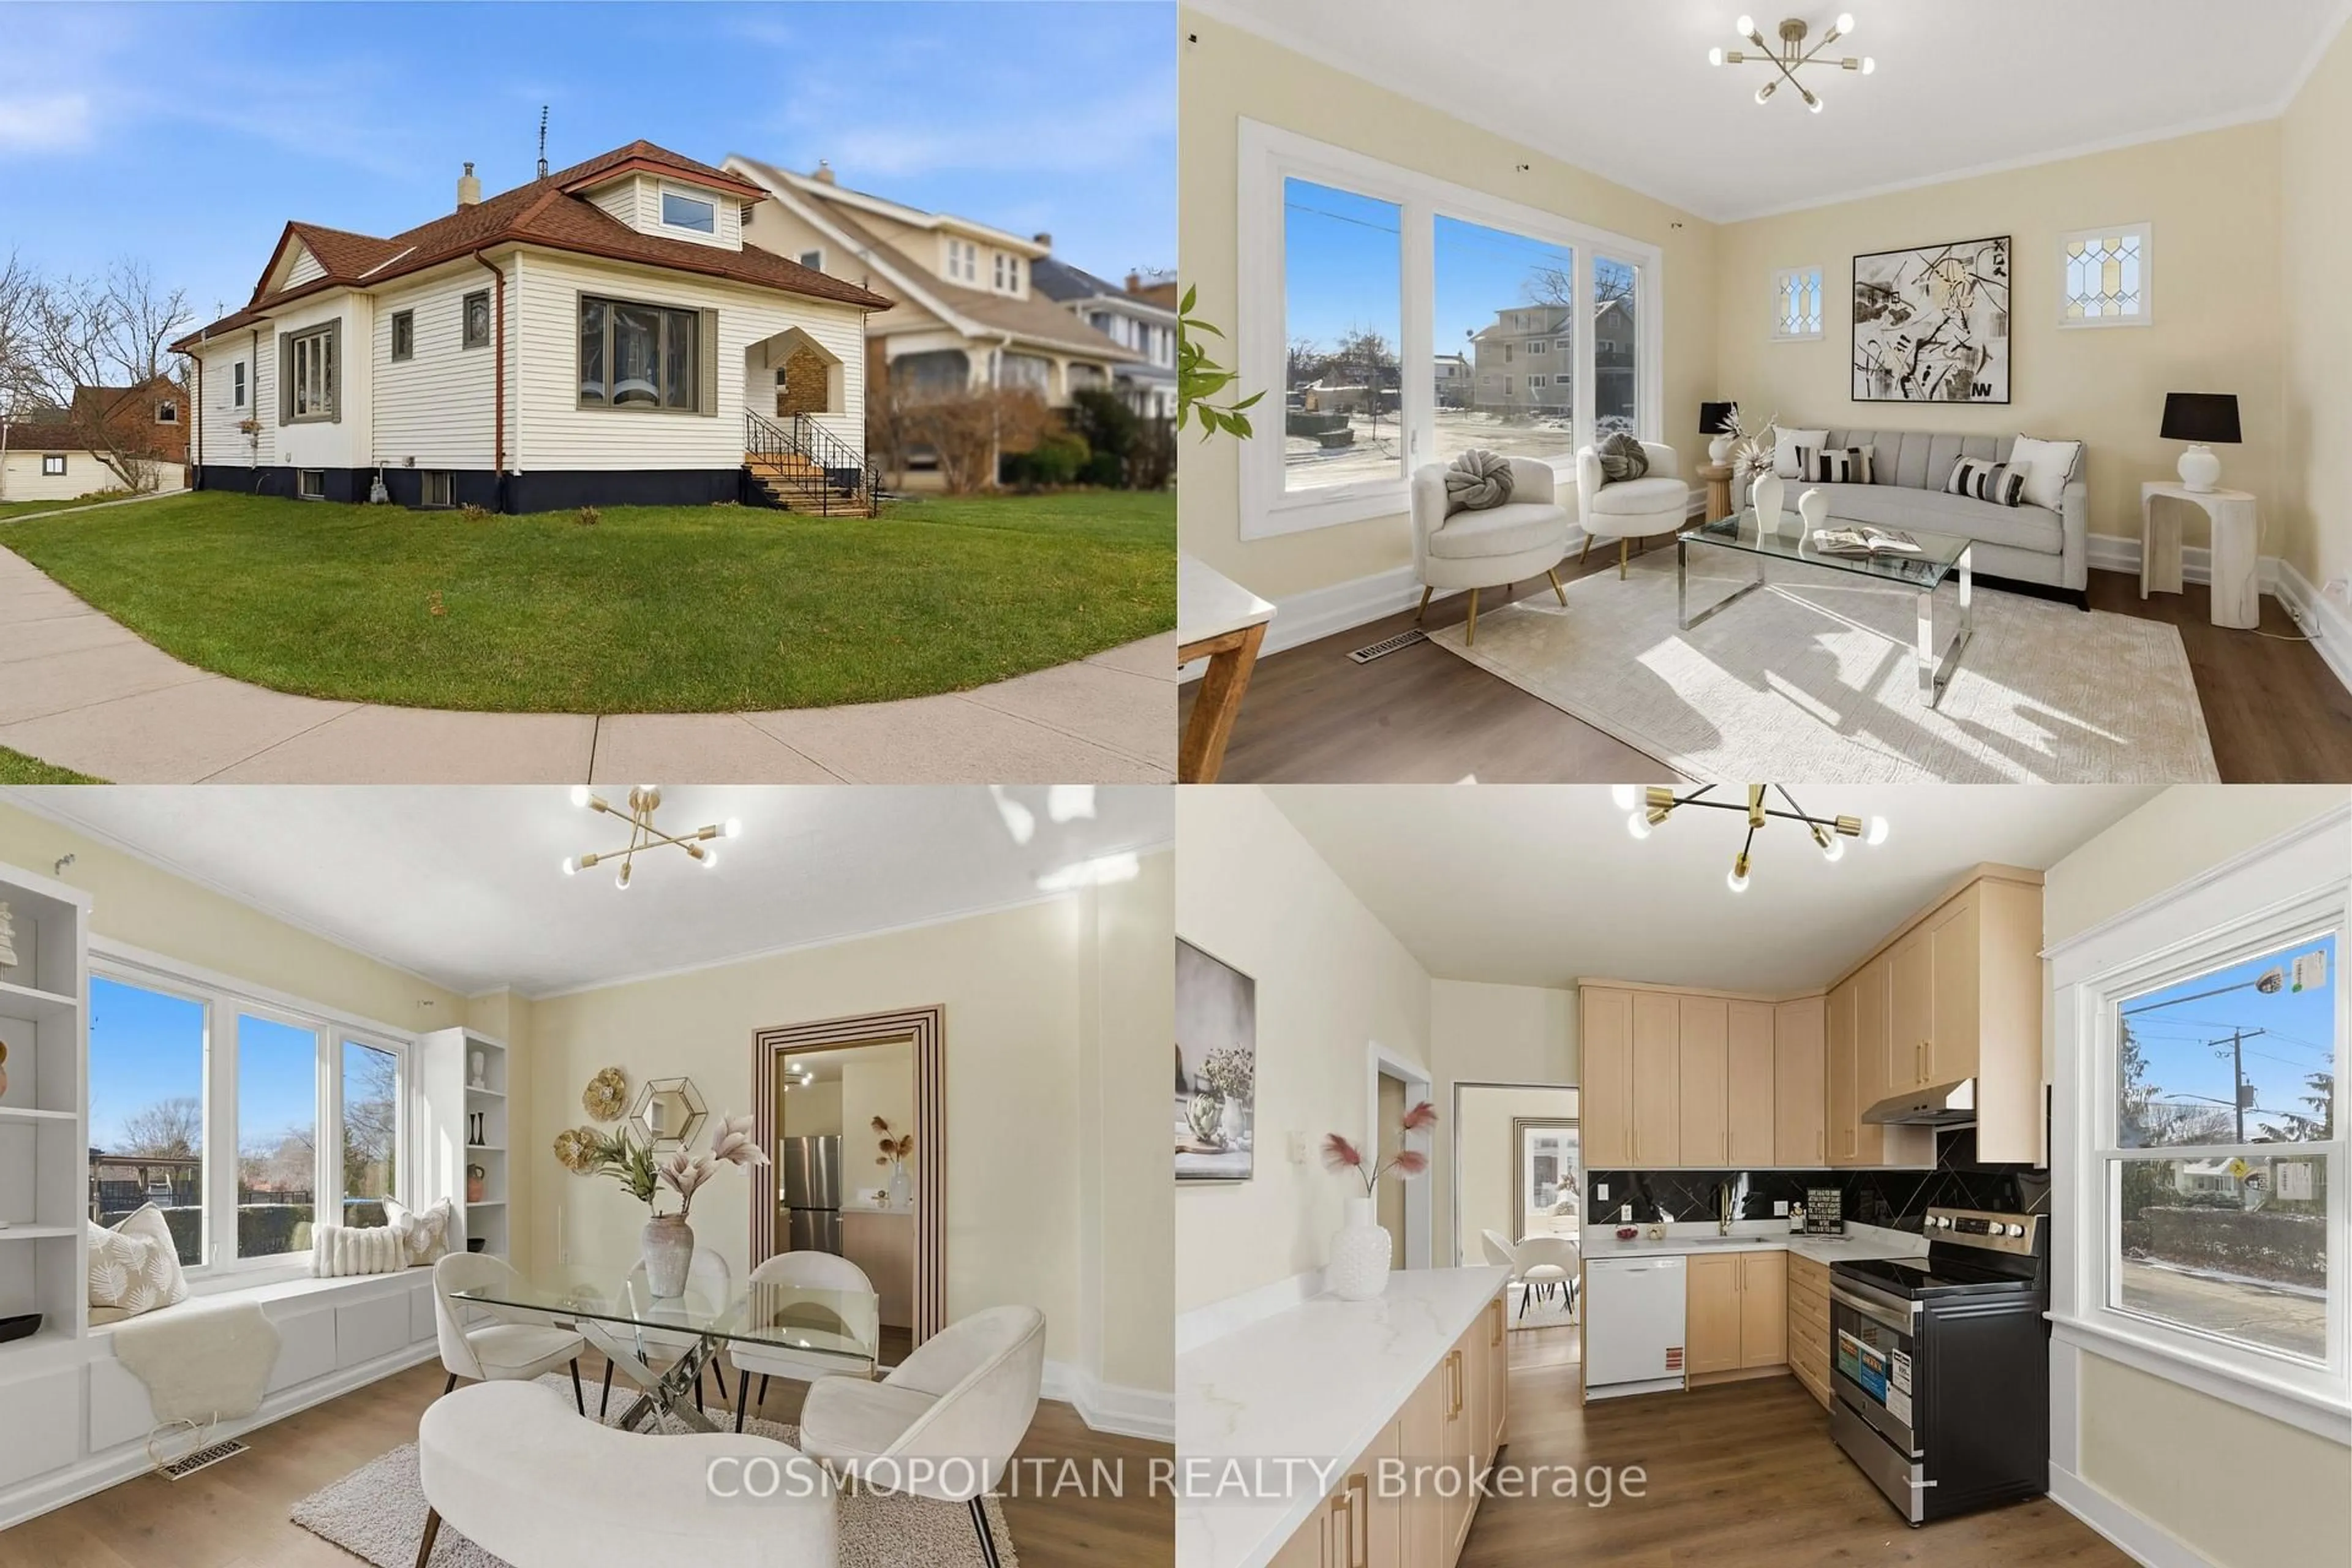
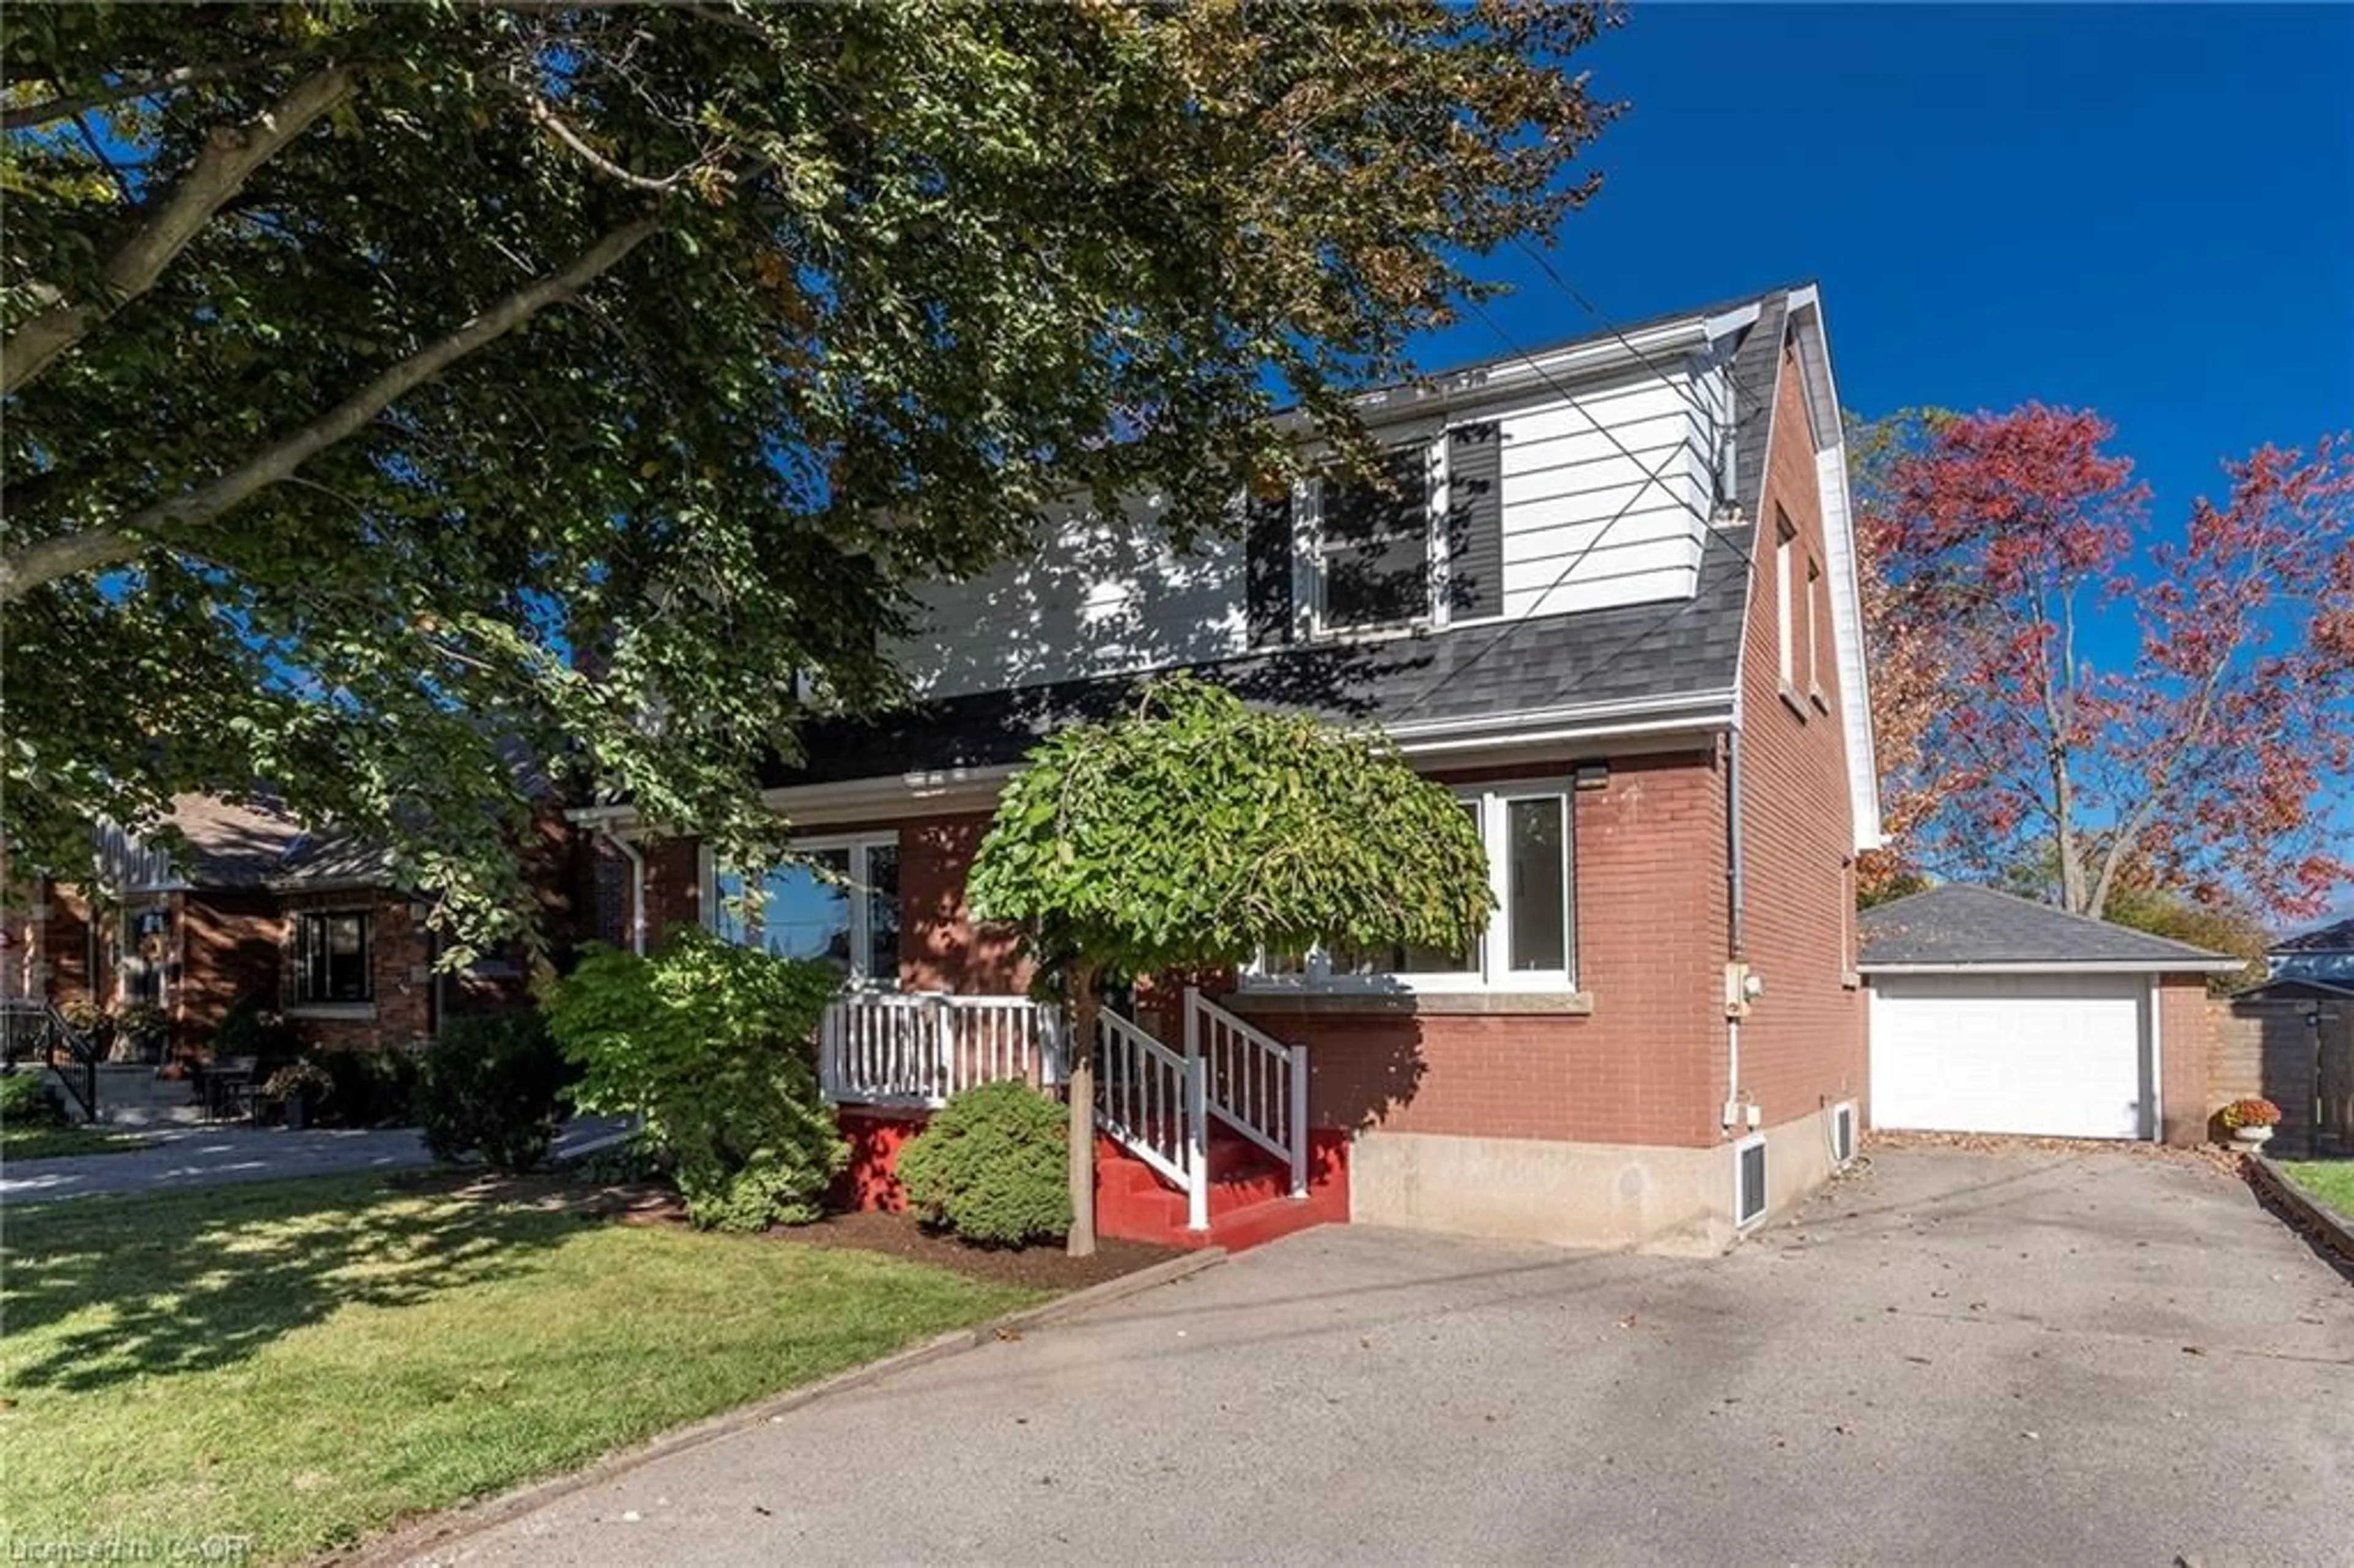
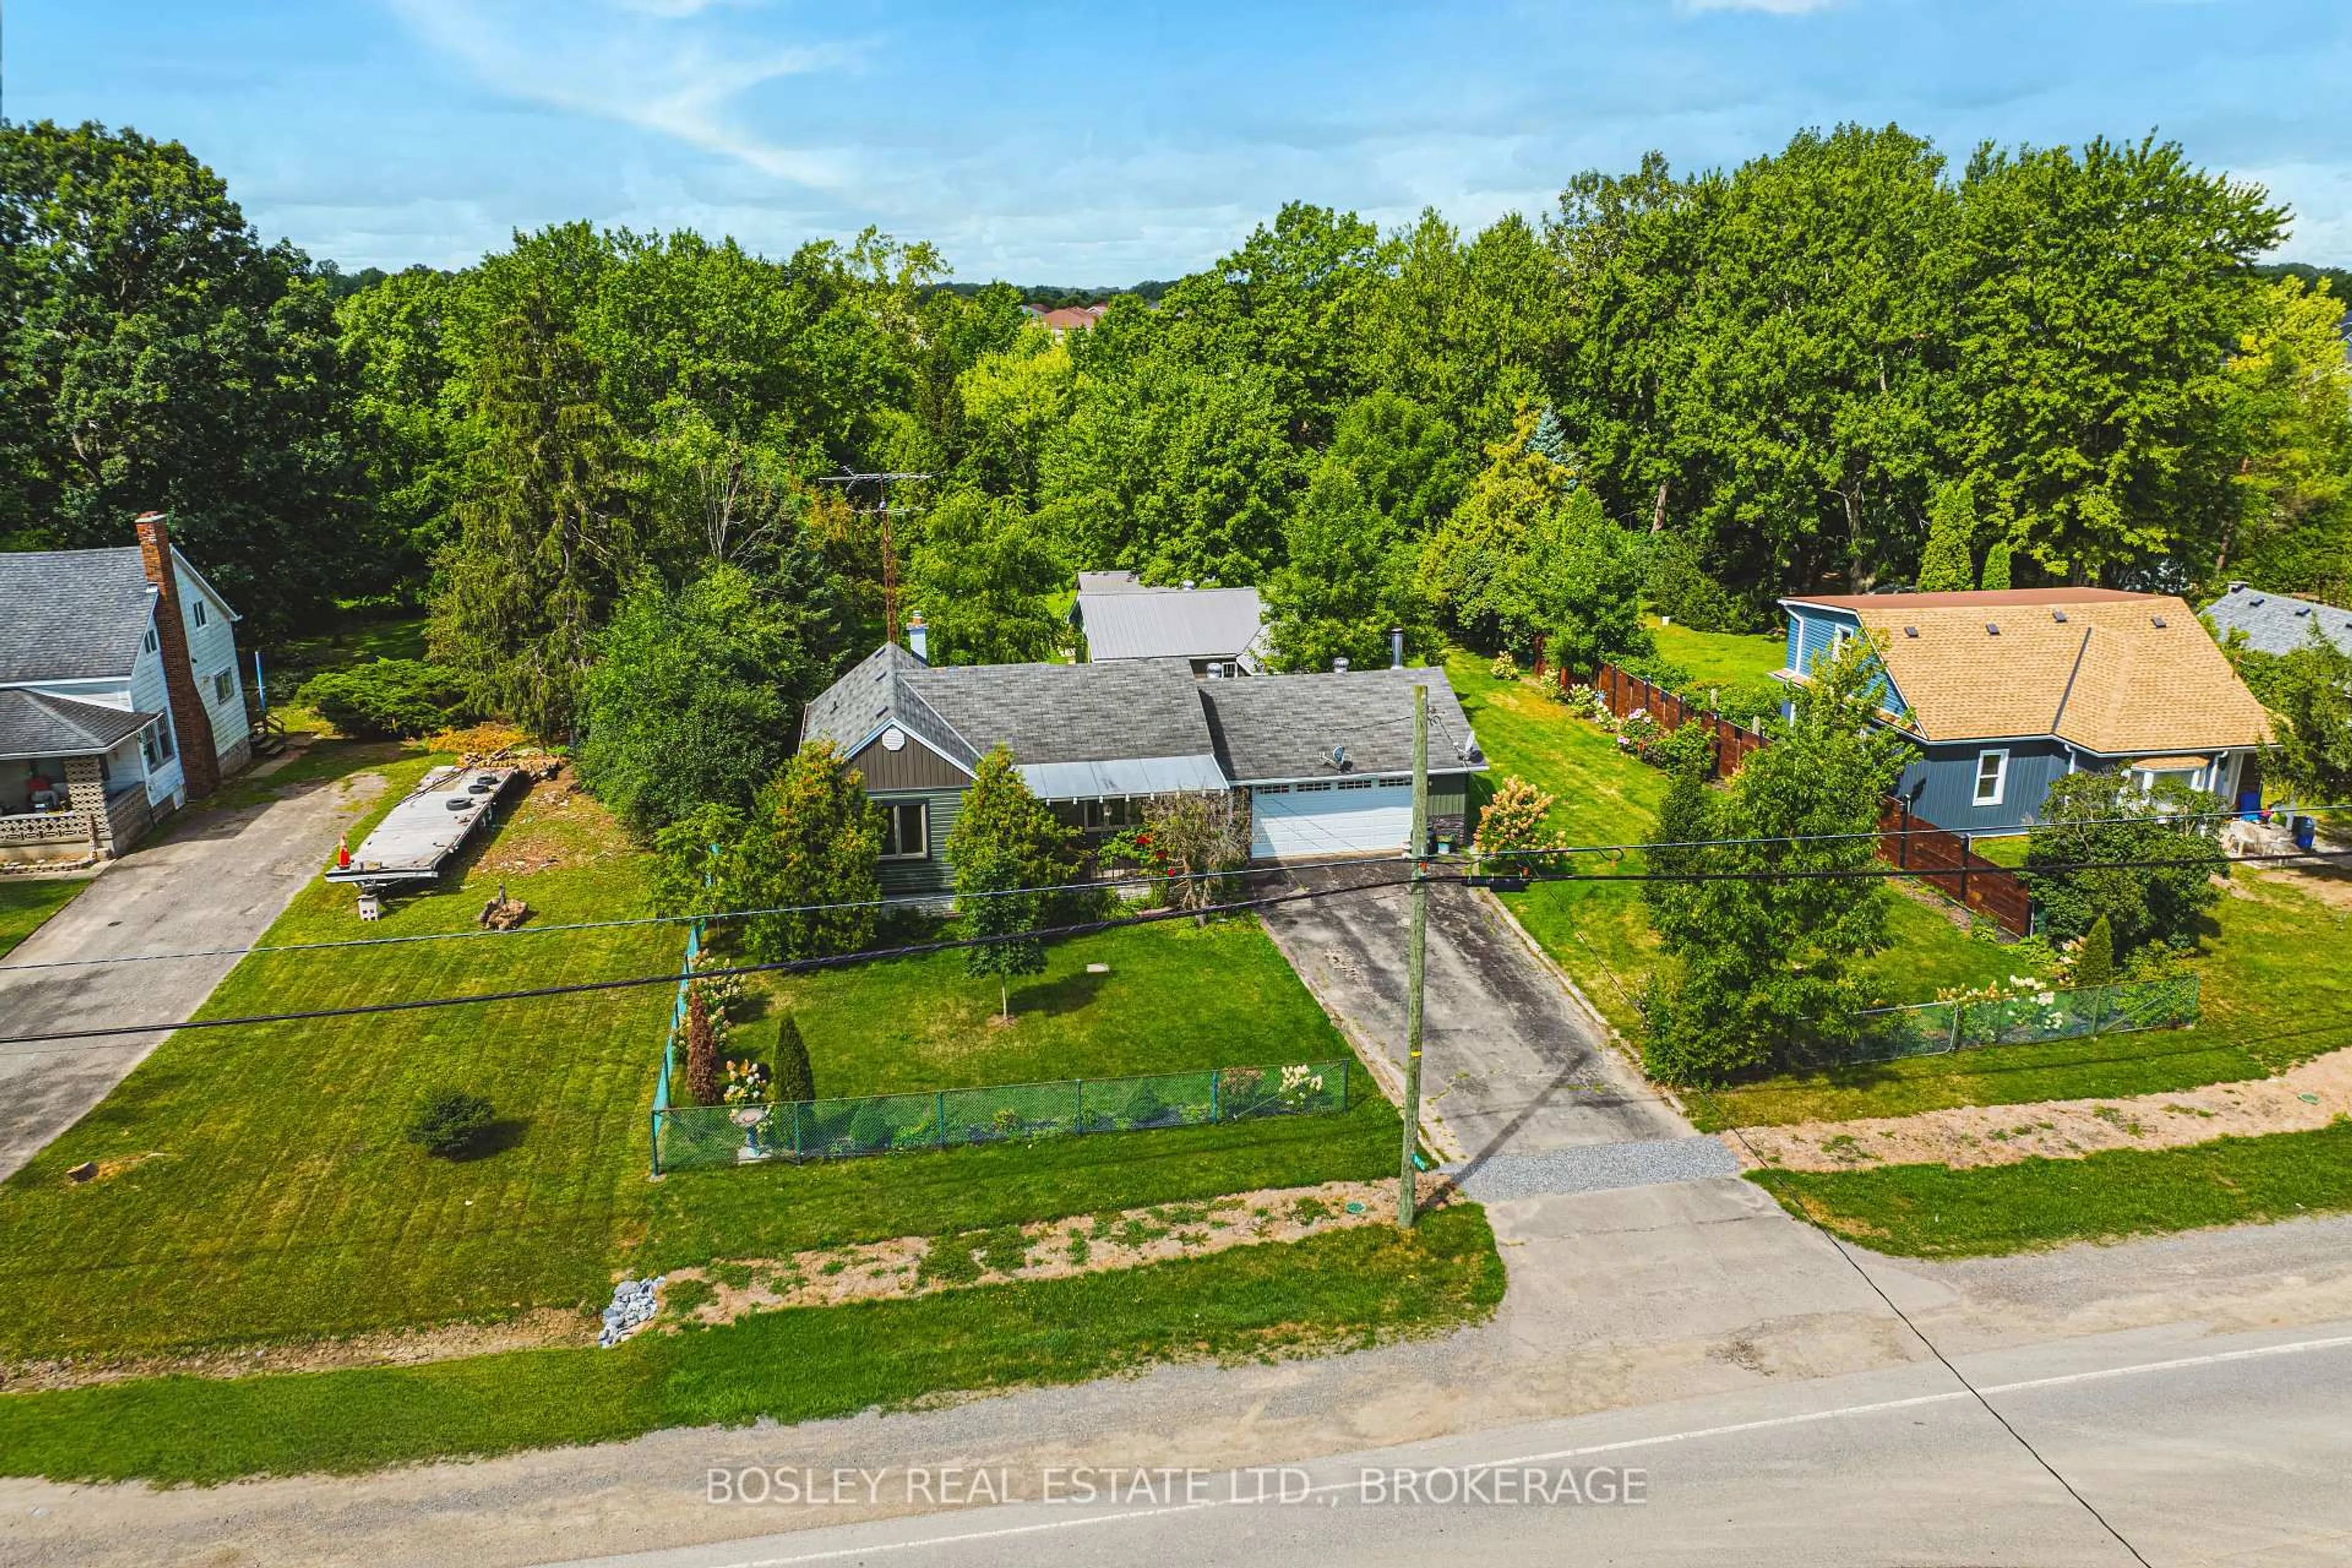
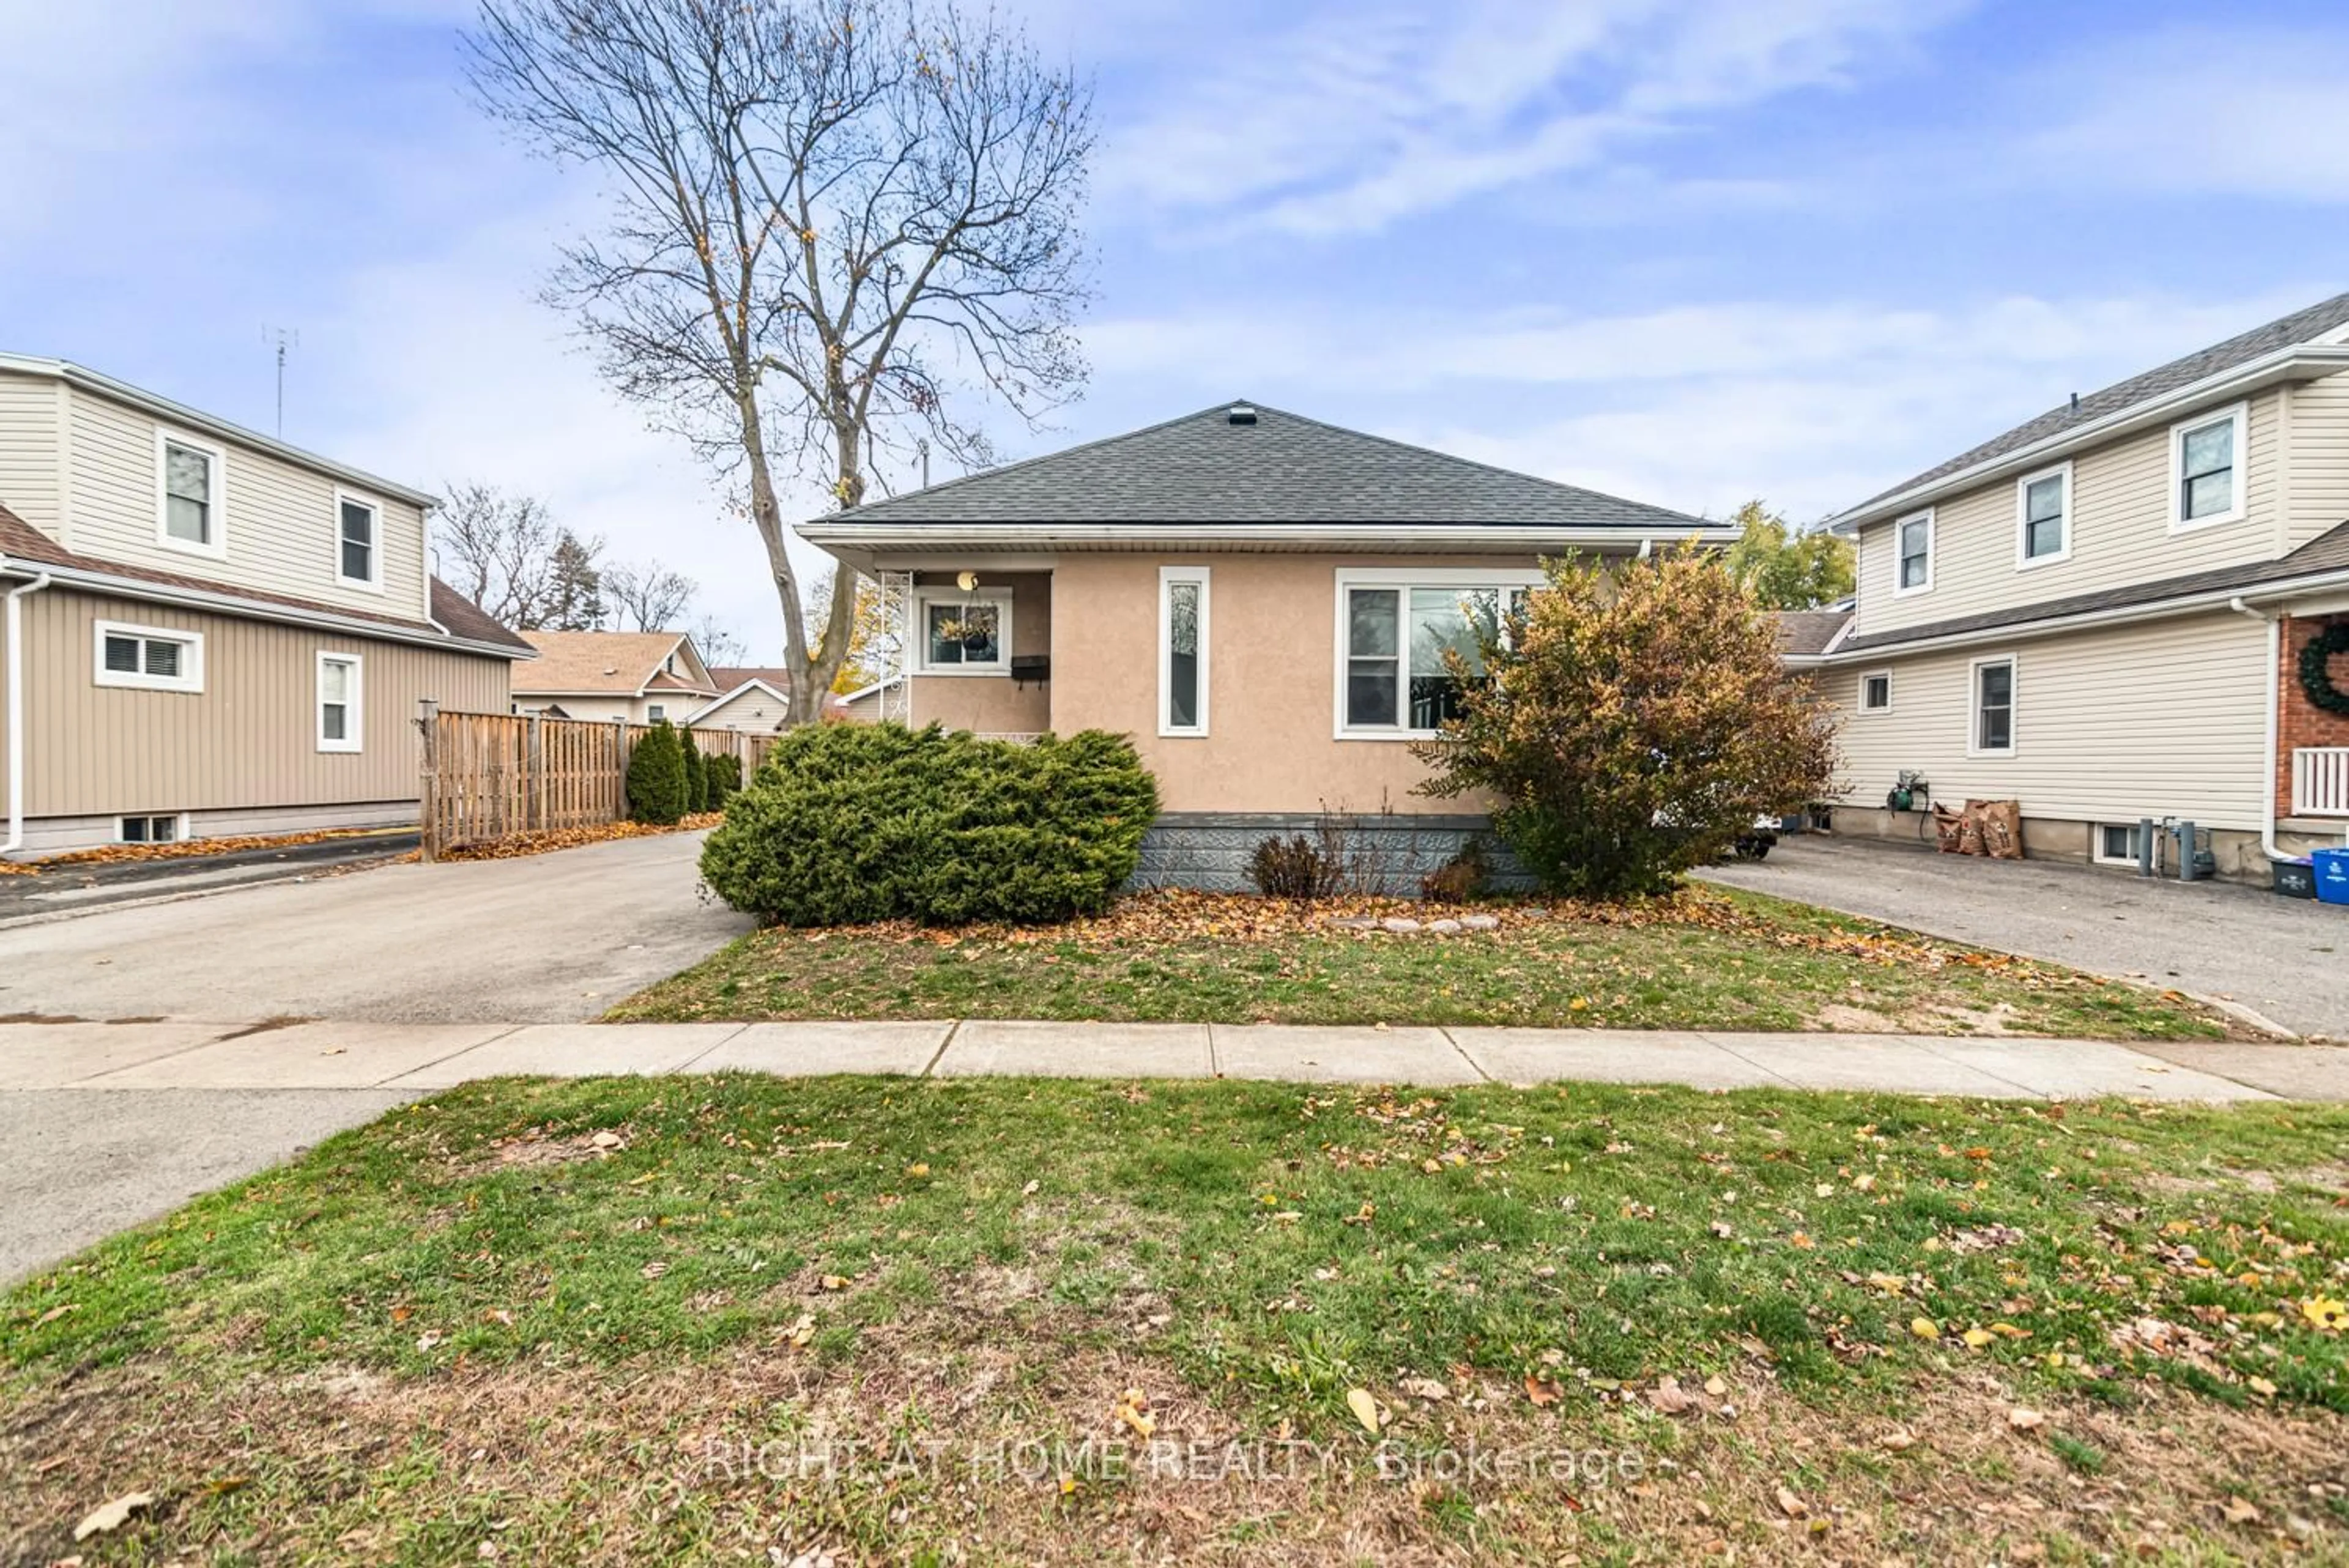
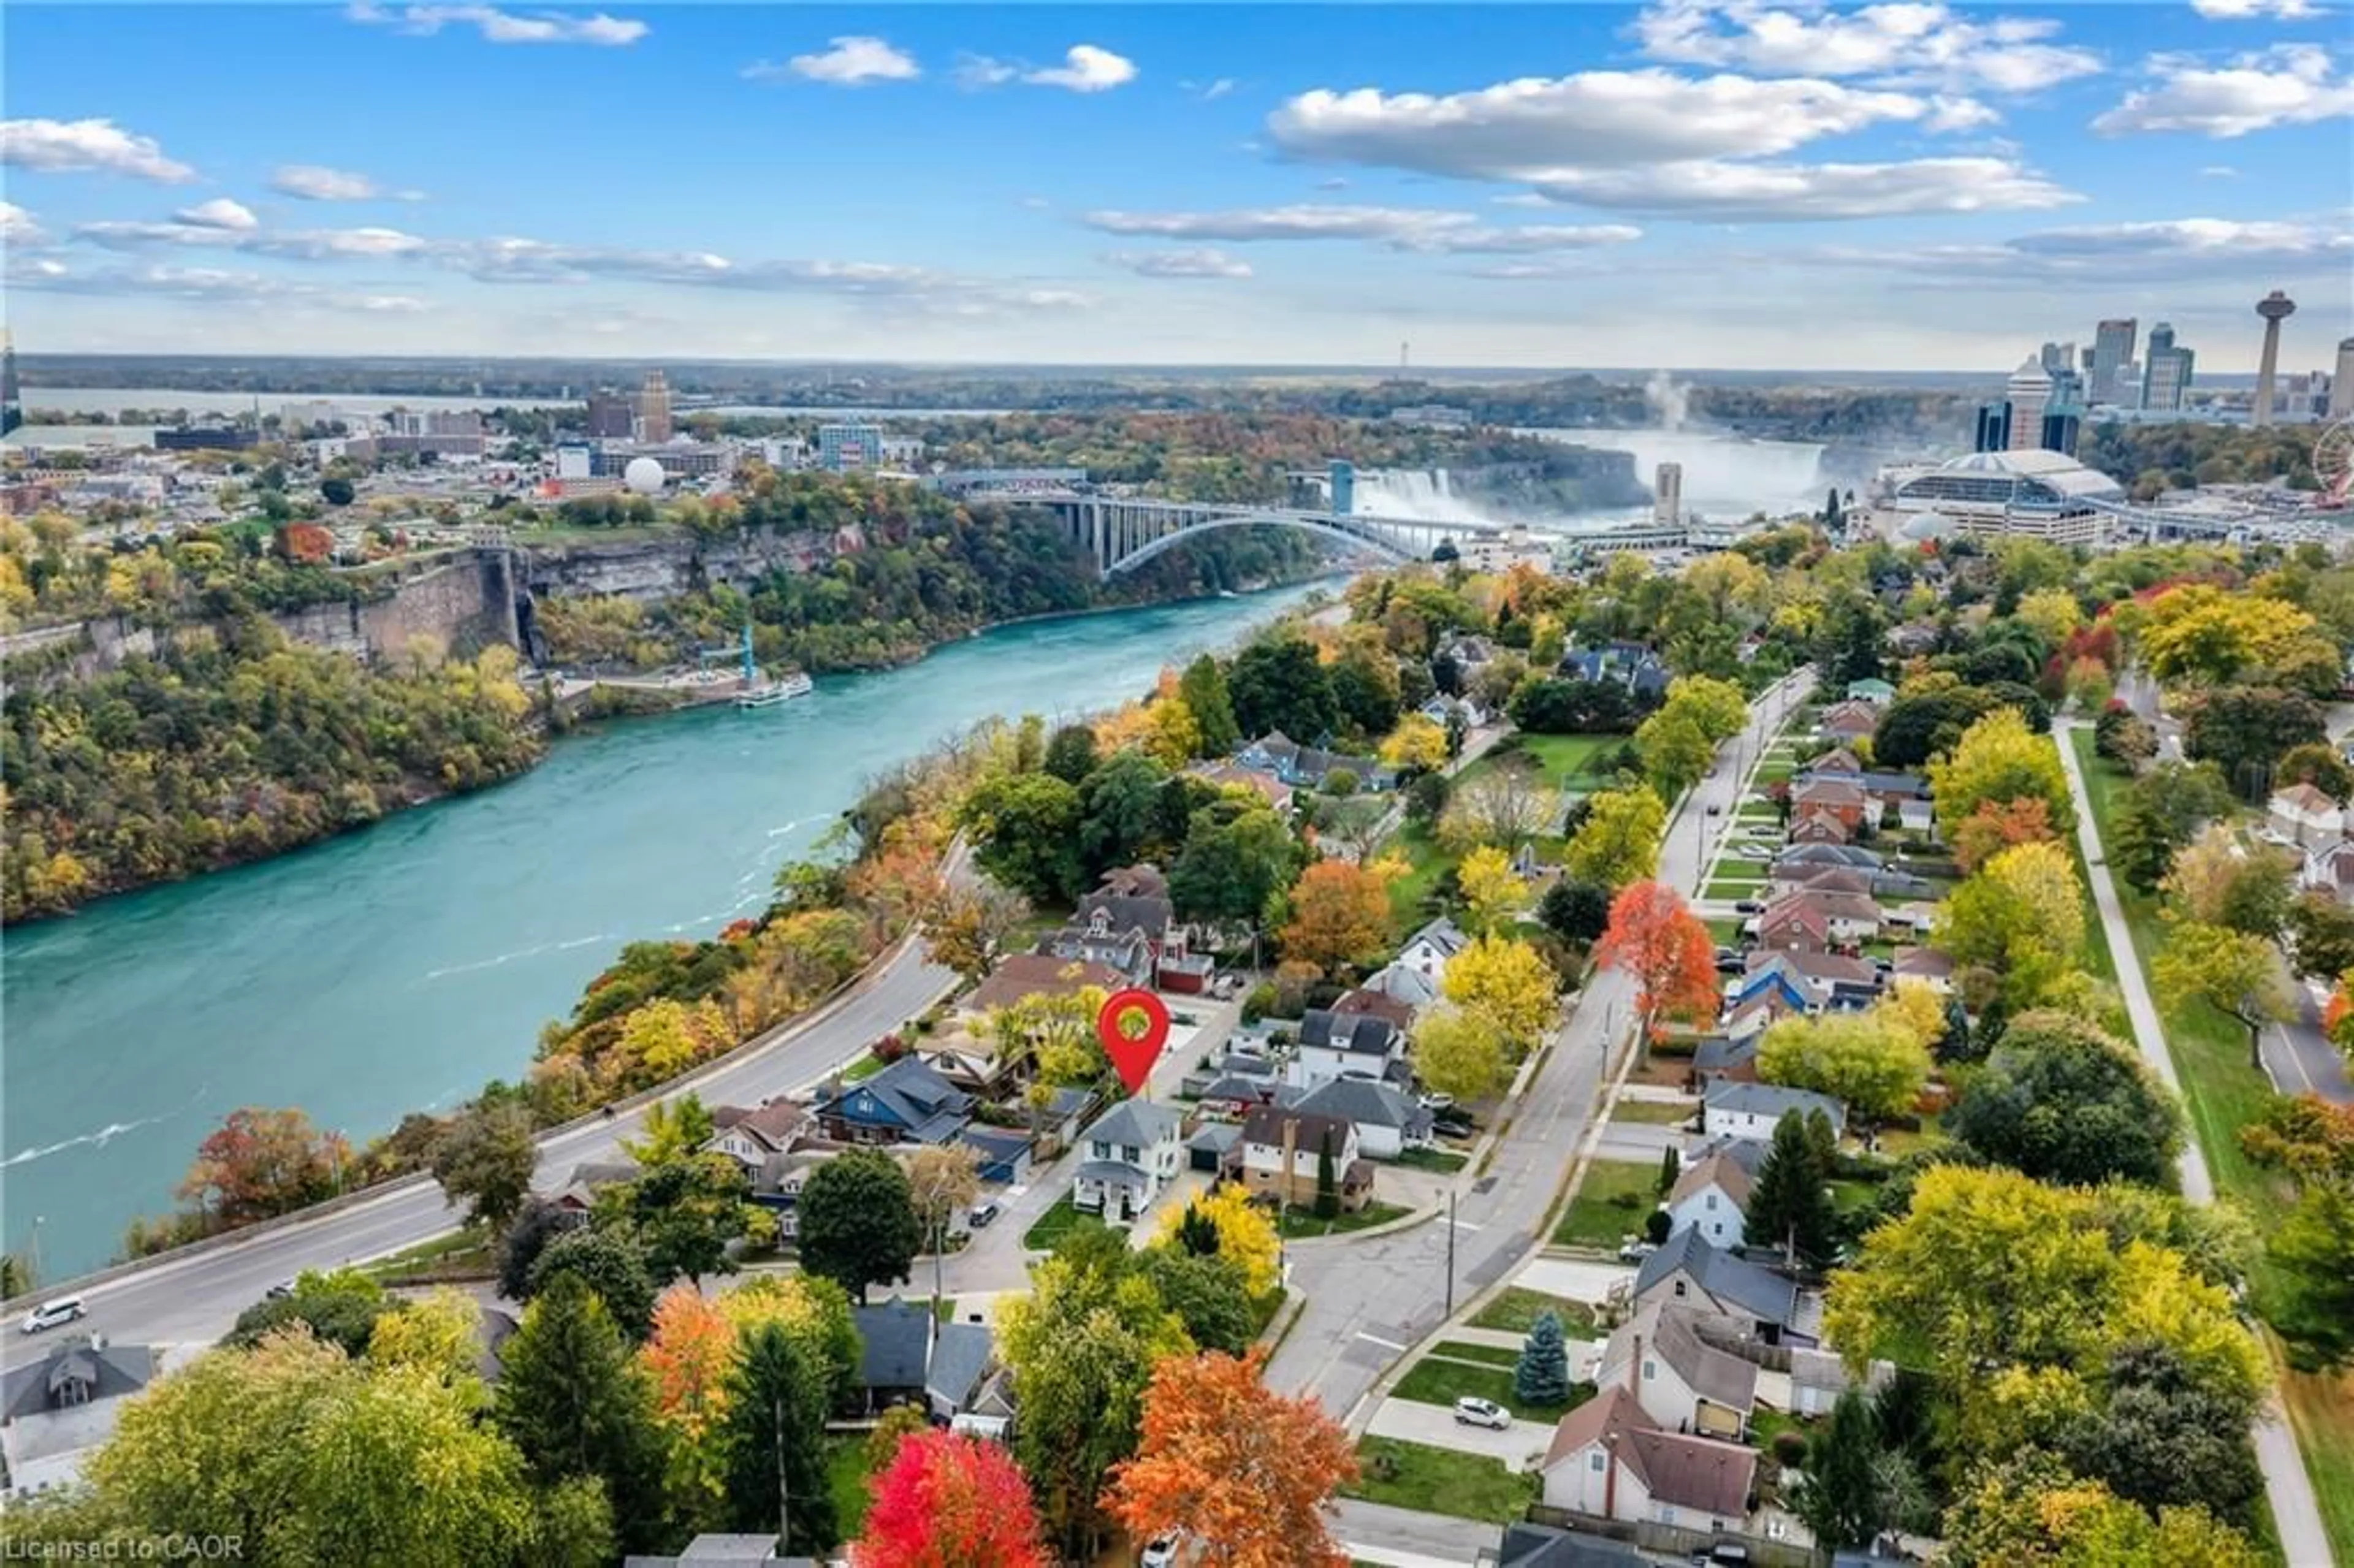
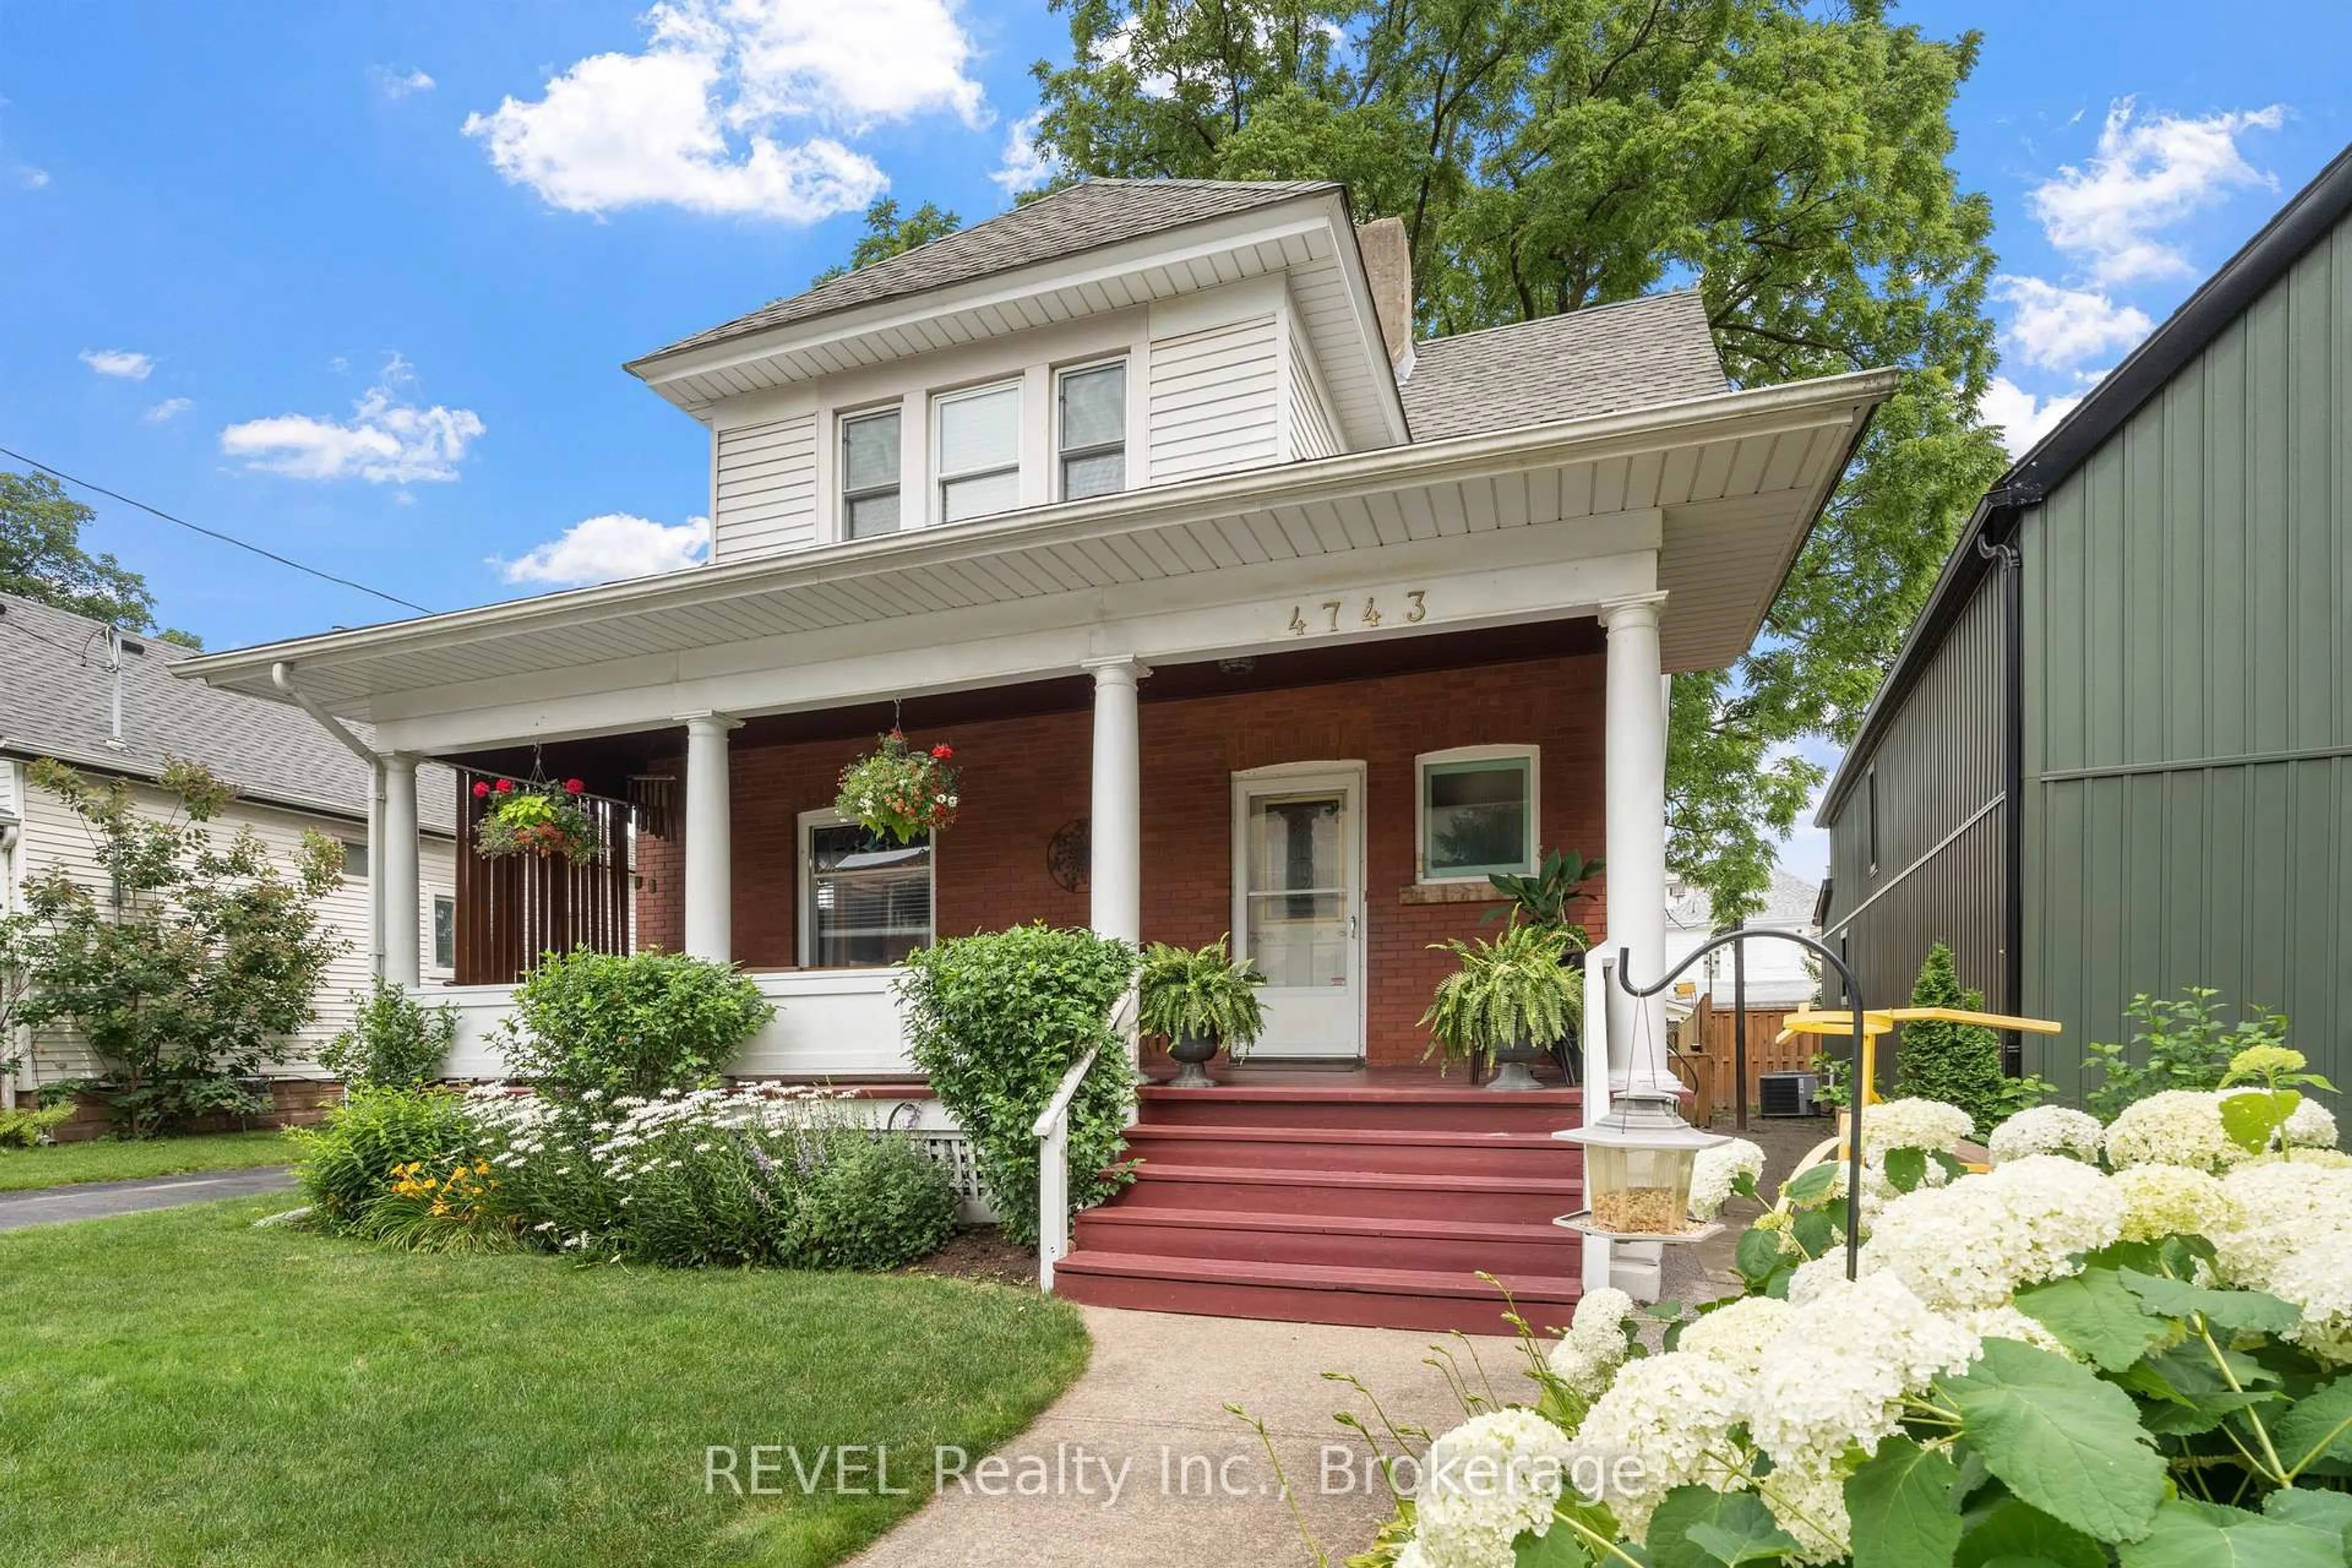
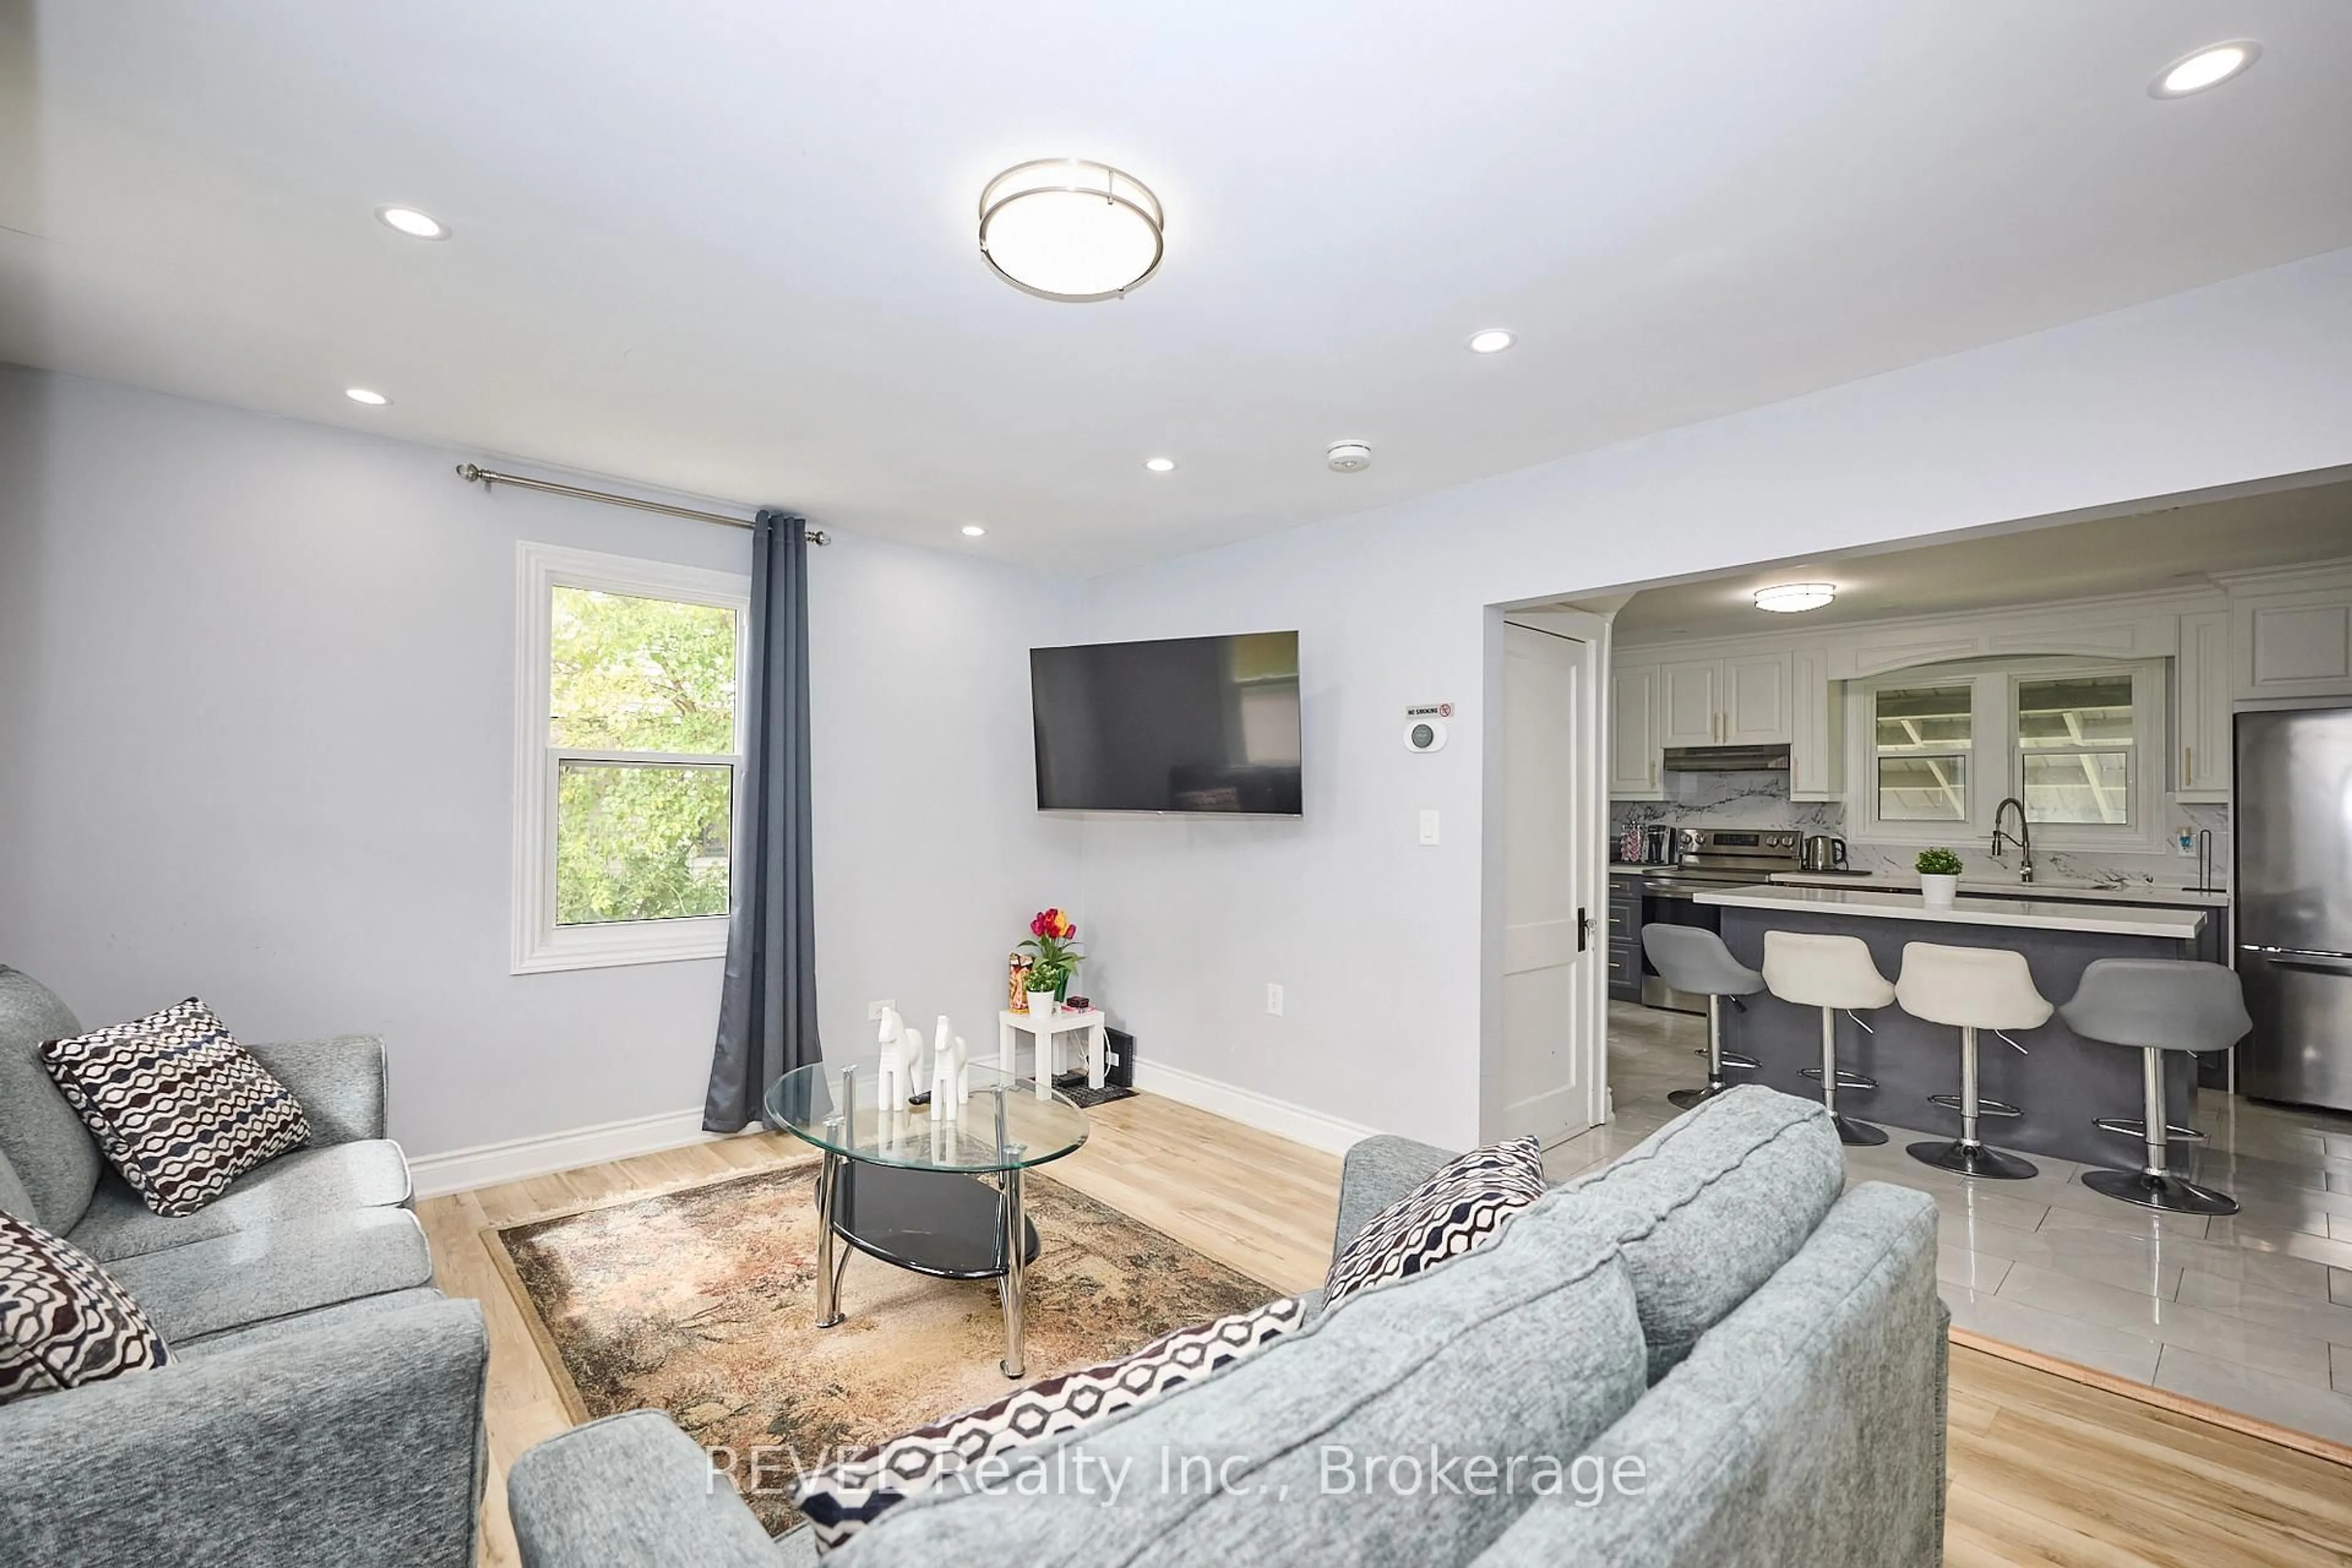
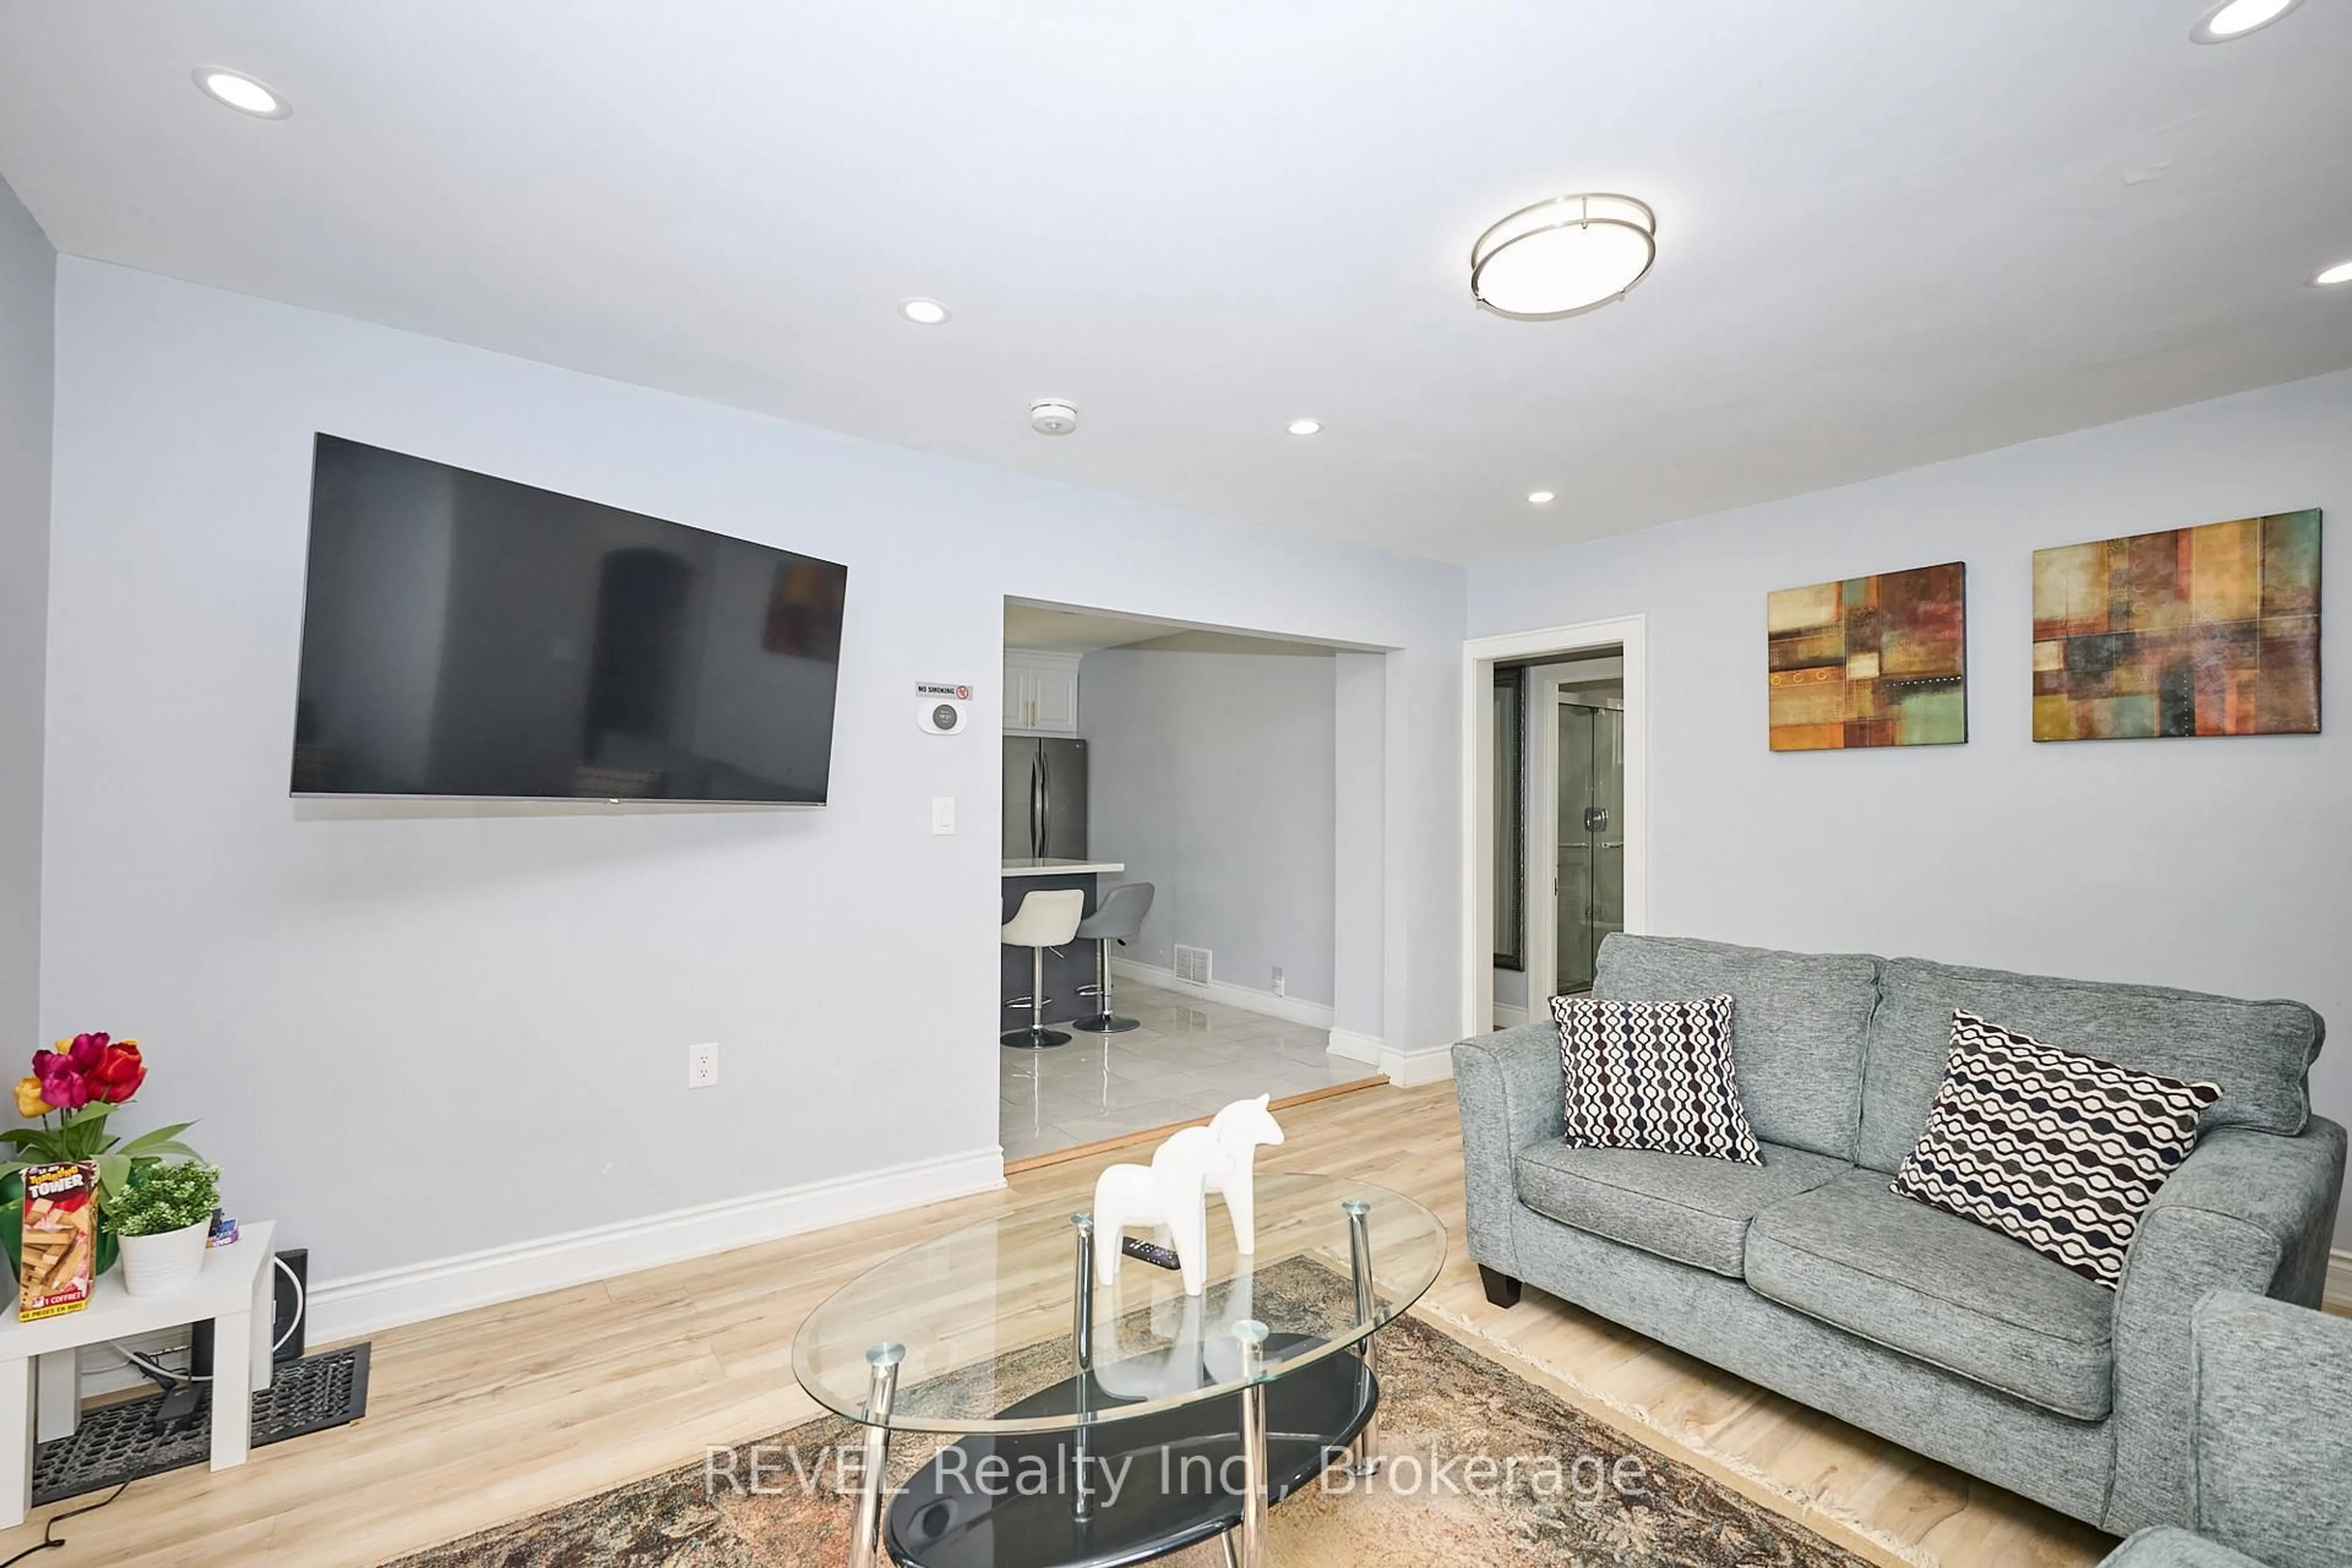
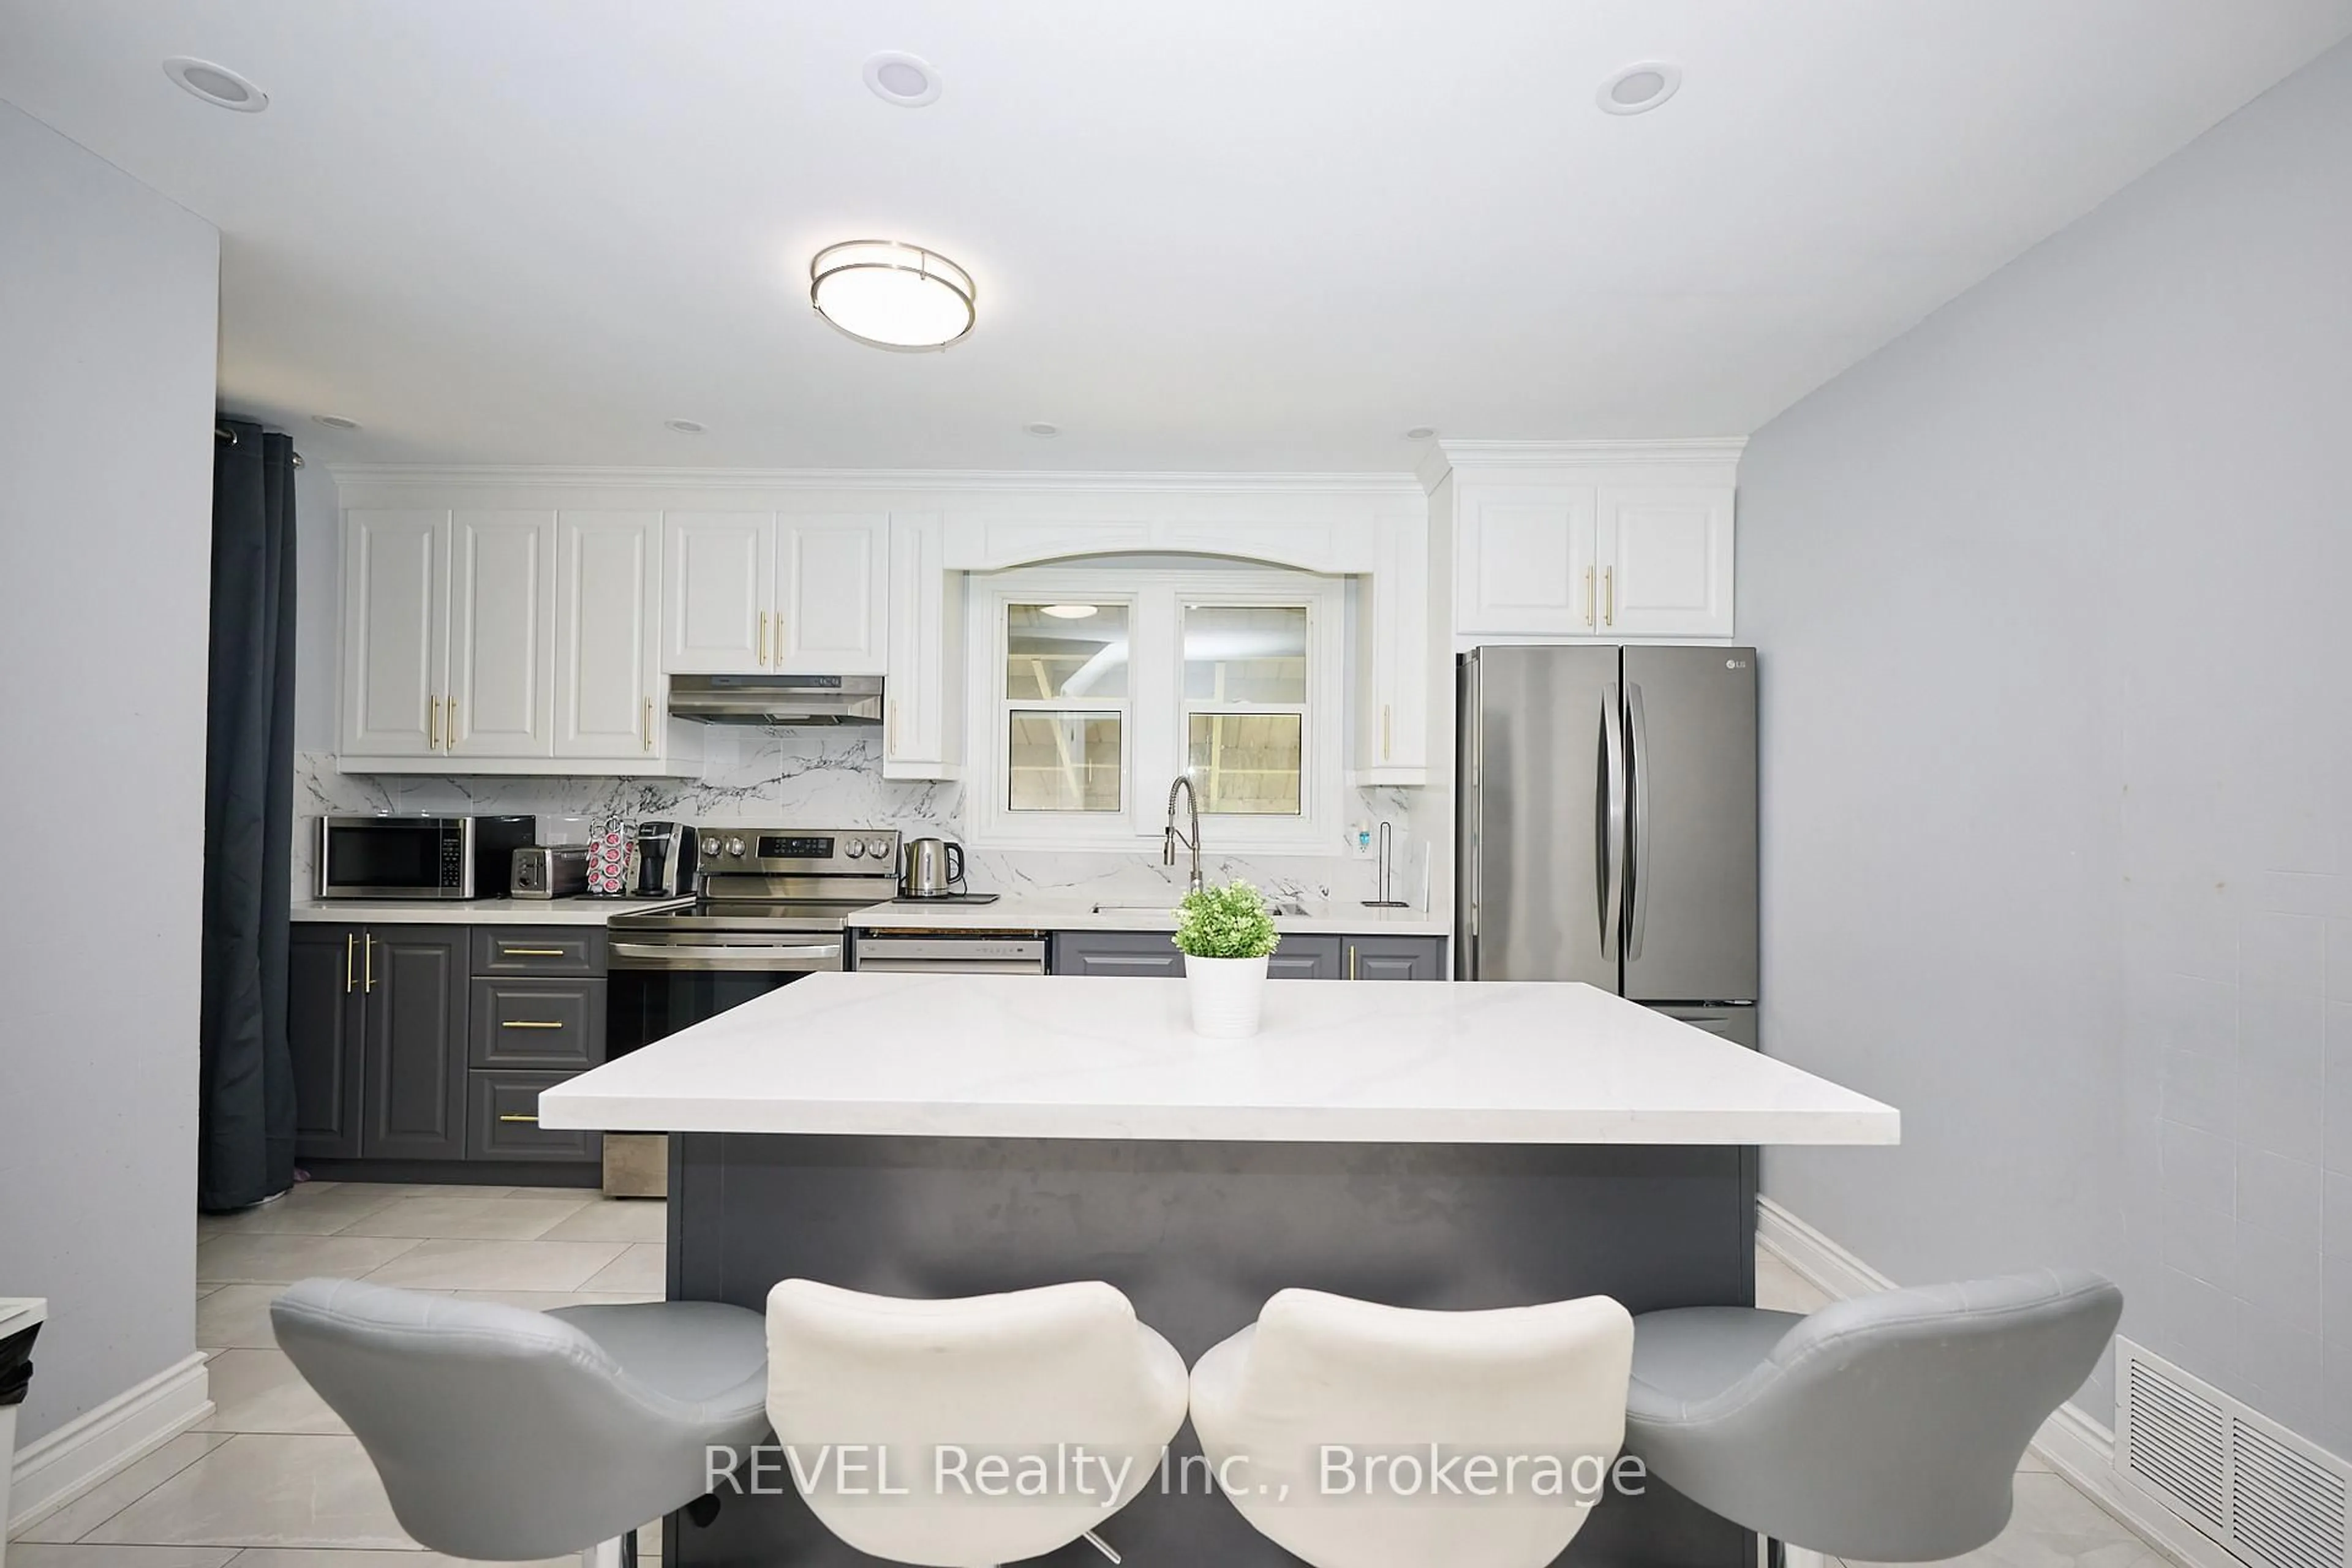
Attentions investors! 1.5 storey house one block to Fallsview Casino and tourist attractions. Main floor bedroom, ceramic tile in kitchen and bath, and lots of natural wood trim. Nice deep lot with no rear neighbours. Renovated 2022 from top to bottom Kitchen with island and quartz countertop, furnace, windows, A/C unit. purchased in 2022
Property Details
Style1 1/2 Storey
View-
Age of property-
SqFt~< 700 SqFt
Lot Size5,250 SqFt(125 x 42)
Parking Spaces5
MLS ®NumberX12416951
Community NameDrummond / Victoria
Data SourceTRREB
Listing byREVEL Realty Inc., Brokerage
Interior
Features
Heating: Forced Air
Cooling: Central Air
Basement: Apartment, Sep Entrance
Exterior
Features
Lot size: 5,250 SqFt
Parking
Garage spaces 1
Garage type Detached
Other parking spaces 4
Total parking spaces 5
Property History
Sep 20, 2025
ListedActive
$629,000
150 days on market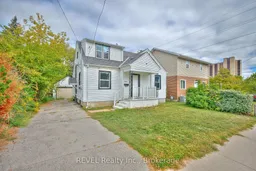 16Listing by trreb®
16Login required
Expired
Login required
Listed
$•••,•••
Stayed --92 days on market Listing by trreb®
Login required
Terminated
Login required
Listed
$•••,•••
Stayed --54 days on market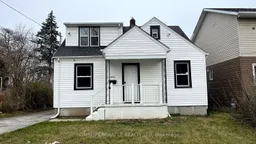 Listing by trreb®
Login required
Sold
$•••,•••
Login required
Listed
$•••,•••
Stayed --7 days on market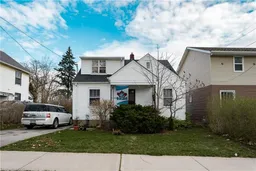 Listing by itso®
Property listed by REVEL Realty Inc., Brokerage, Brokerage

Interested in this property?Get in touch to get the inside scoop.