Unknown for 99 John St #1907, Toronto Ontario M5V 0S6

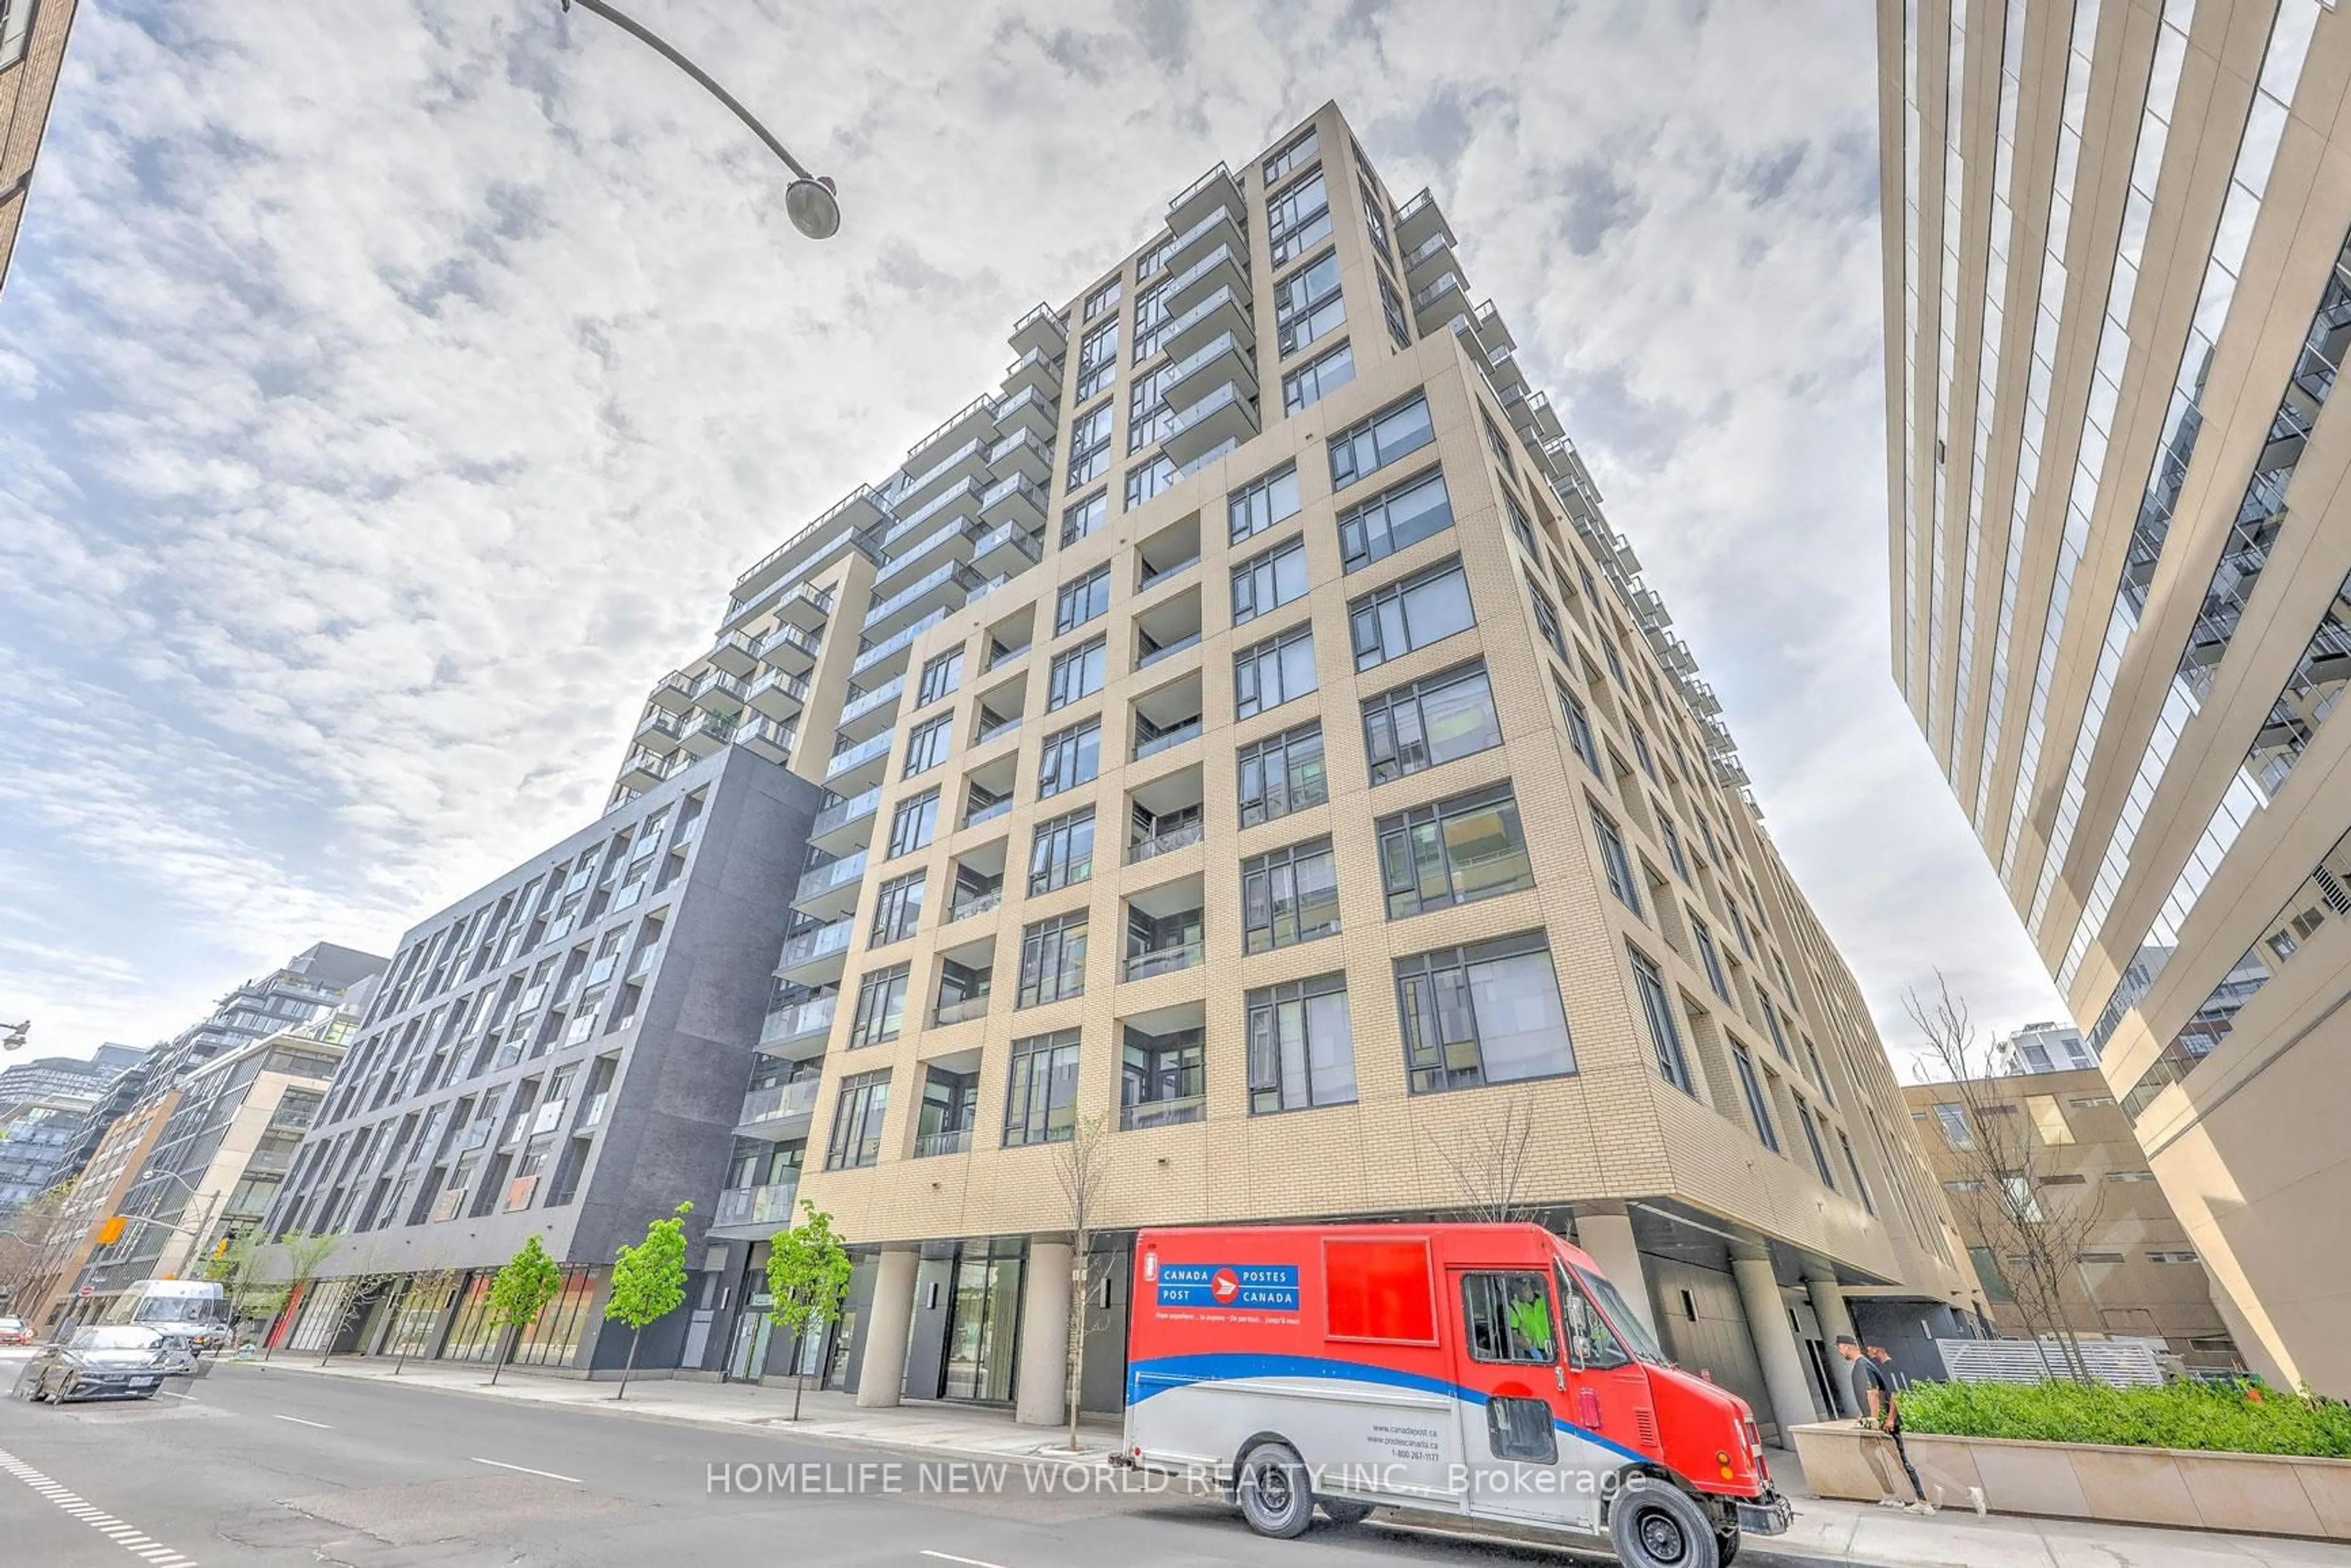
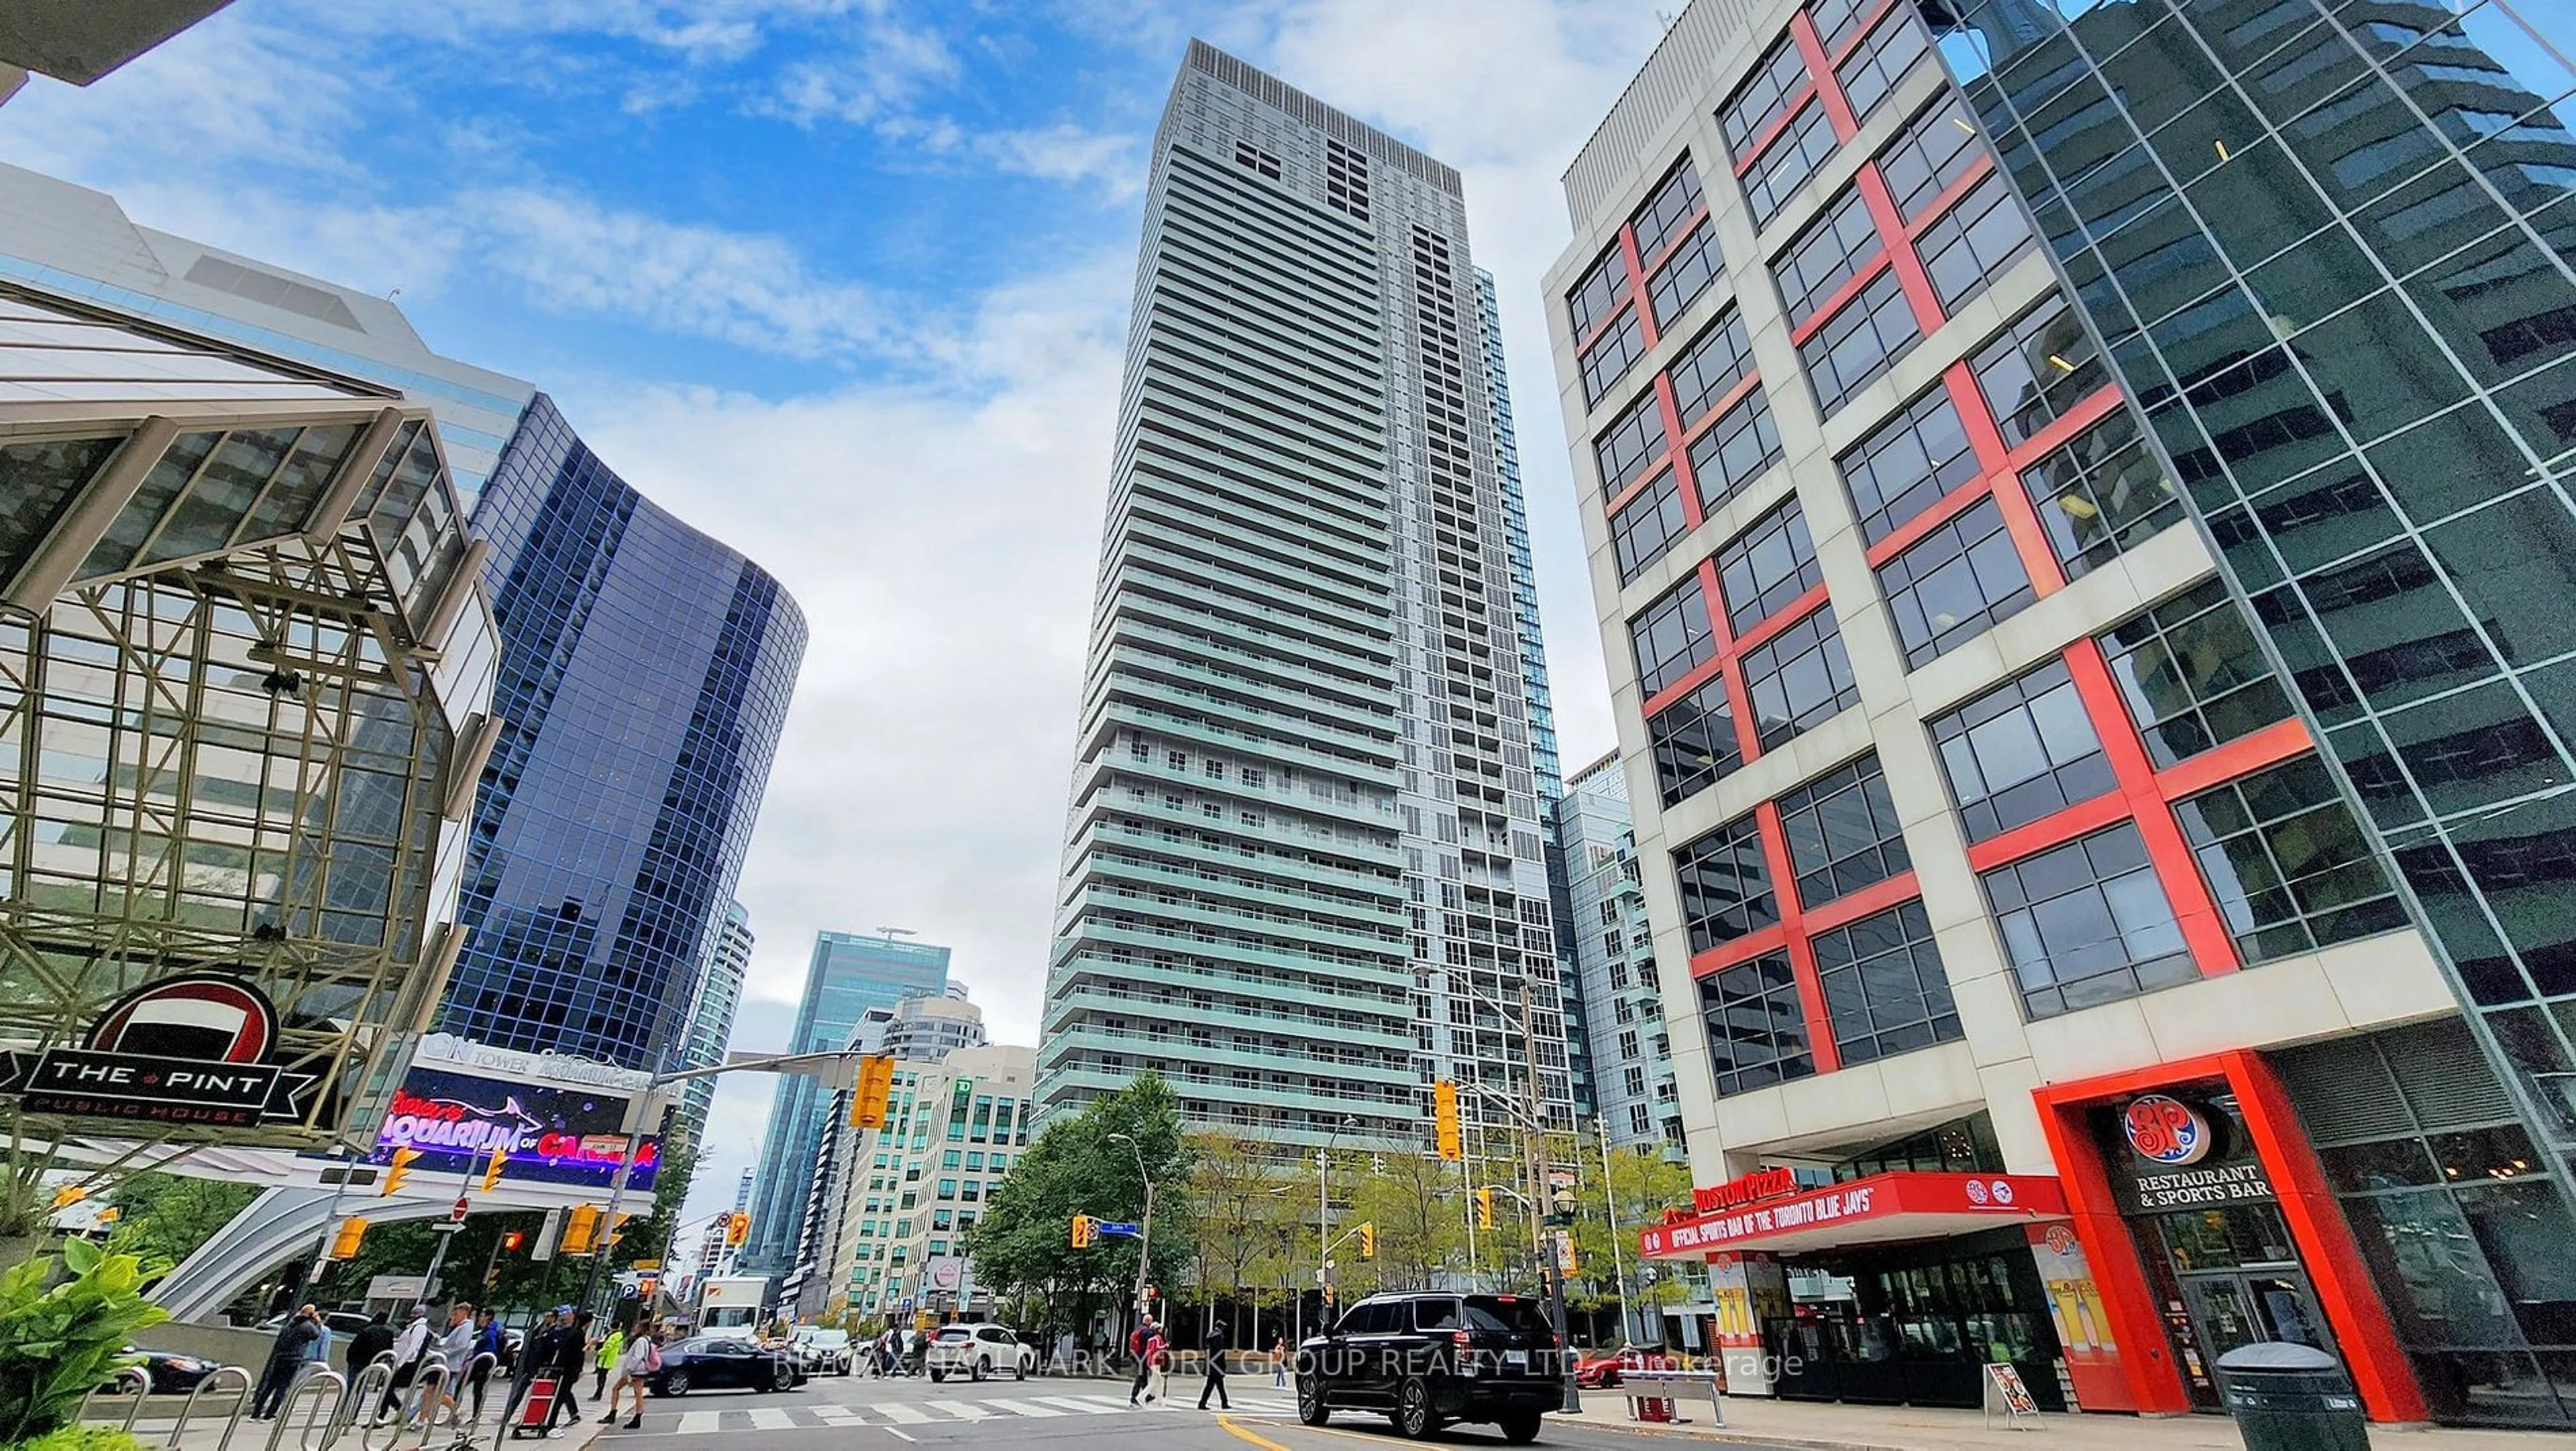
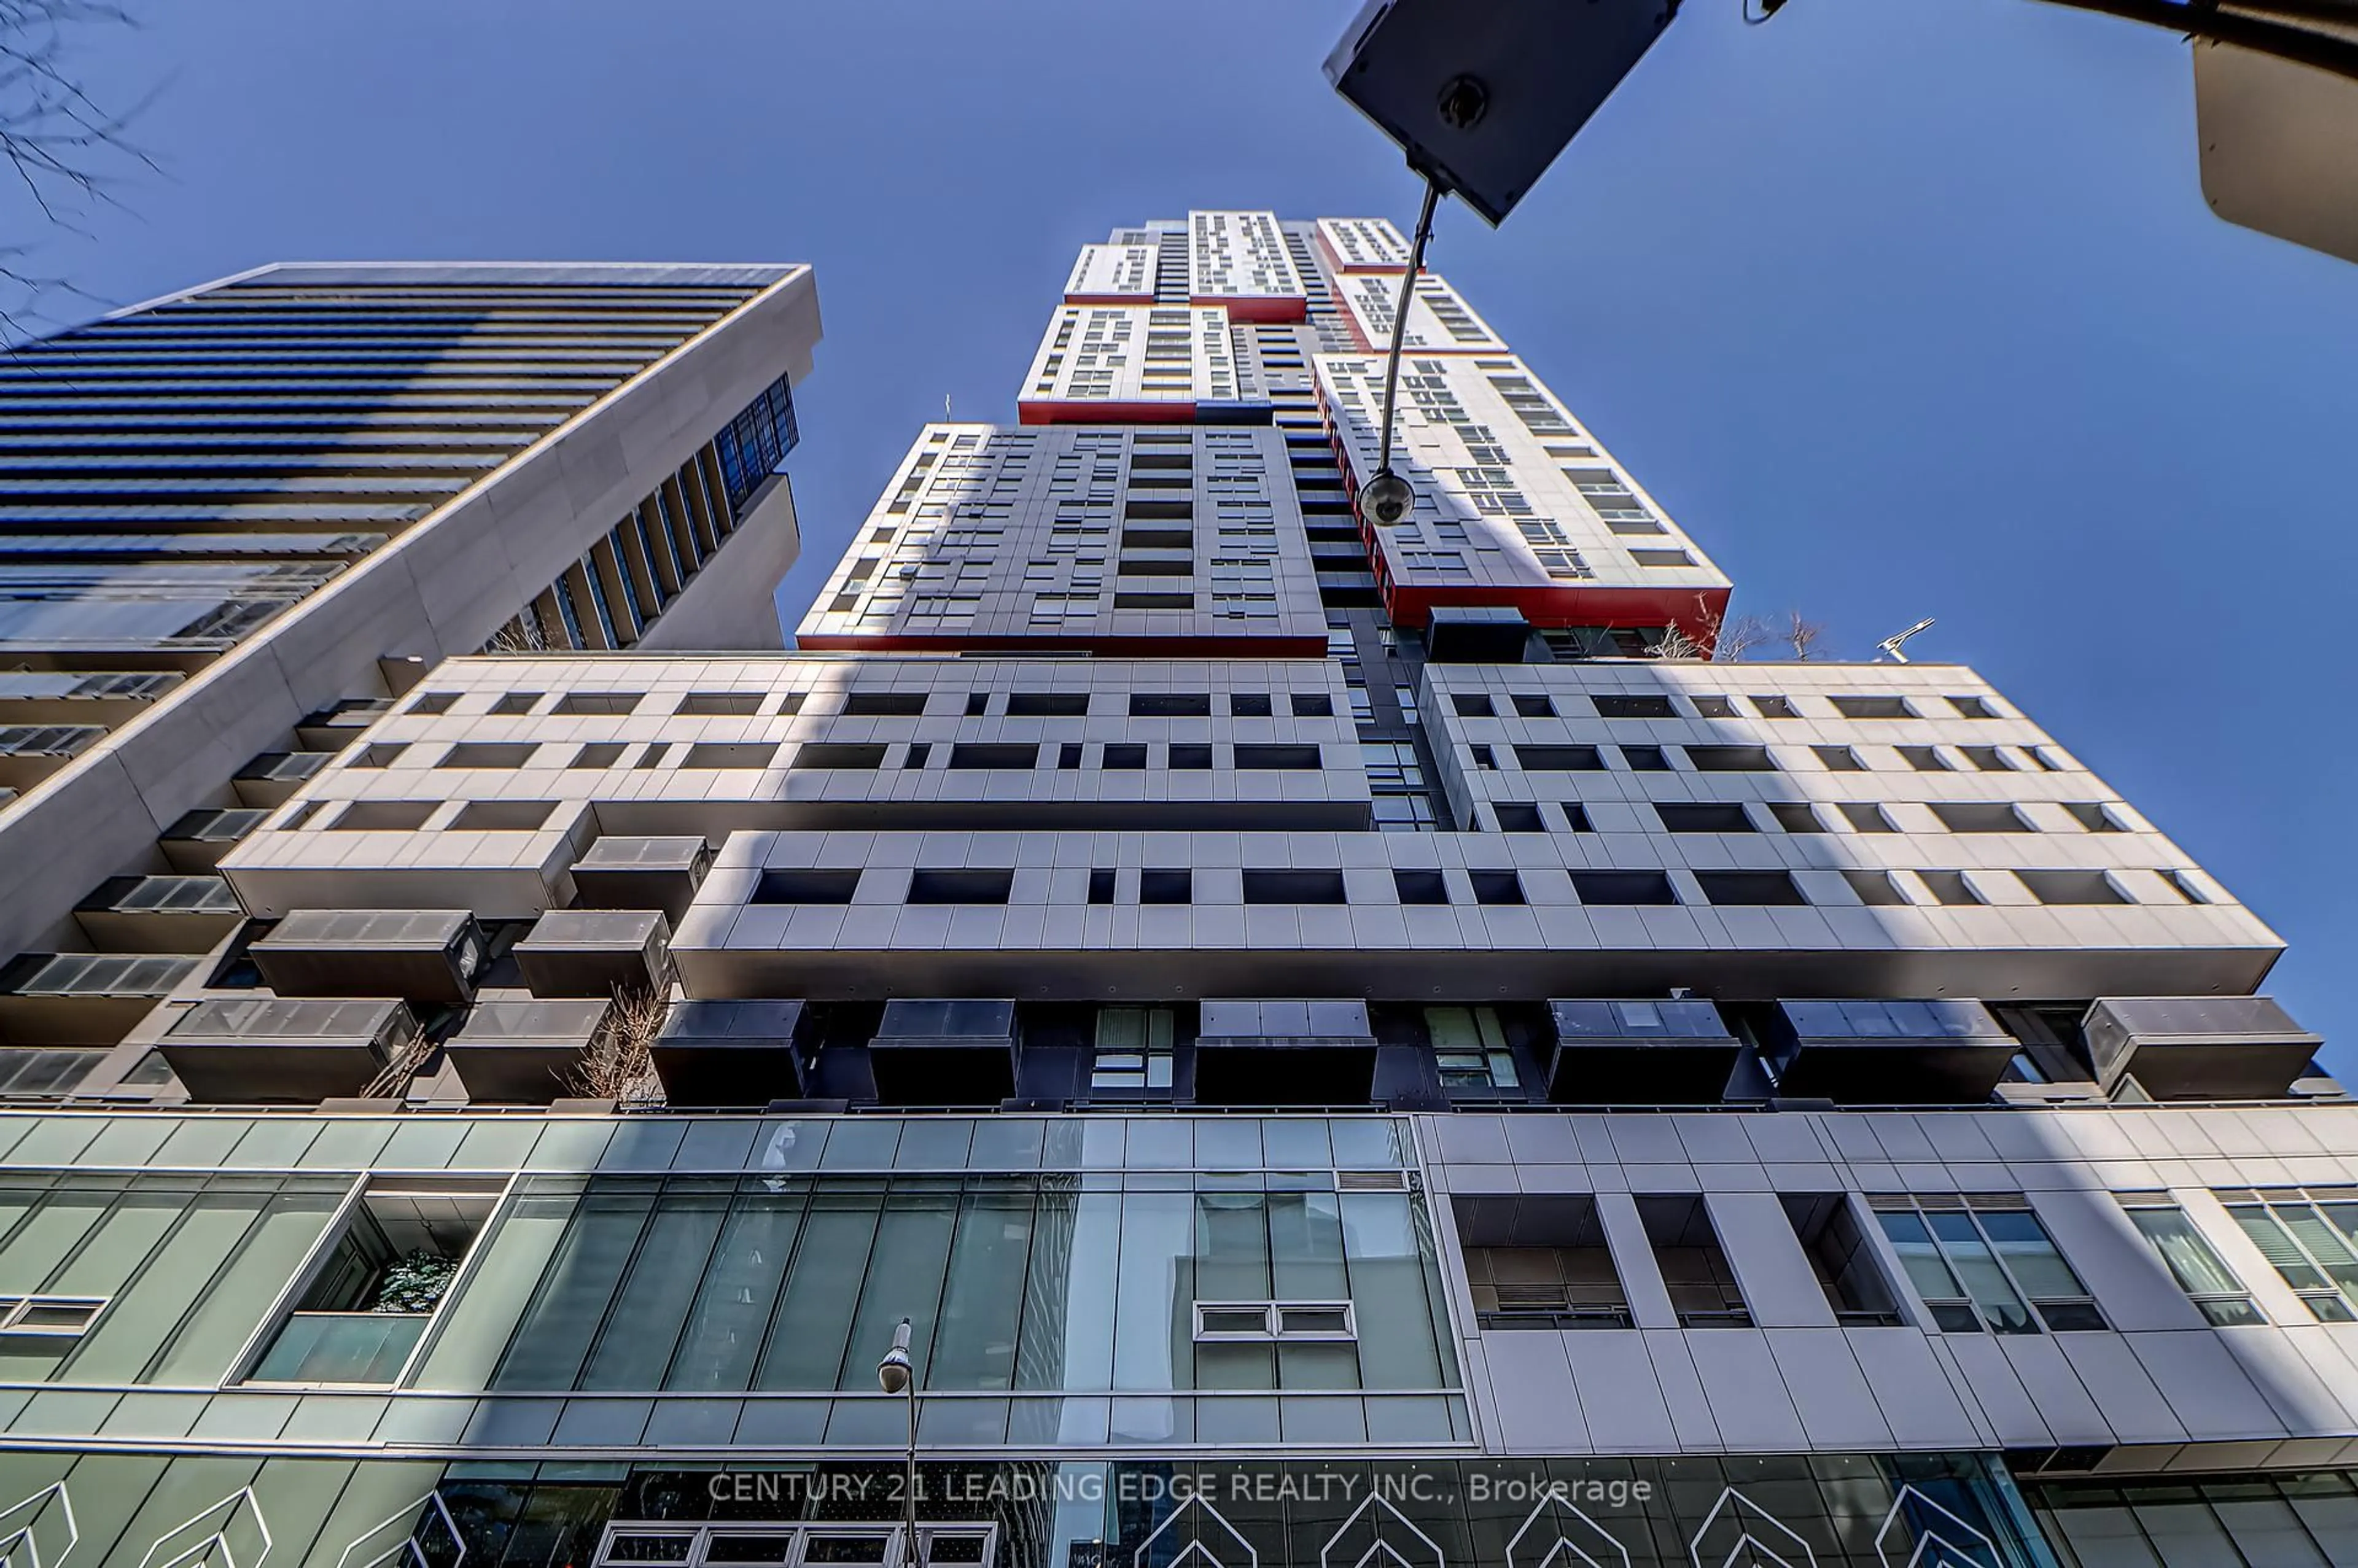
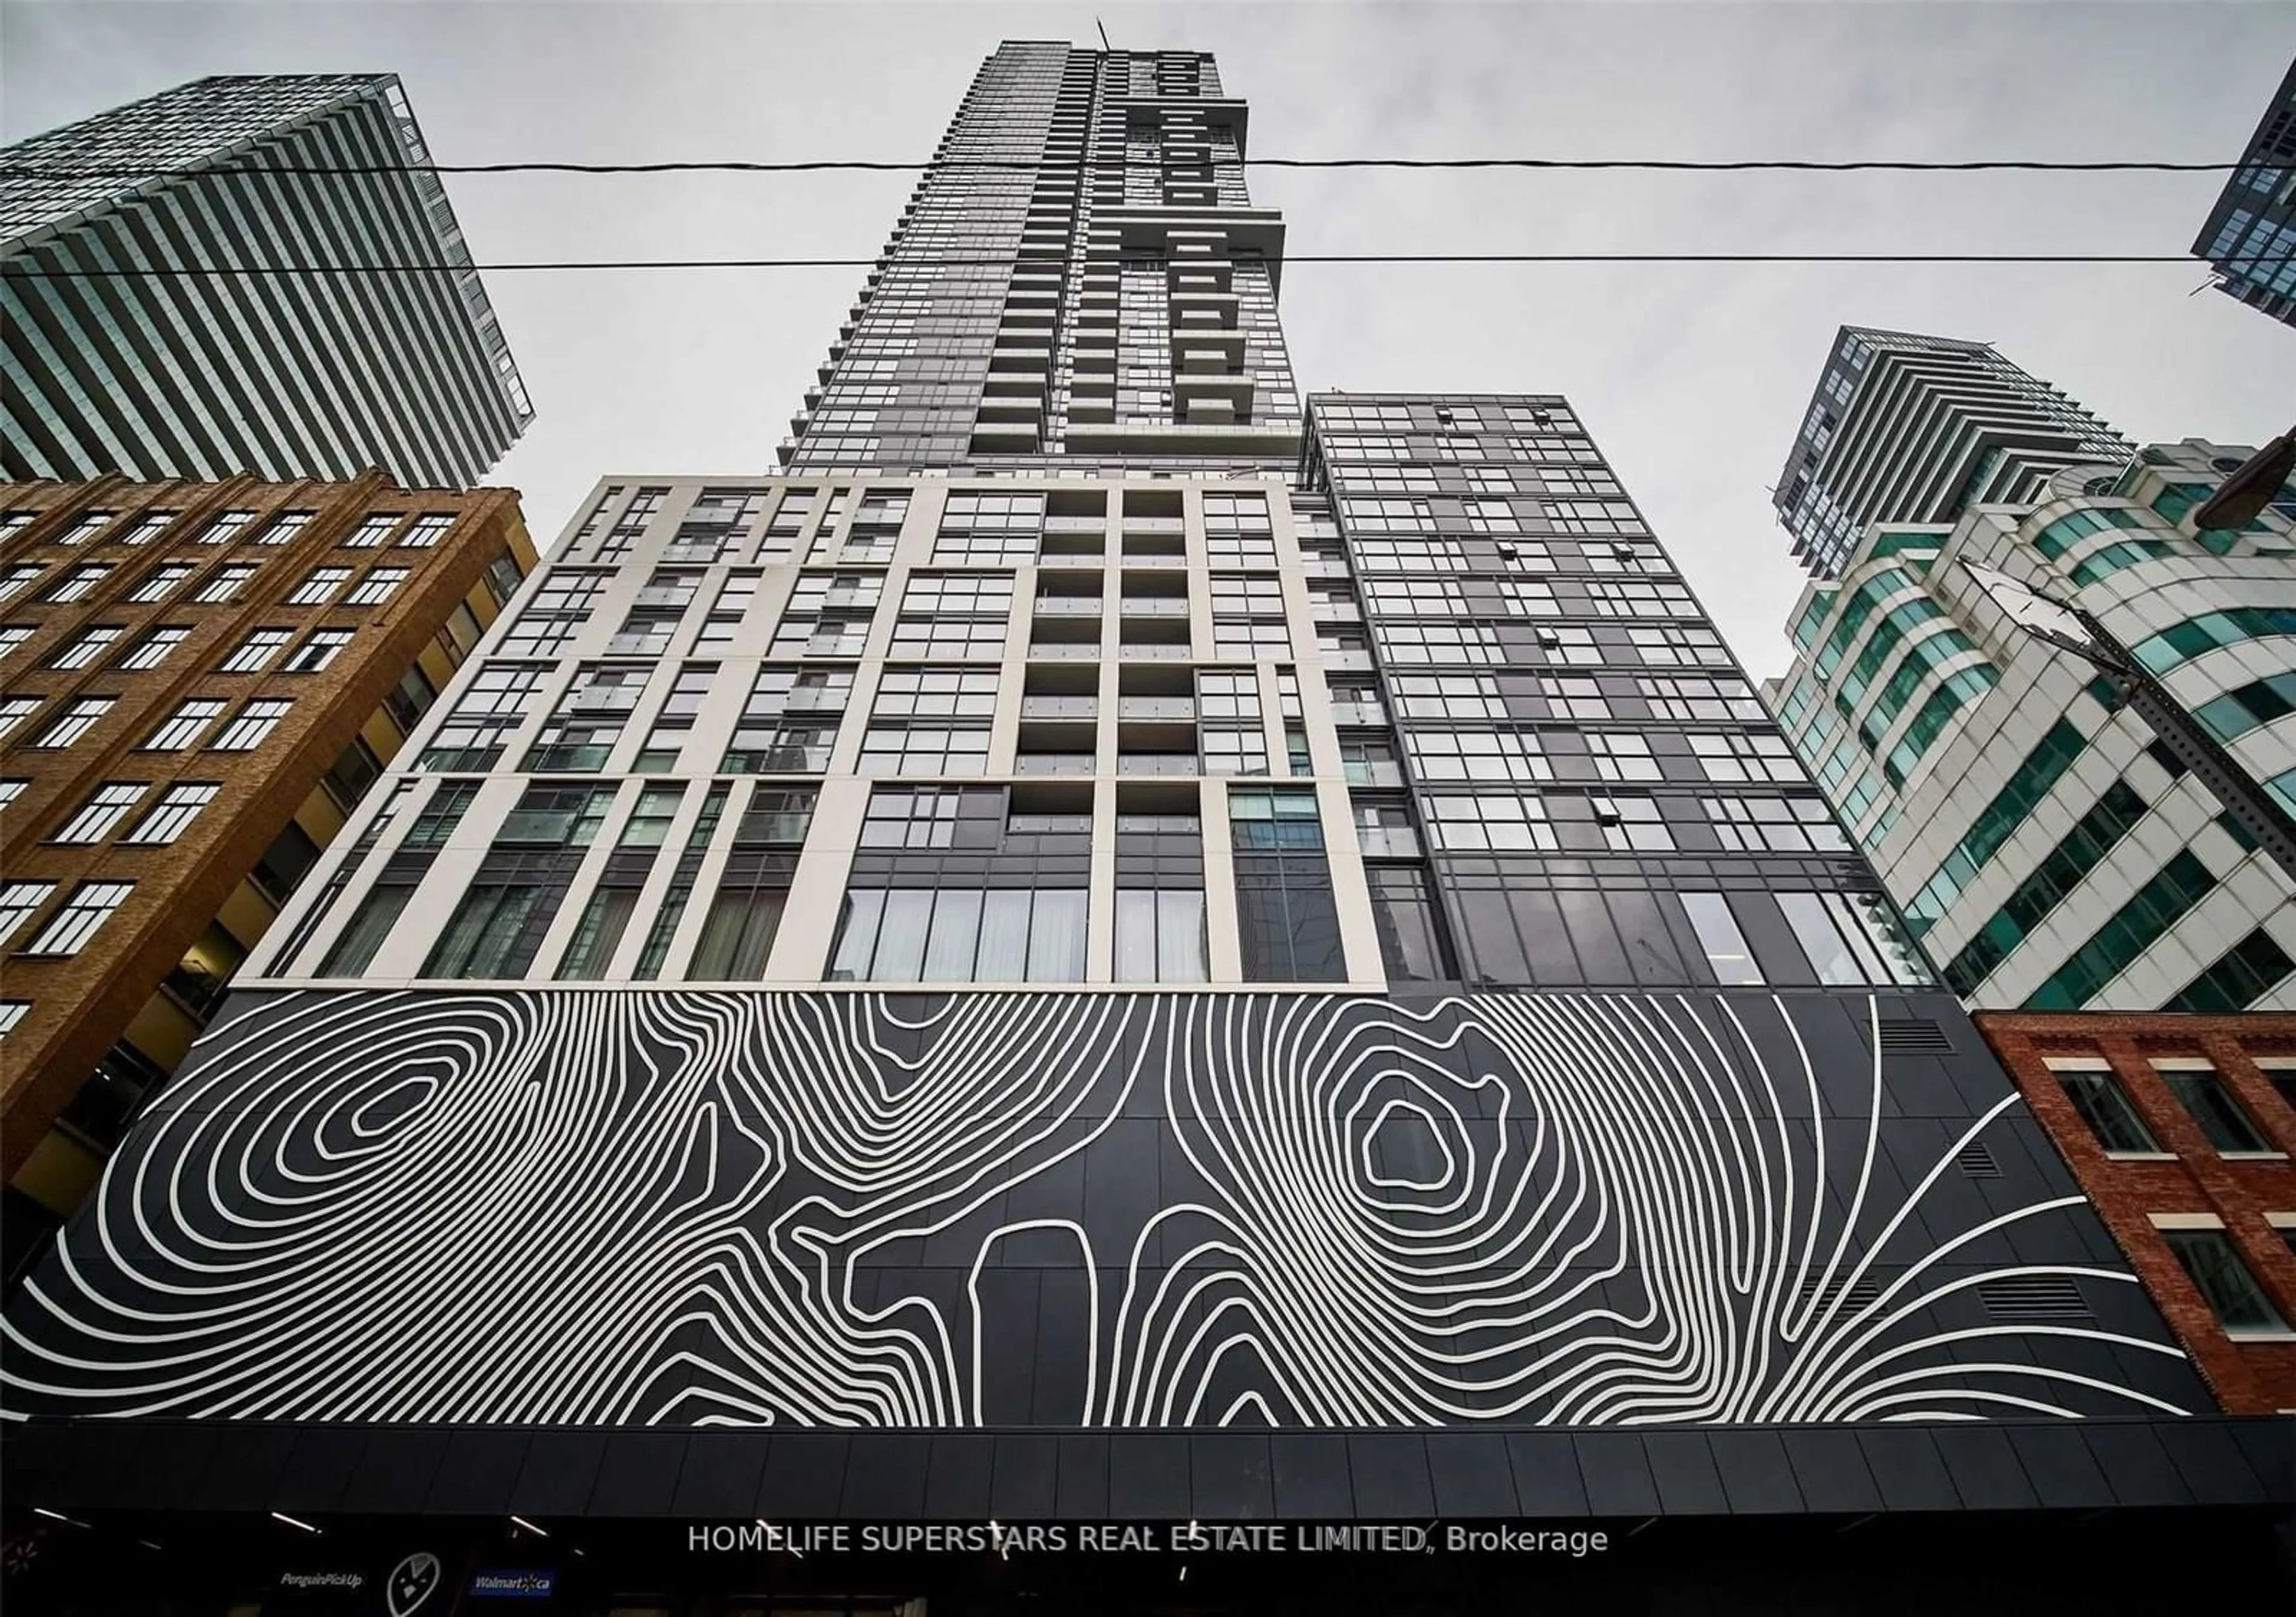
99 John St #1907, Toronto, Ontario M5V 0S6

In the same building:
-
Condo
2
2
~800-899 sqft
$975,000
Get pre-qualifiedPowered by Neo Mortgage
Buy with Wahi to get
Up to
$9,750Cashback
Condo
2
2
~800-899 sqft

Contact us about this property

Call

Highlights

Property Estimate

Estimated valueNot available

Price/Sqft$1,151/sqft

Monthly cost

Open Calculator

CMA Subject Property

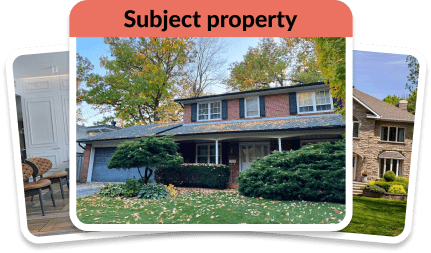
Curious about what homes are selling for in this area?

Get a report on comparable homes with helpful insights and trends.

+71

Properties sold*

$700K

Median sold price*

*Based on last 30 days

Description

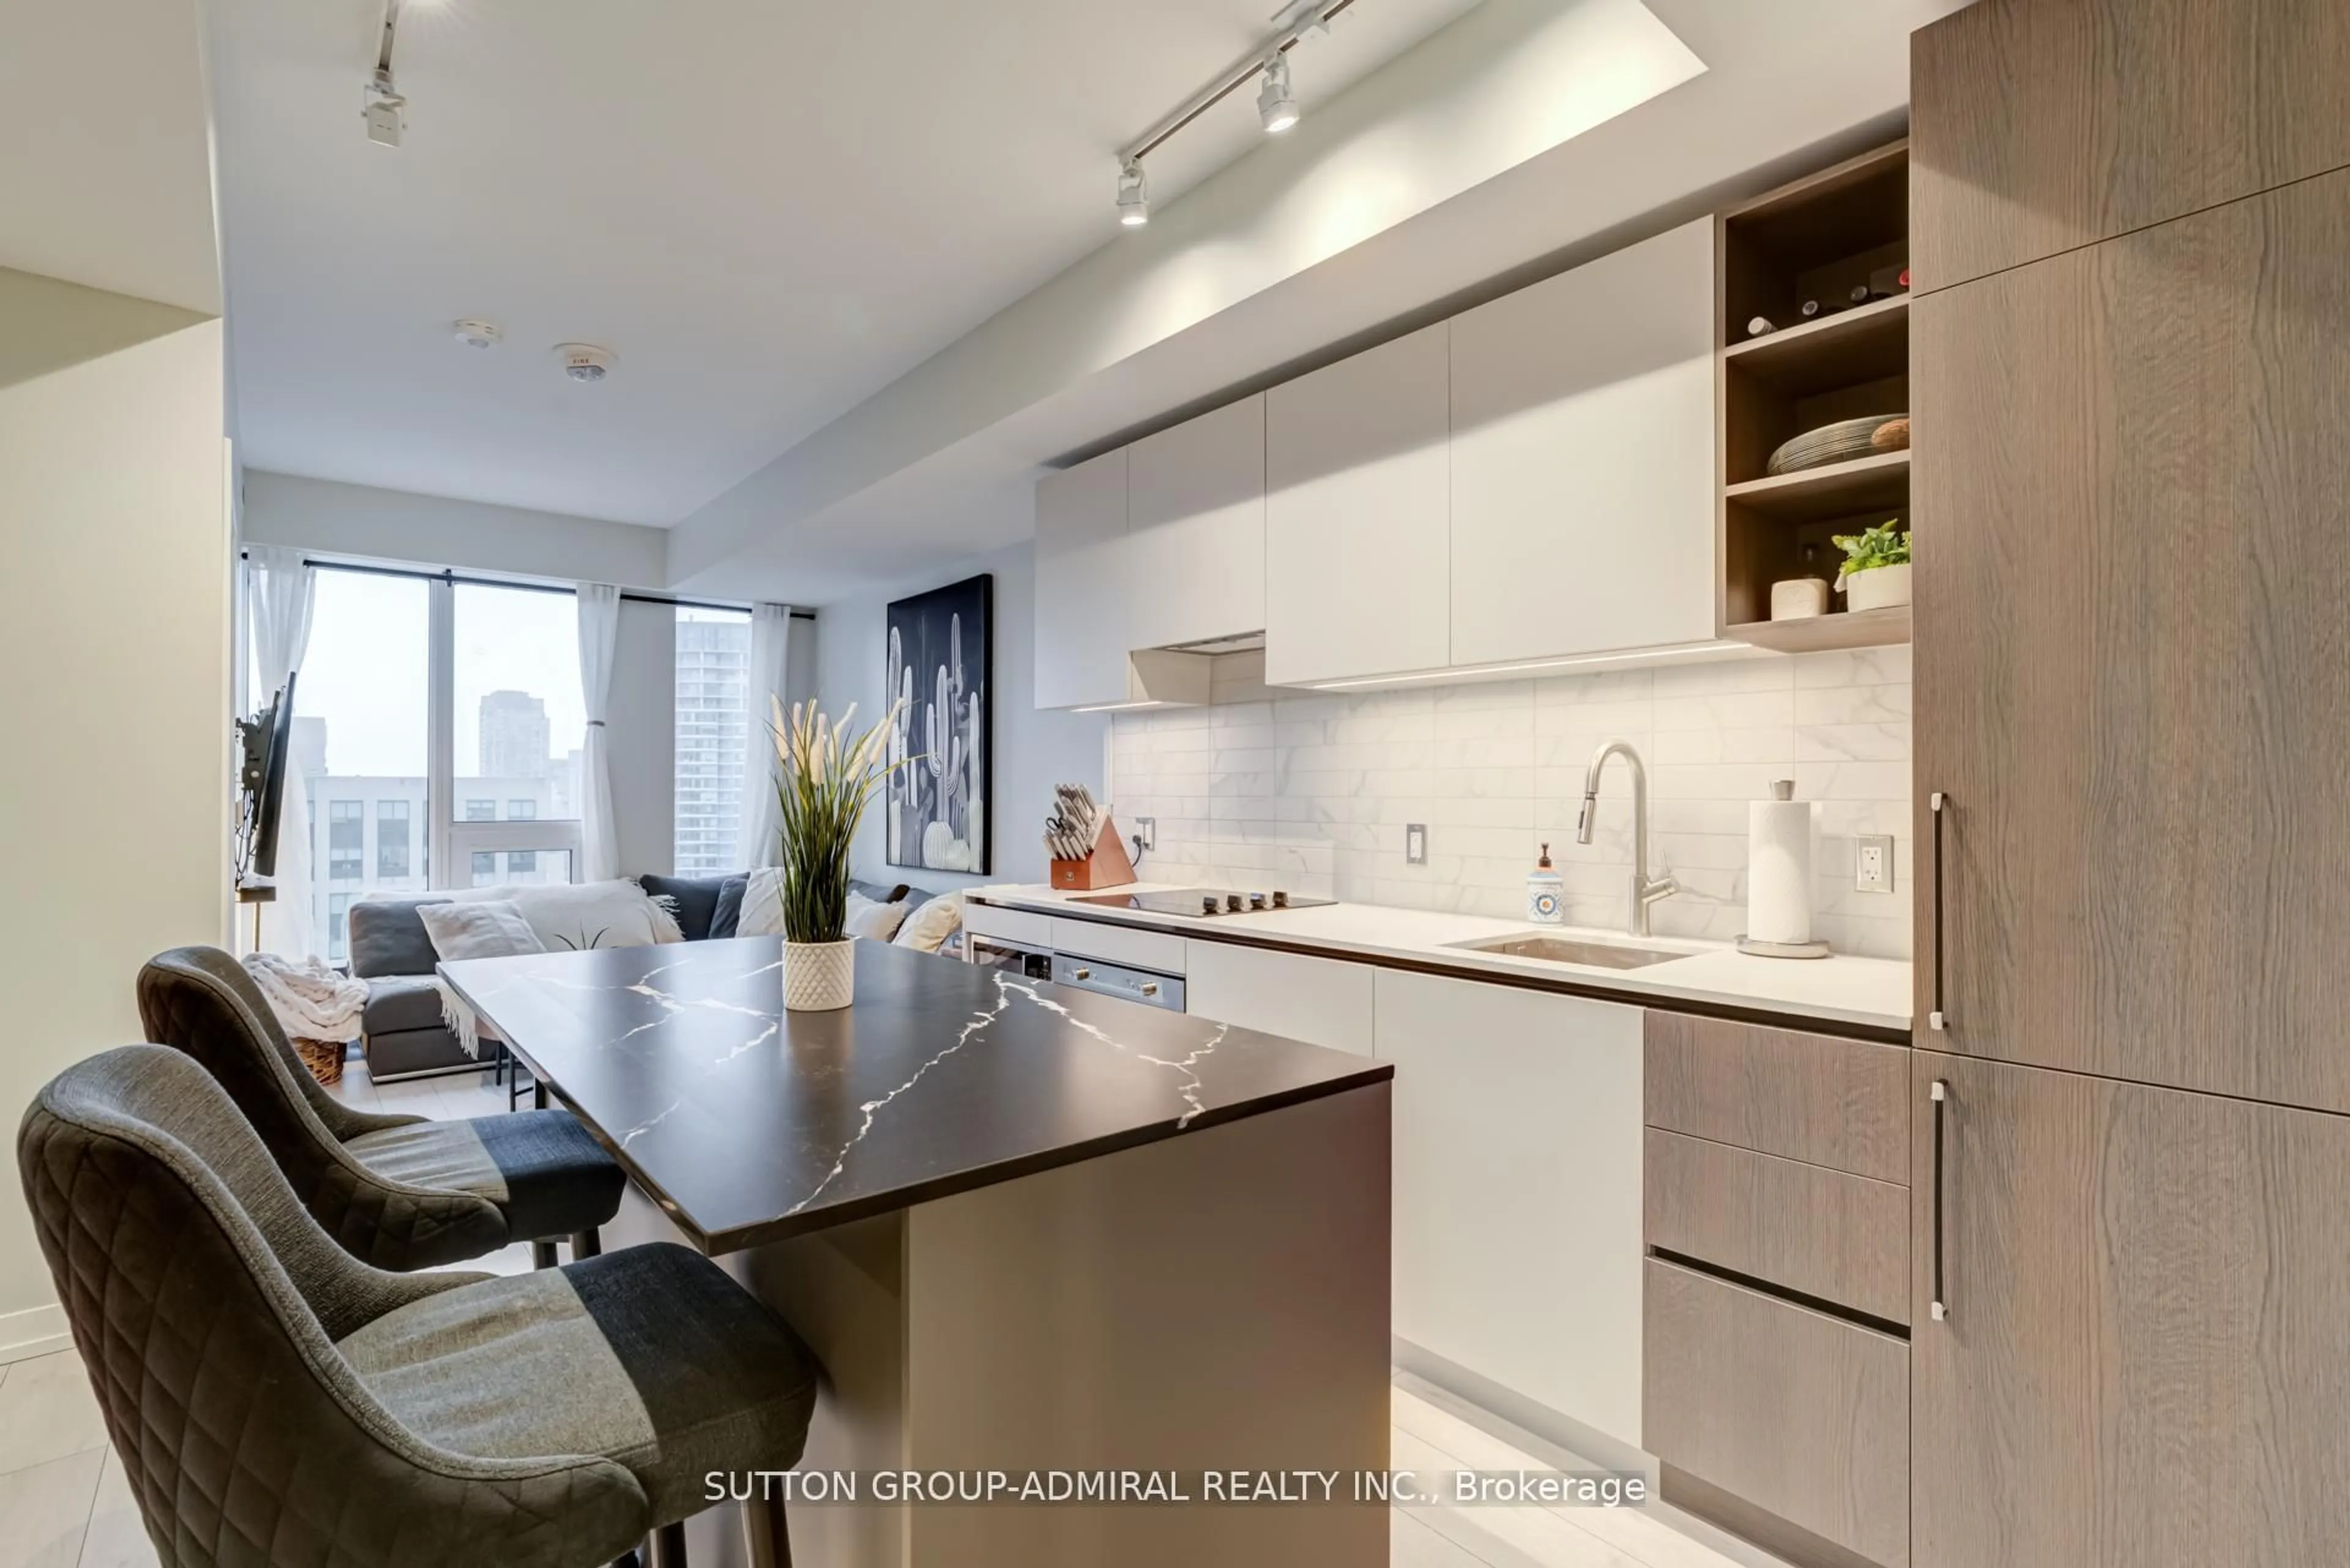
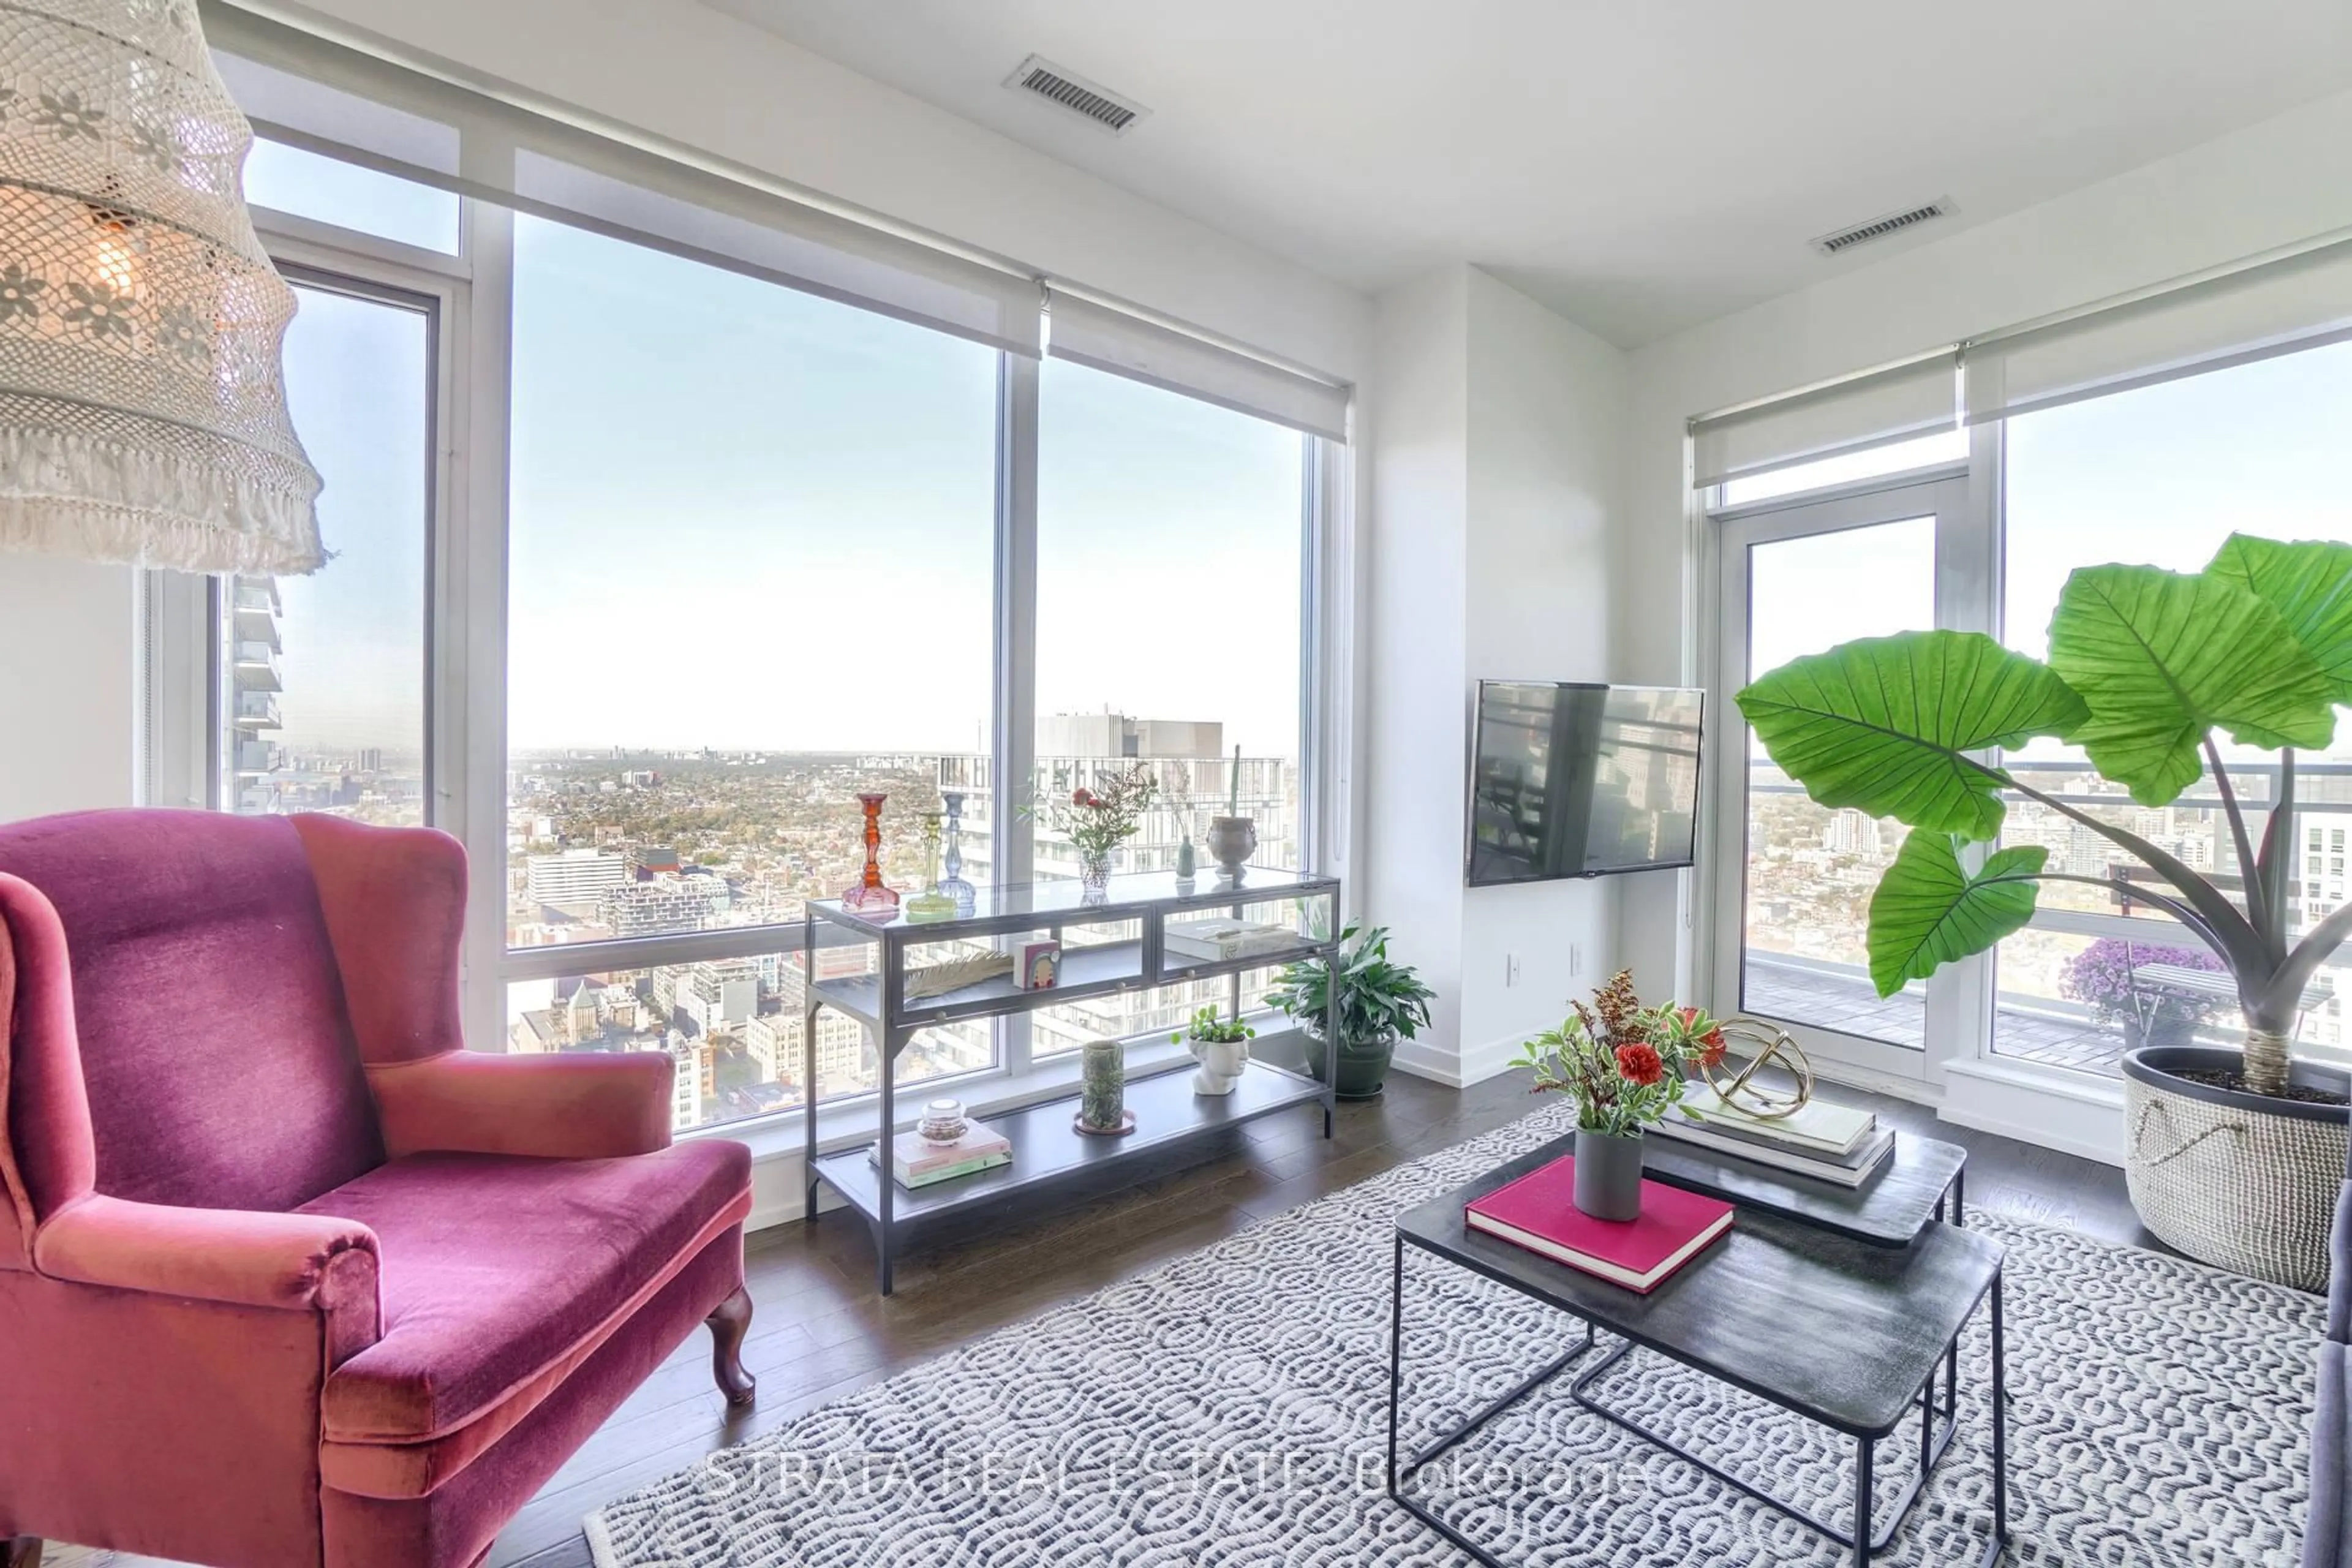
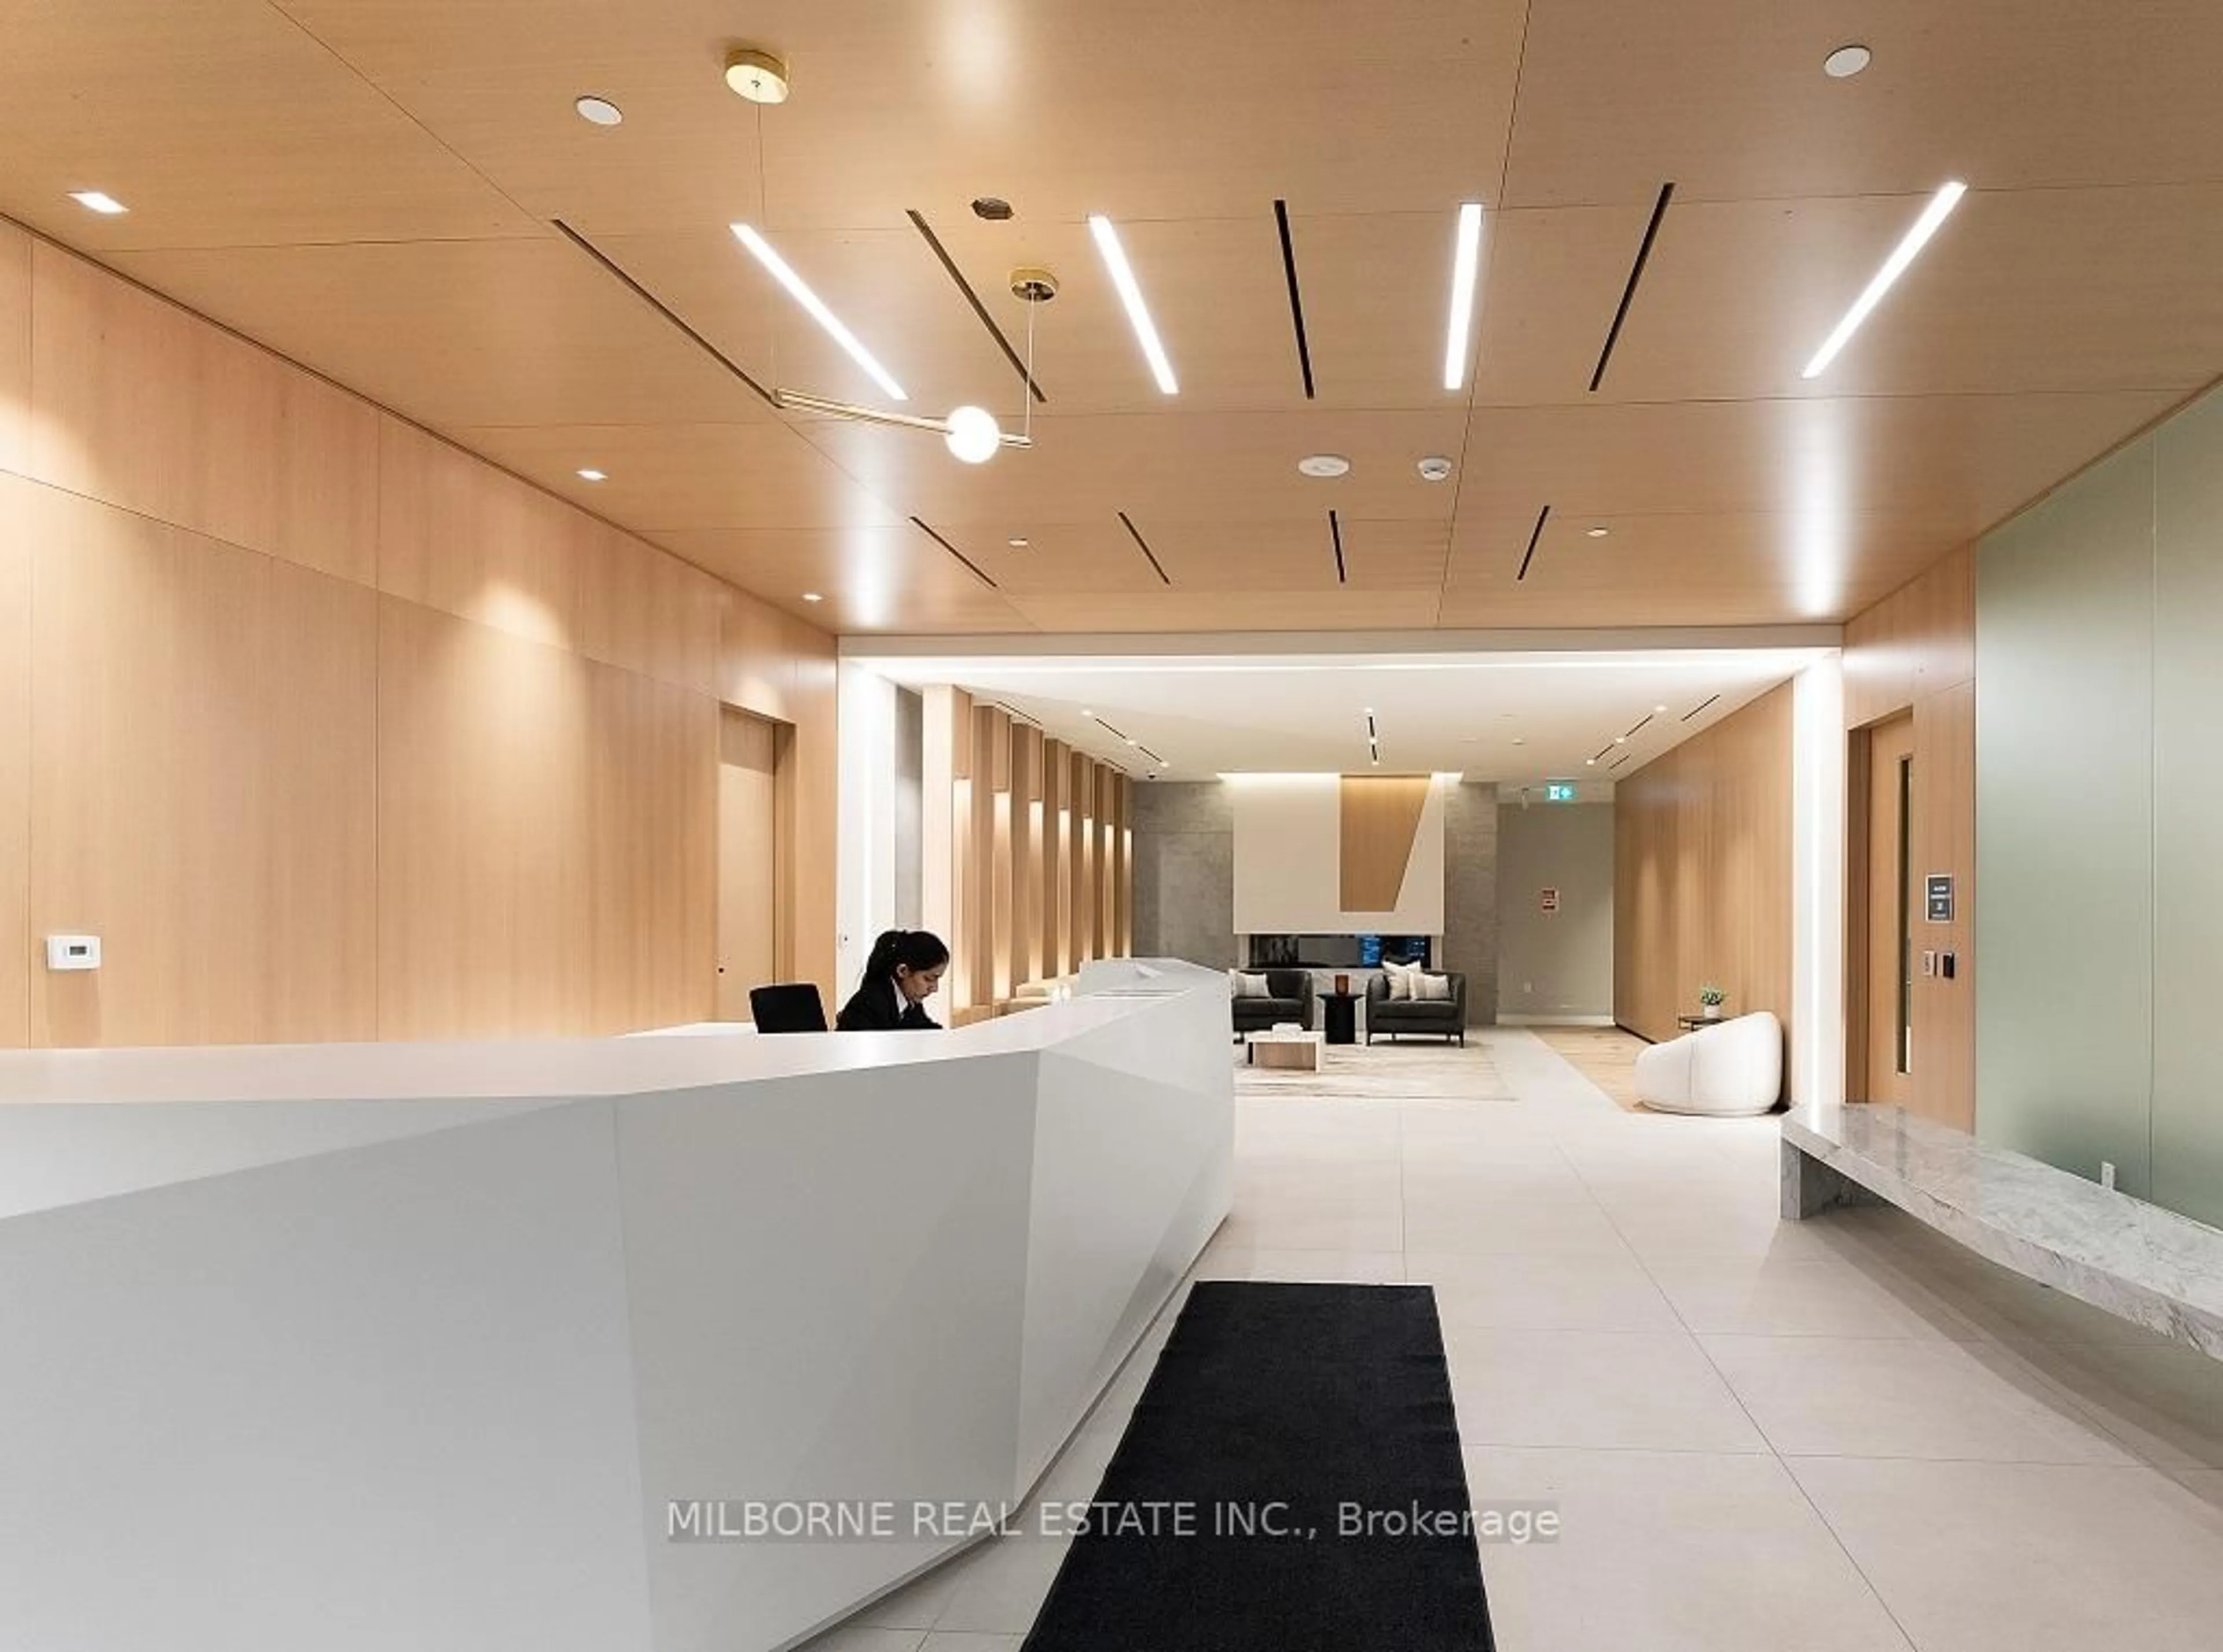
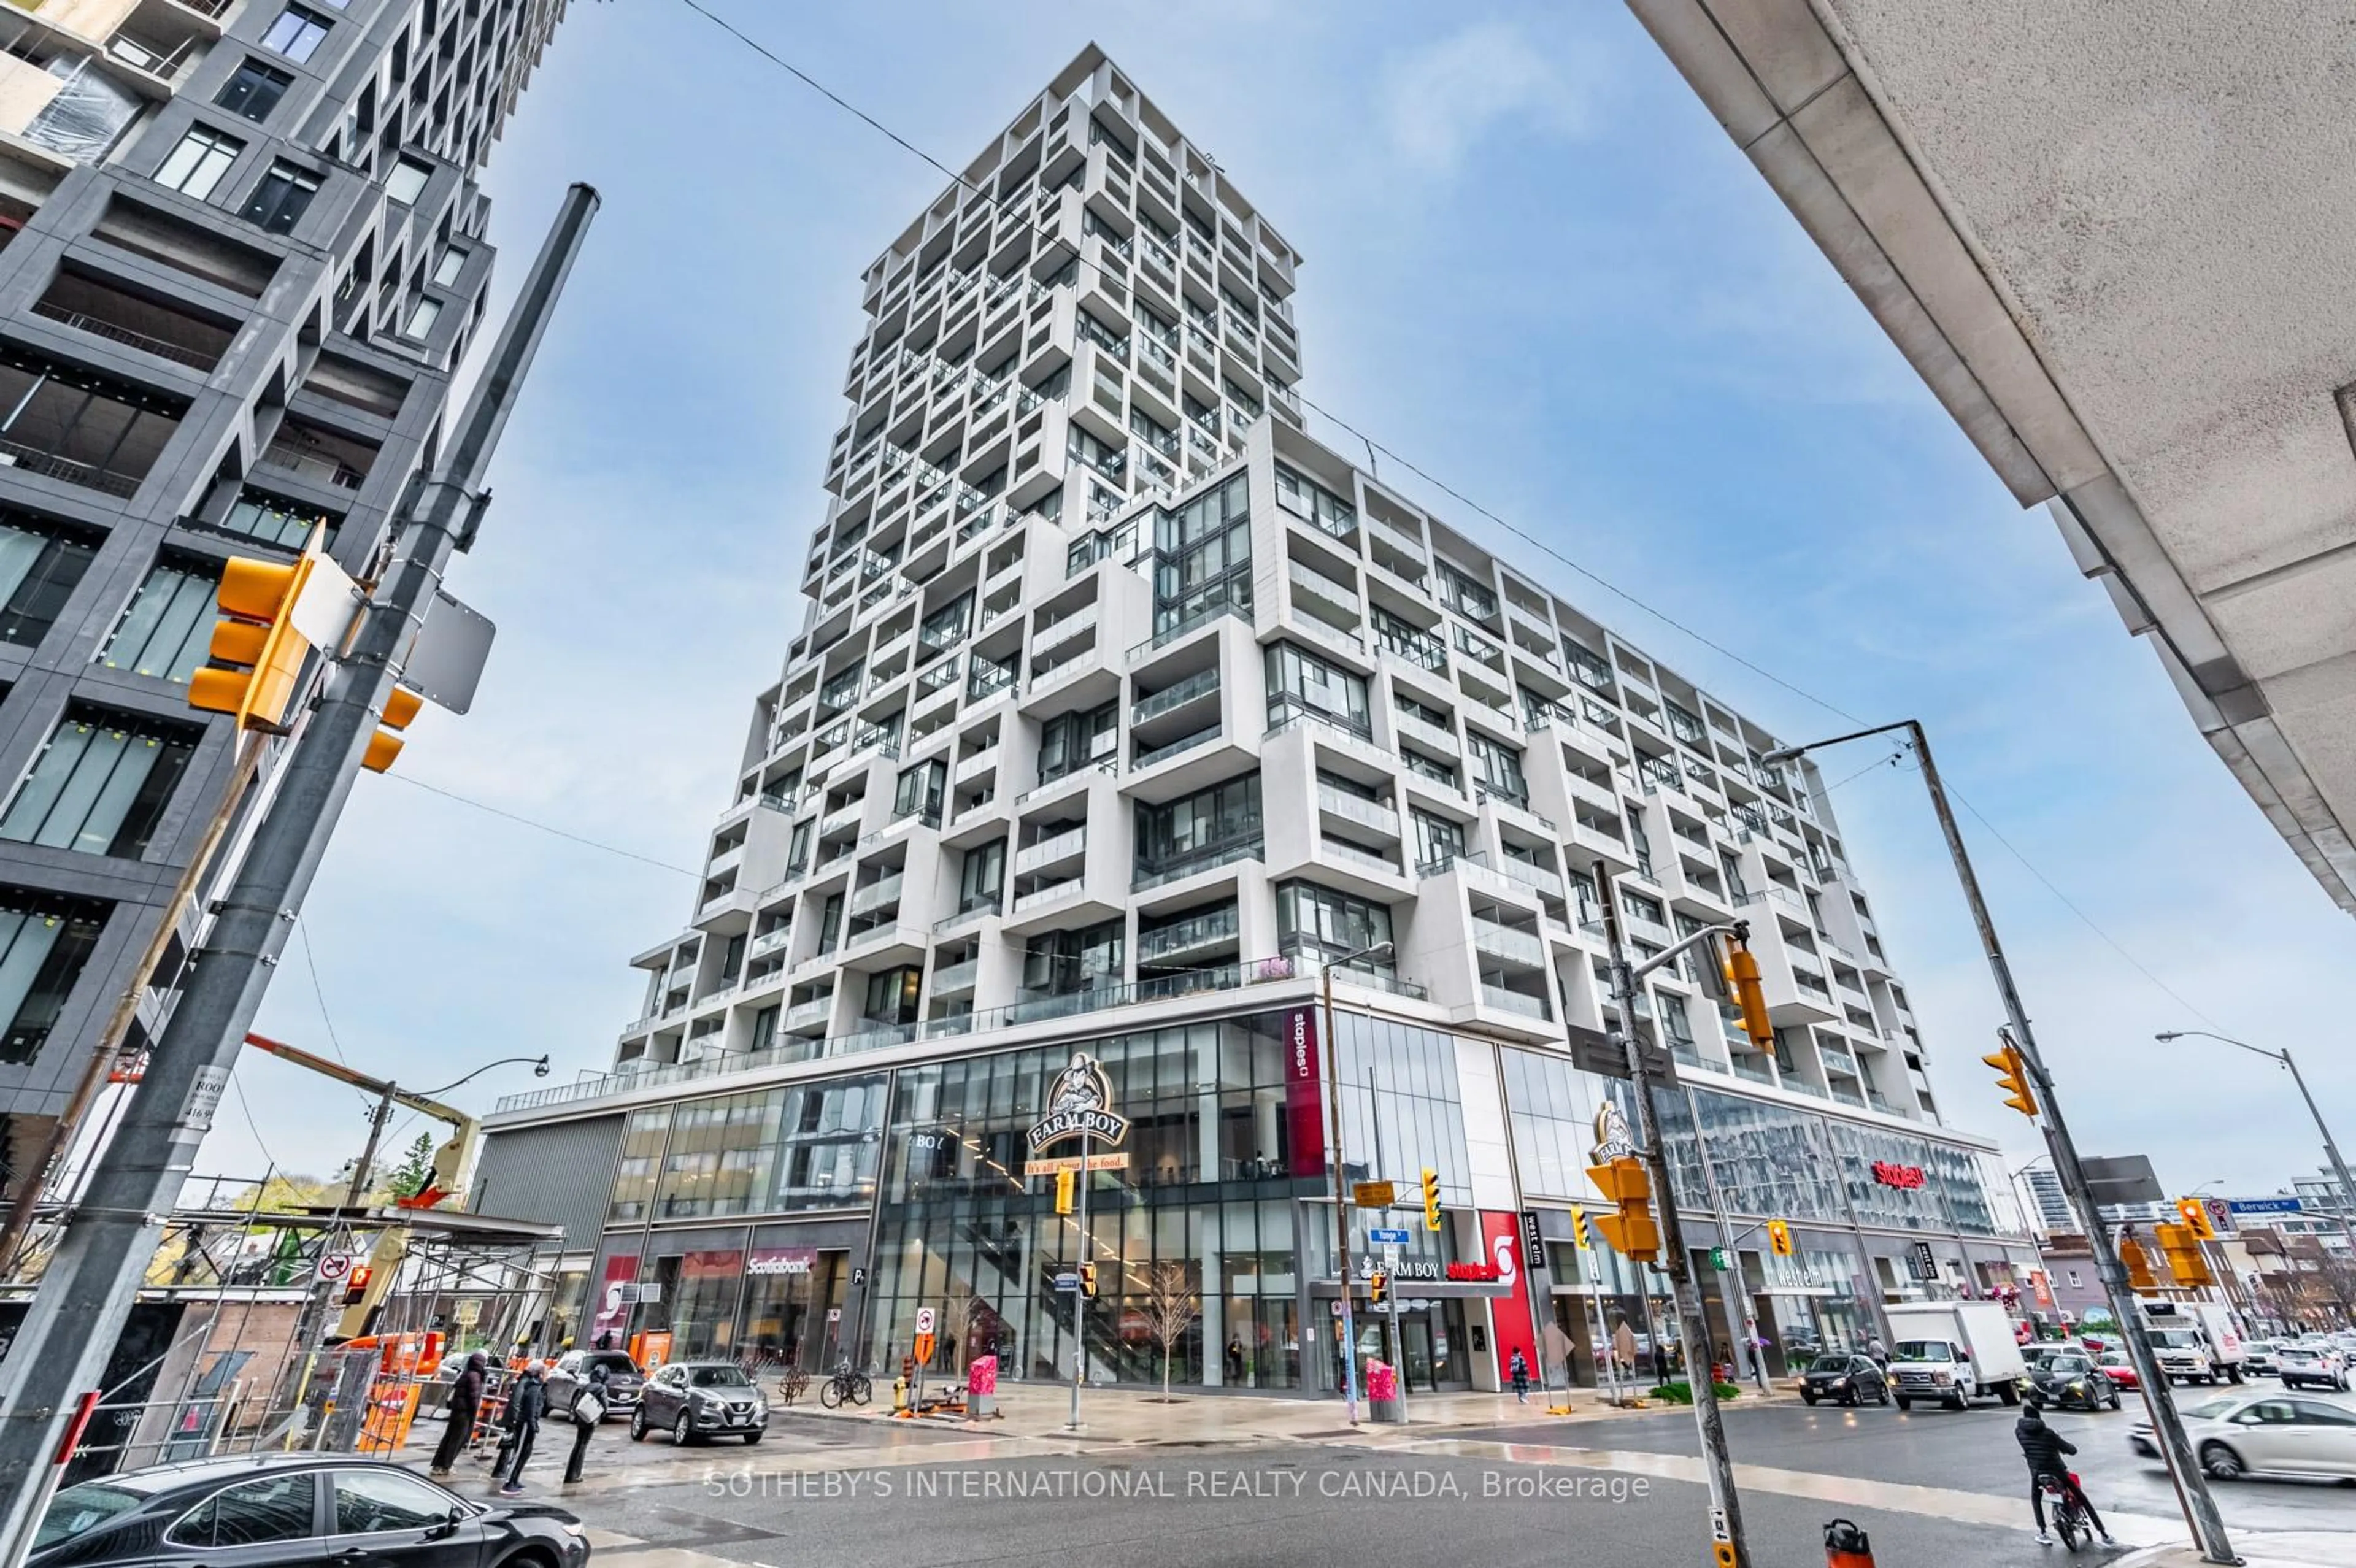
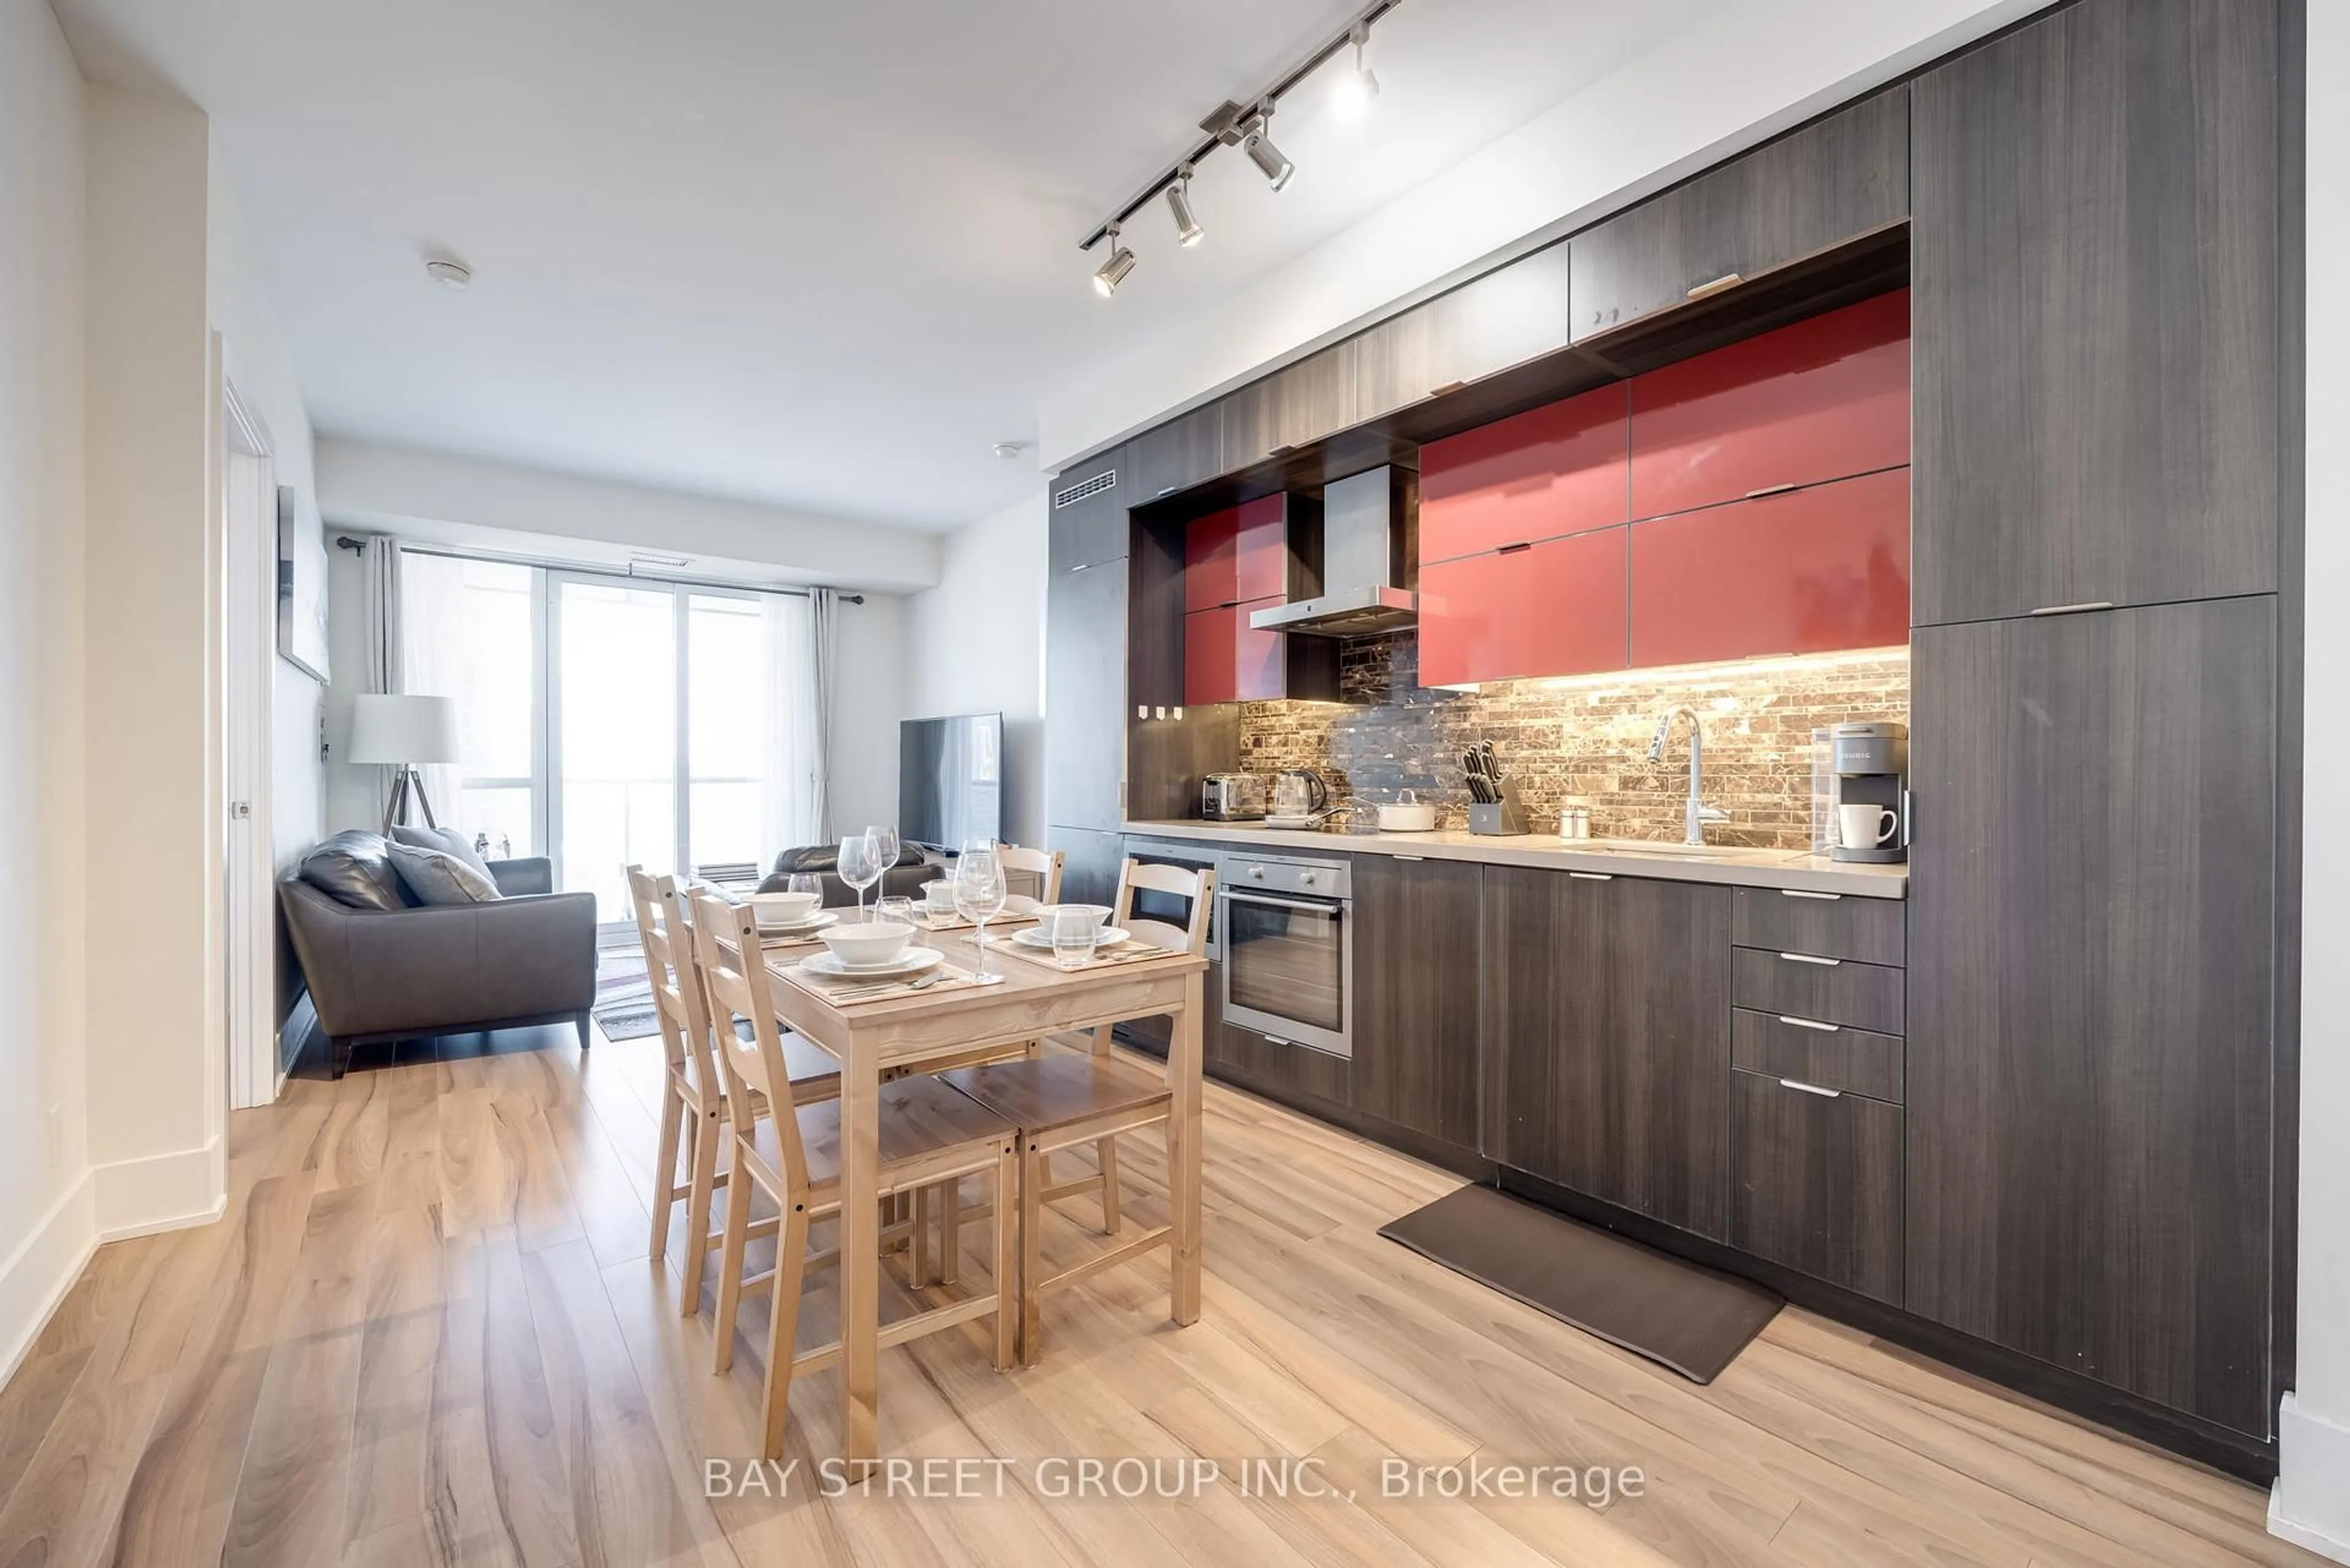
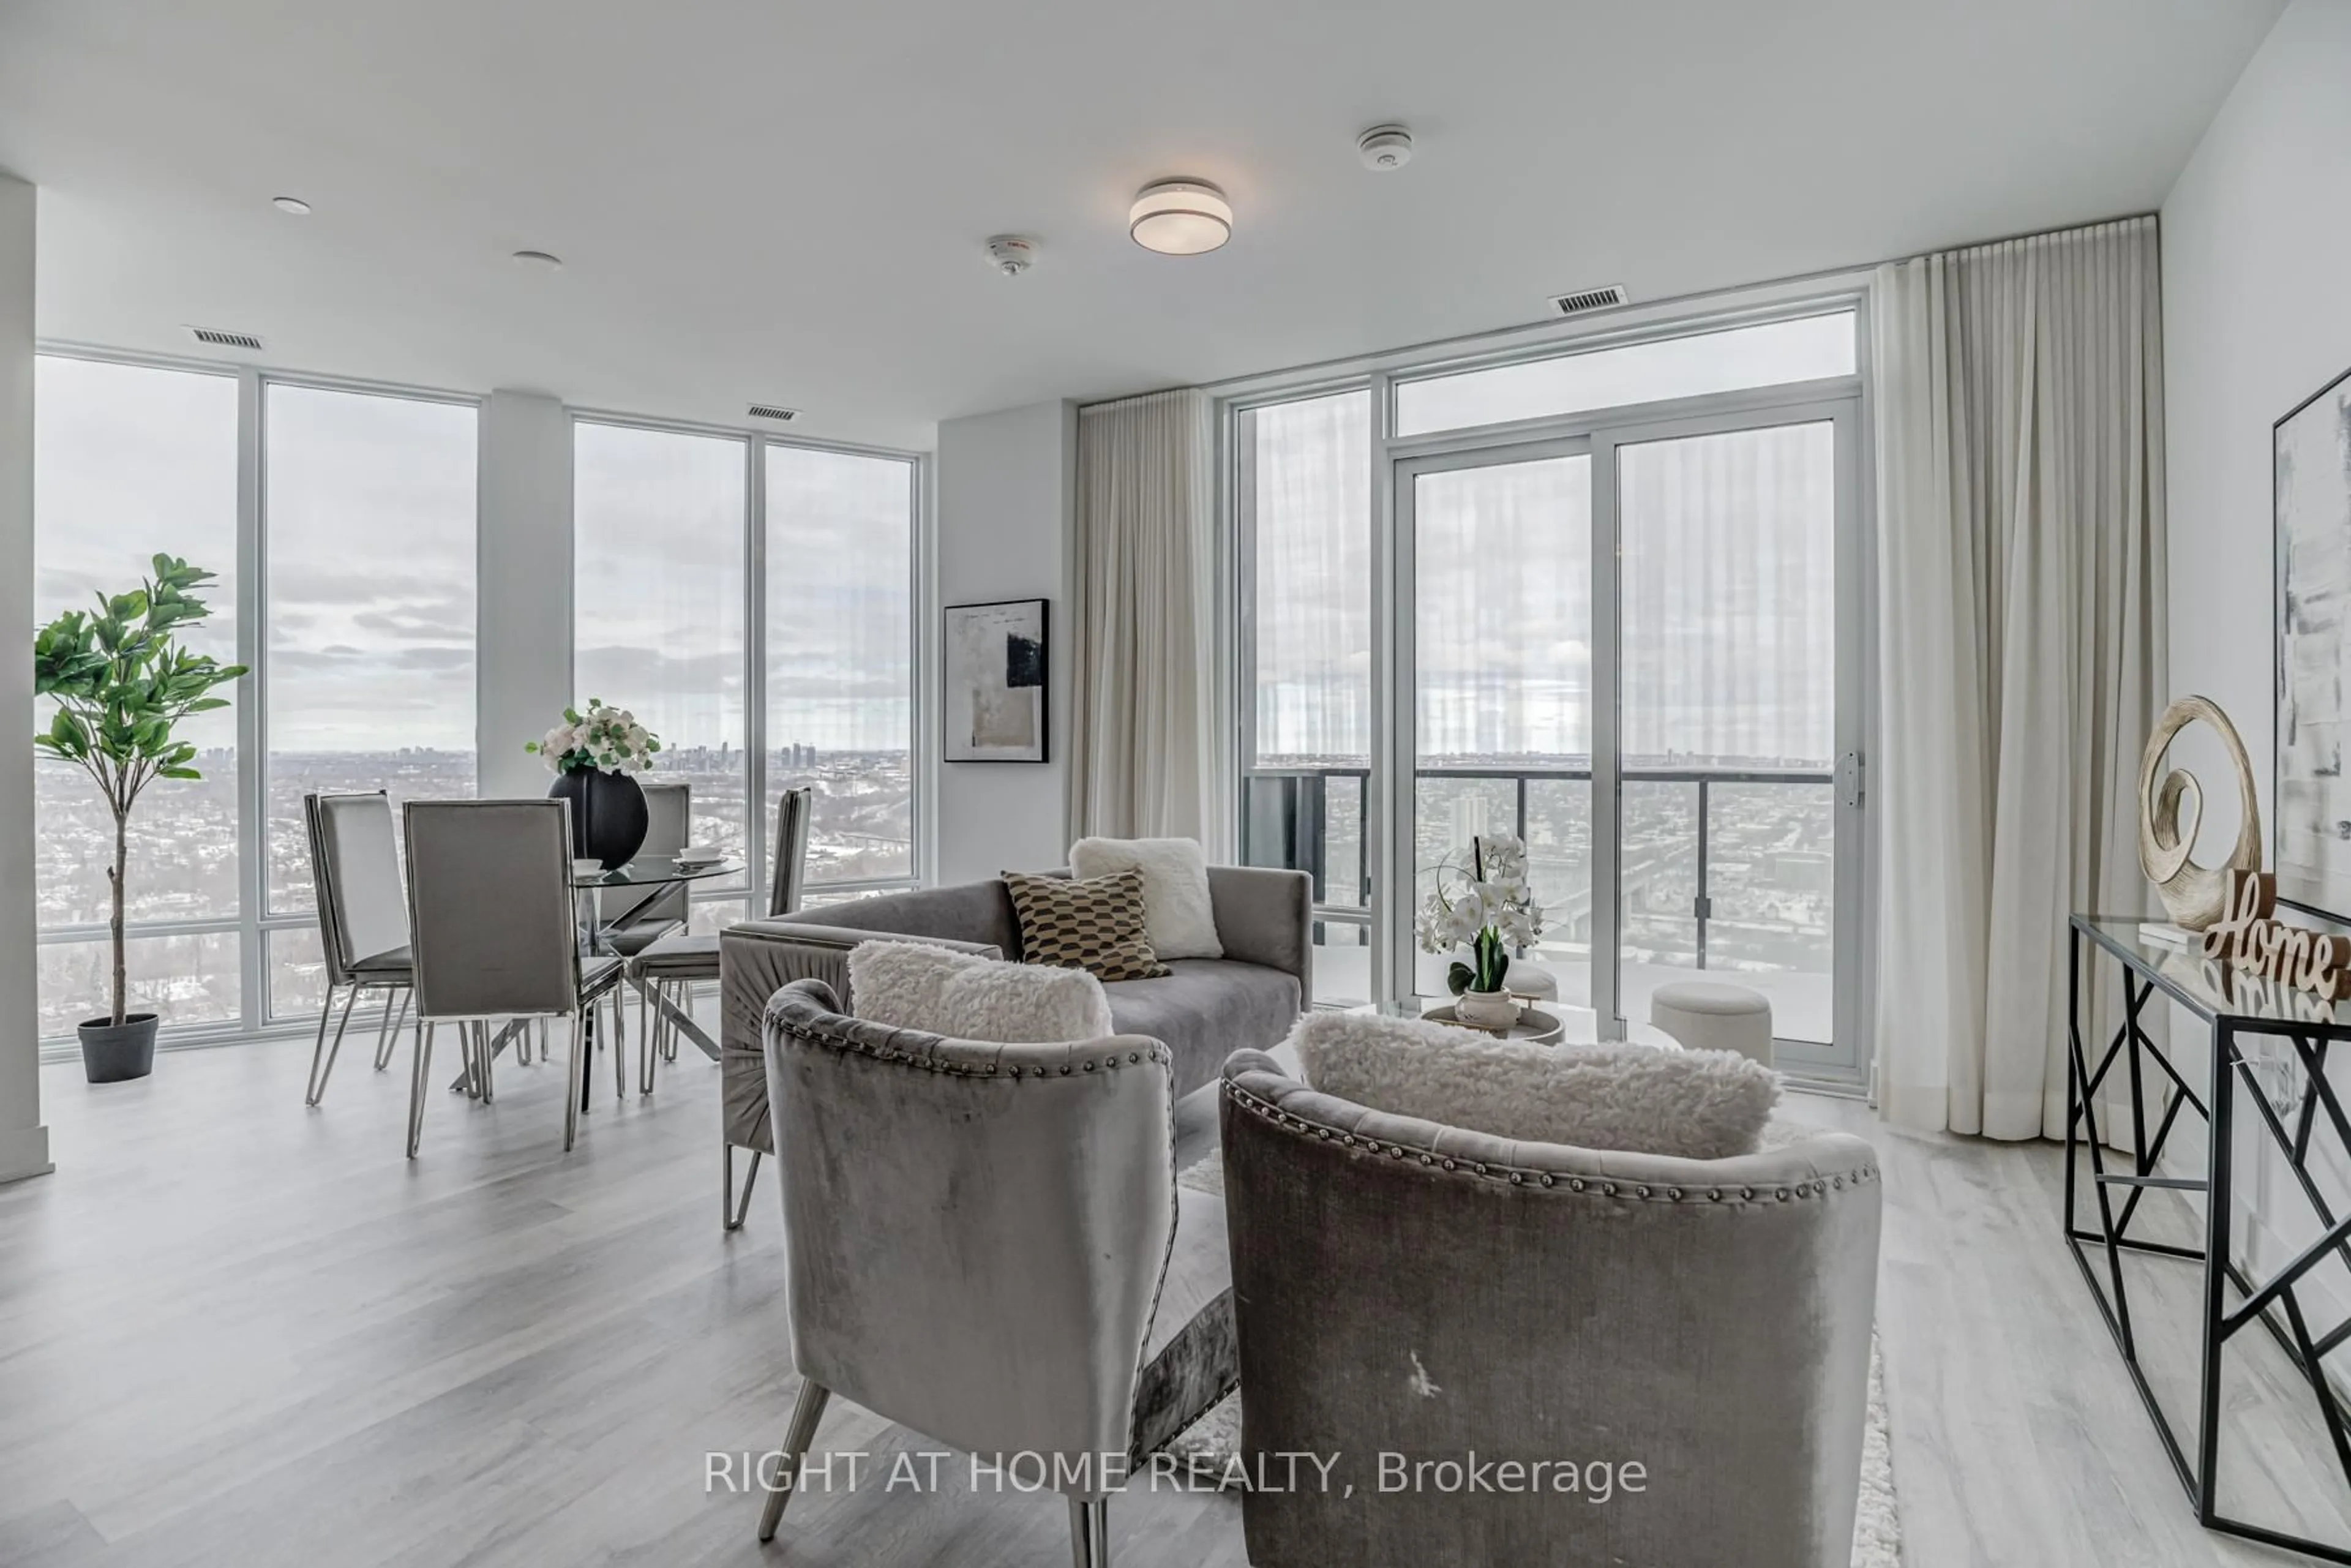
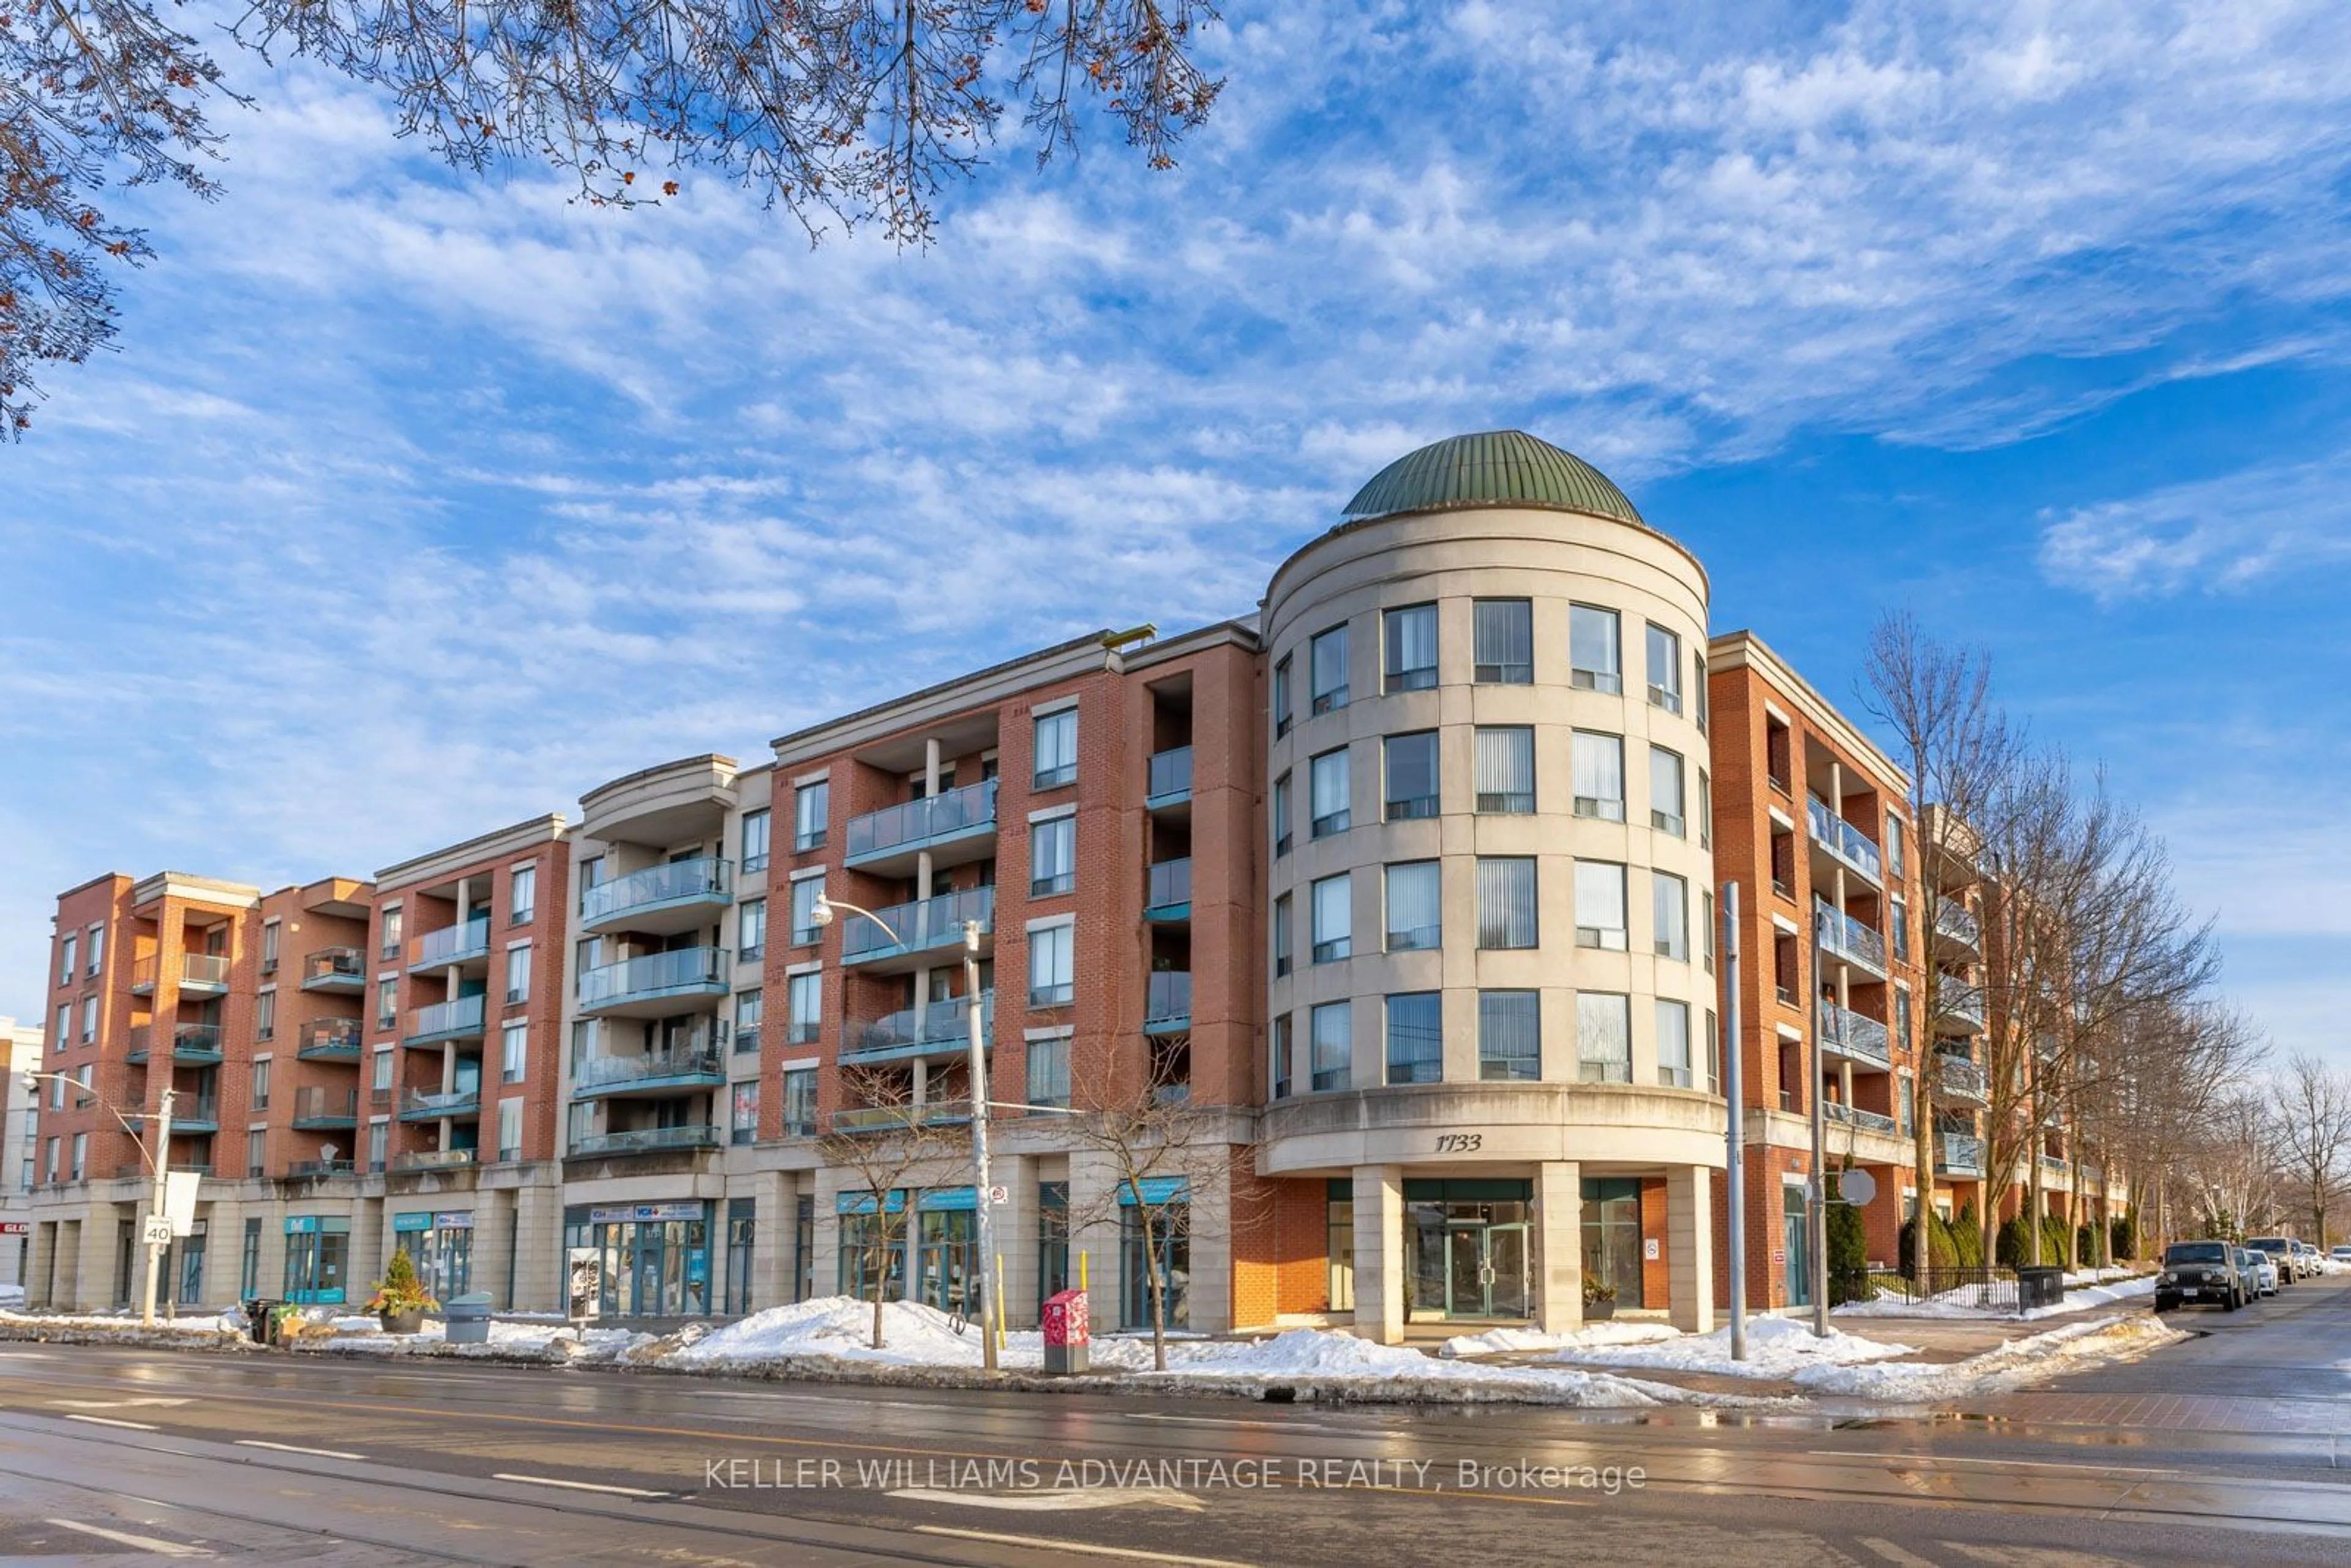
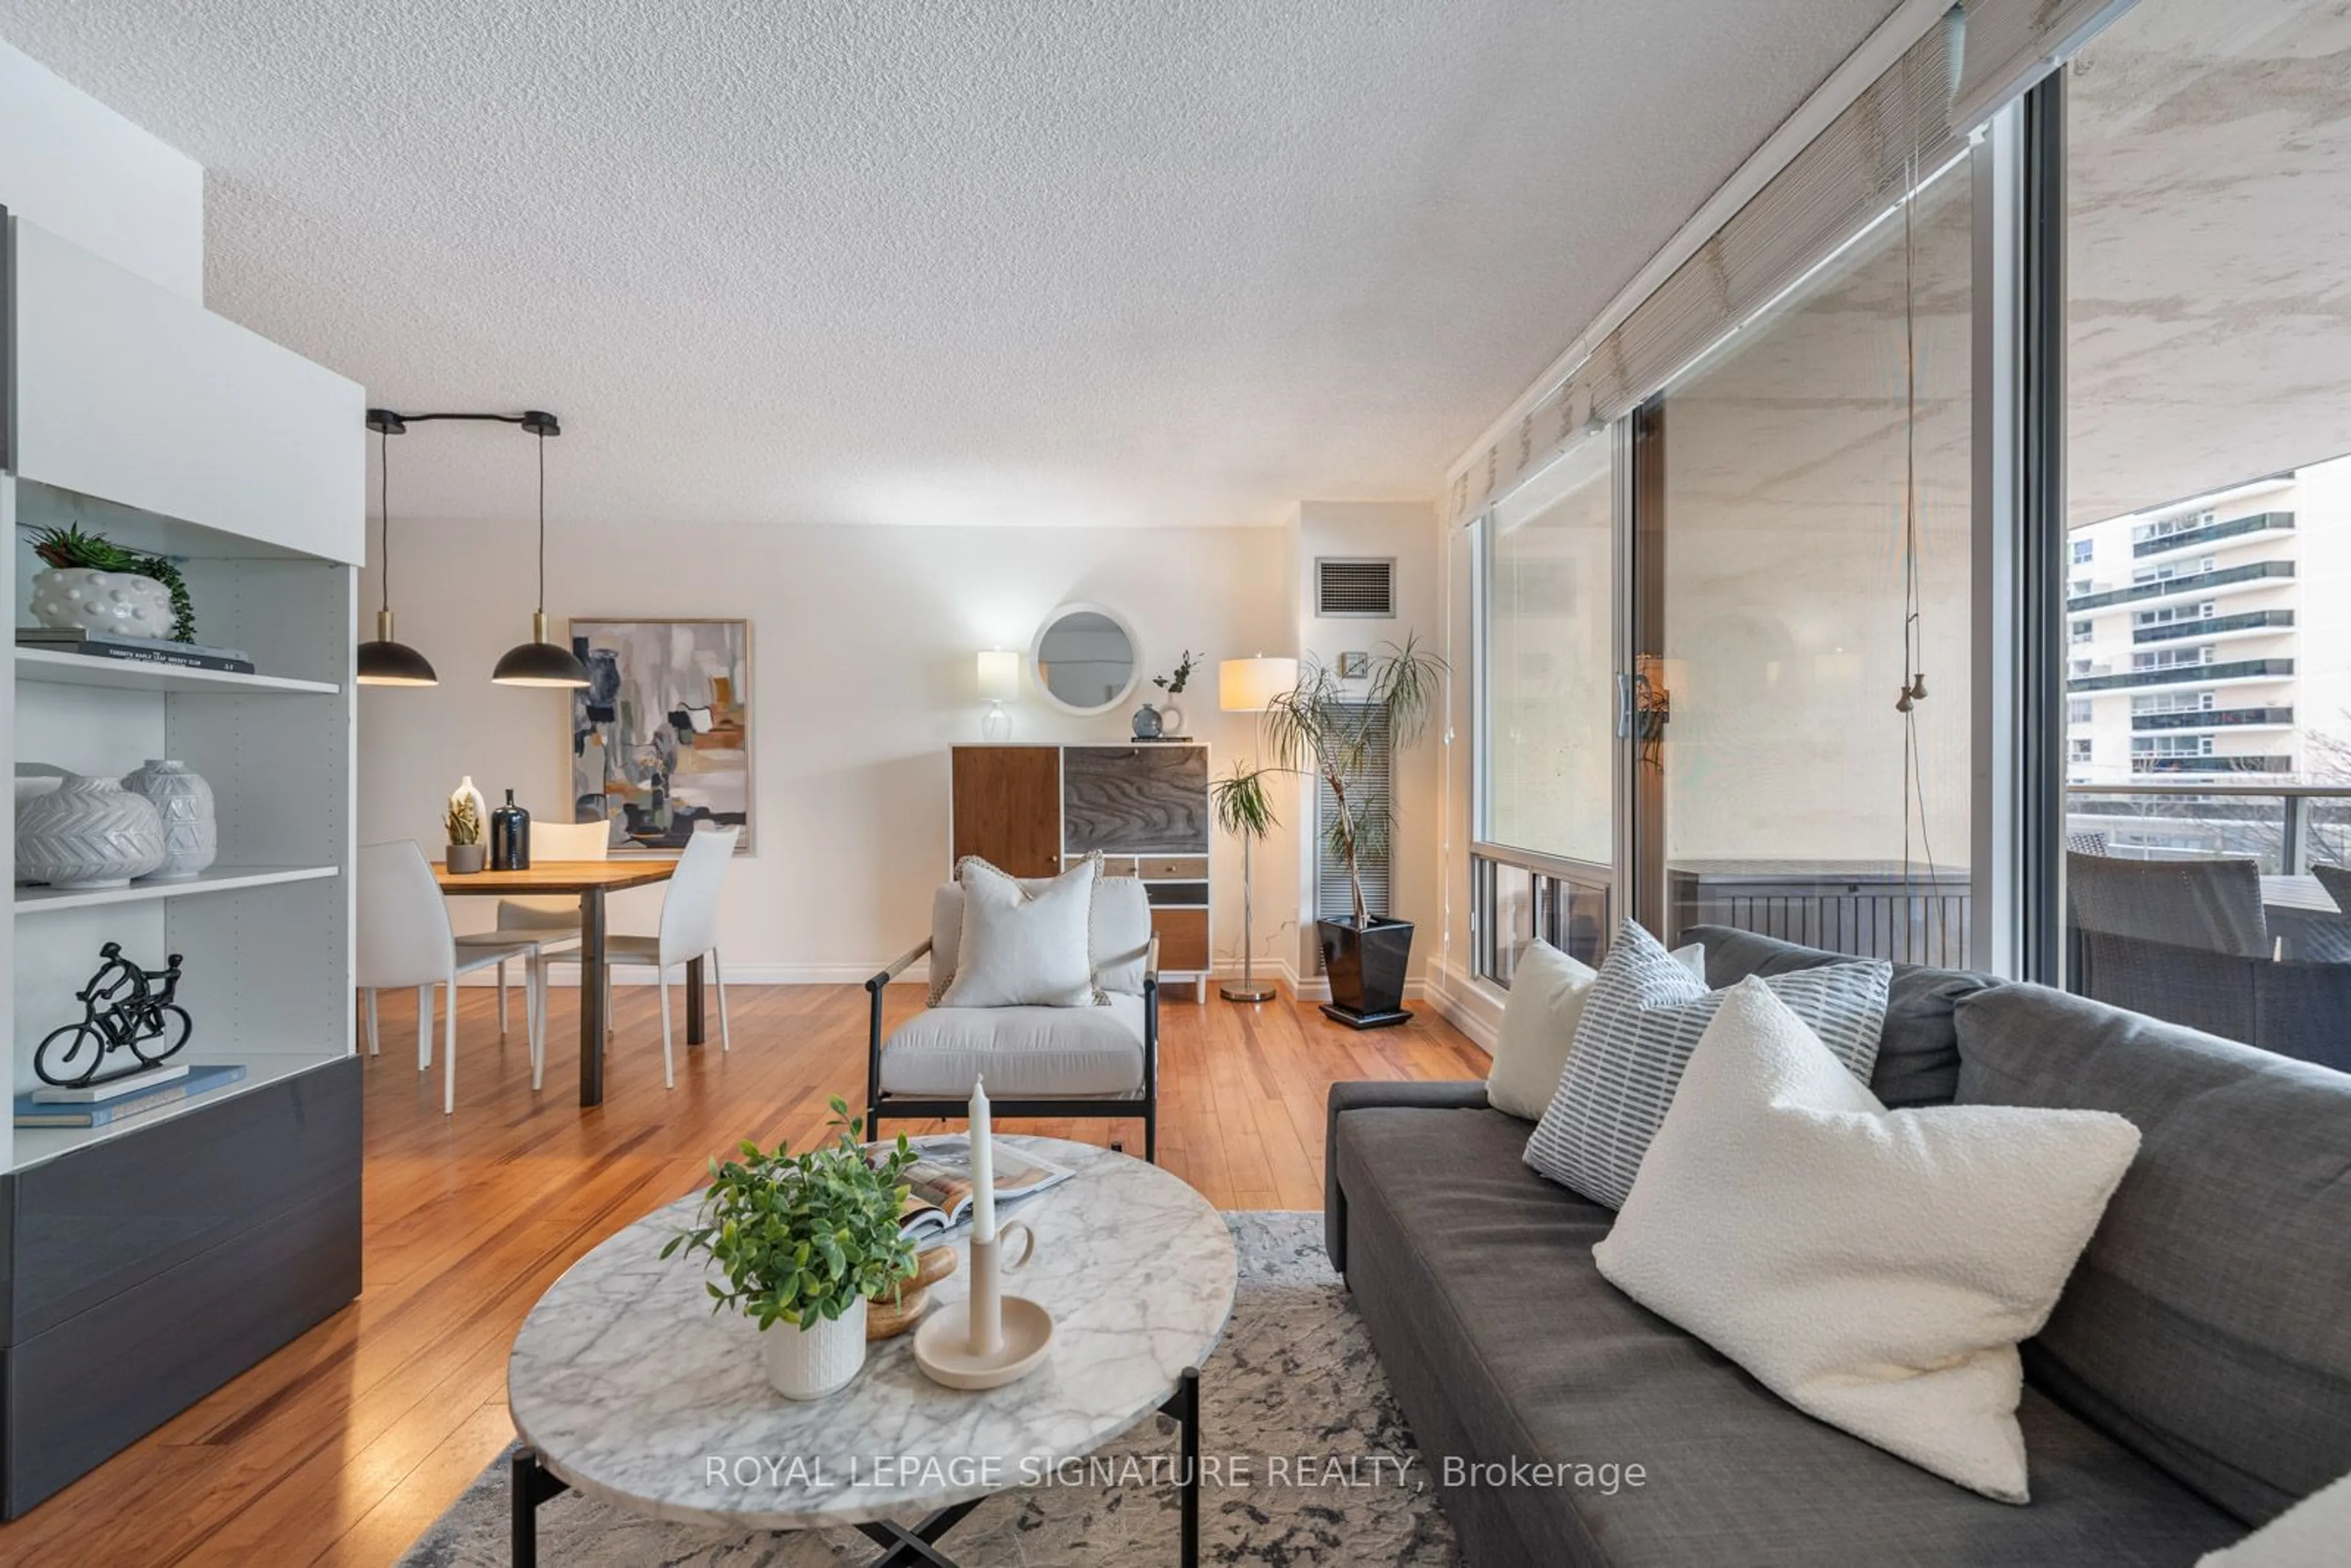
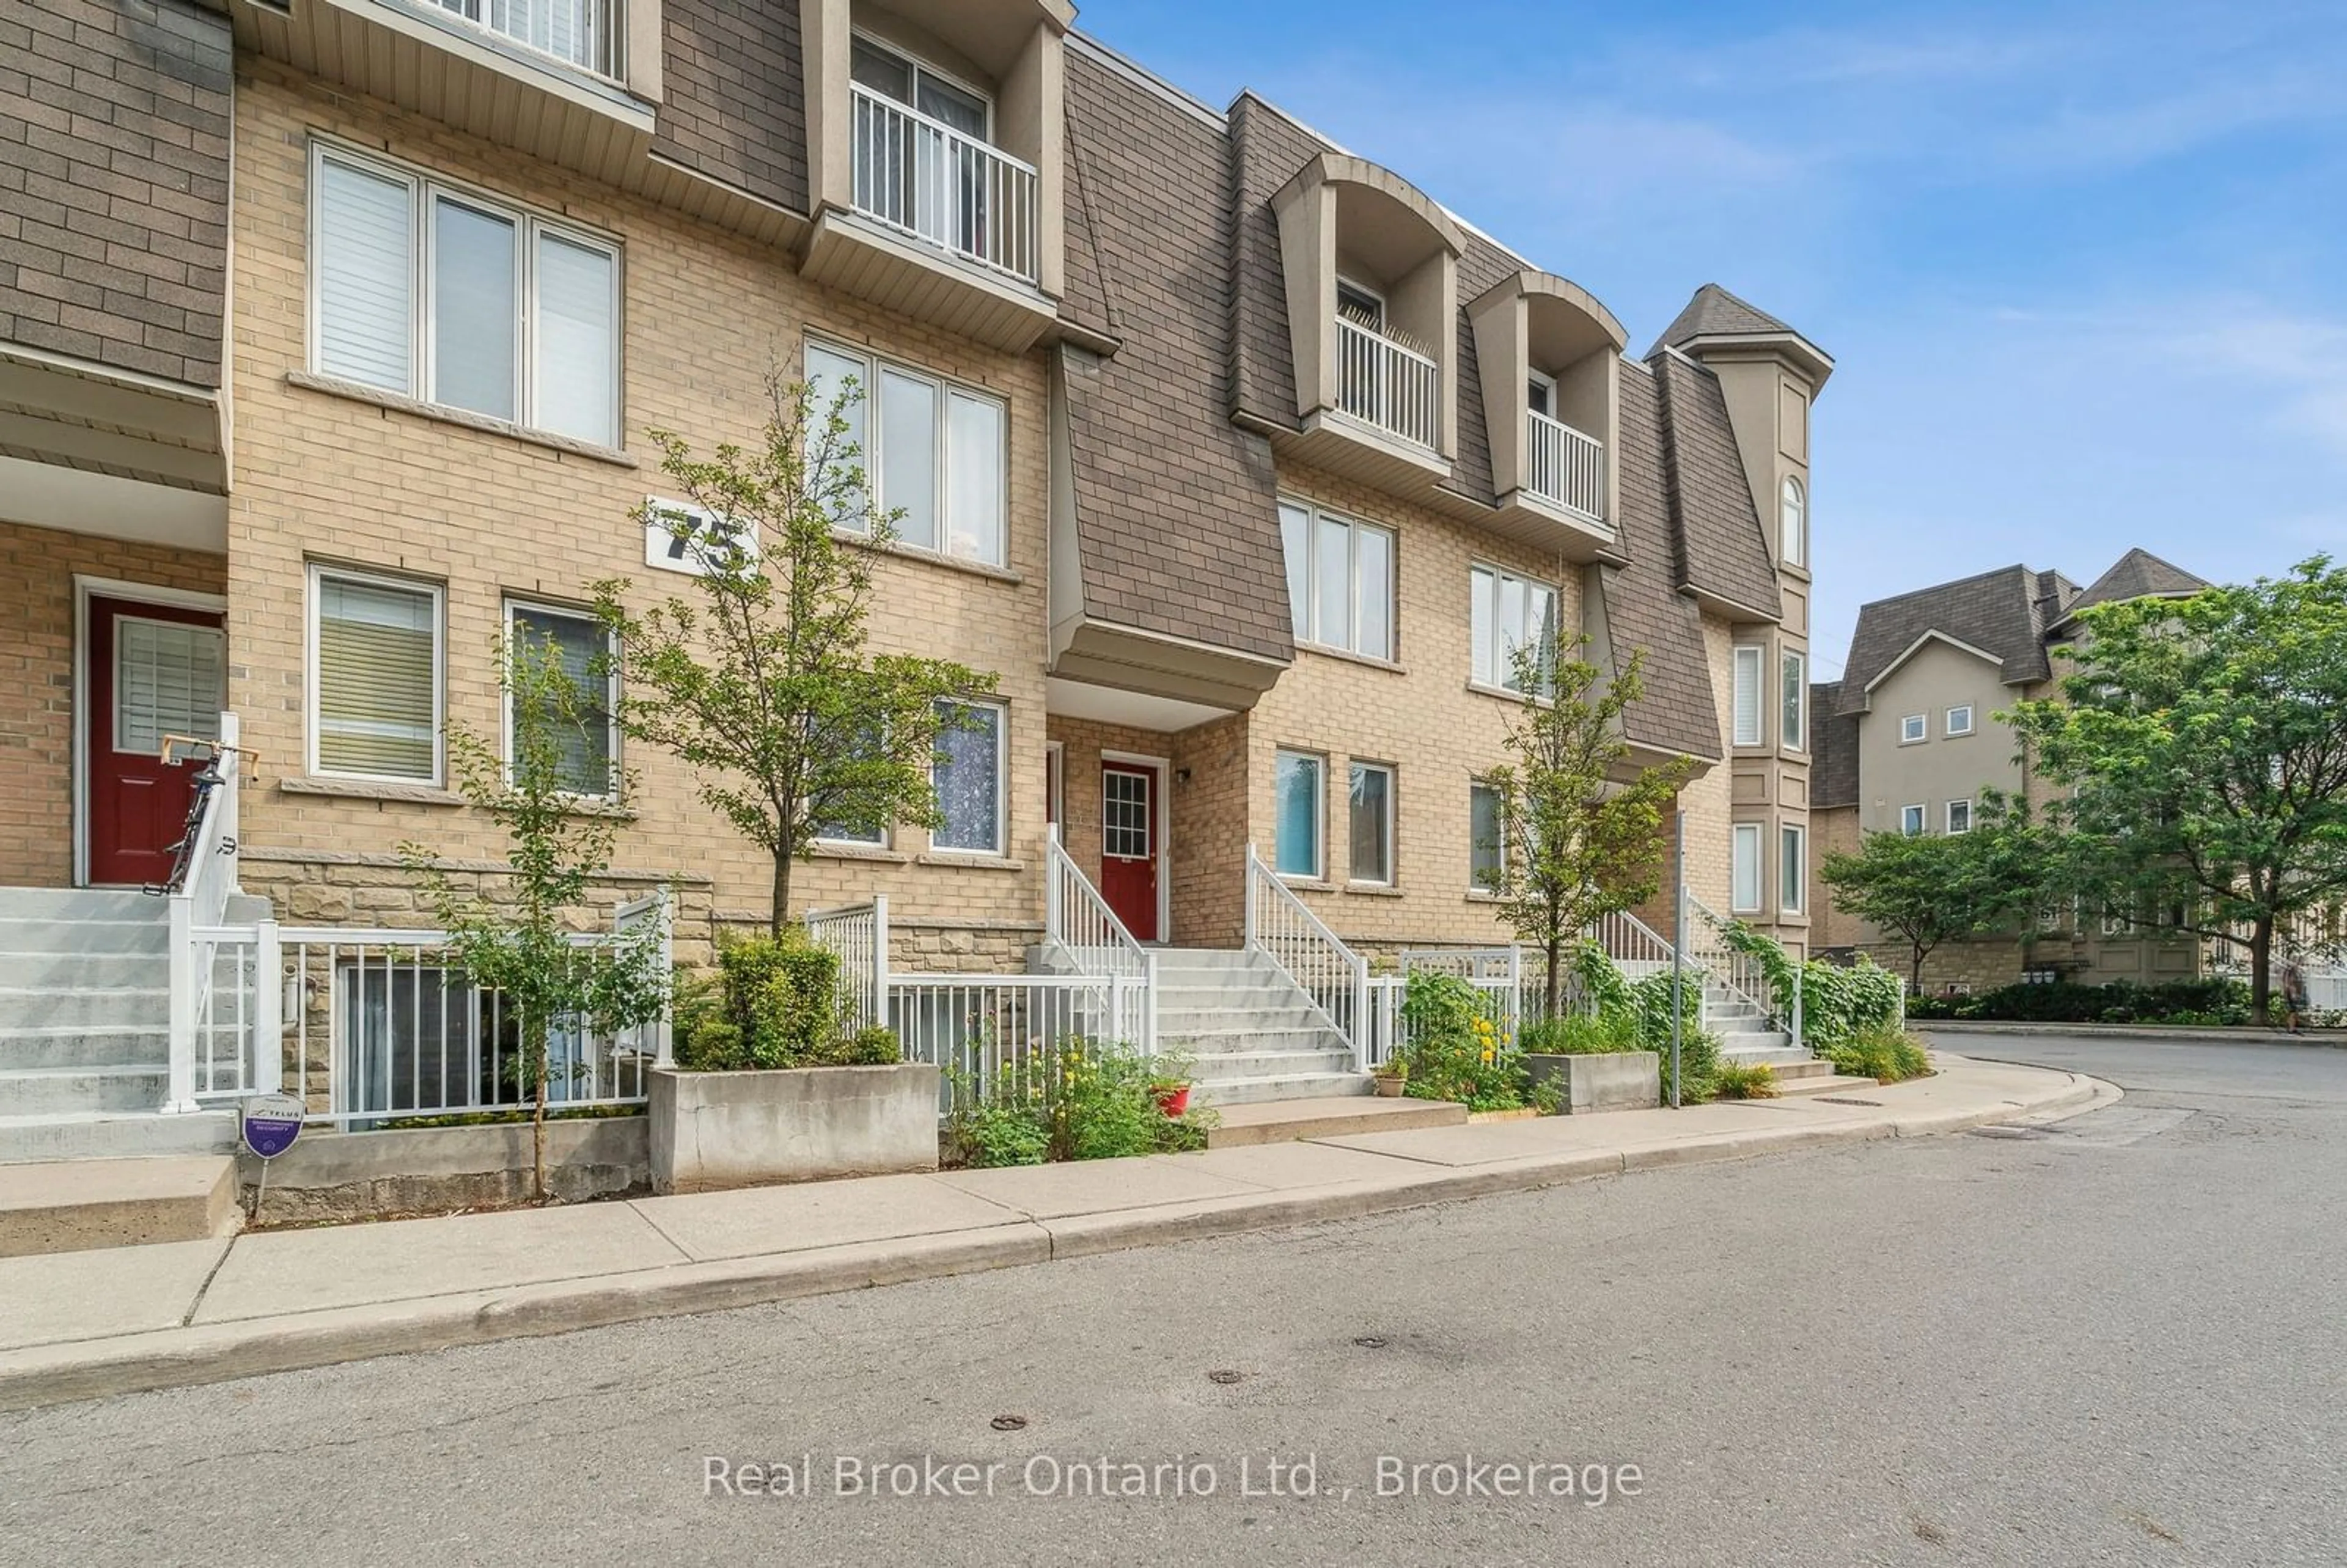
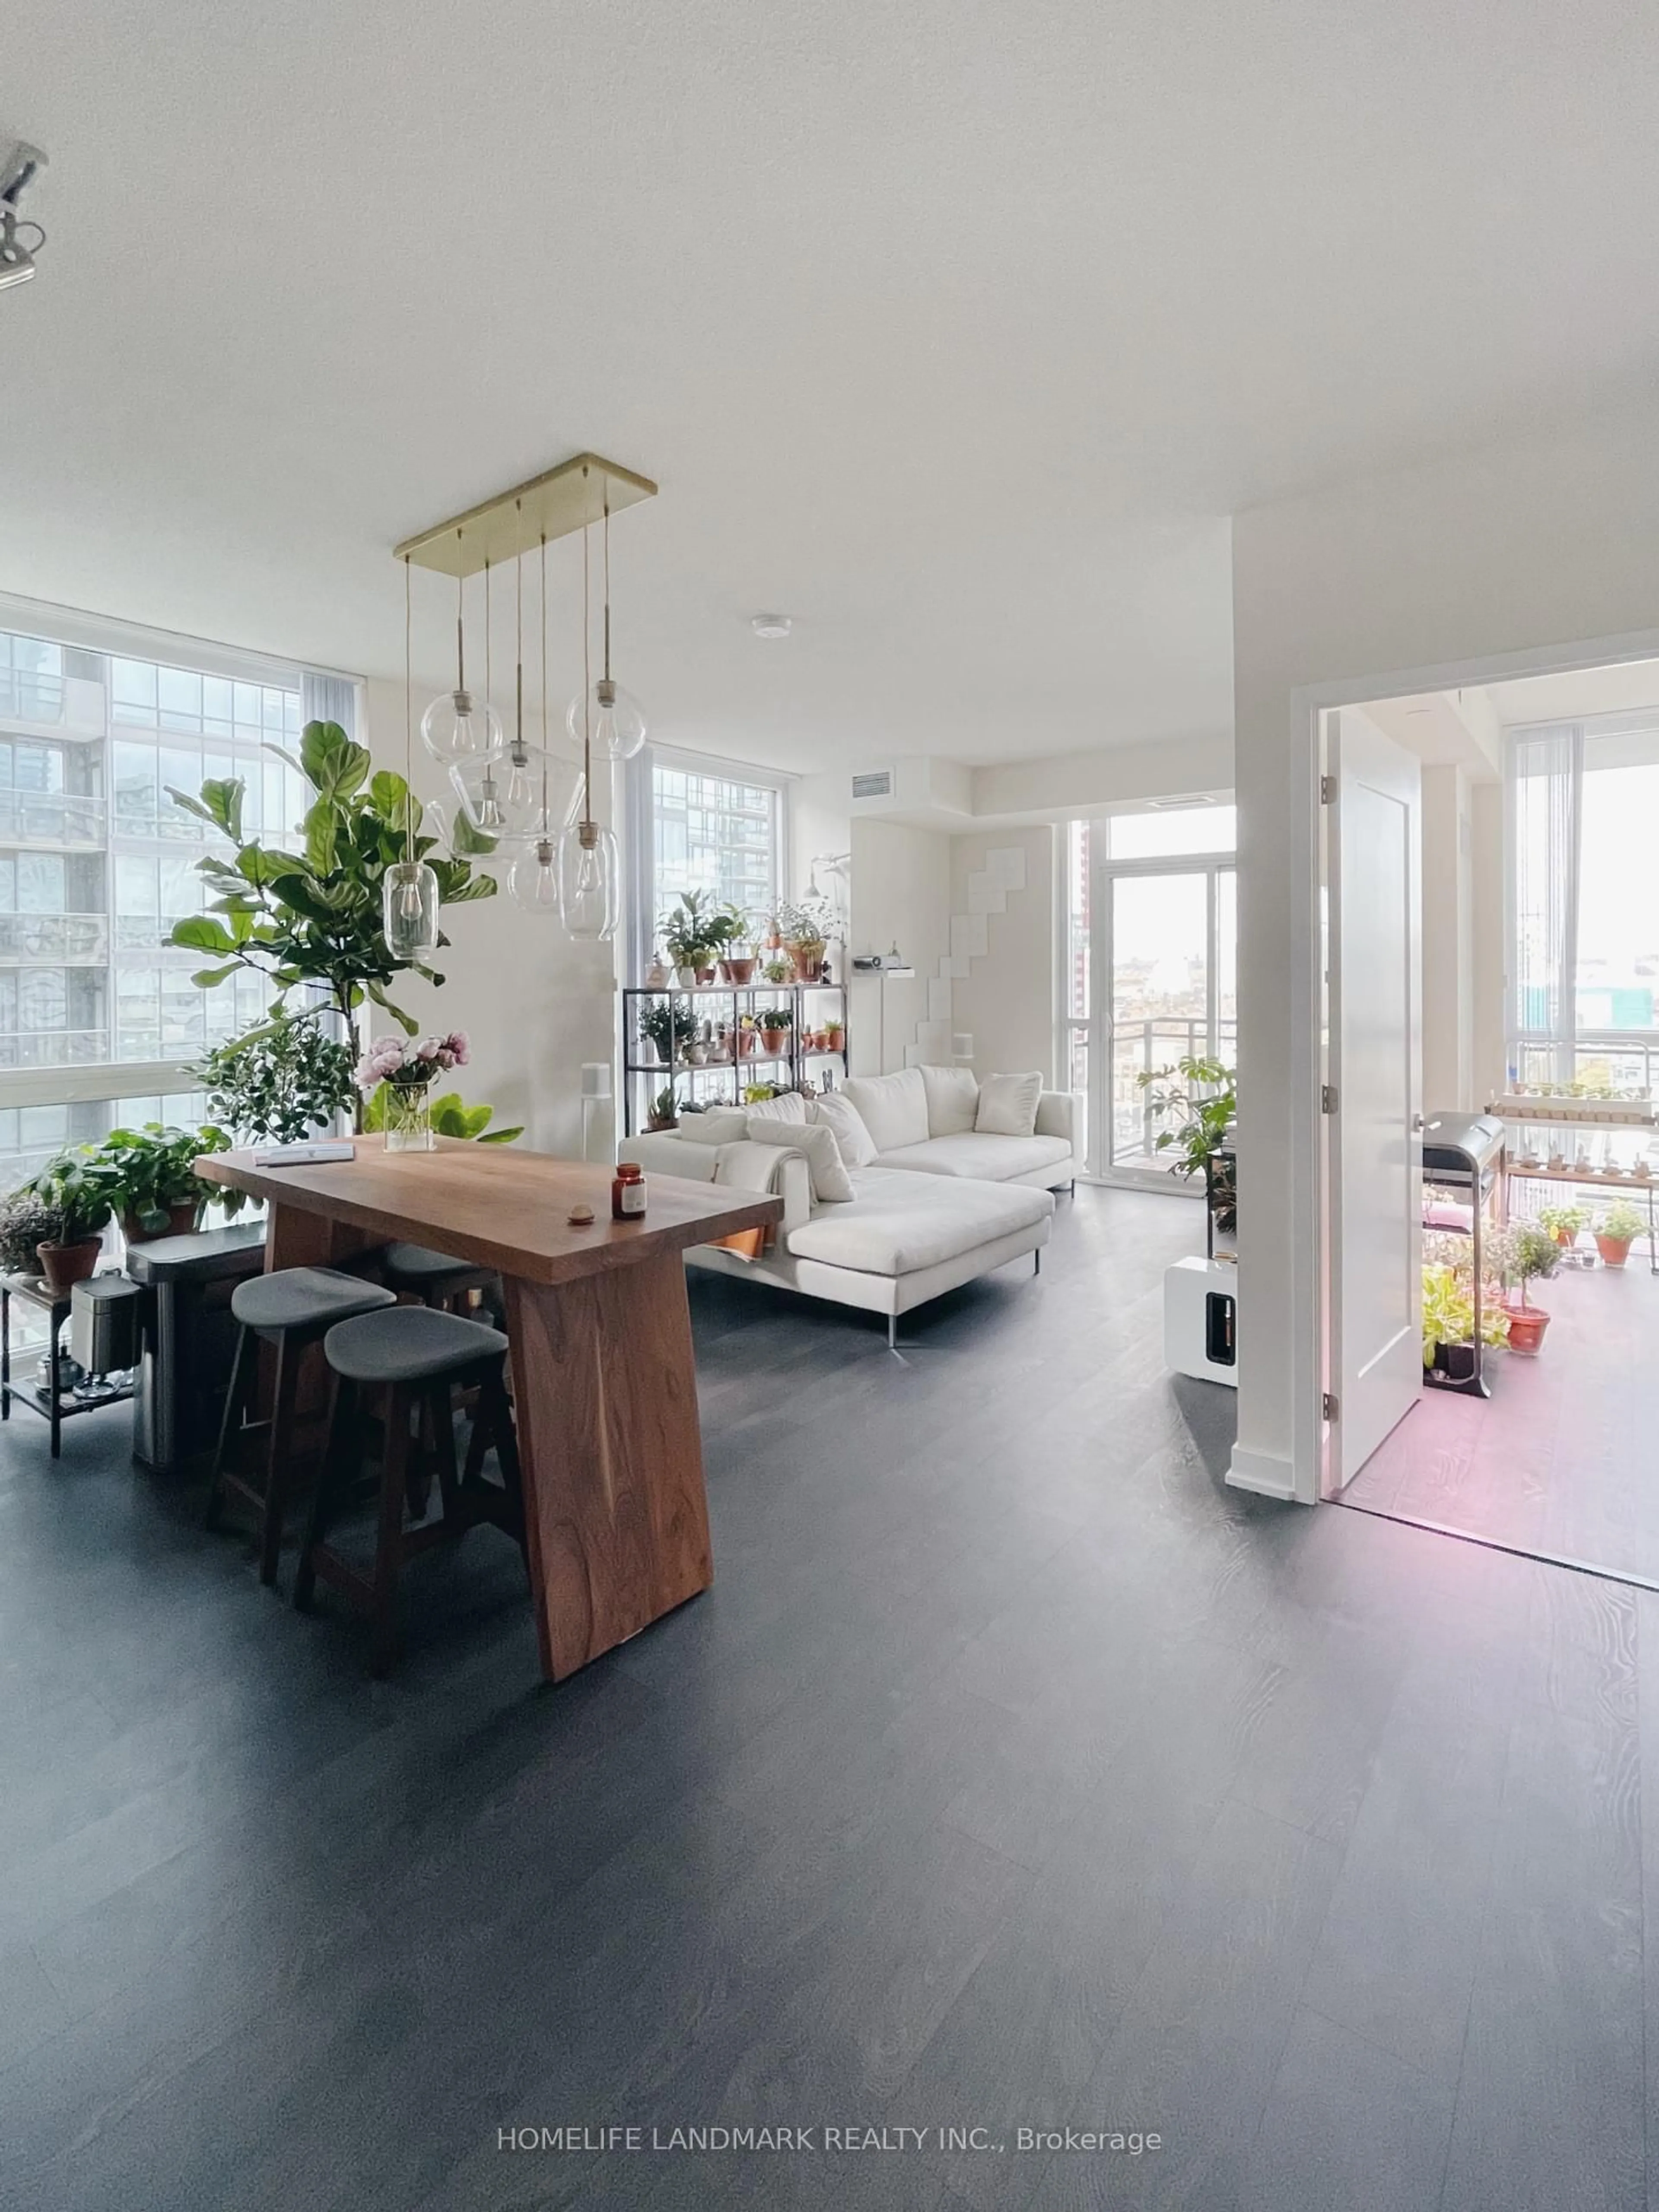
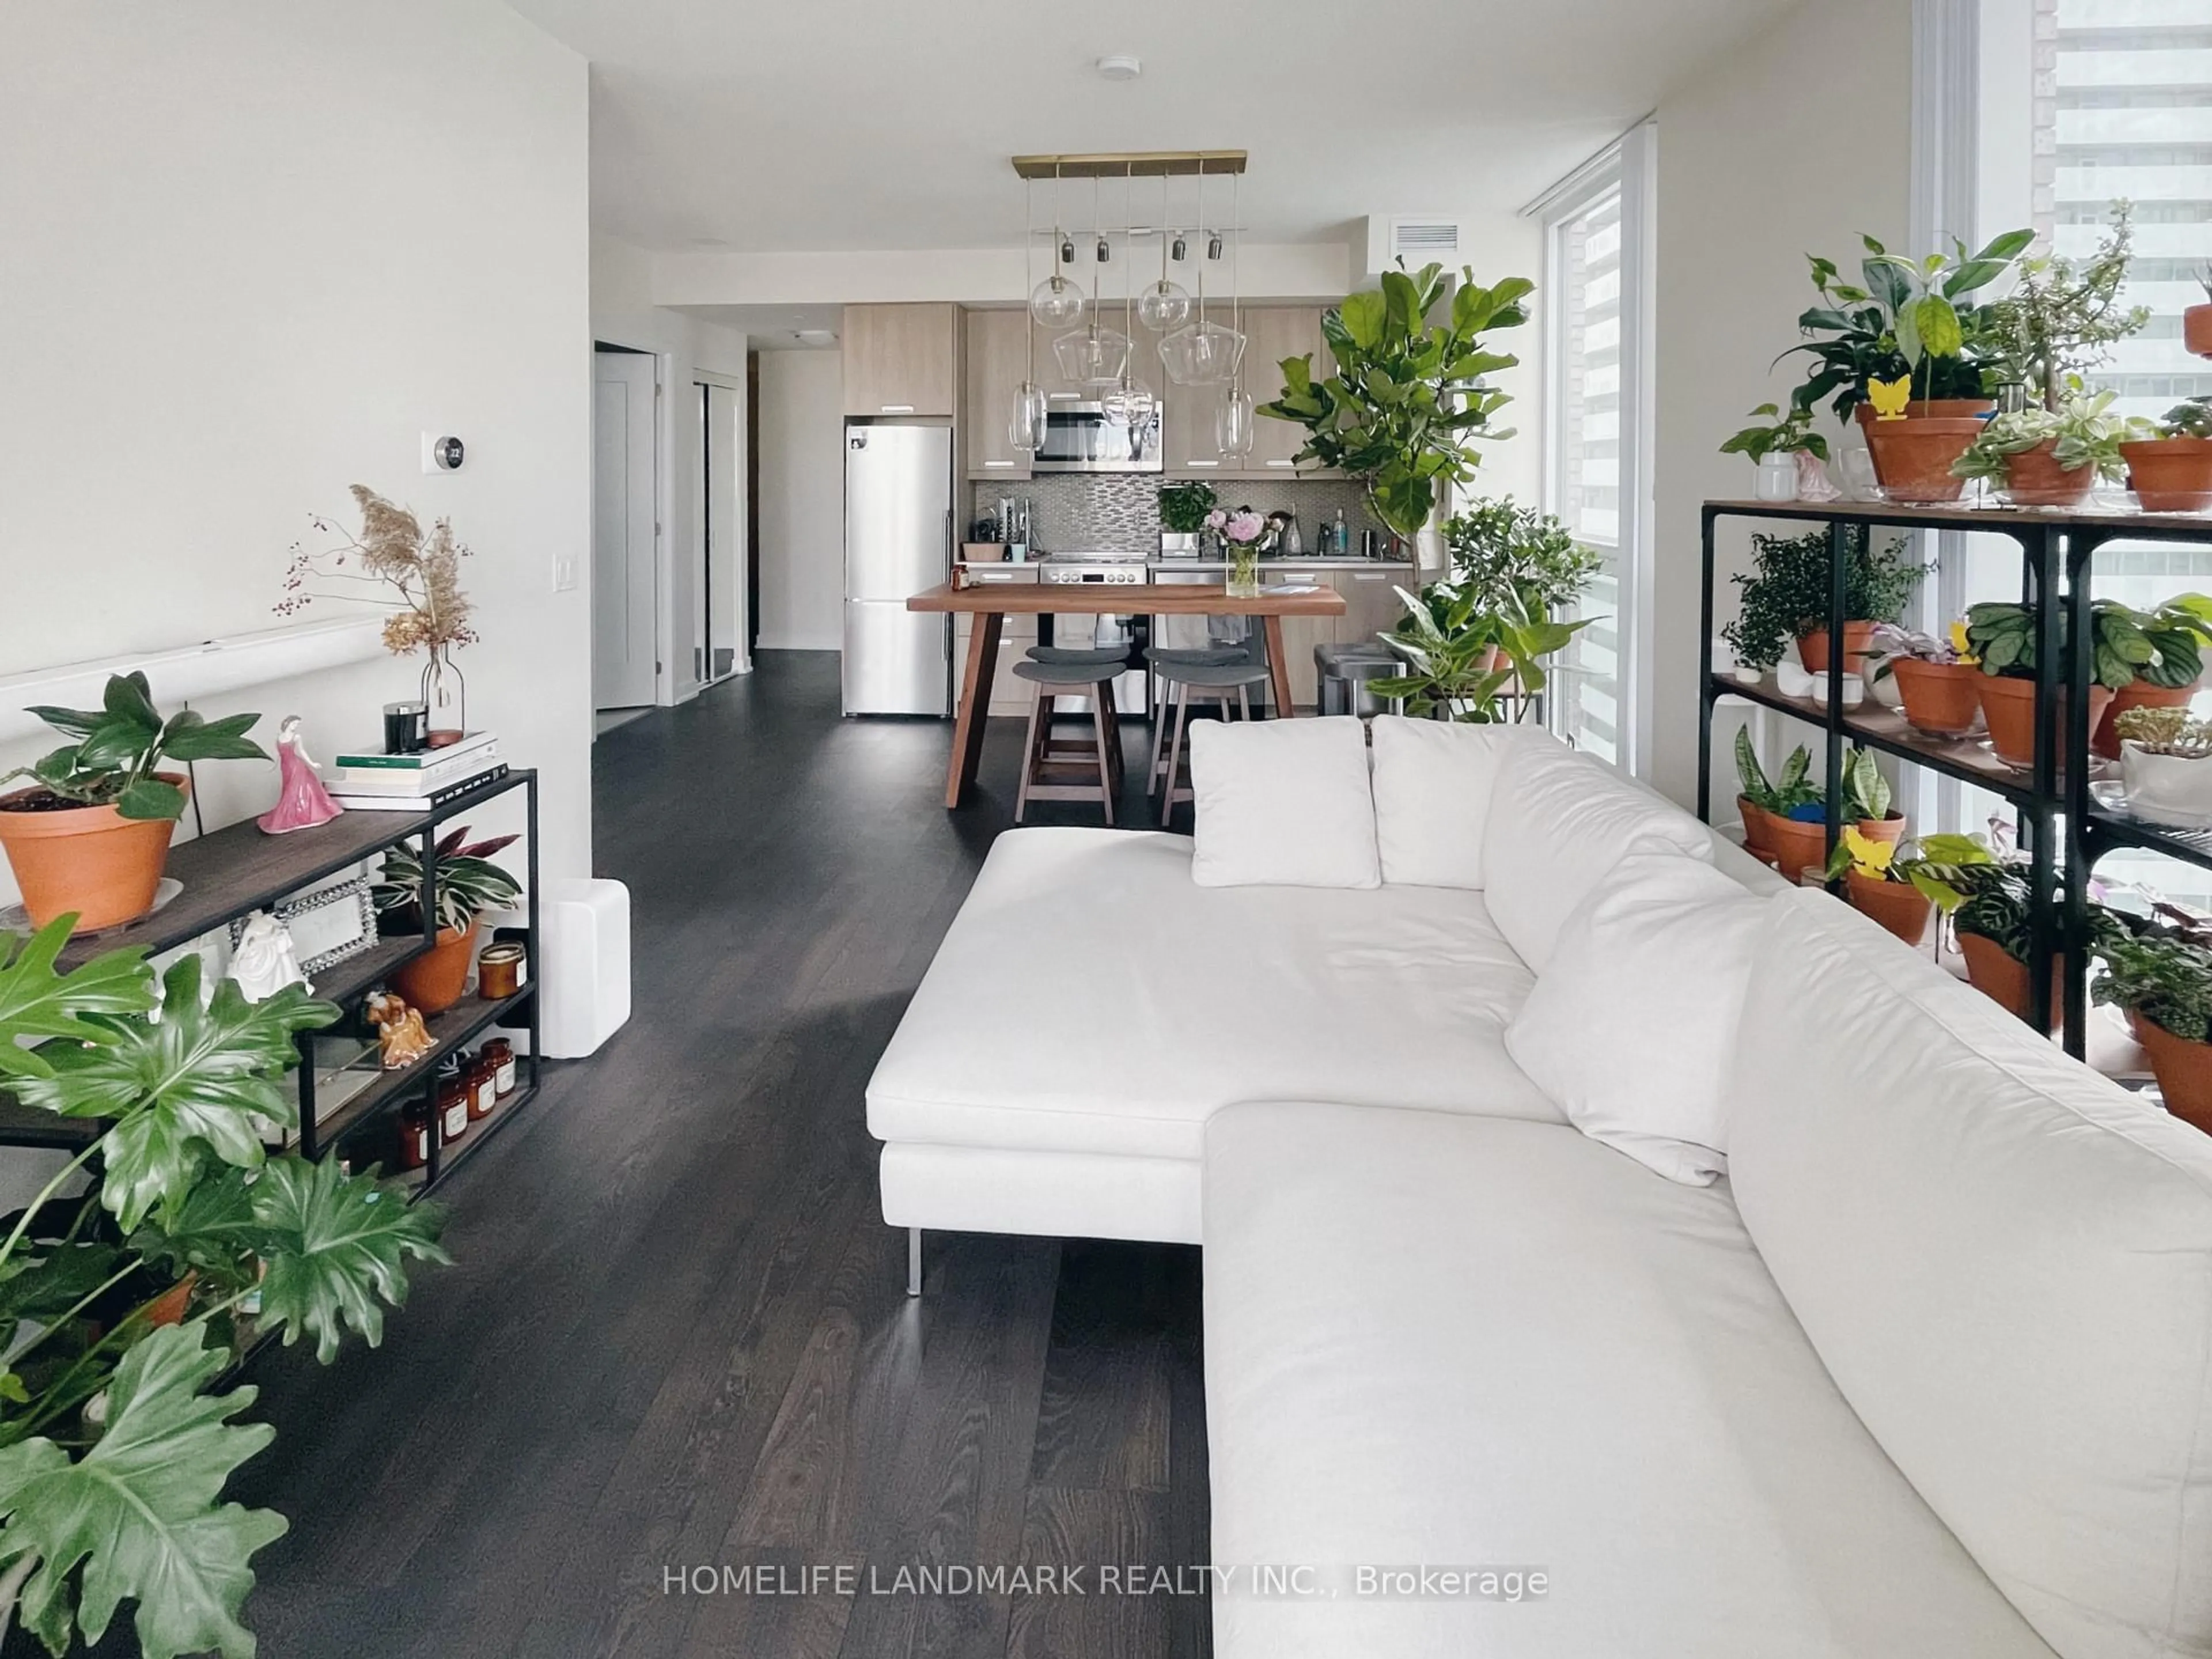
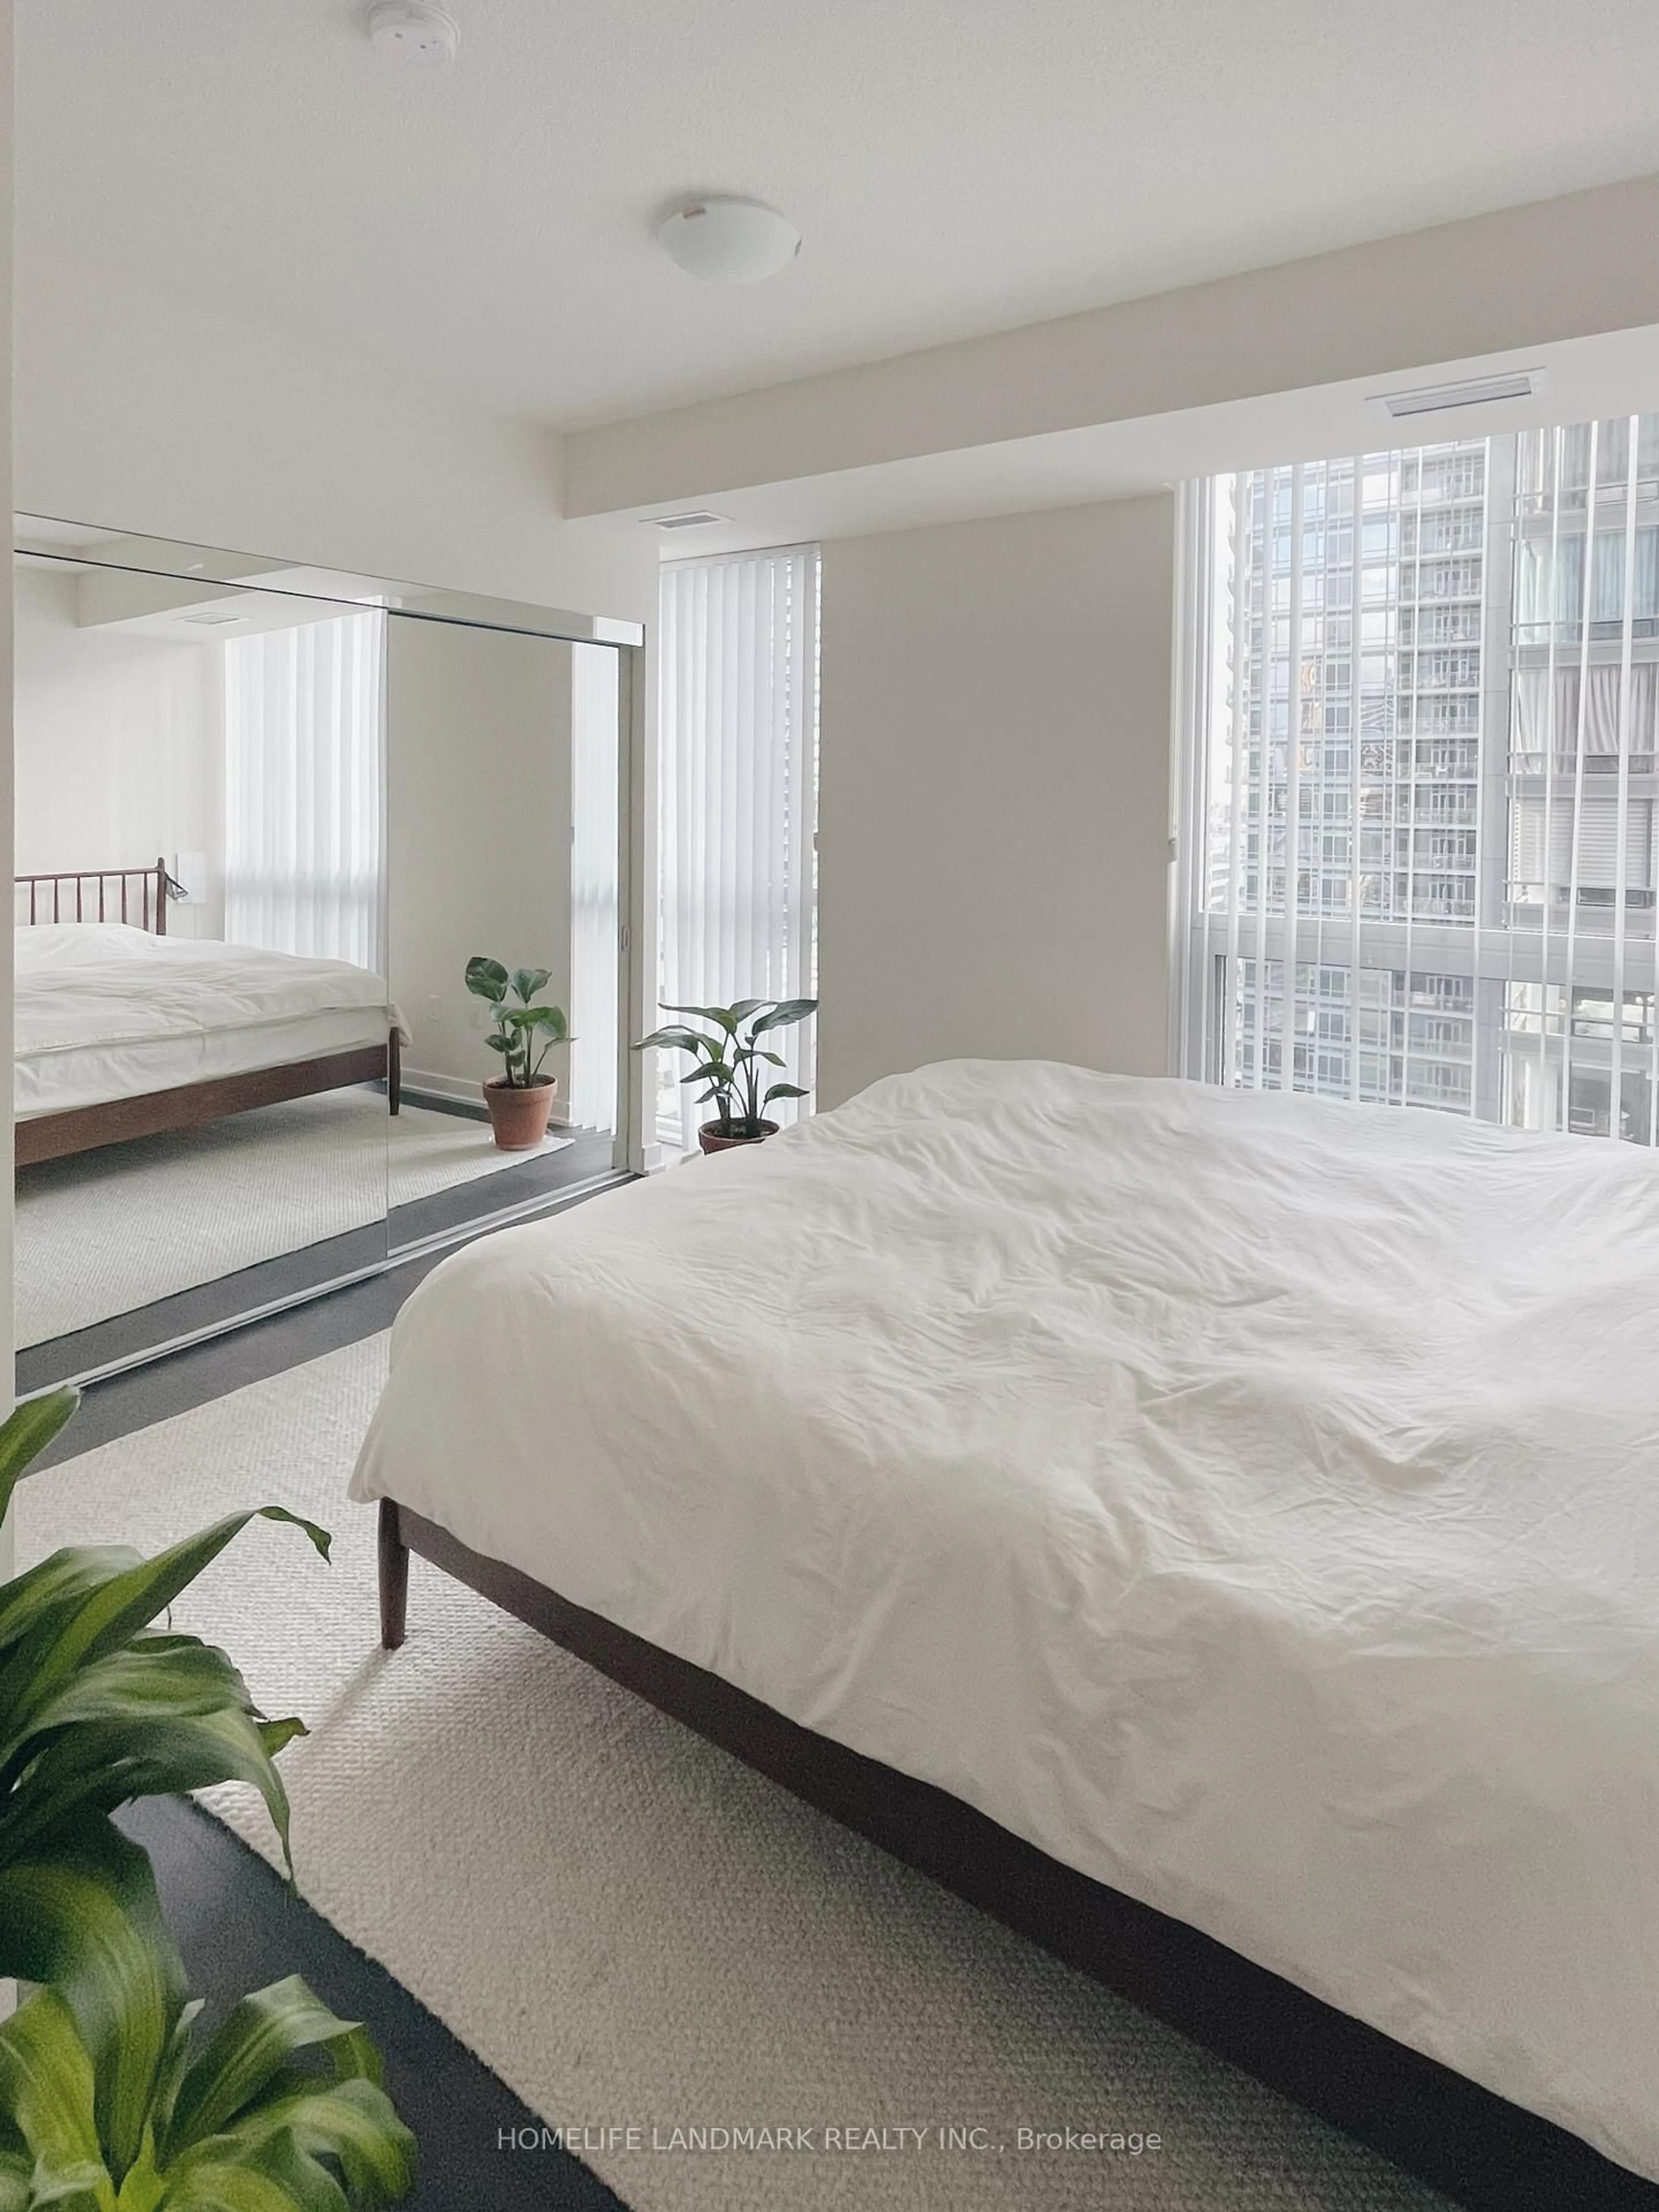
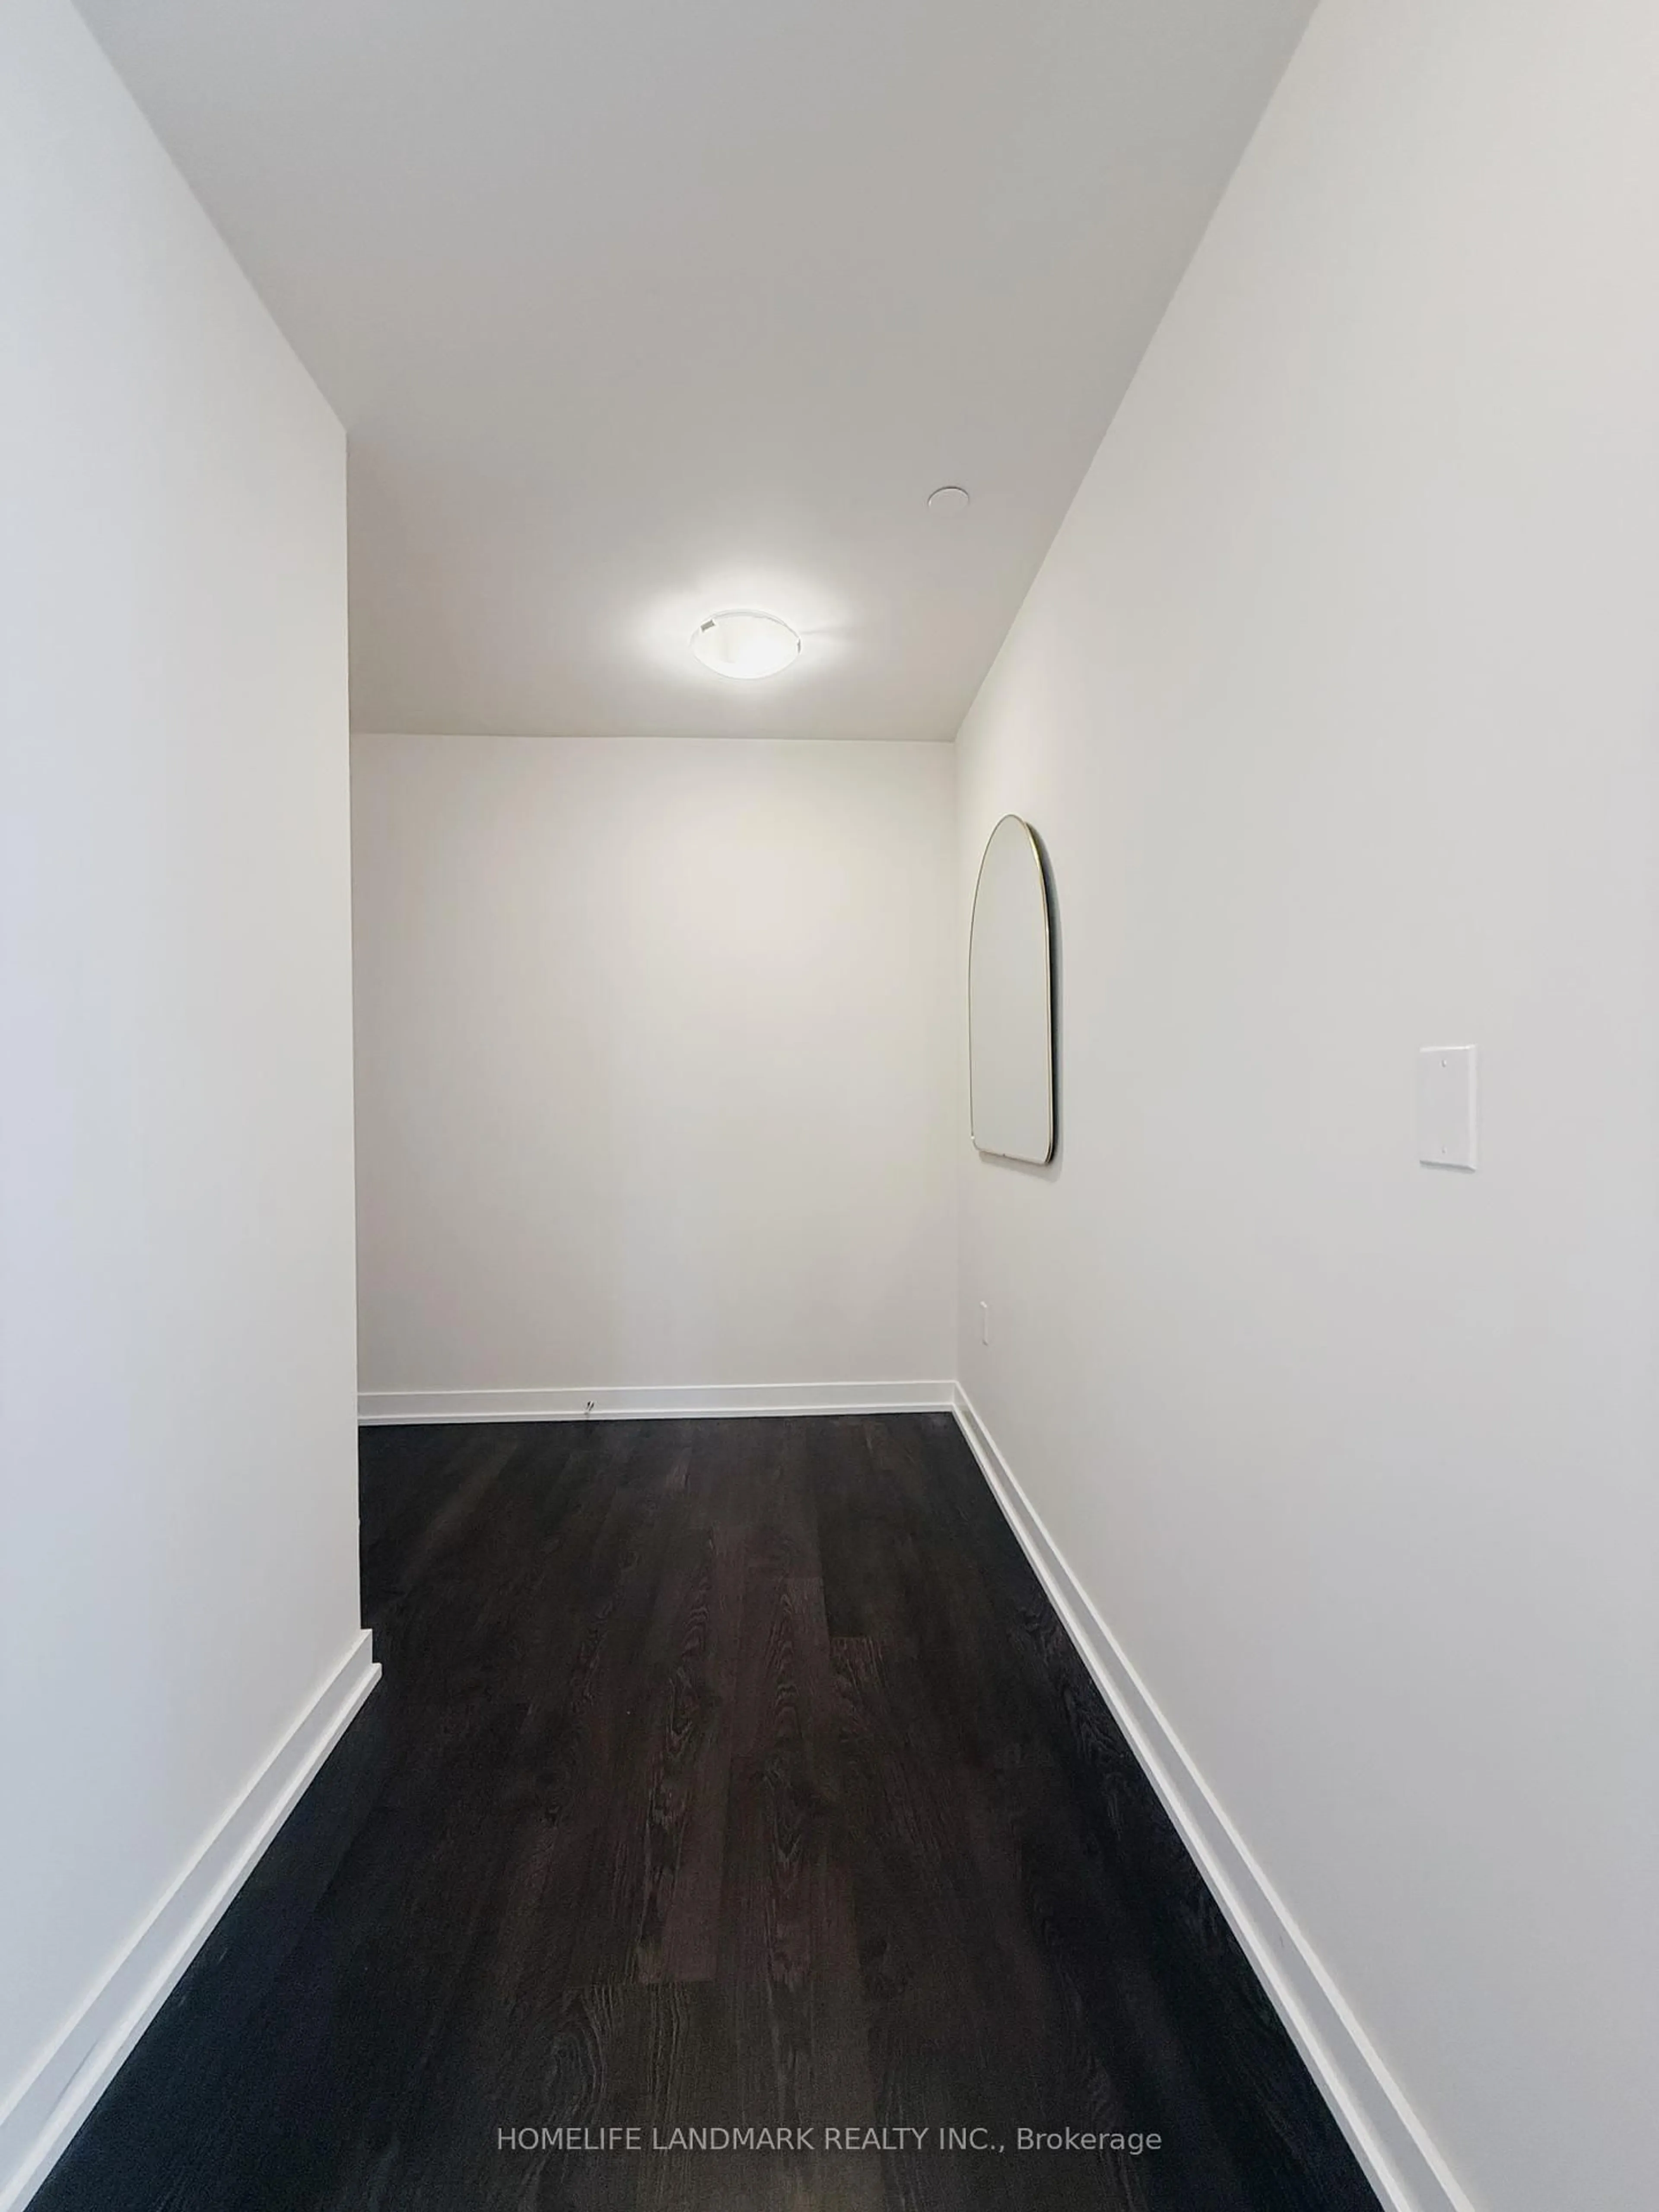
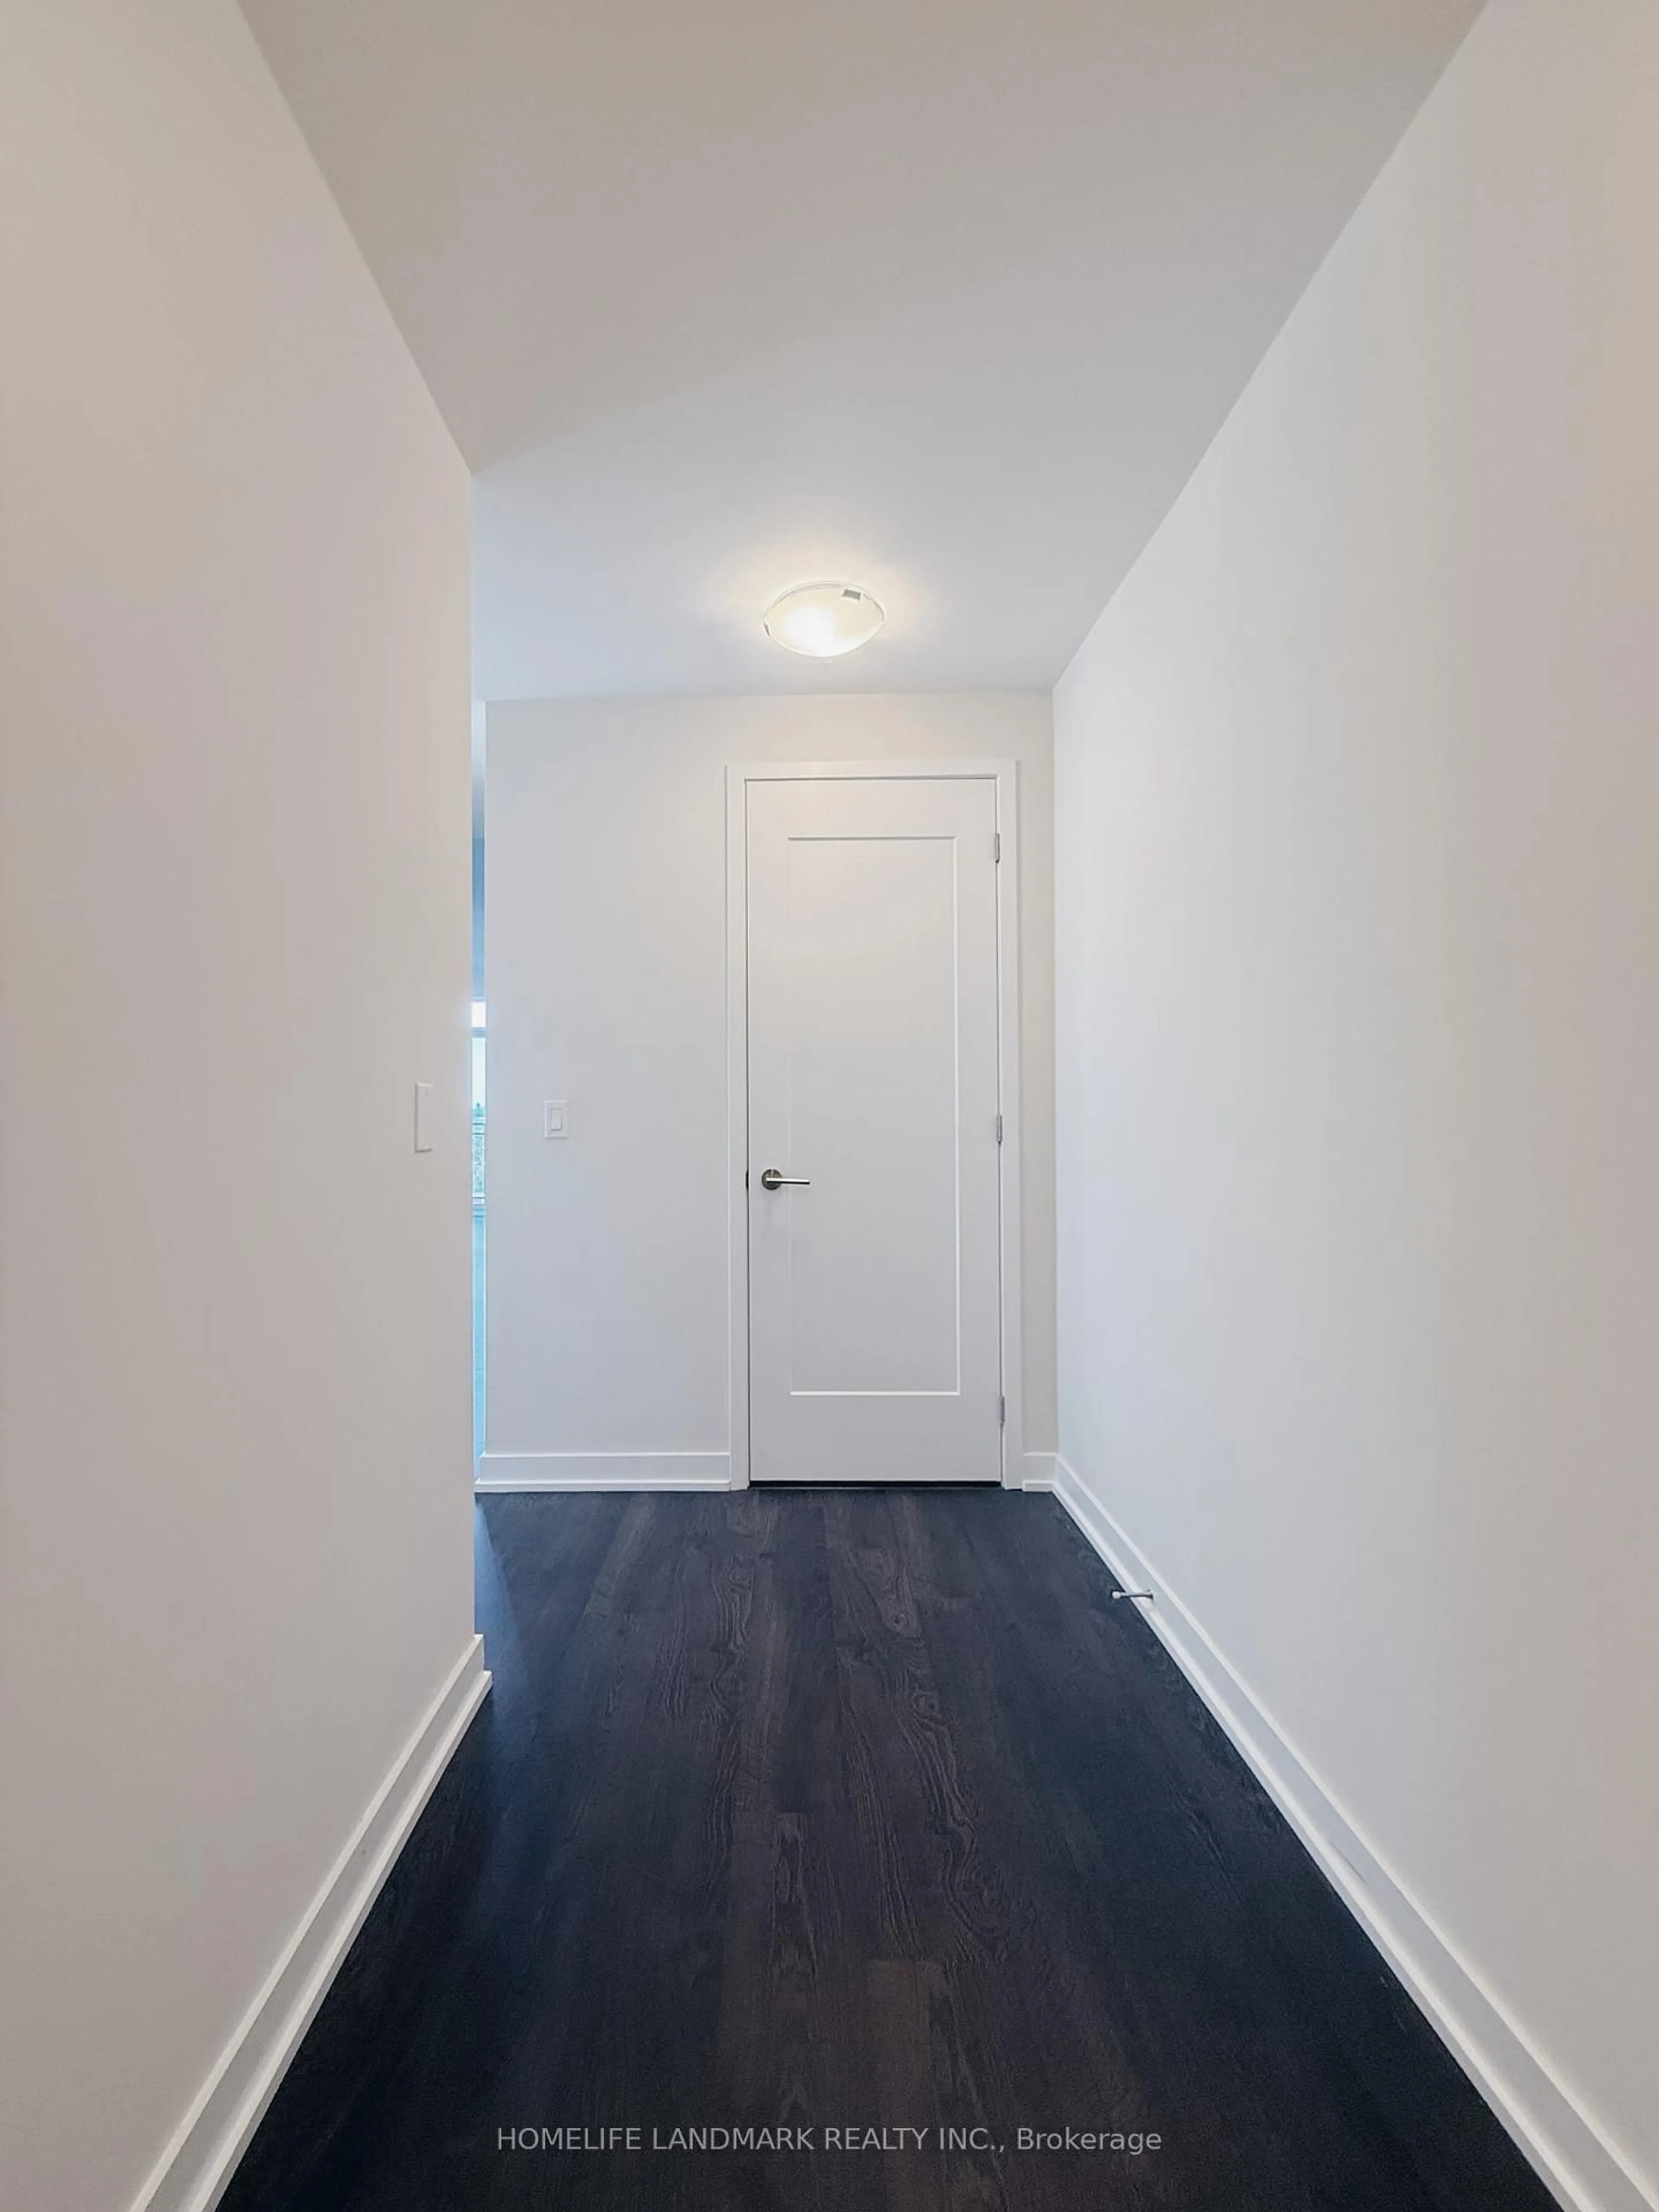
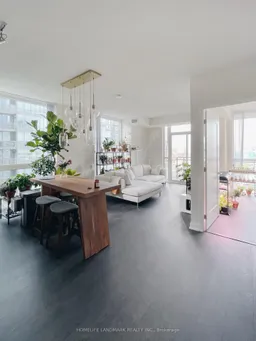
Bright Corner Unit With Floor To Ceiling Windows. Amazing Location, Steps To Street Car And Within Walking Distance To Queen West, Financial And Entertainment Districts, Restaurants, Bars, Cn Tower, 2 Subway Stations: St.Andrew And Osgoode Stations, Roger's Centre Etc. A+ Amenities: Pool, Bbq, Business Center, Outdoor Pool, Private Dining Room, Fitness Room.


Property Details

StyleApartment
View-
Age of property-
SqFt~800-899 SqFt
Lot Size-
Parking Spaces1
MLS ®NumberC12309954
Community NameEntertainment District
Data SourceTRREB
Listing byHOMELIFE LANDMARK REALTY INC.

Features

Heating: Heat Pump
Cooling: Central Air

Features

Patio: Open
Balcony: Open

Parking

Garage spaces 1

Garage type Underground

Other parking spaces 0

Total parking spaces 1


19Story
Inclusions
Hydro
Water
Parking
Cable
Heat

Property History

Date unavailable
ListedActive
$975,000
< 1h on market
history photo preview19
Listing by trreb®

Market Data - Entertainment District

Geo Zone Map ThumbnailEntertainment District

Strong Buyer's Market

View Market Data

Condo - for the past 30 days

Buyer's market Seller's market

Avg. Days on Market

Past 30 days

31 days

Compared to

2024

29 days

2023

19 days

2022

20 days

New Listings

Past 30 days

269 listings

Compared to

2024

292 listings

2023

241 listings

2022

258 listings

Units sold

Past 30 days

50 units

Compared to

2024

71 units

2023

76 units

2022

78 units

Median Sold Price

Past 30 days

$609,750

Compared to

2024

$700,000

2023

$750,000

2022

$700,000


Population and Demographics

Overview

Total population 32132
Average household income $172,021

Age (%)

0 to 19
7%
20 to 34
57%
35 to 49
22%
50 to 64
9%
65 and plus
5%

Household composition (%)

Single person
57%
Single family
32%
Multi person
11%
Multi family
0%

Mother tongue (%)

English
63%
Mandarin
10%
Yue (Cantonese)
4%
Spanish
3%
French
3%
Russian
2%
Arabic
2%
Hindi
2%
Korean
1%
Iranian Persian
1%
Others
1%

House tenancy (%)

Renters
61%
Owners
39%

What’s nearby?Essentials within 5 km

Local Logic

Transportation Scores

Estimated Budget