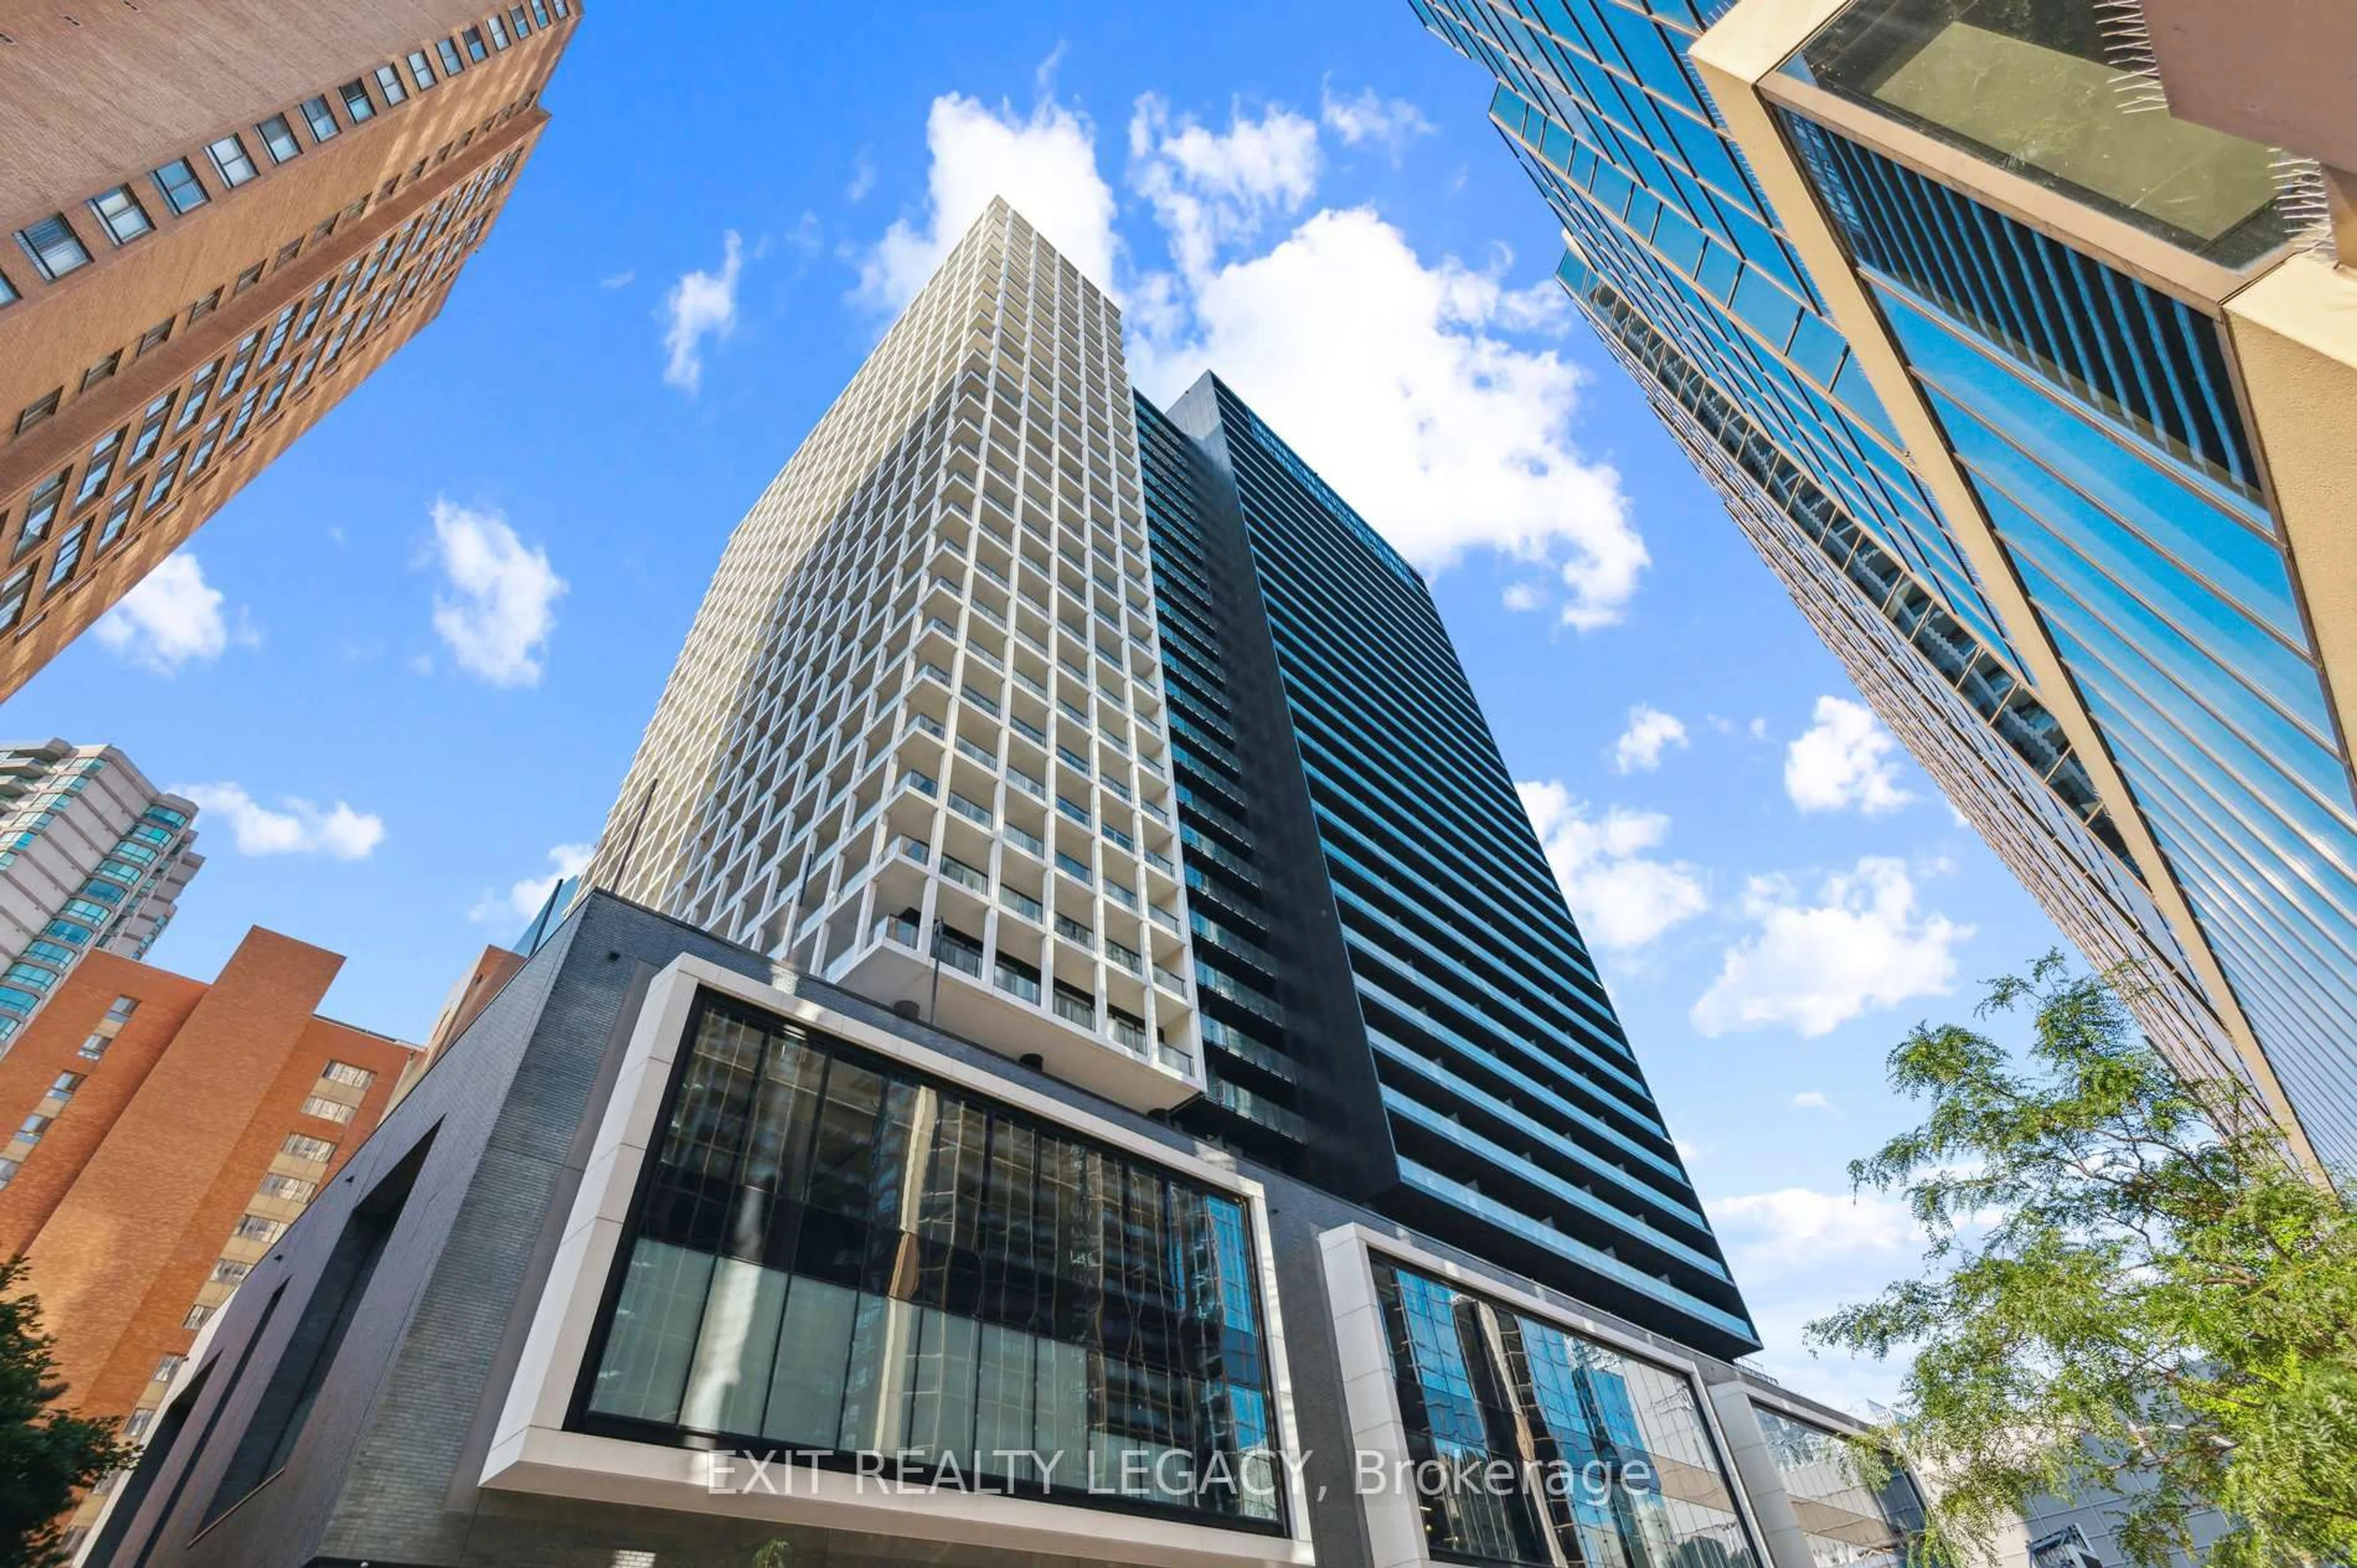
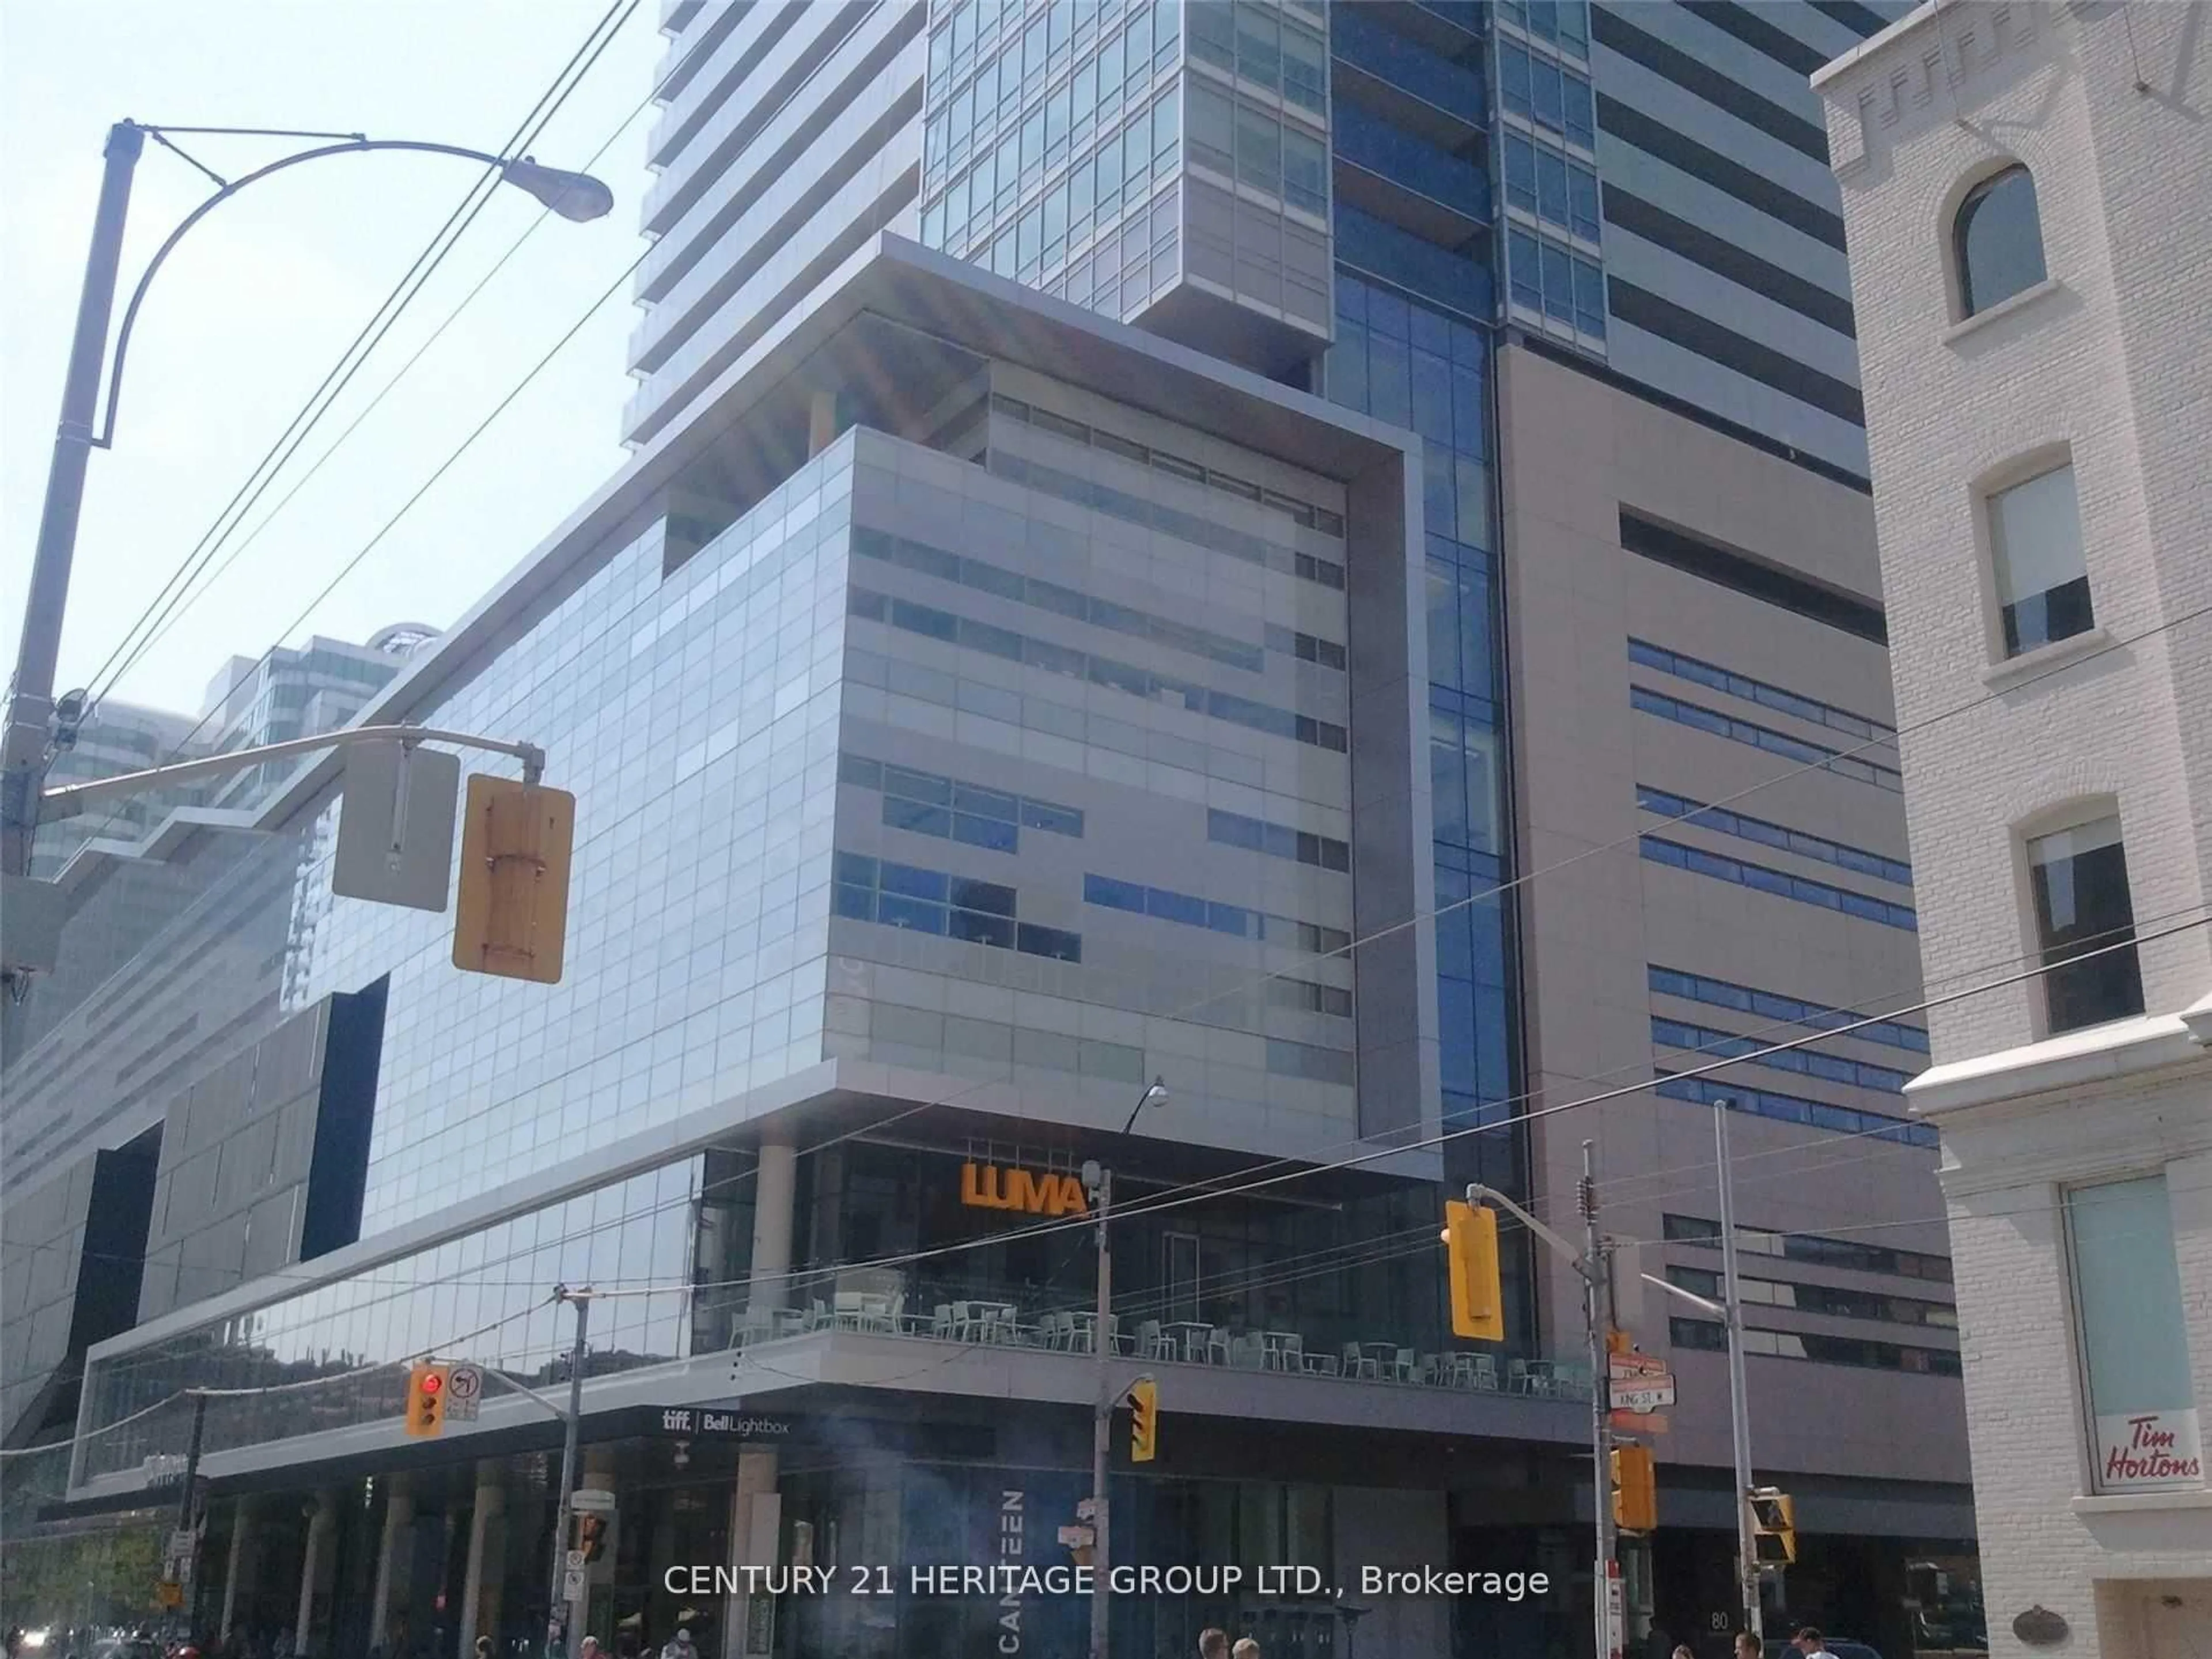
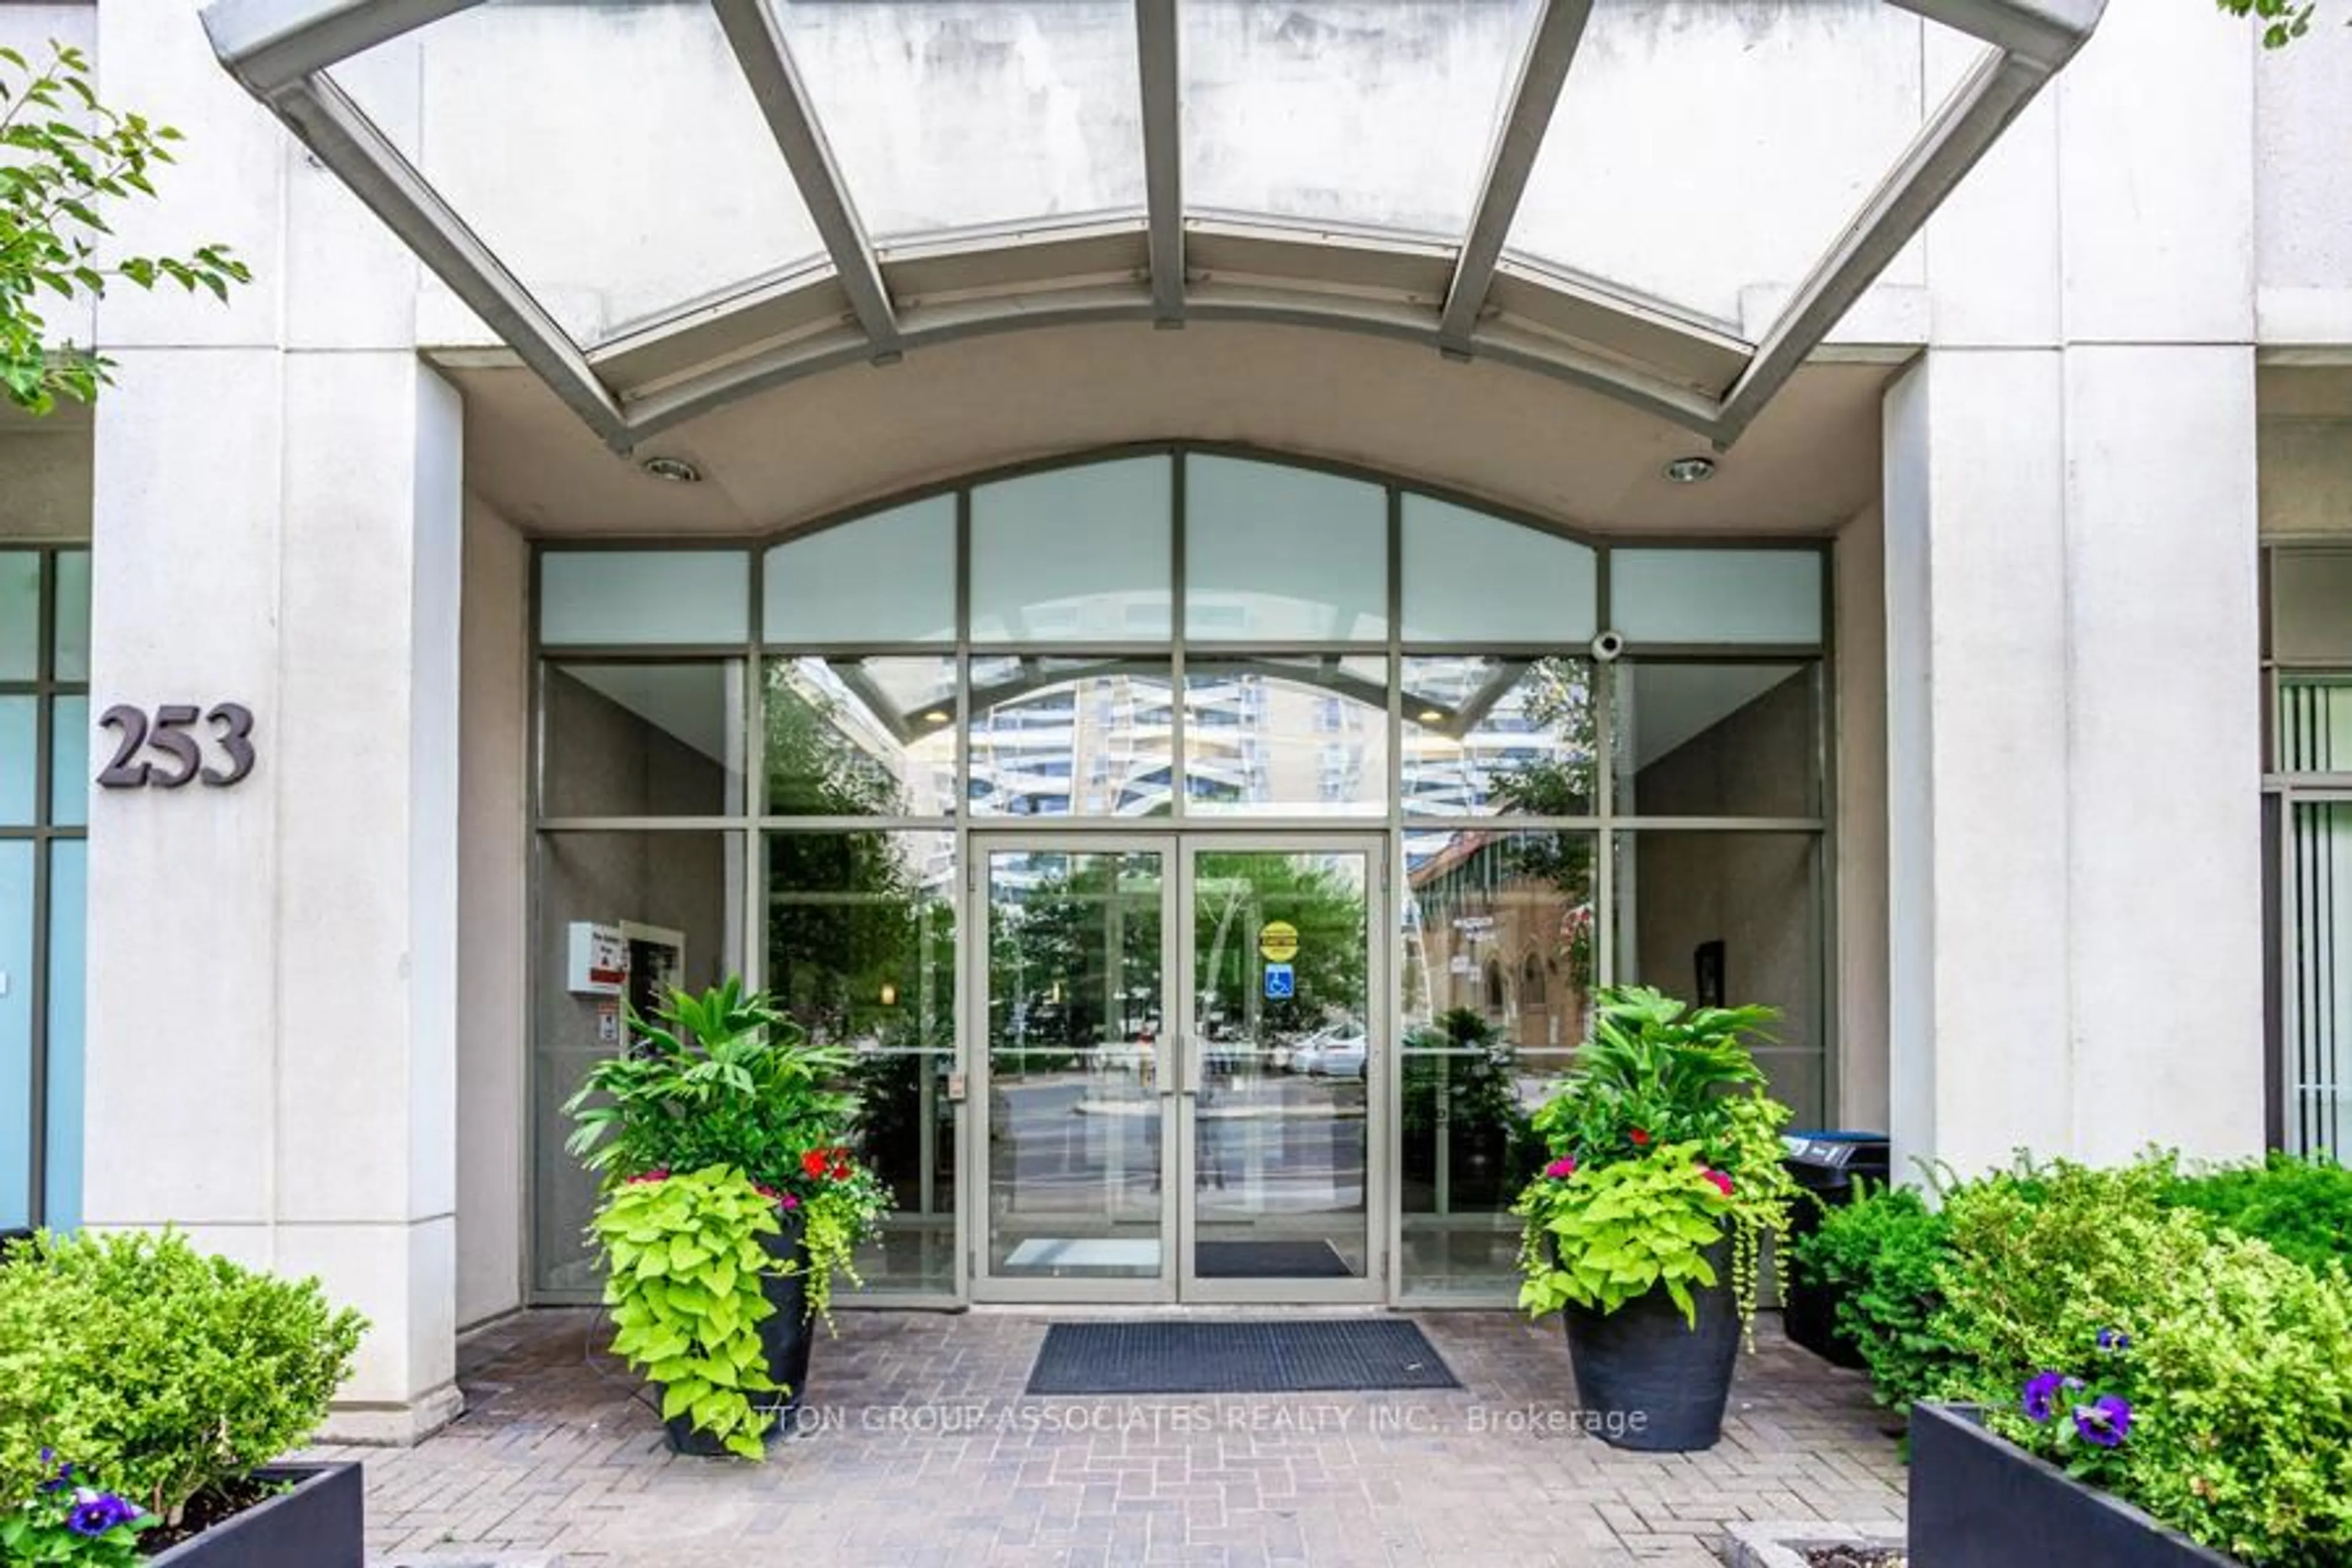
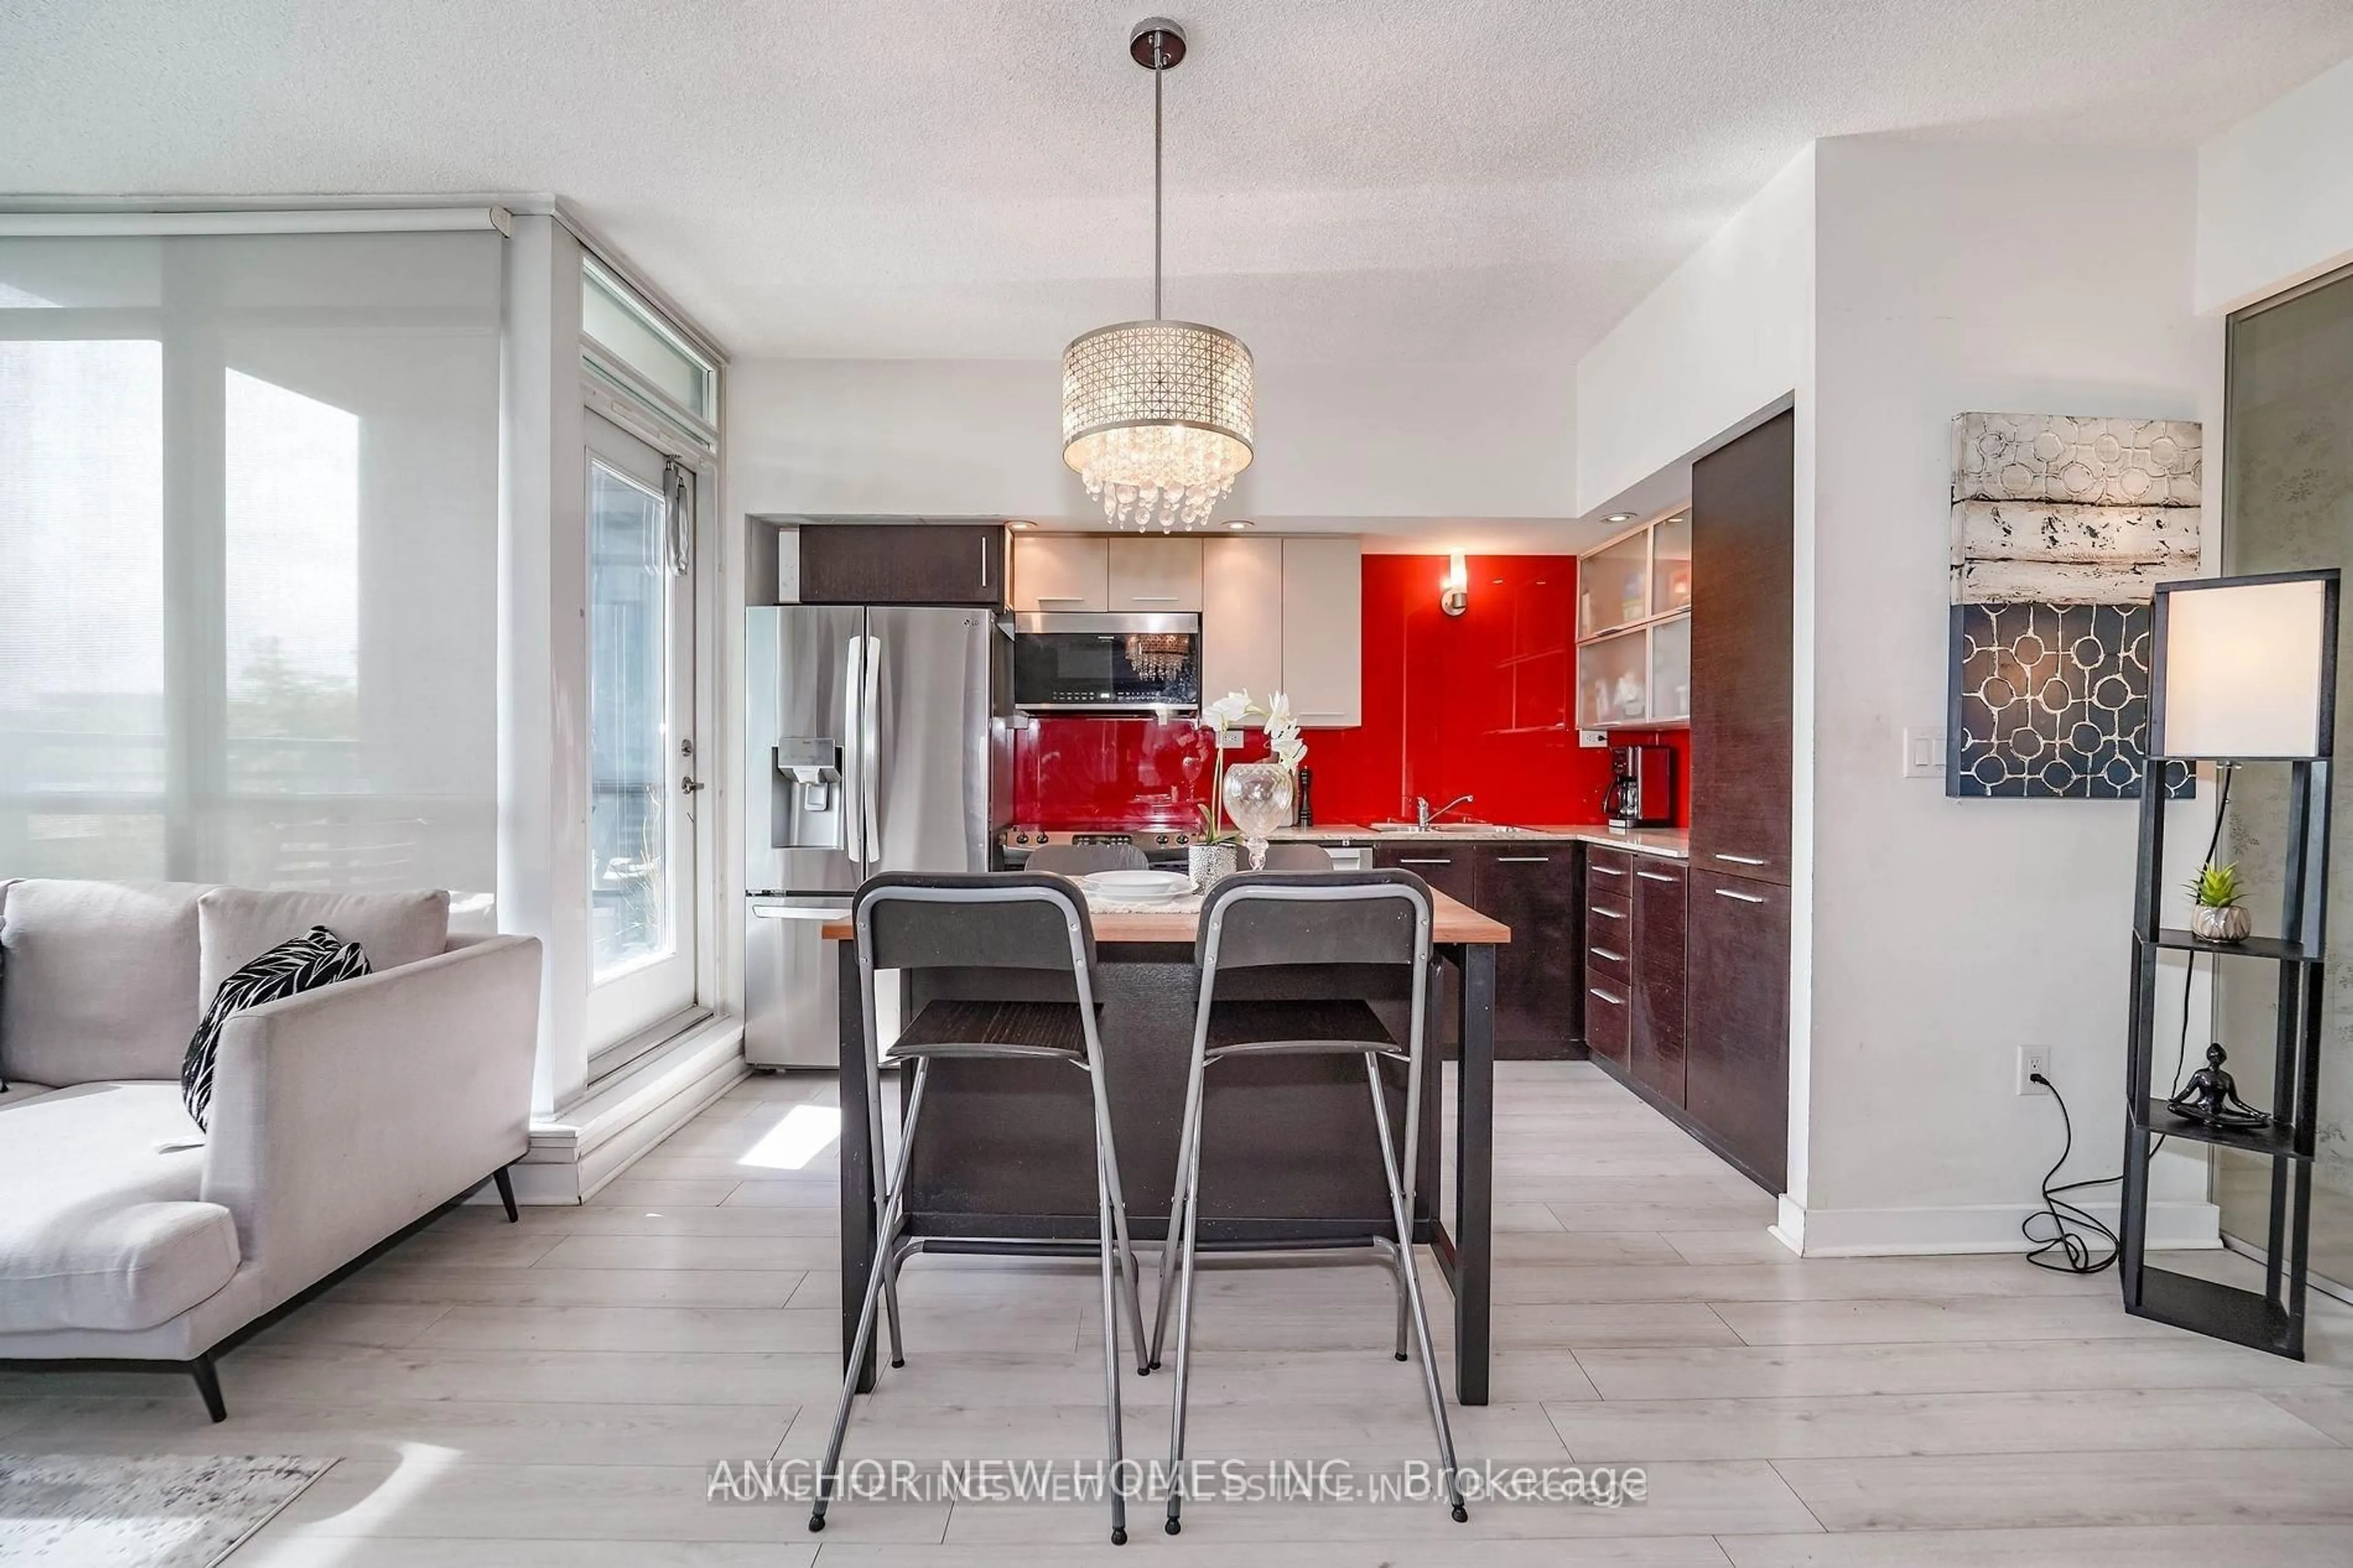
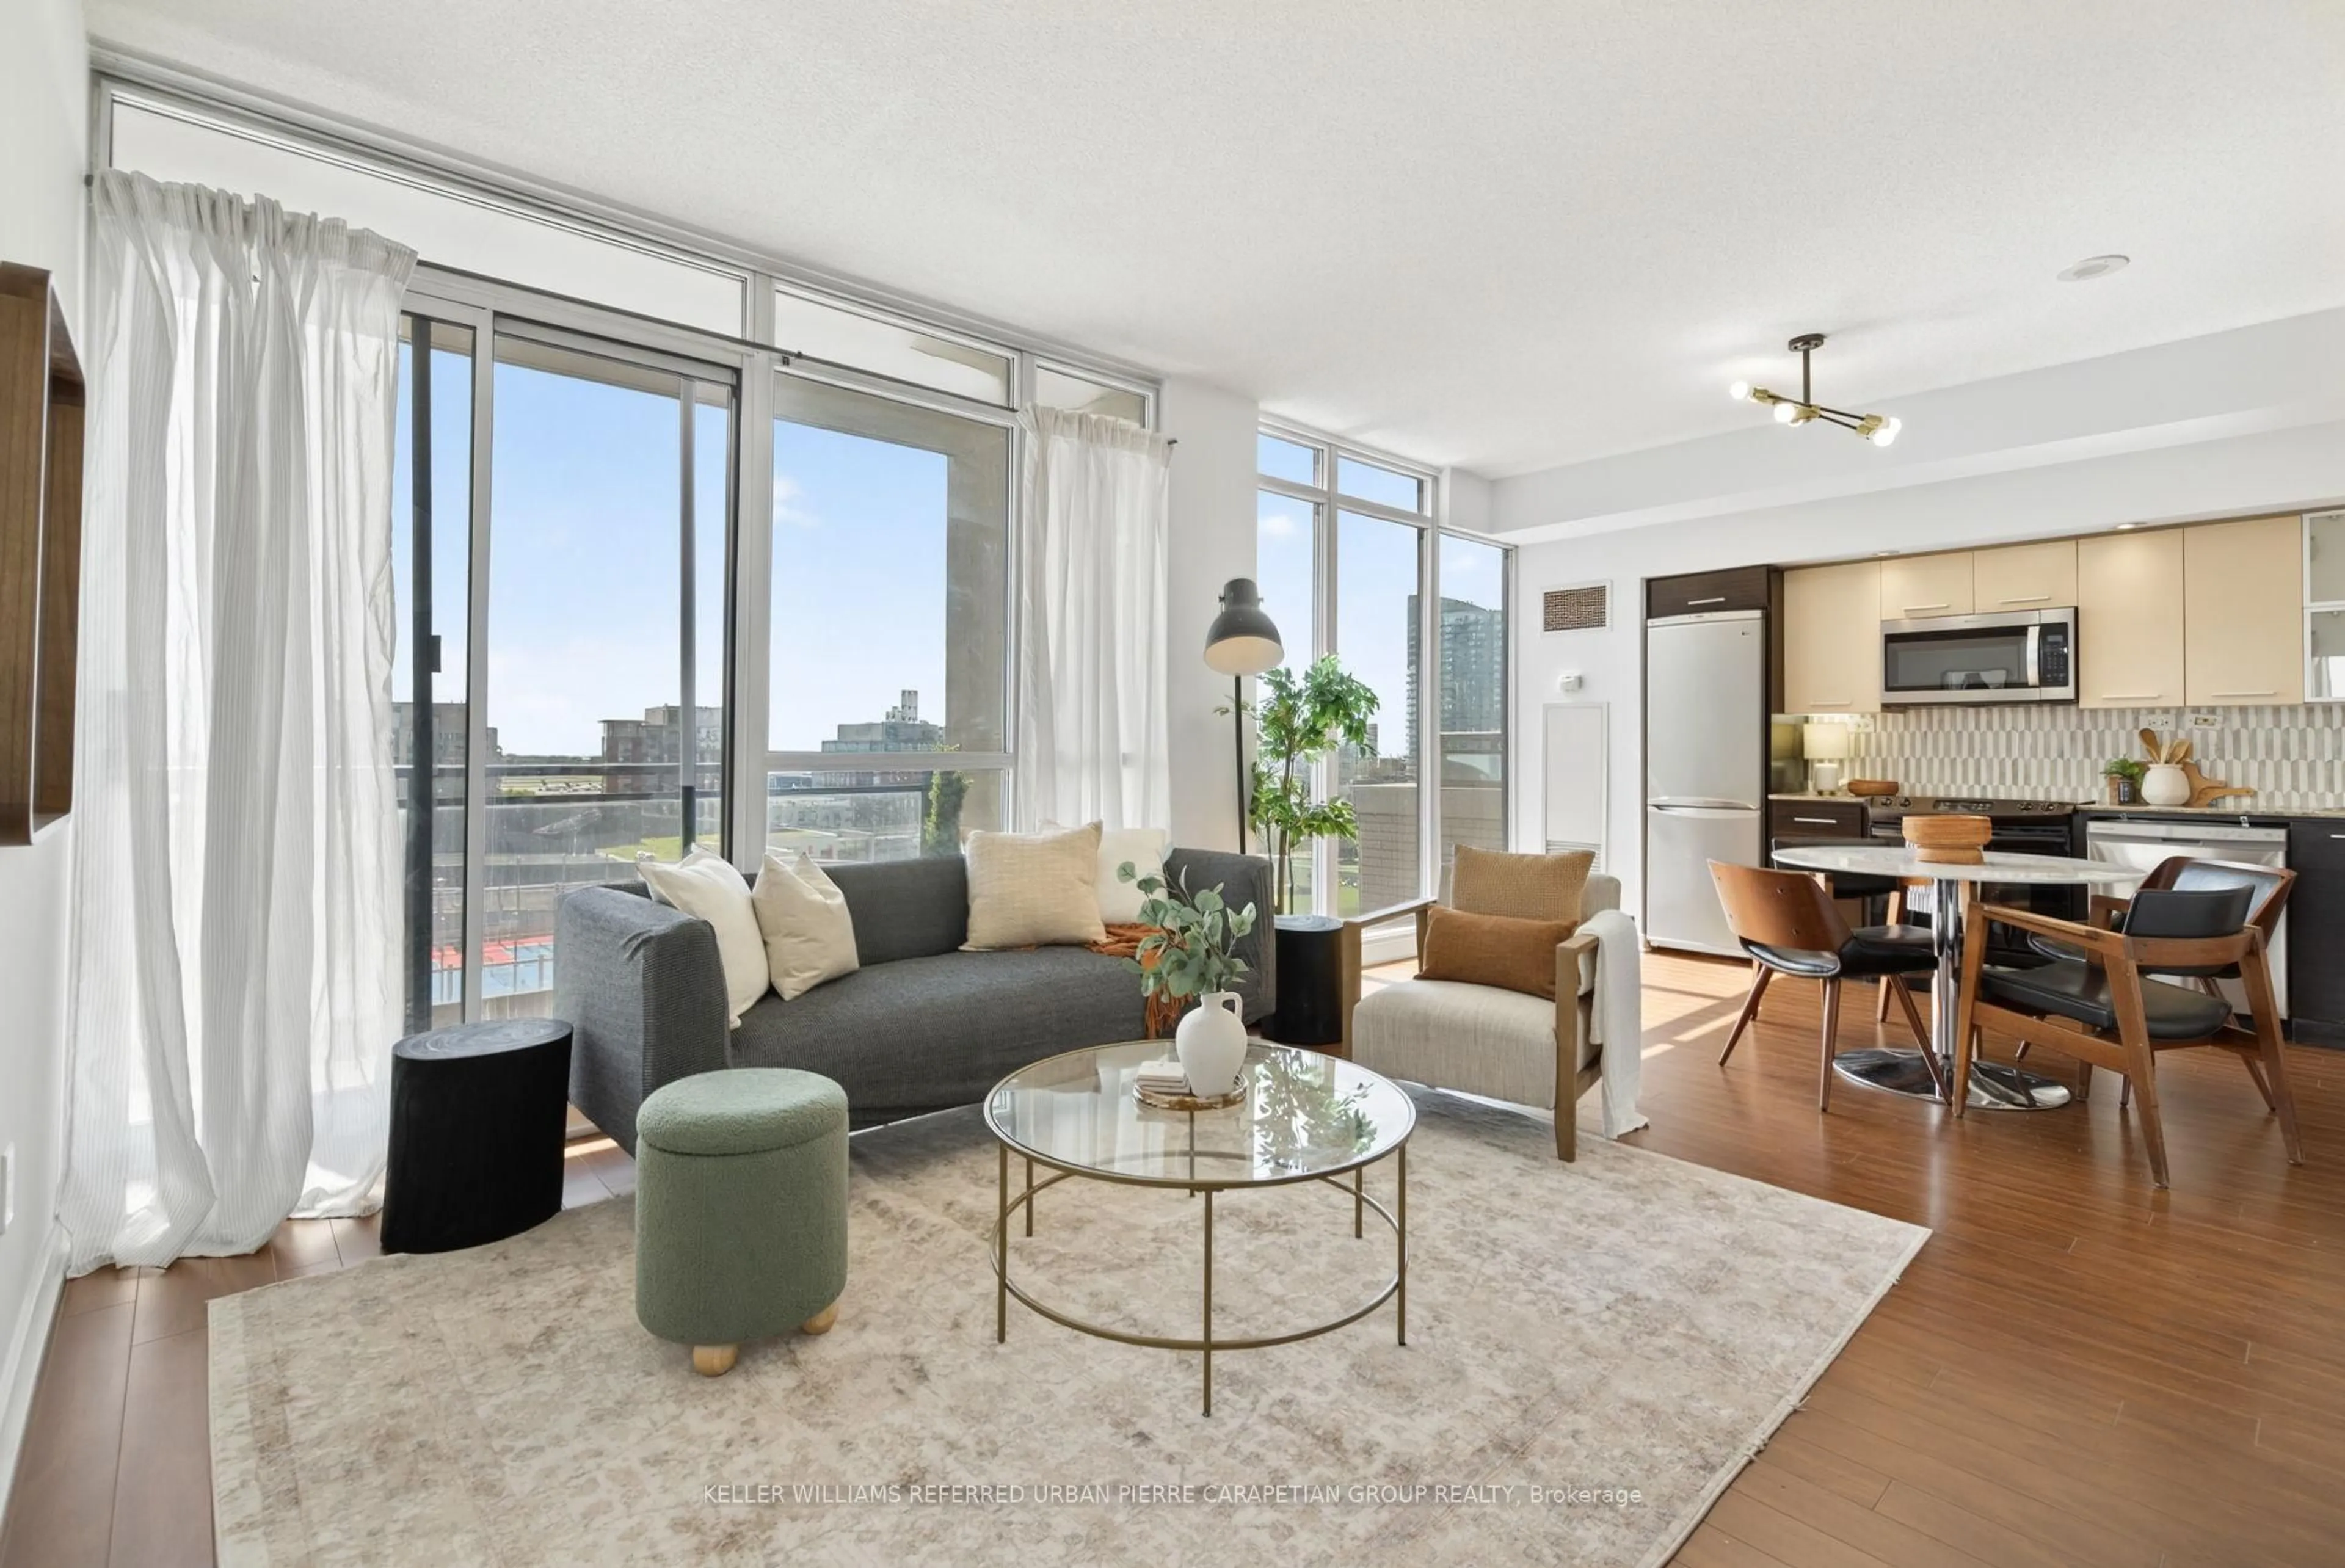
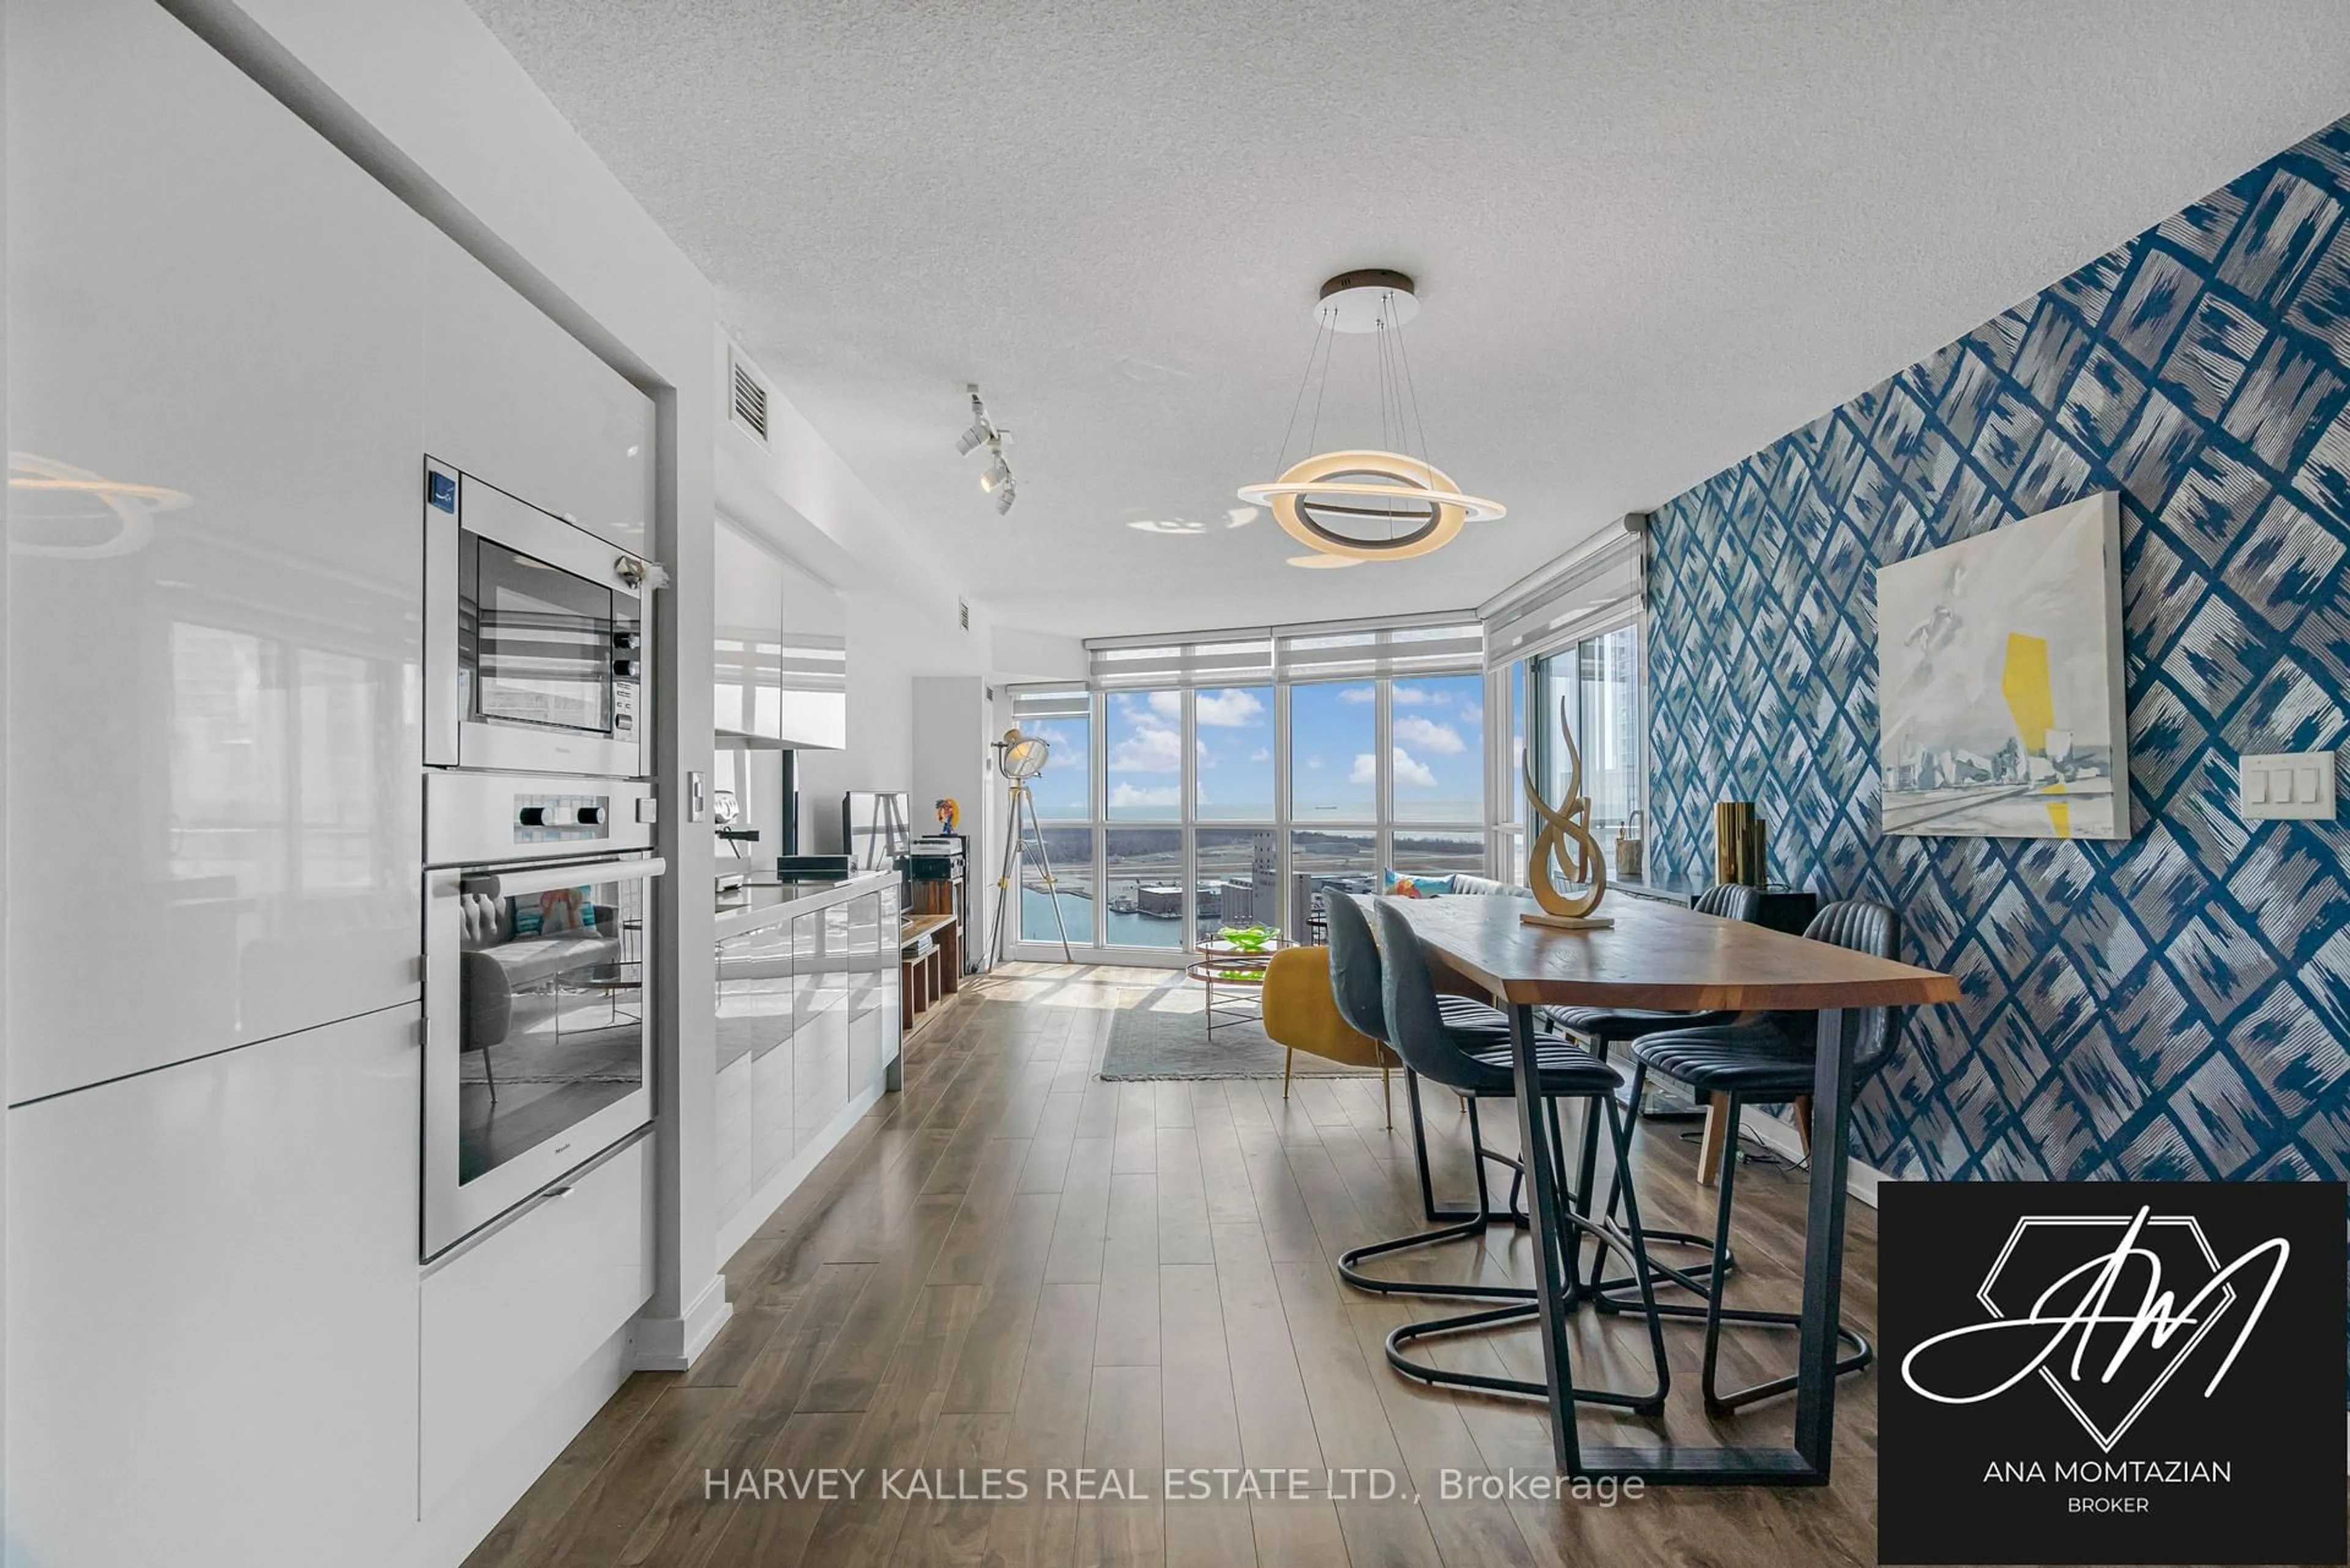
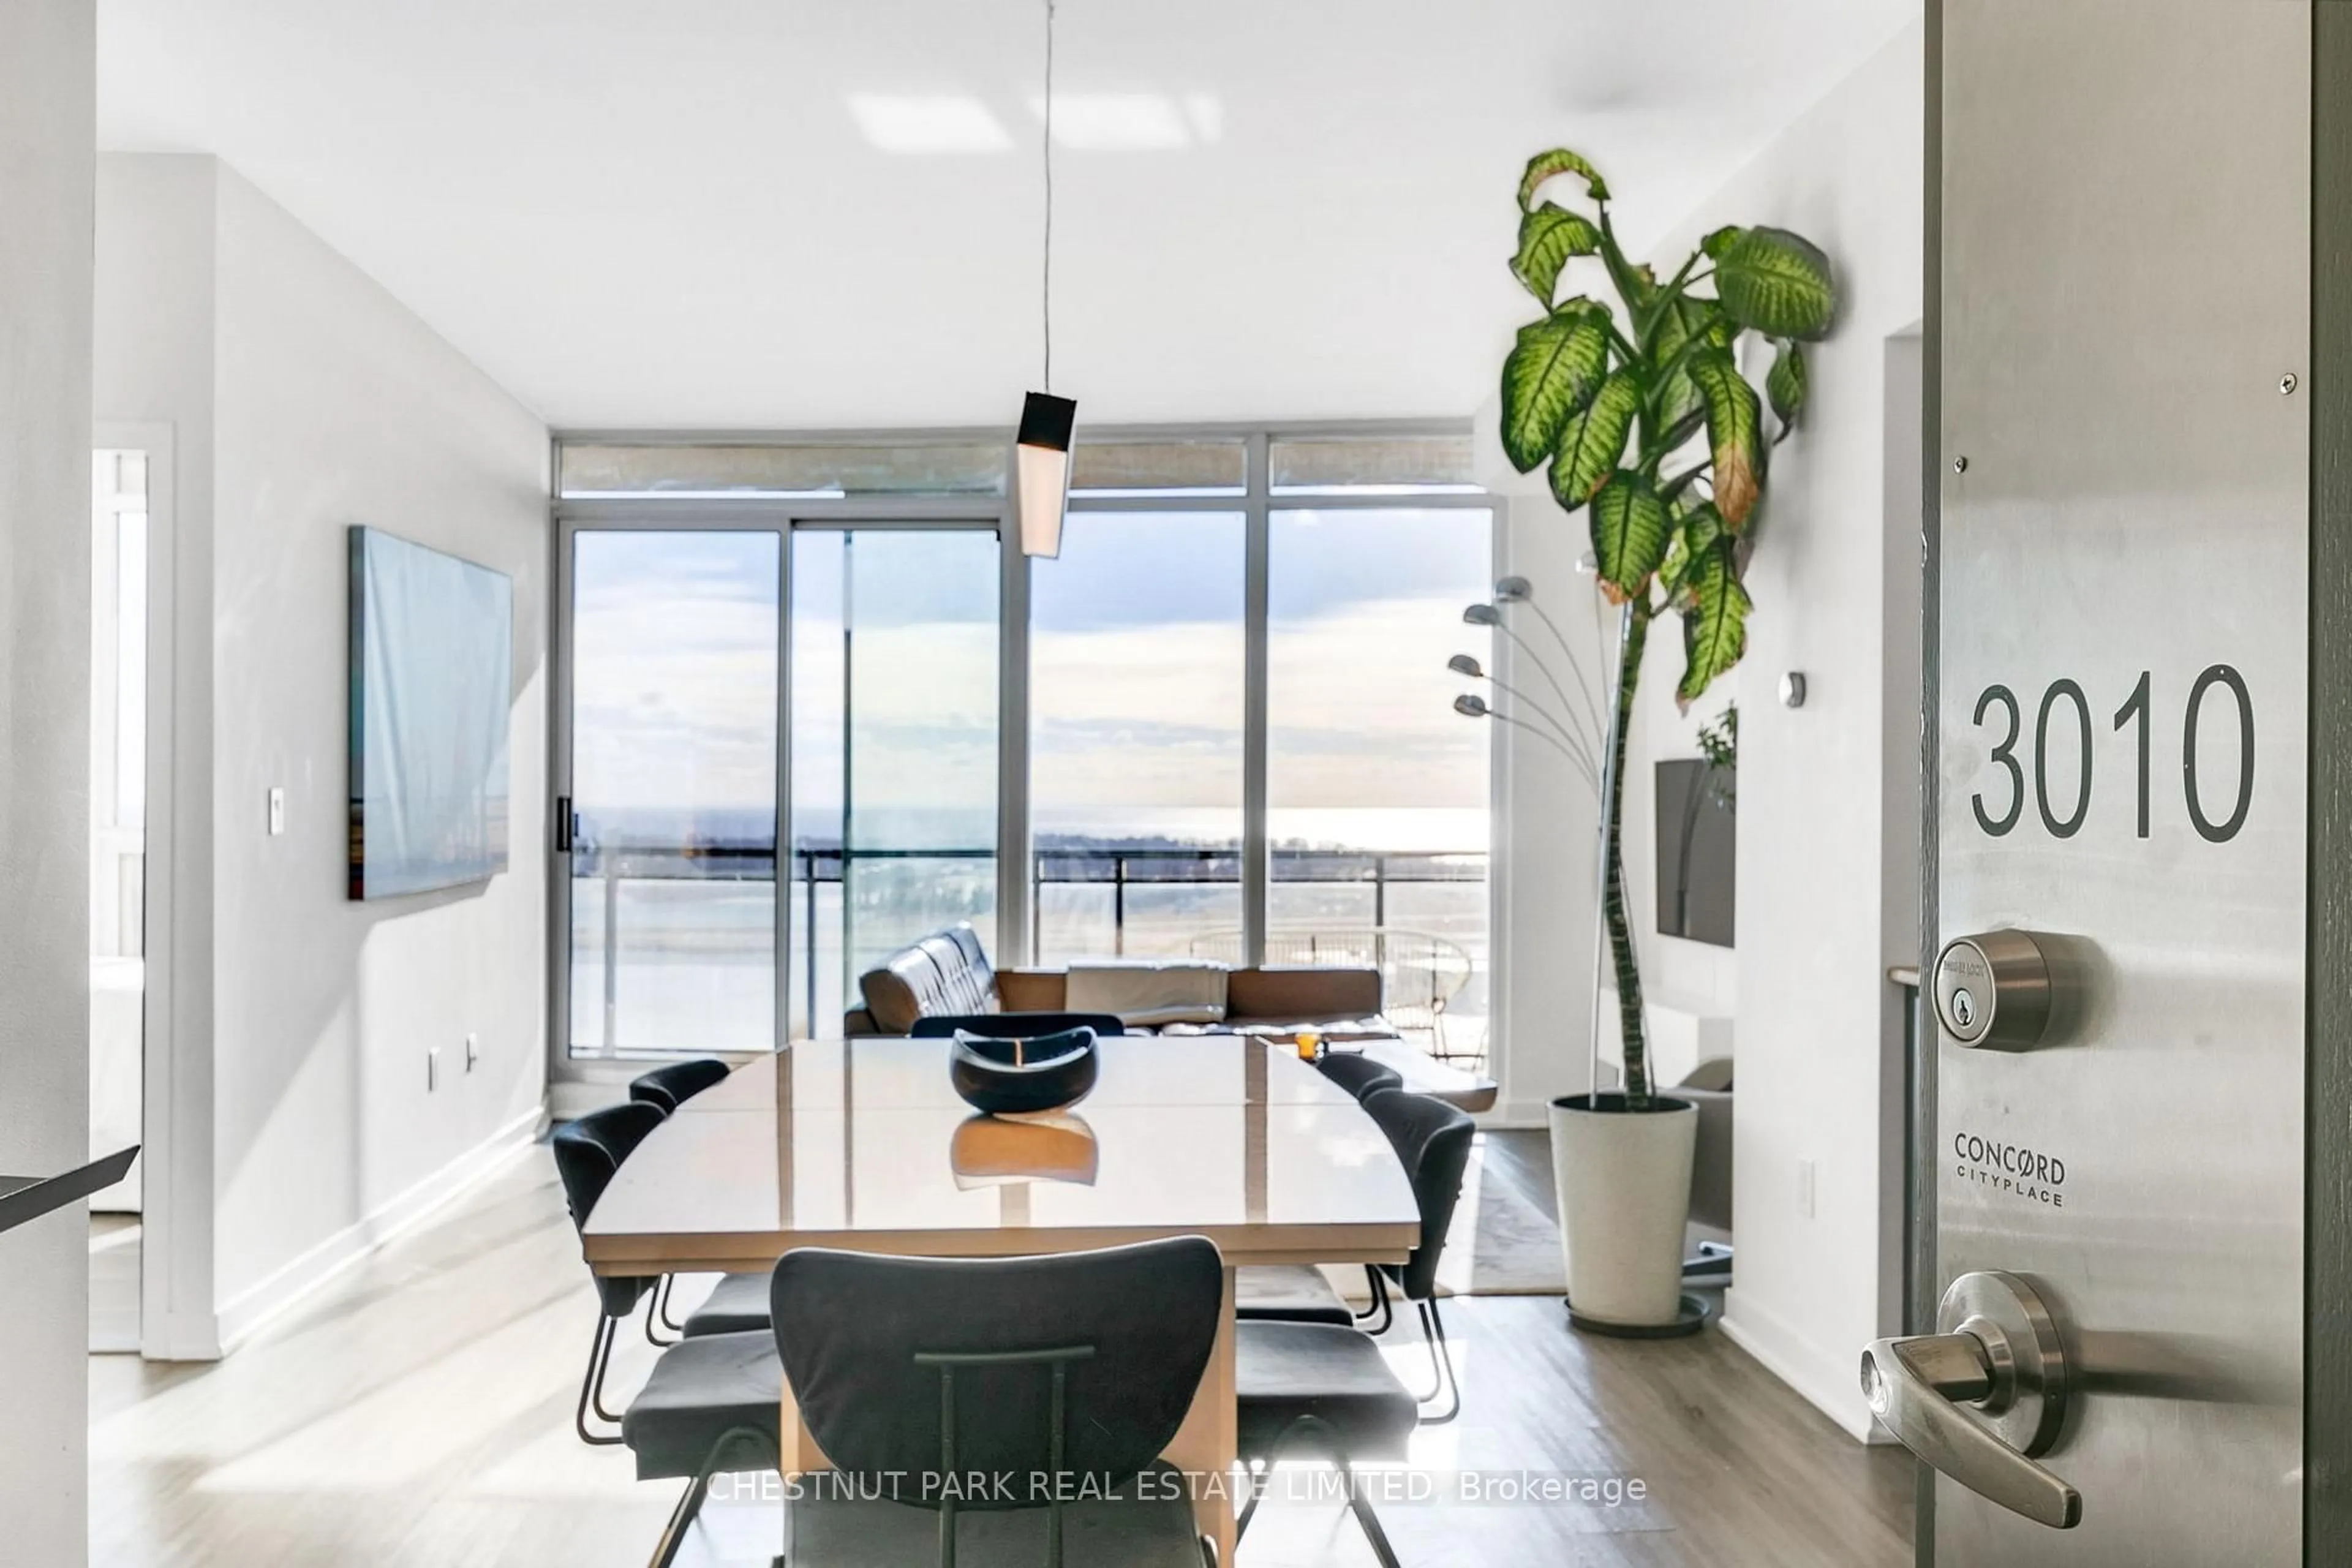
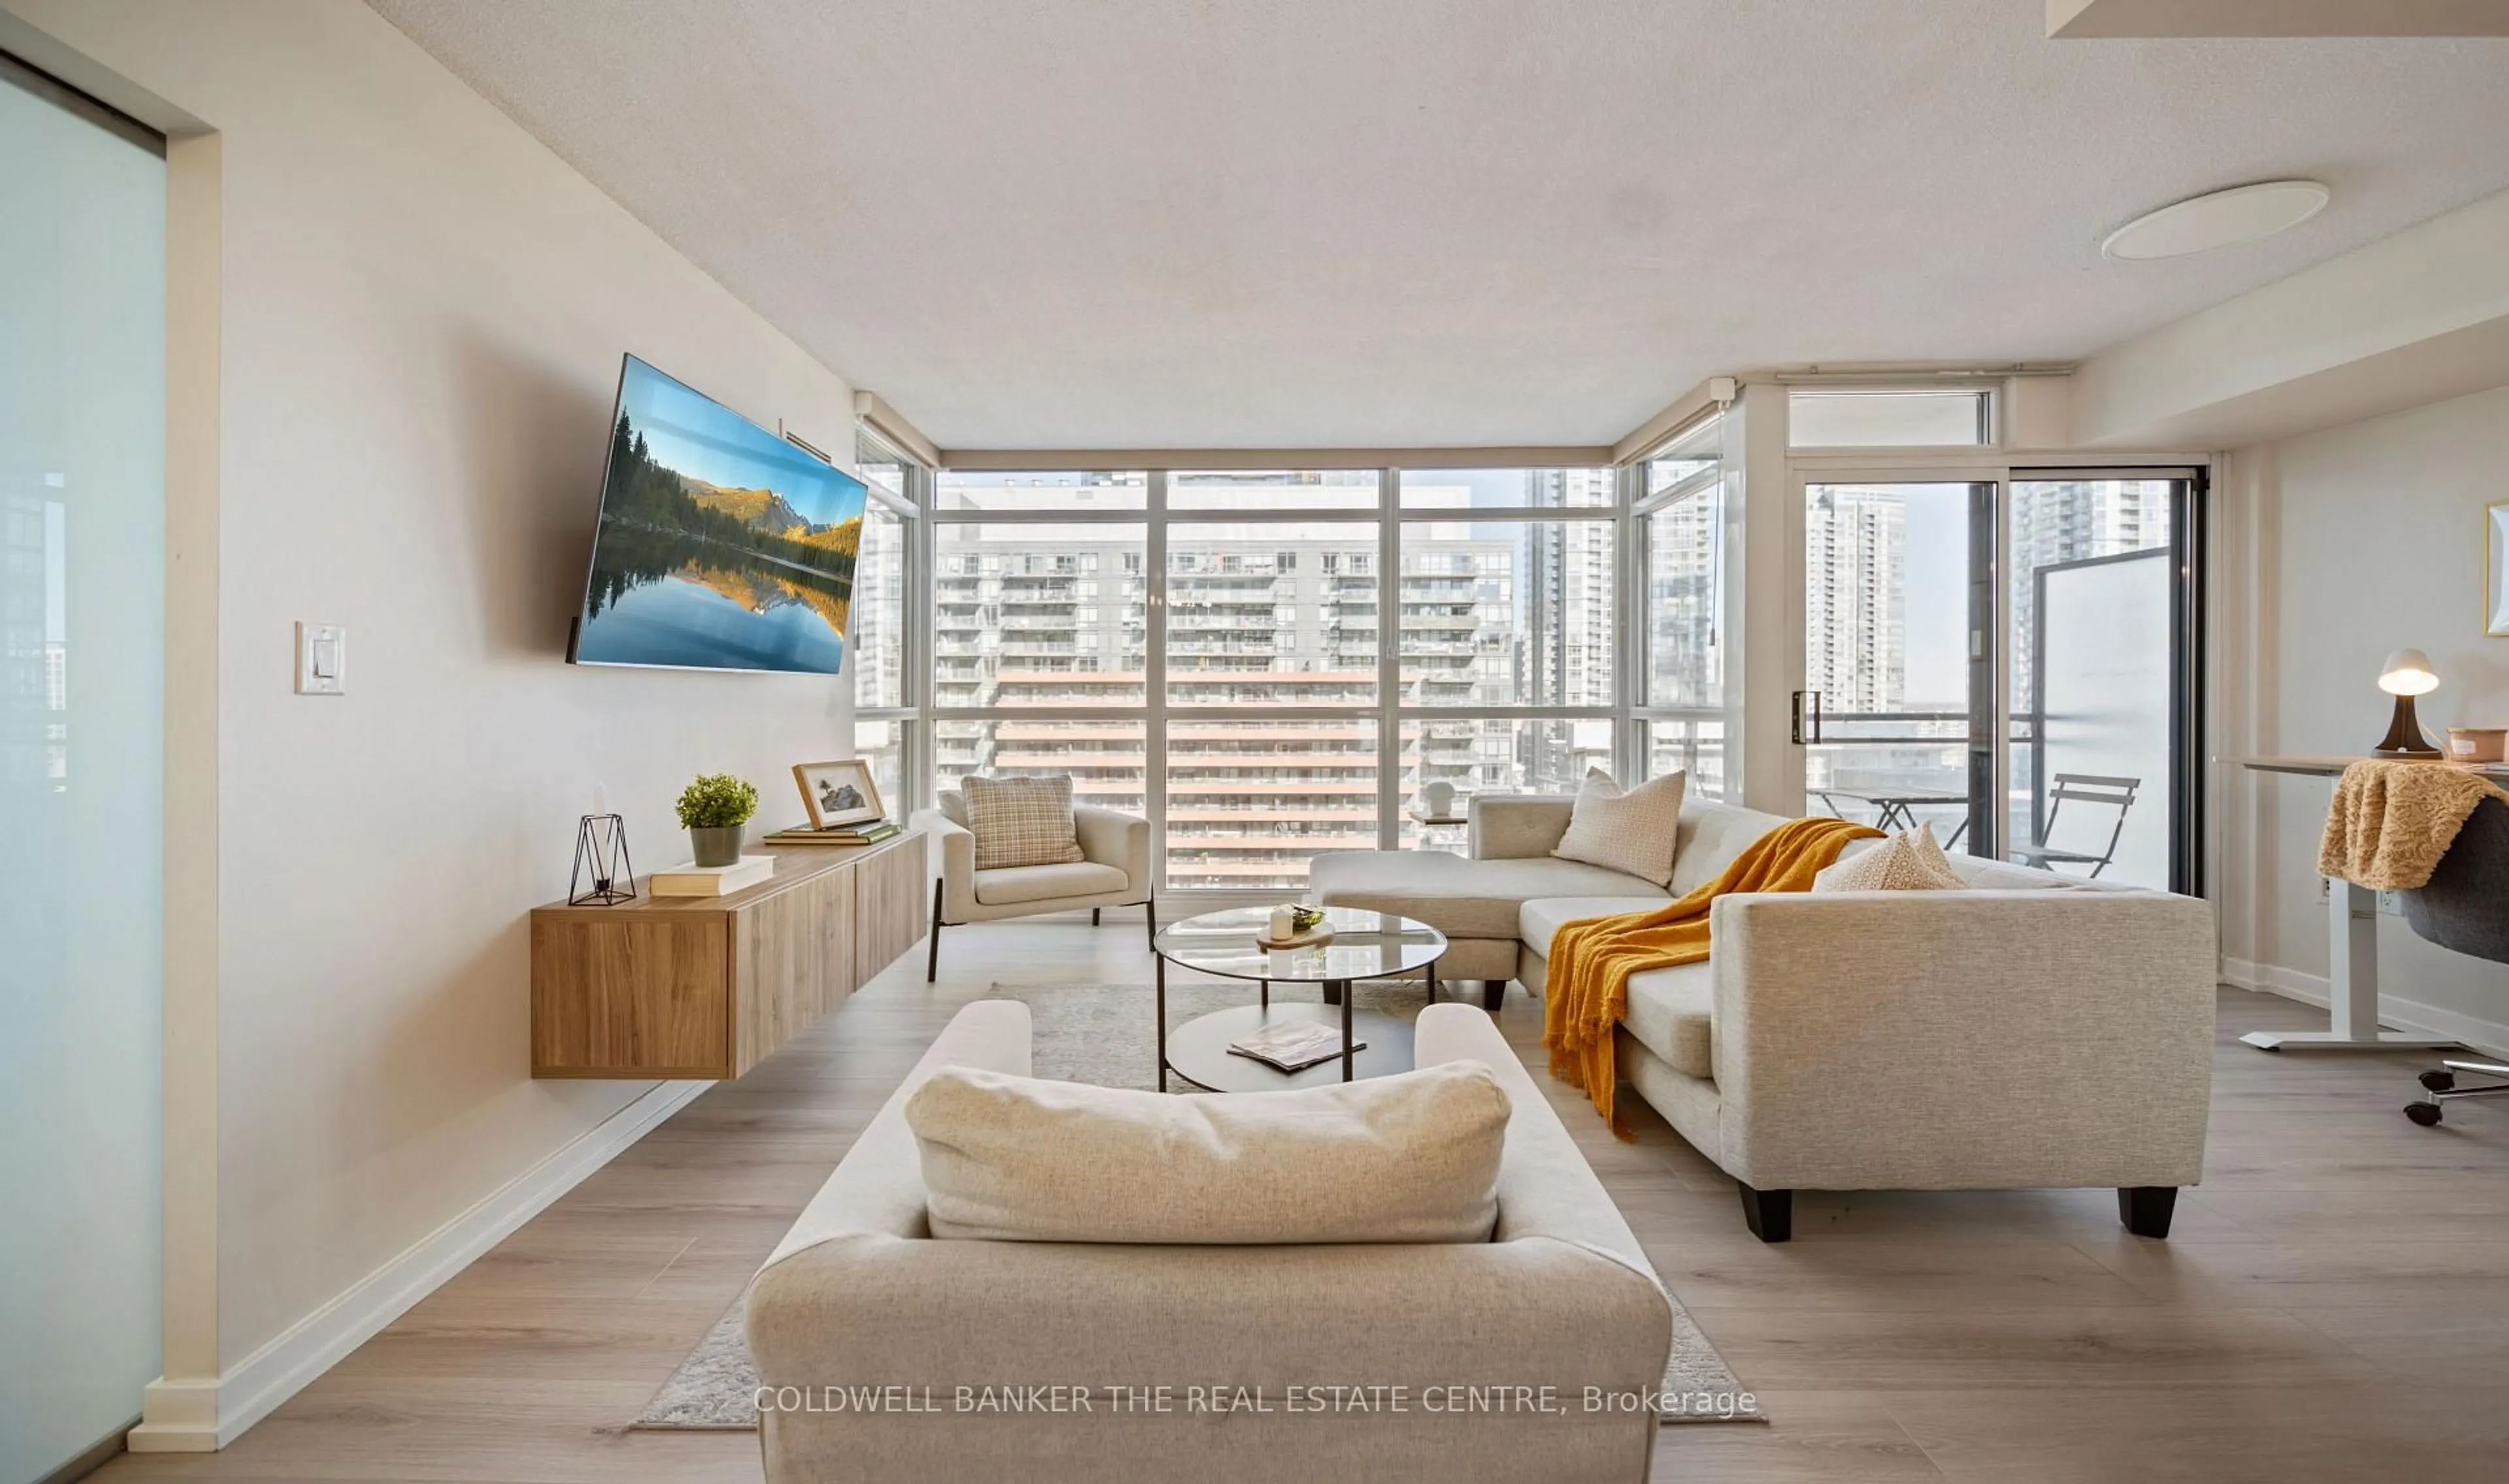
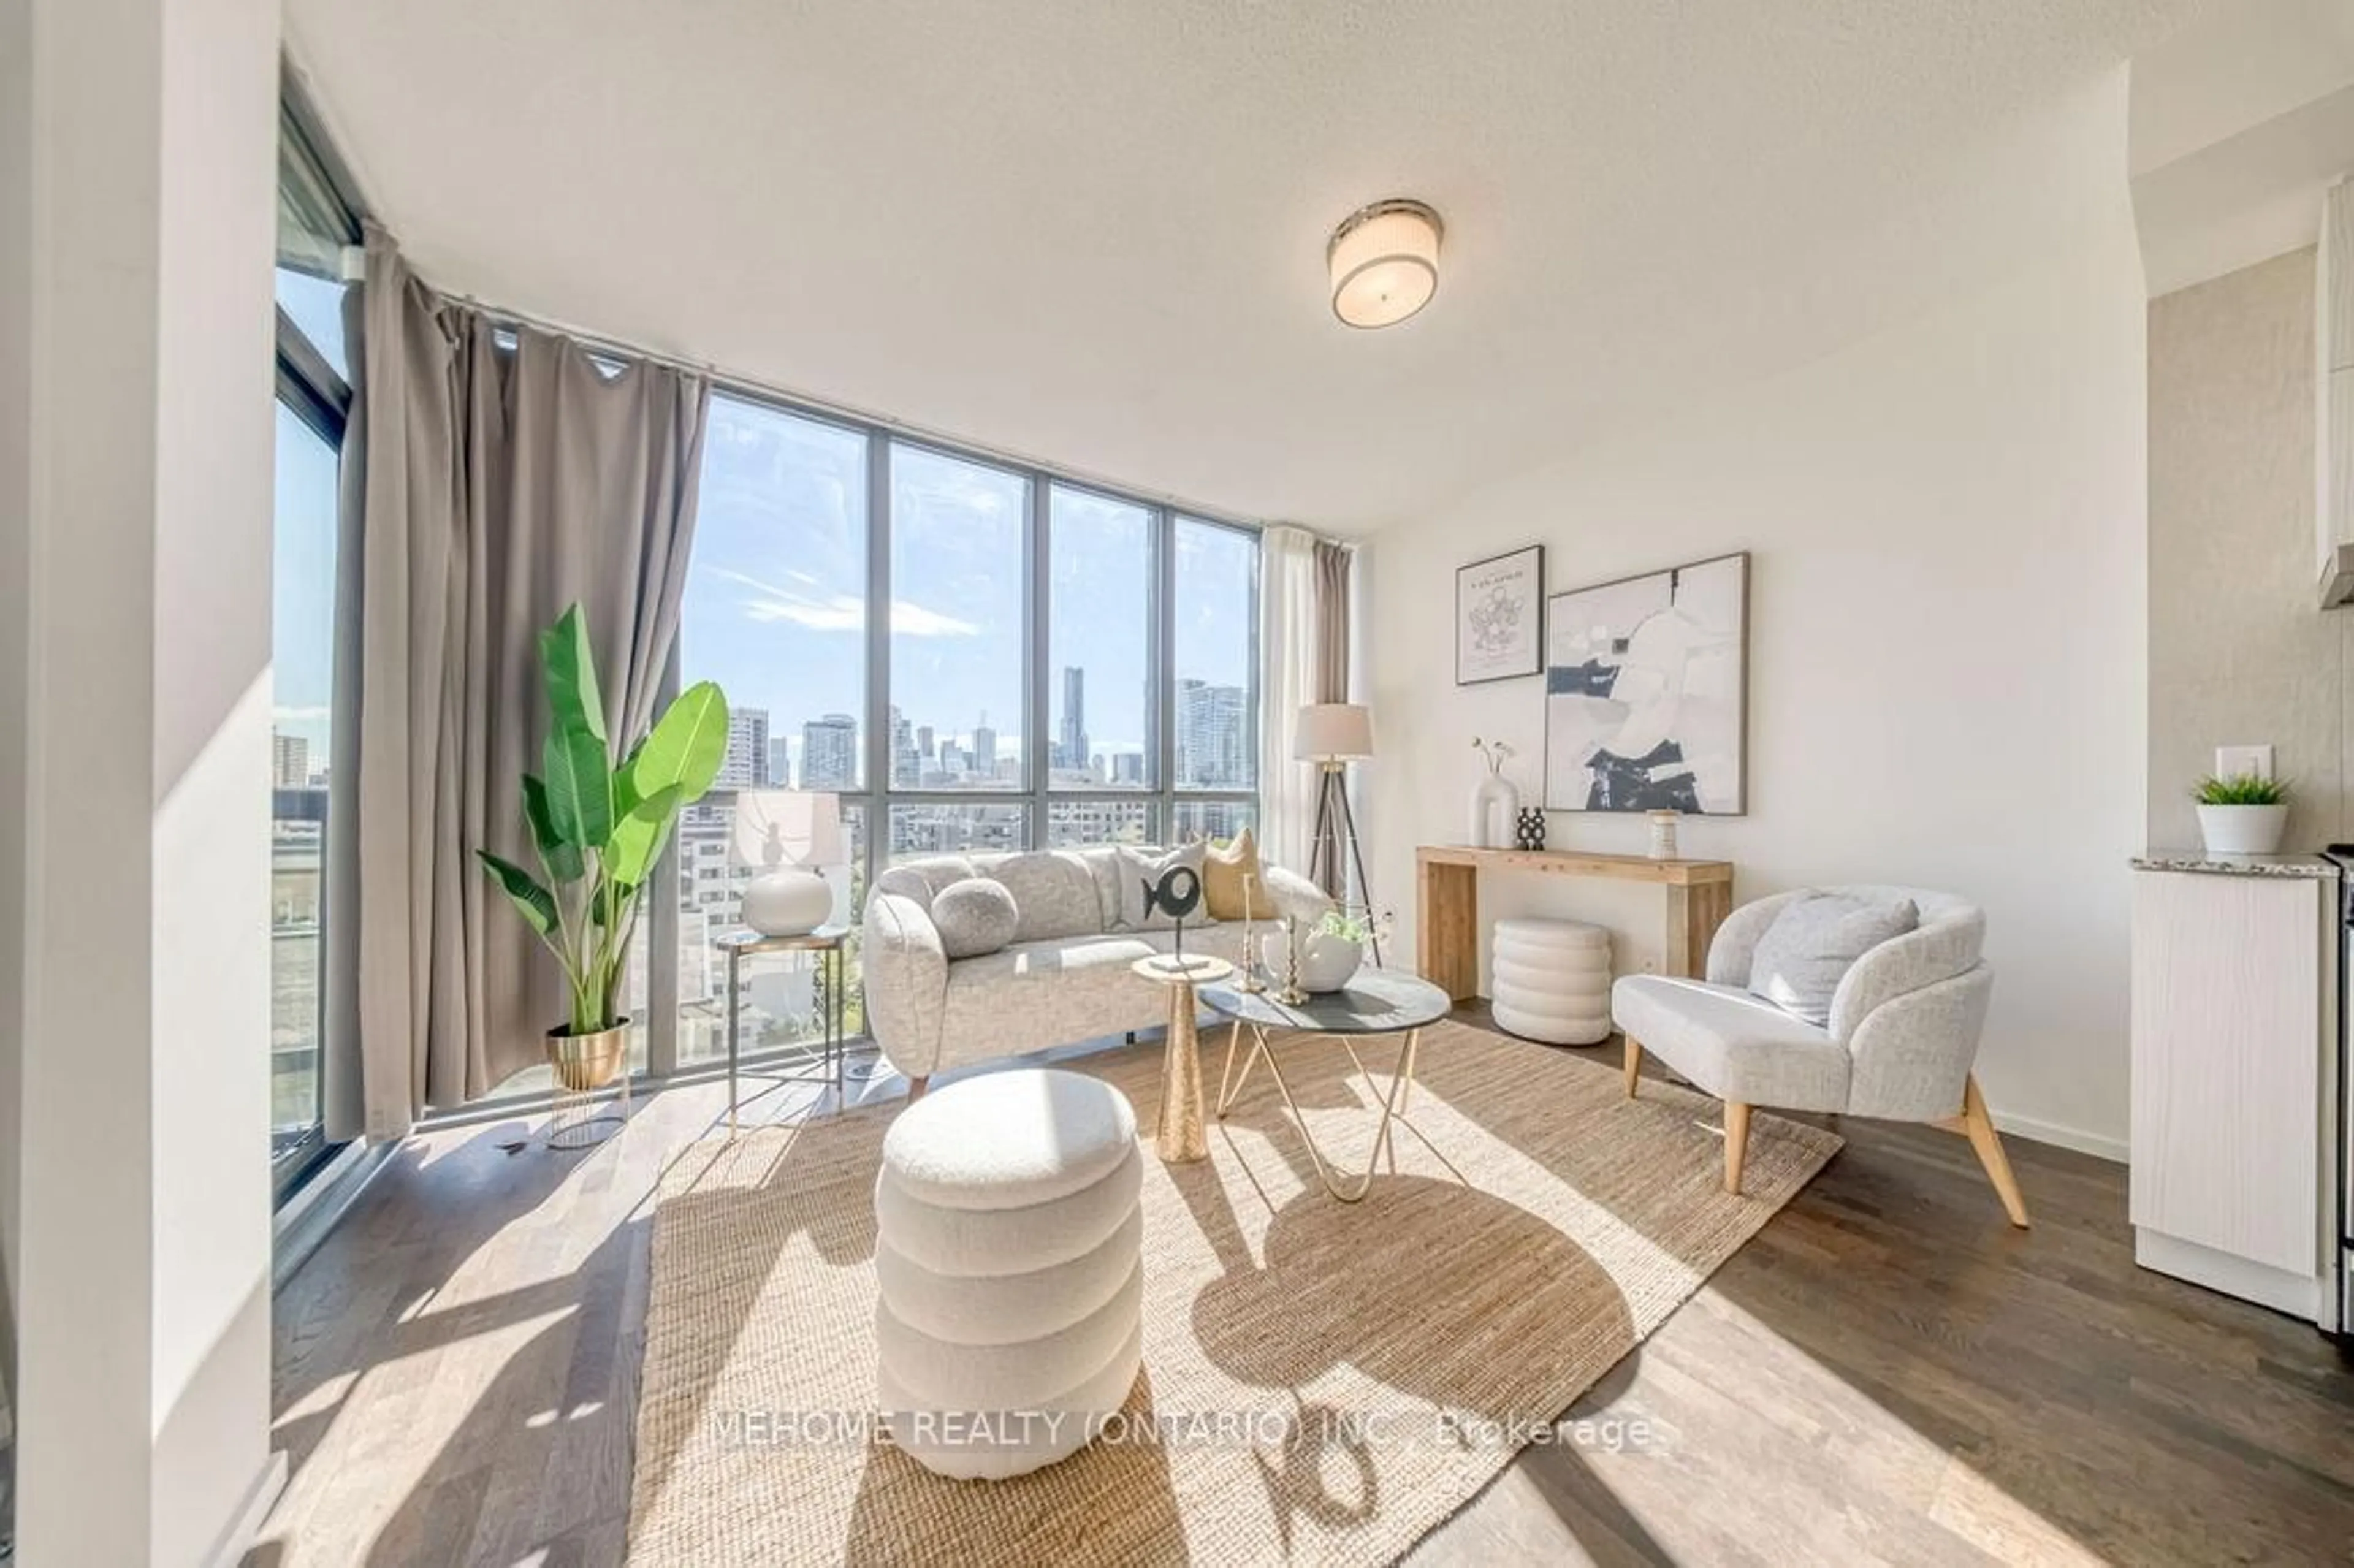
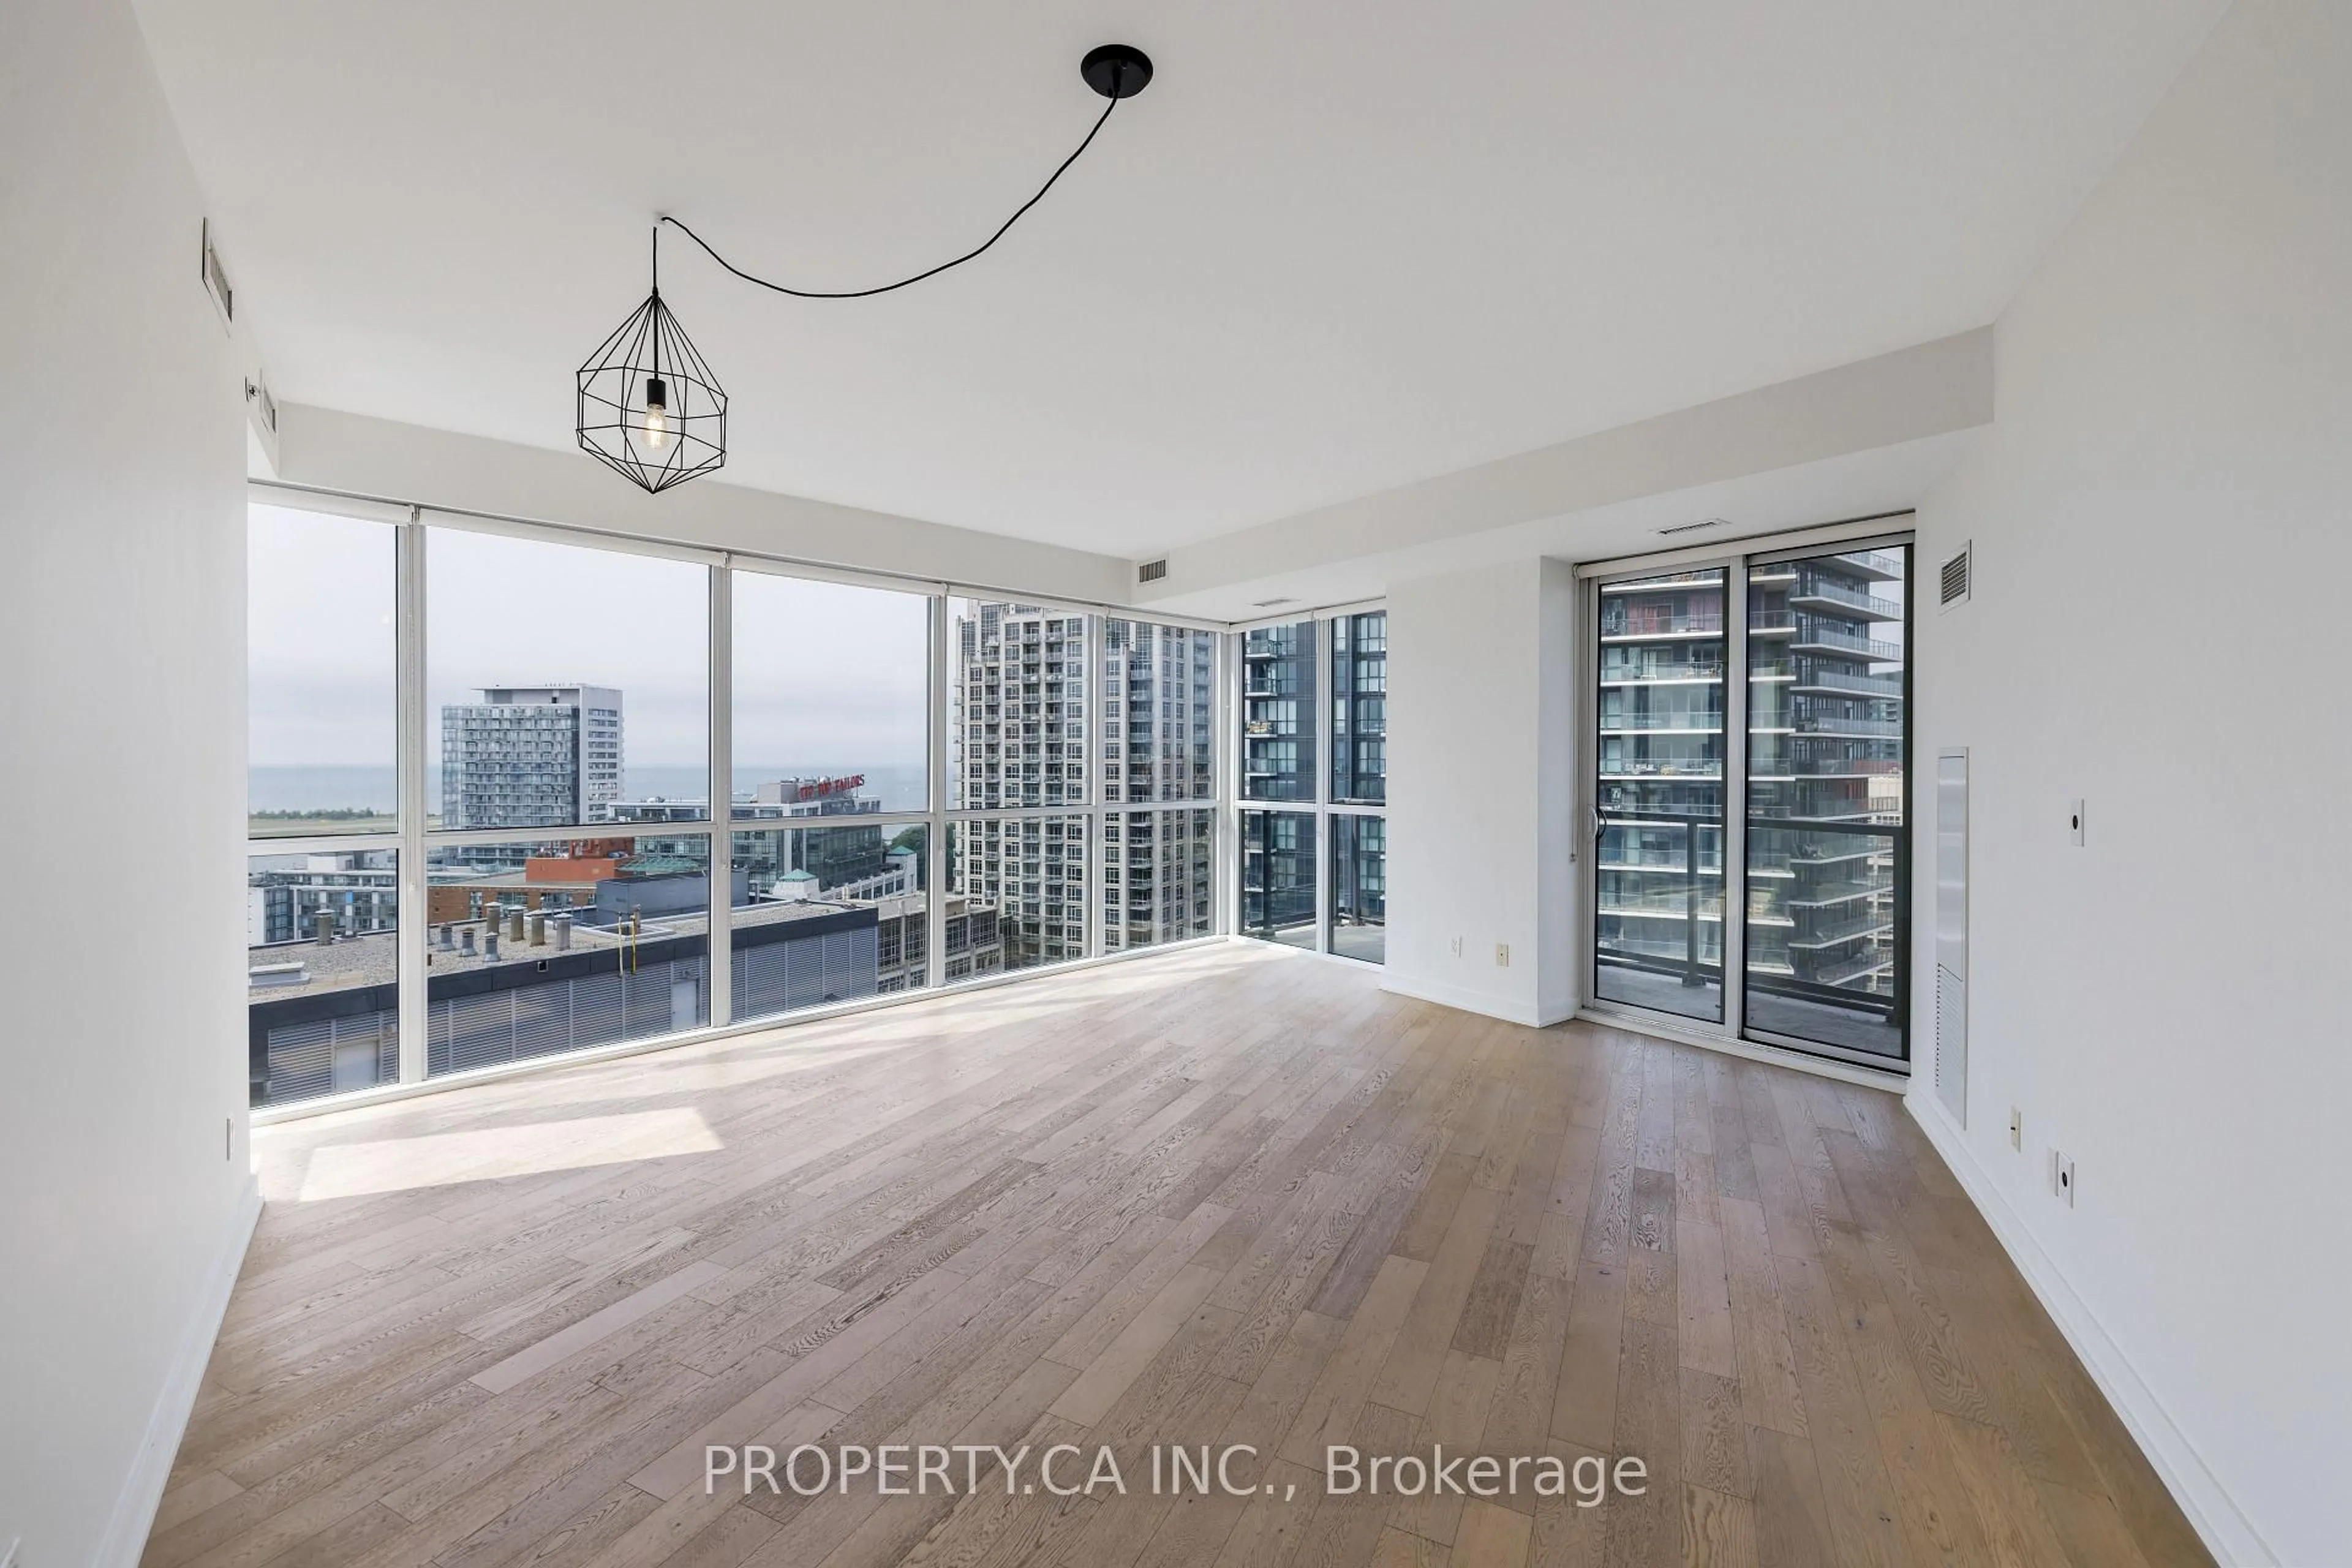
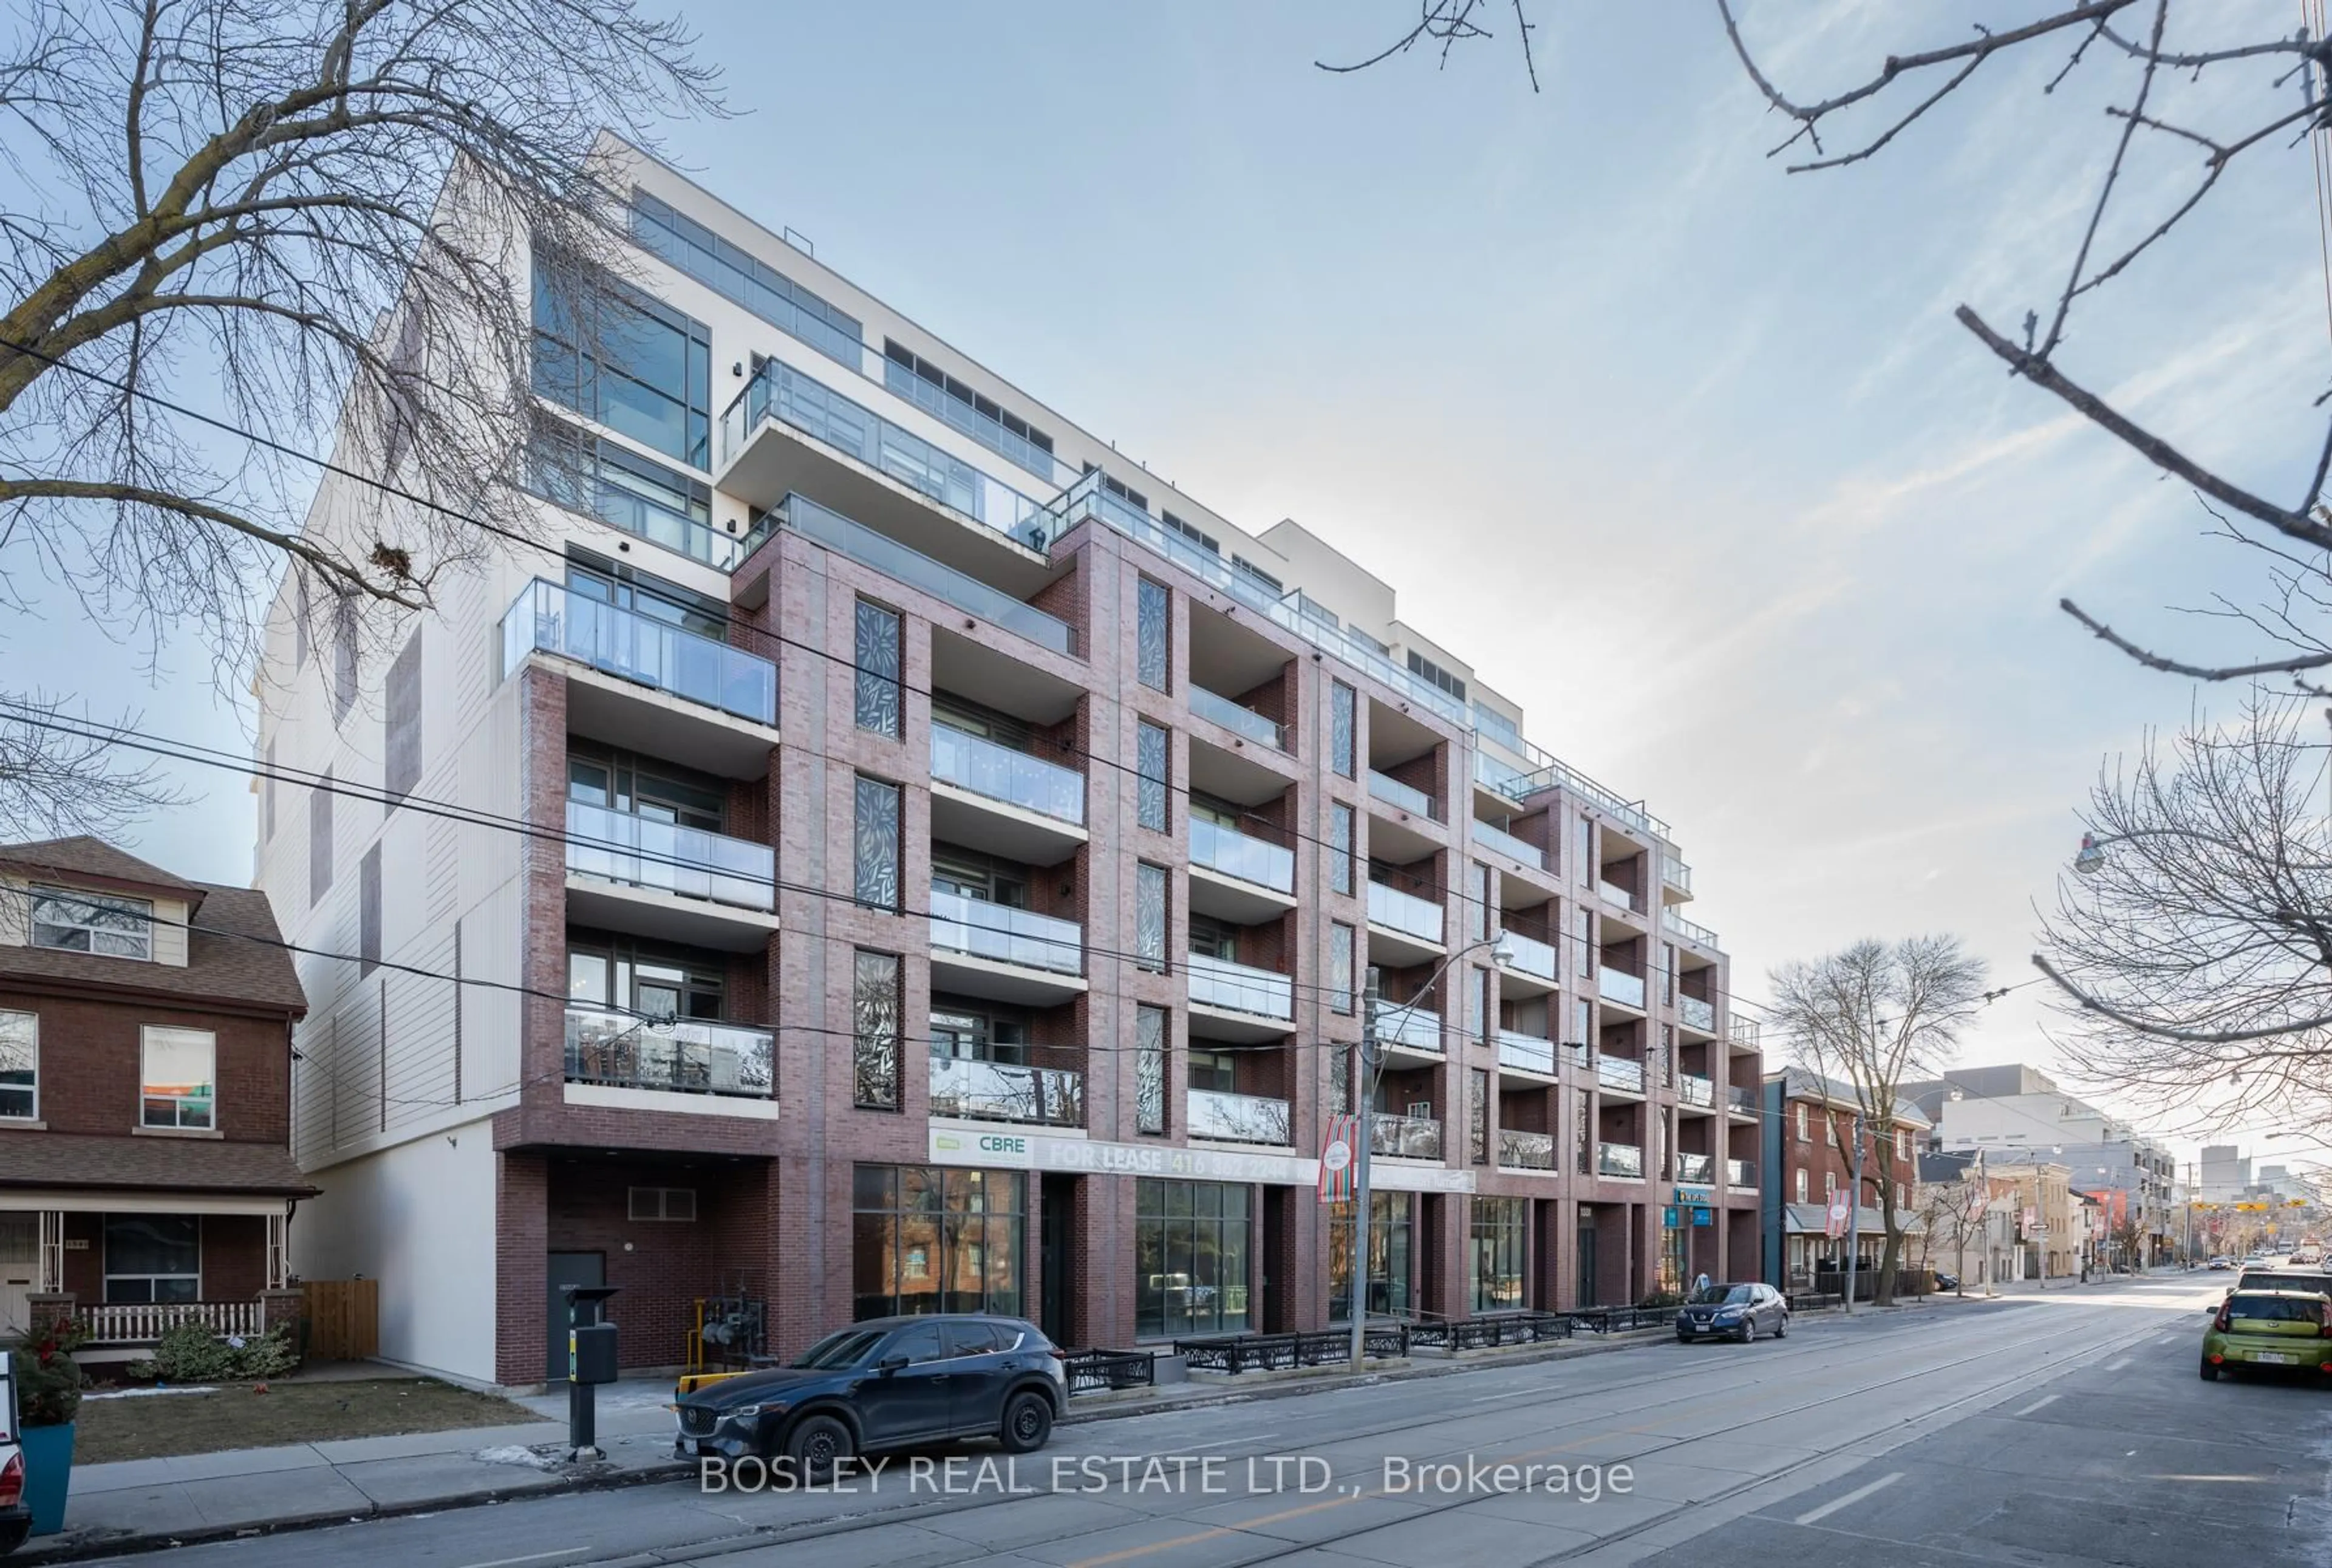
Blurry image for 11 Brunel Crt, Toronto Ontario M5V 3Y3
43 days on Market

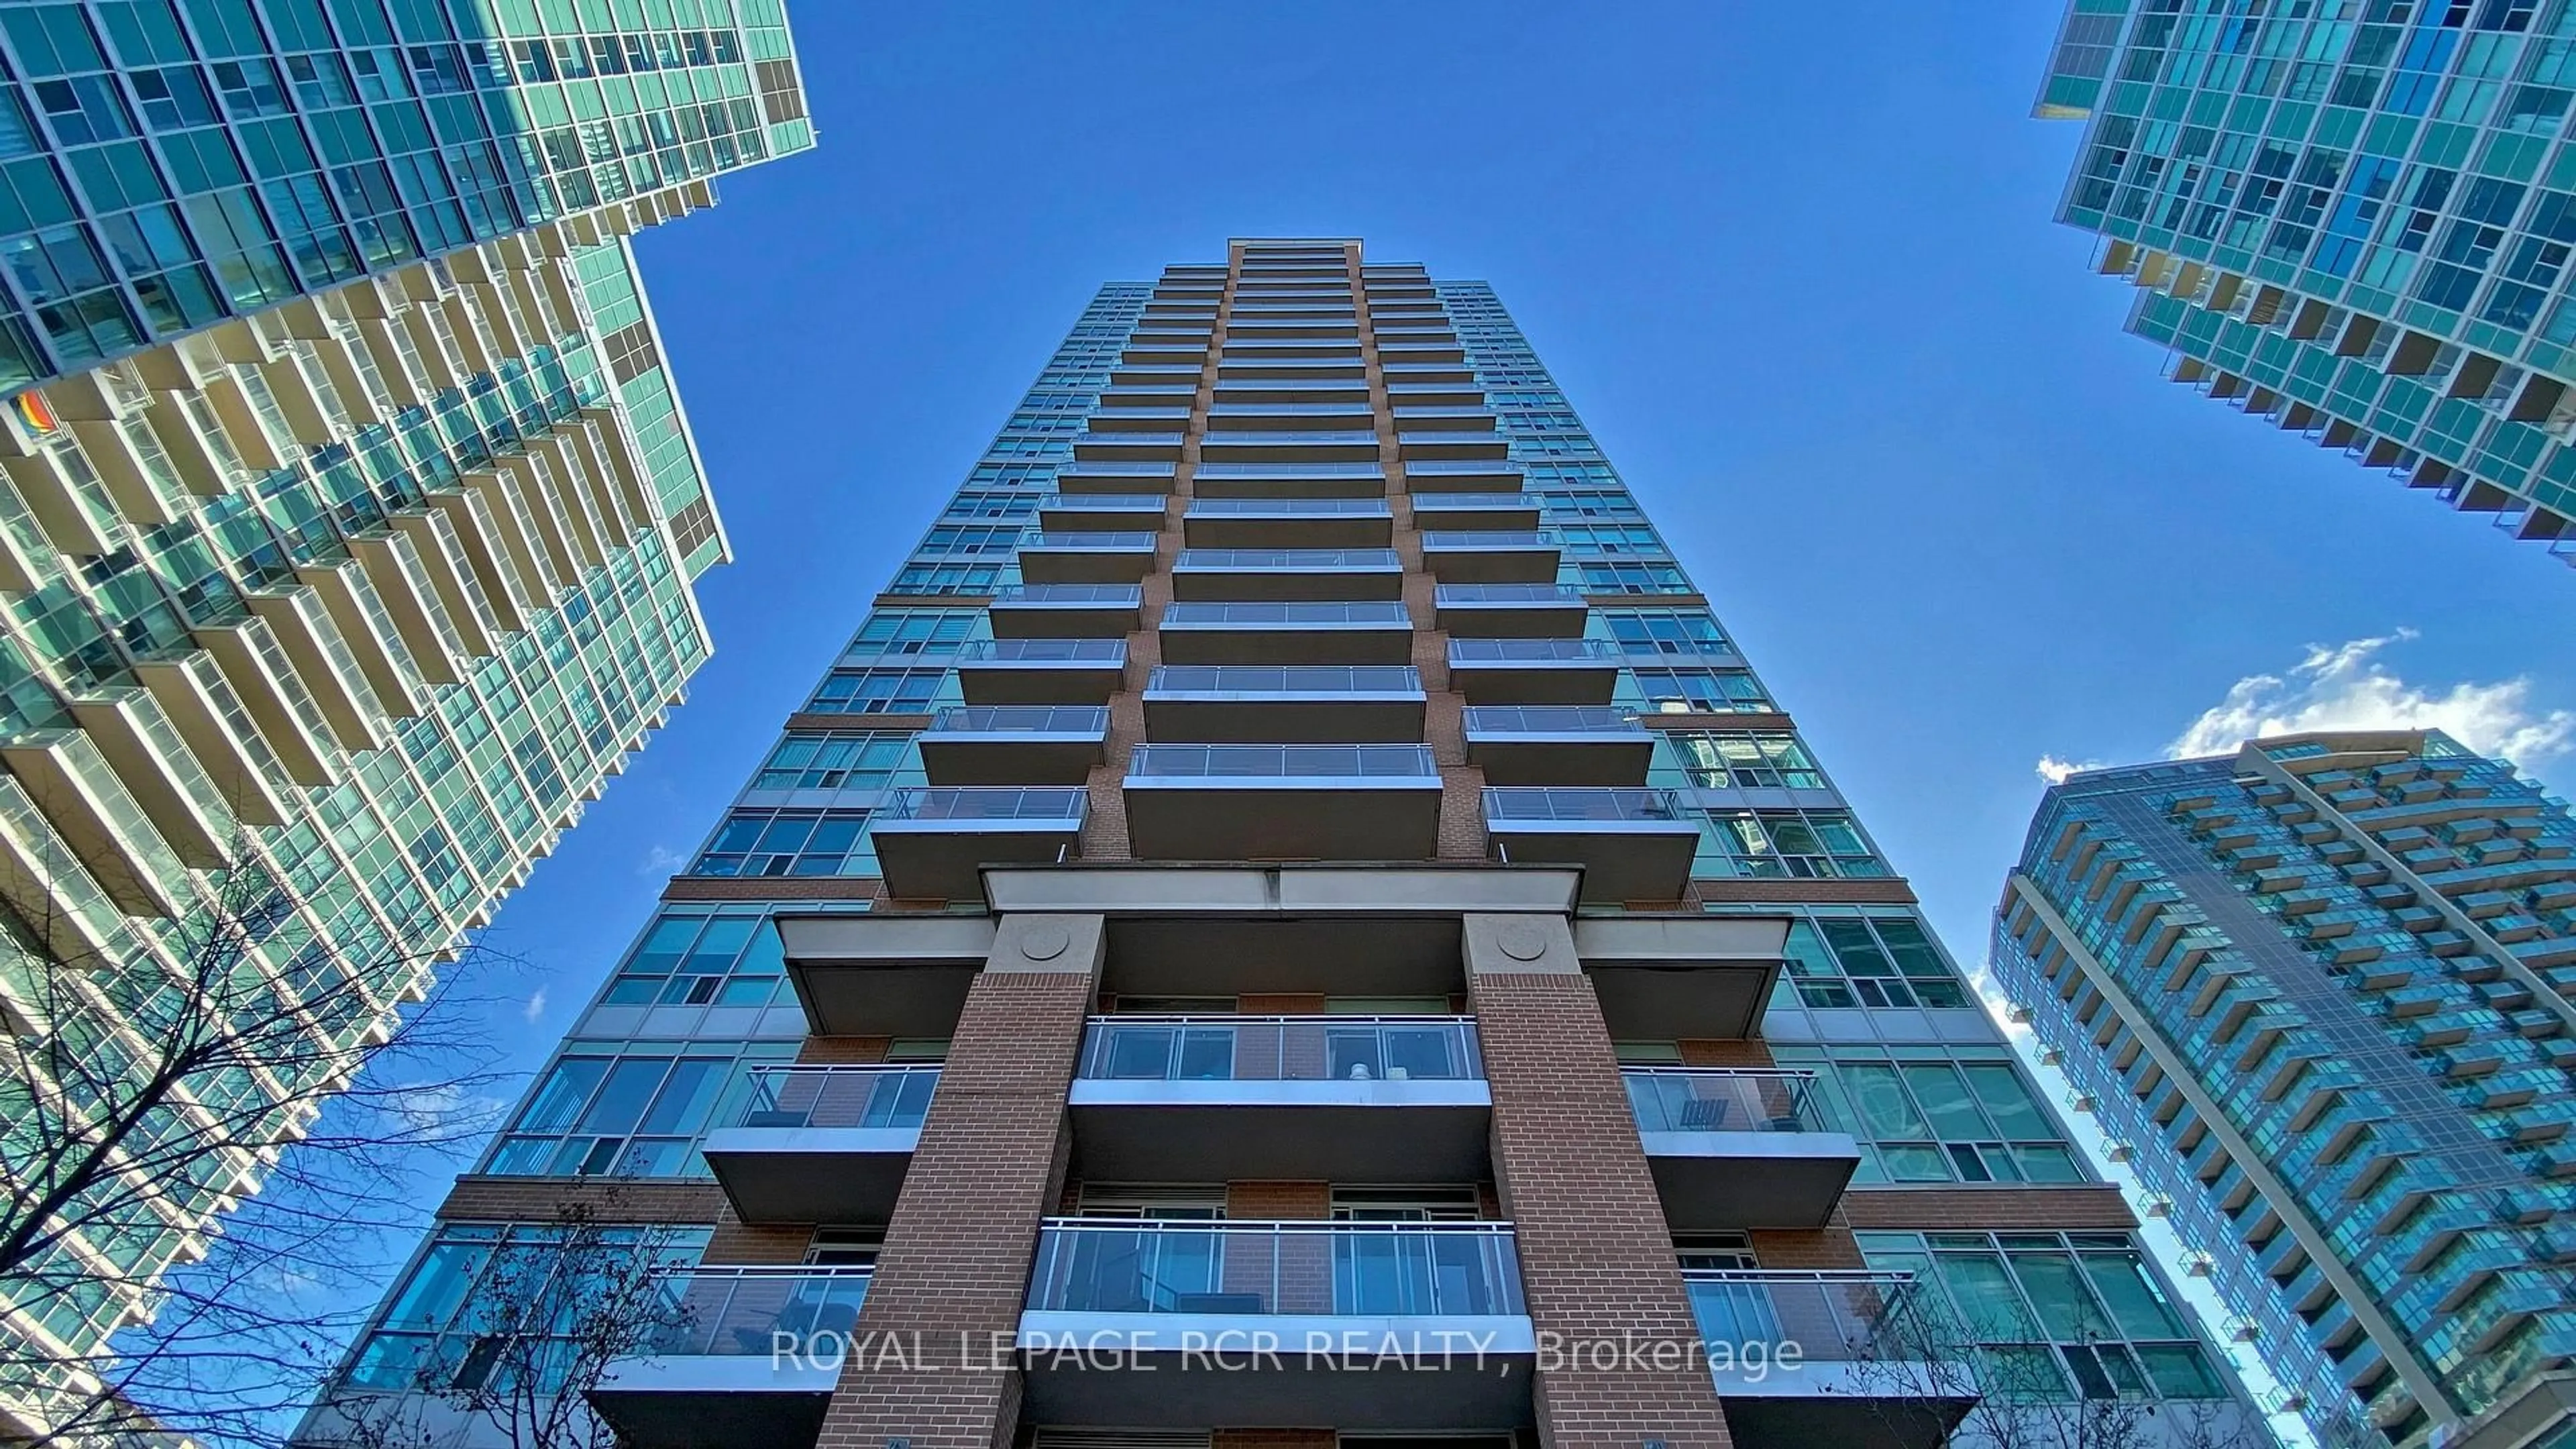
11 Brunel Crt, Toronto, Ontario M5V 3Y3

In the same building:
-
Condo
1 + 1
1
~600-699 sqft
$899,000
Get pre-qualifiedPowered by nesto
Buy with Wahi to get
Up to
$4,495Cashback
Condo
1 + 1
1
~600-699 sqft

Contact us about this property

Call

Highlights

Property Estimate

Days on market43 days

Estimated valueNot available

Price/Sqft$1,392/sqft

Monthly cost

Open Calculator

CMA Subject Property

Curious about what homes are selling for in this area?

Get a report on comparable homes with helpful insights and trends.

+31

Properties sold*

$665K

Median sold price*

*Based on last 30 days

Description

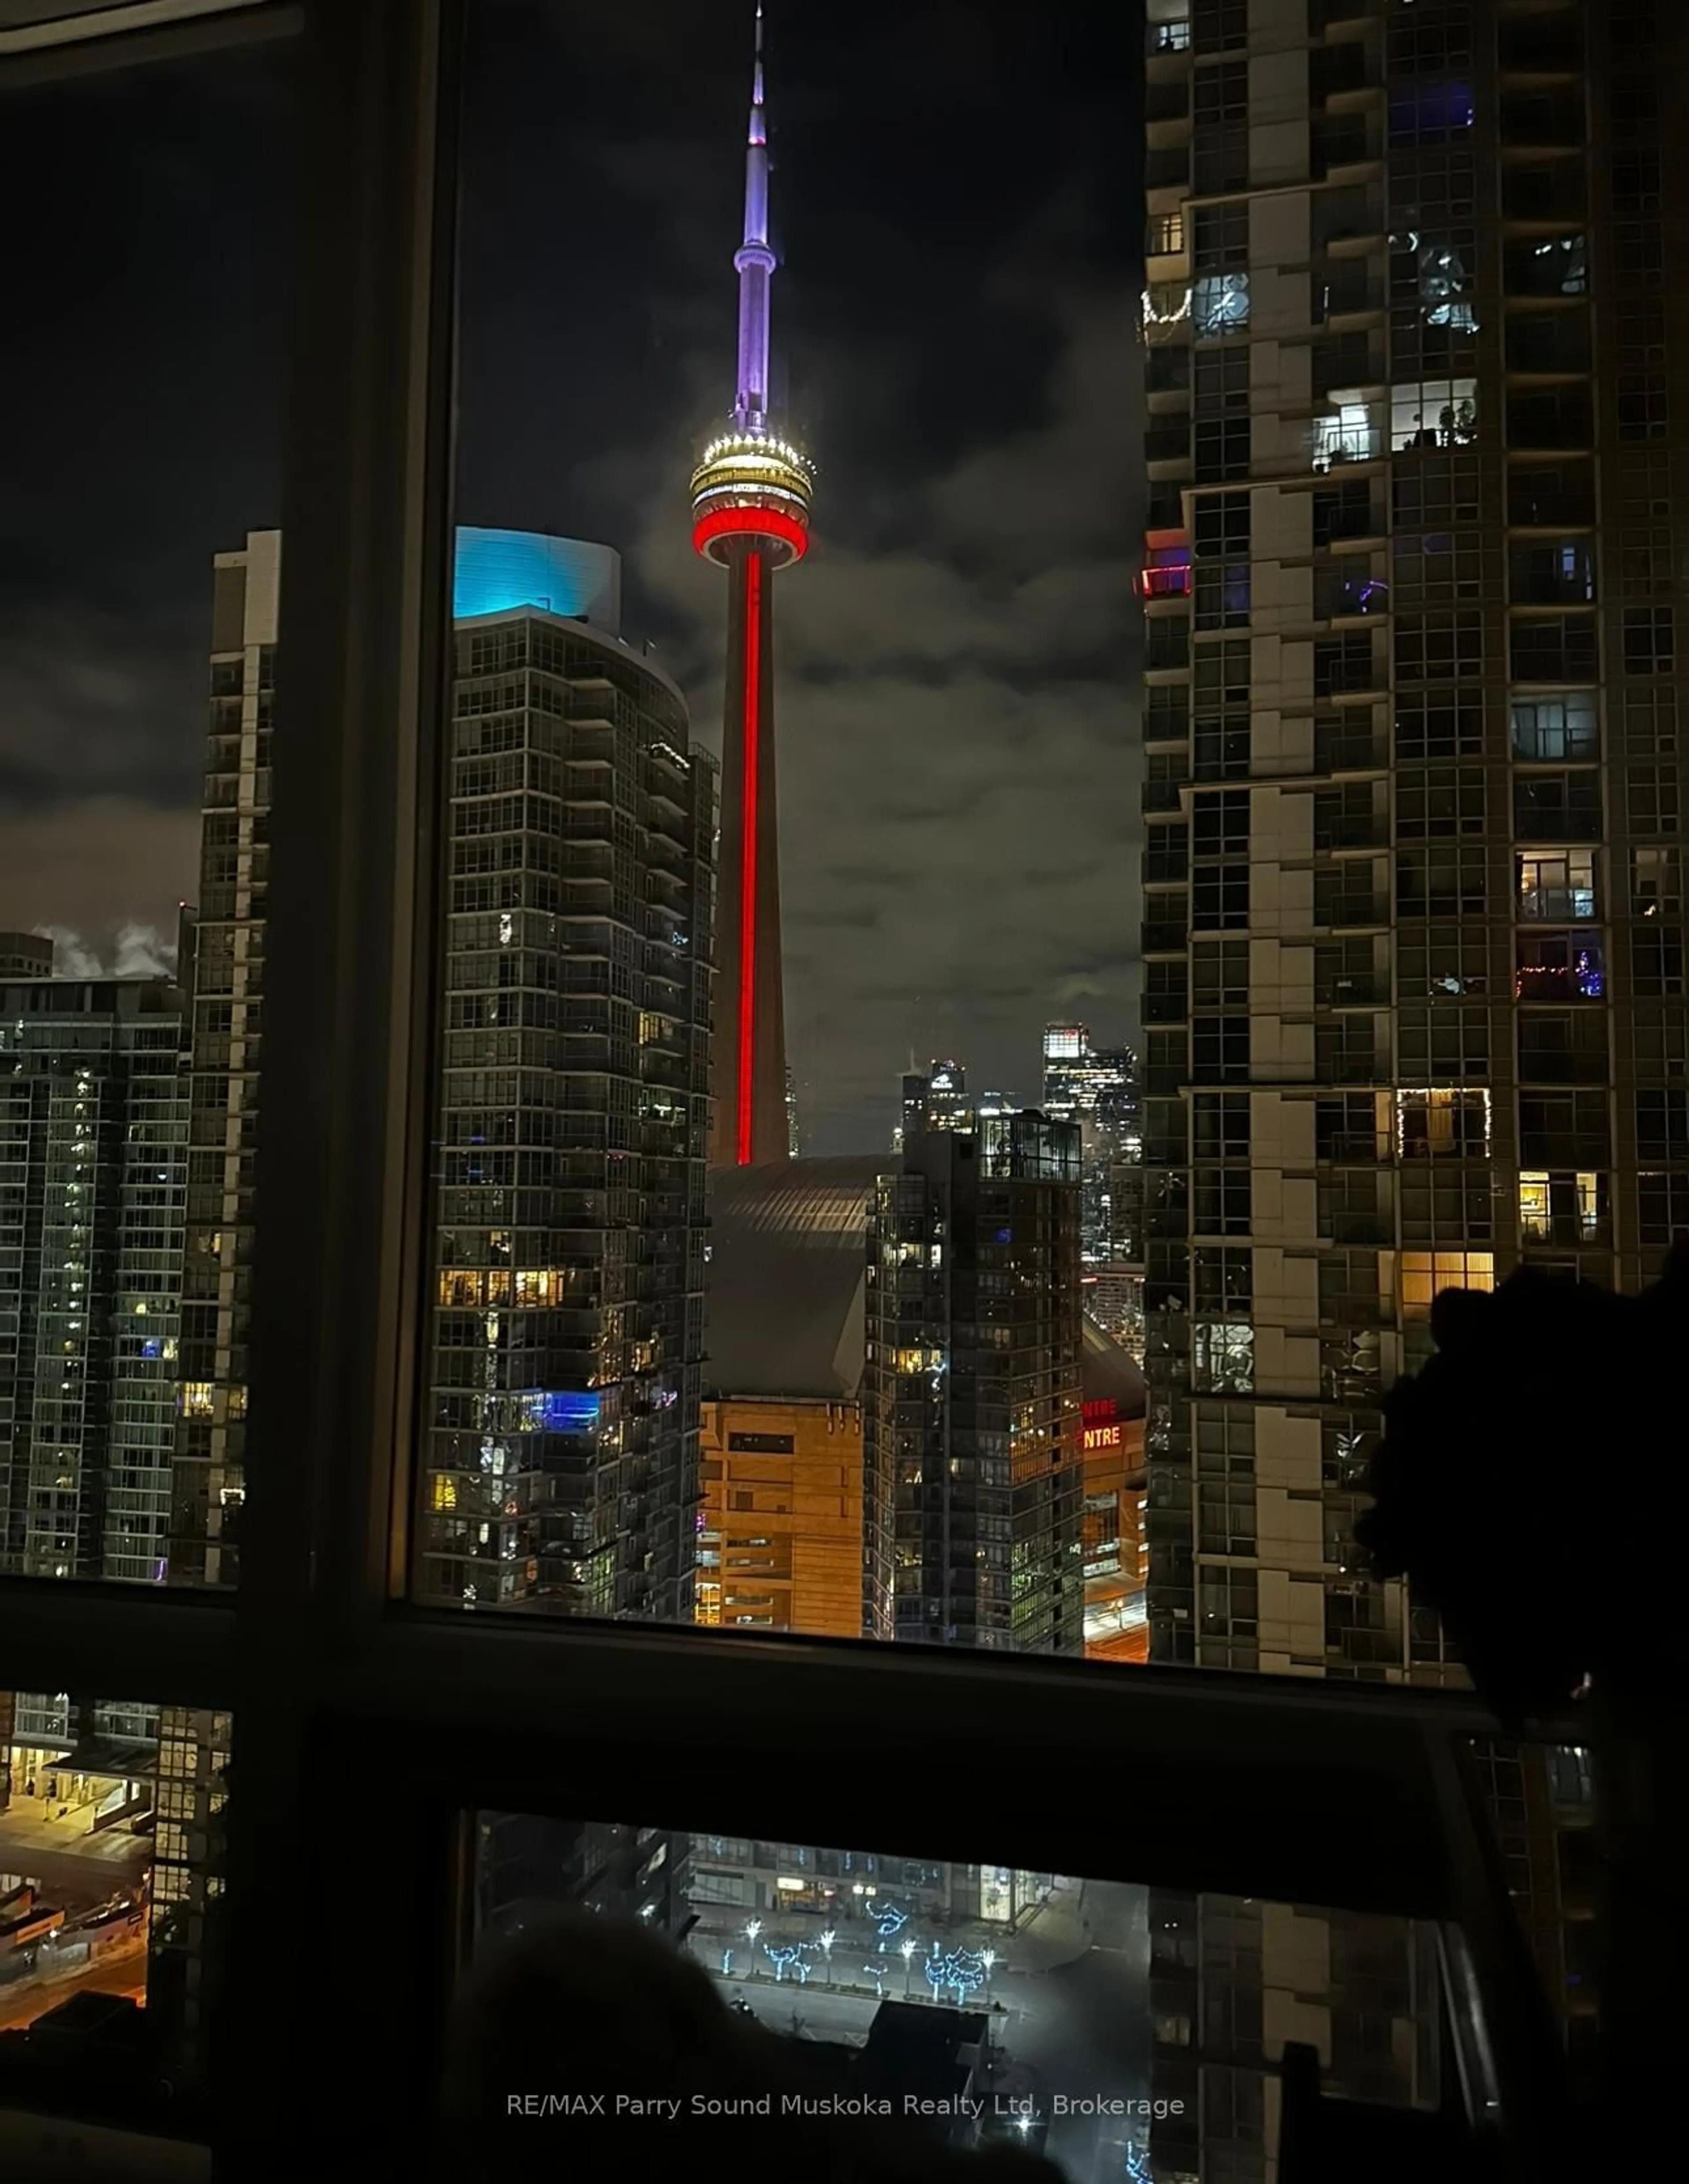
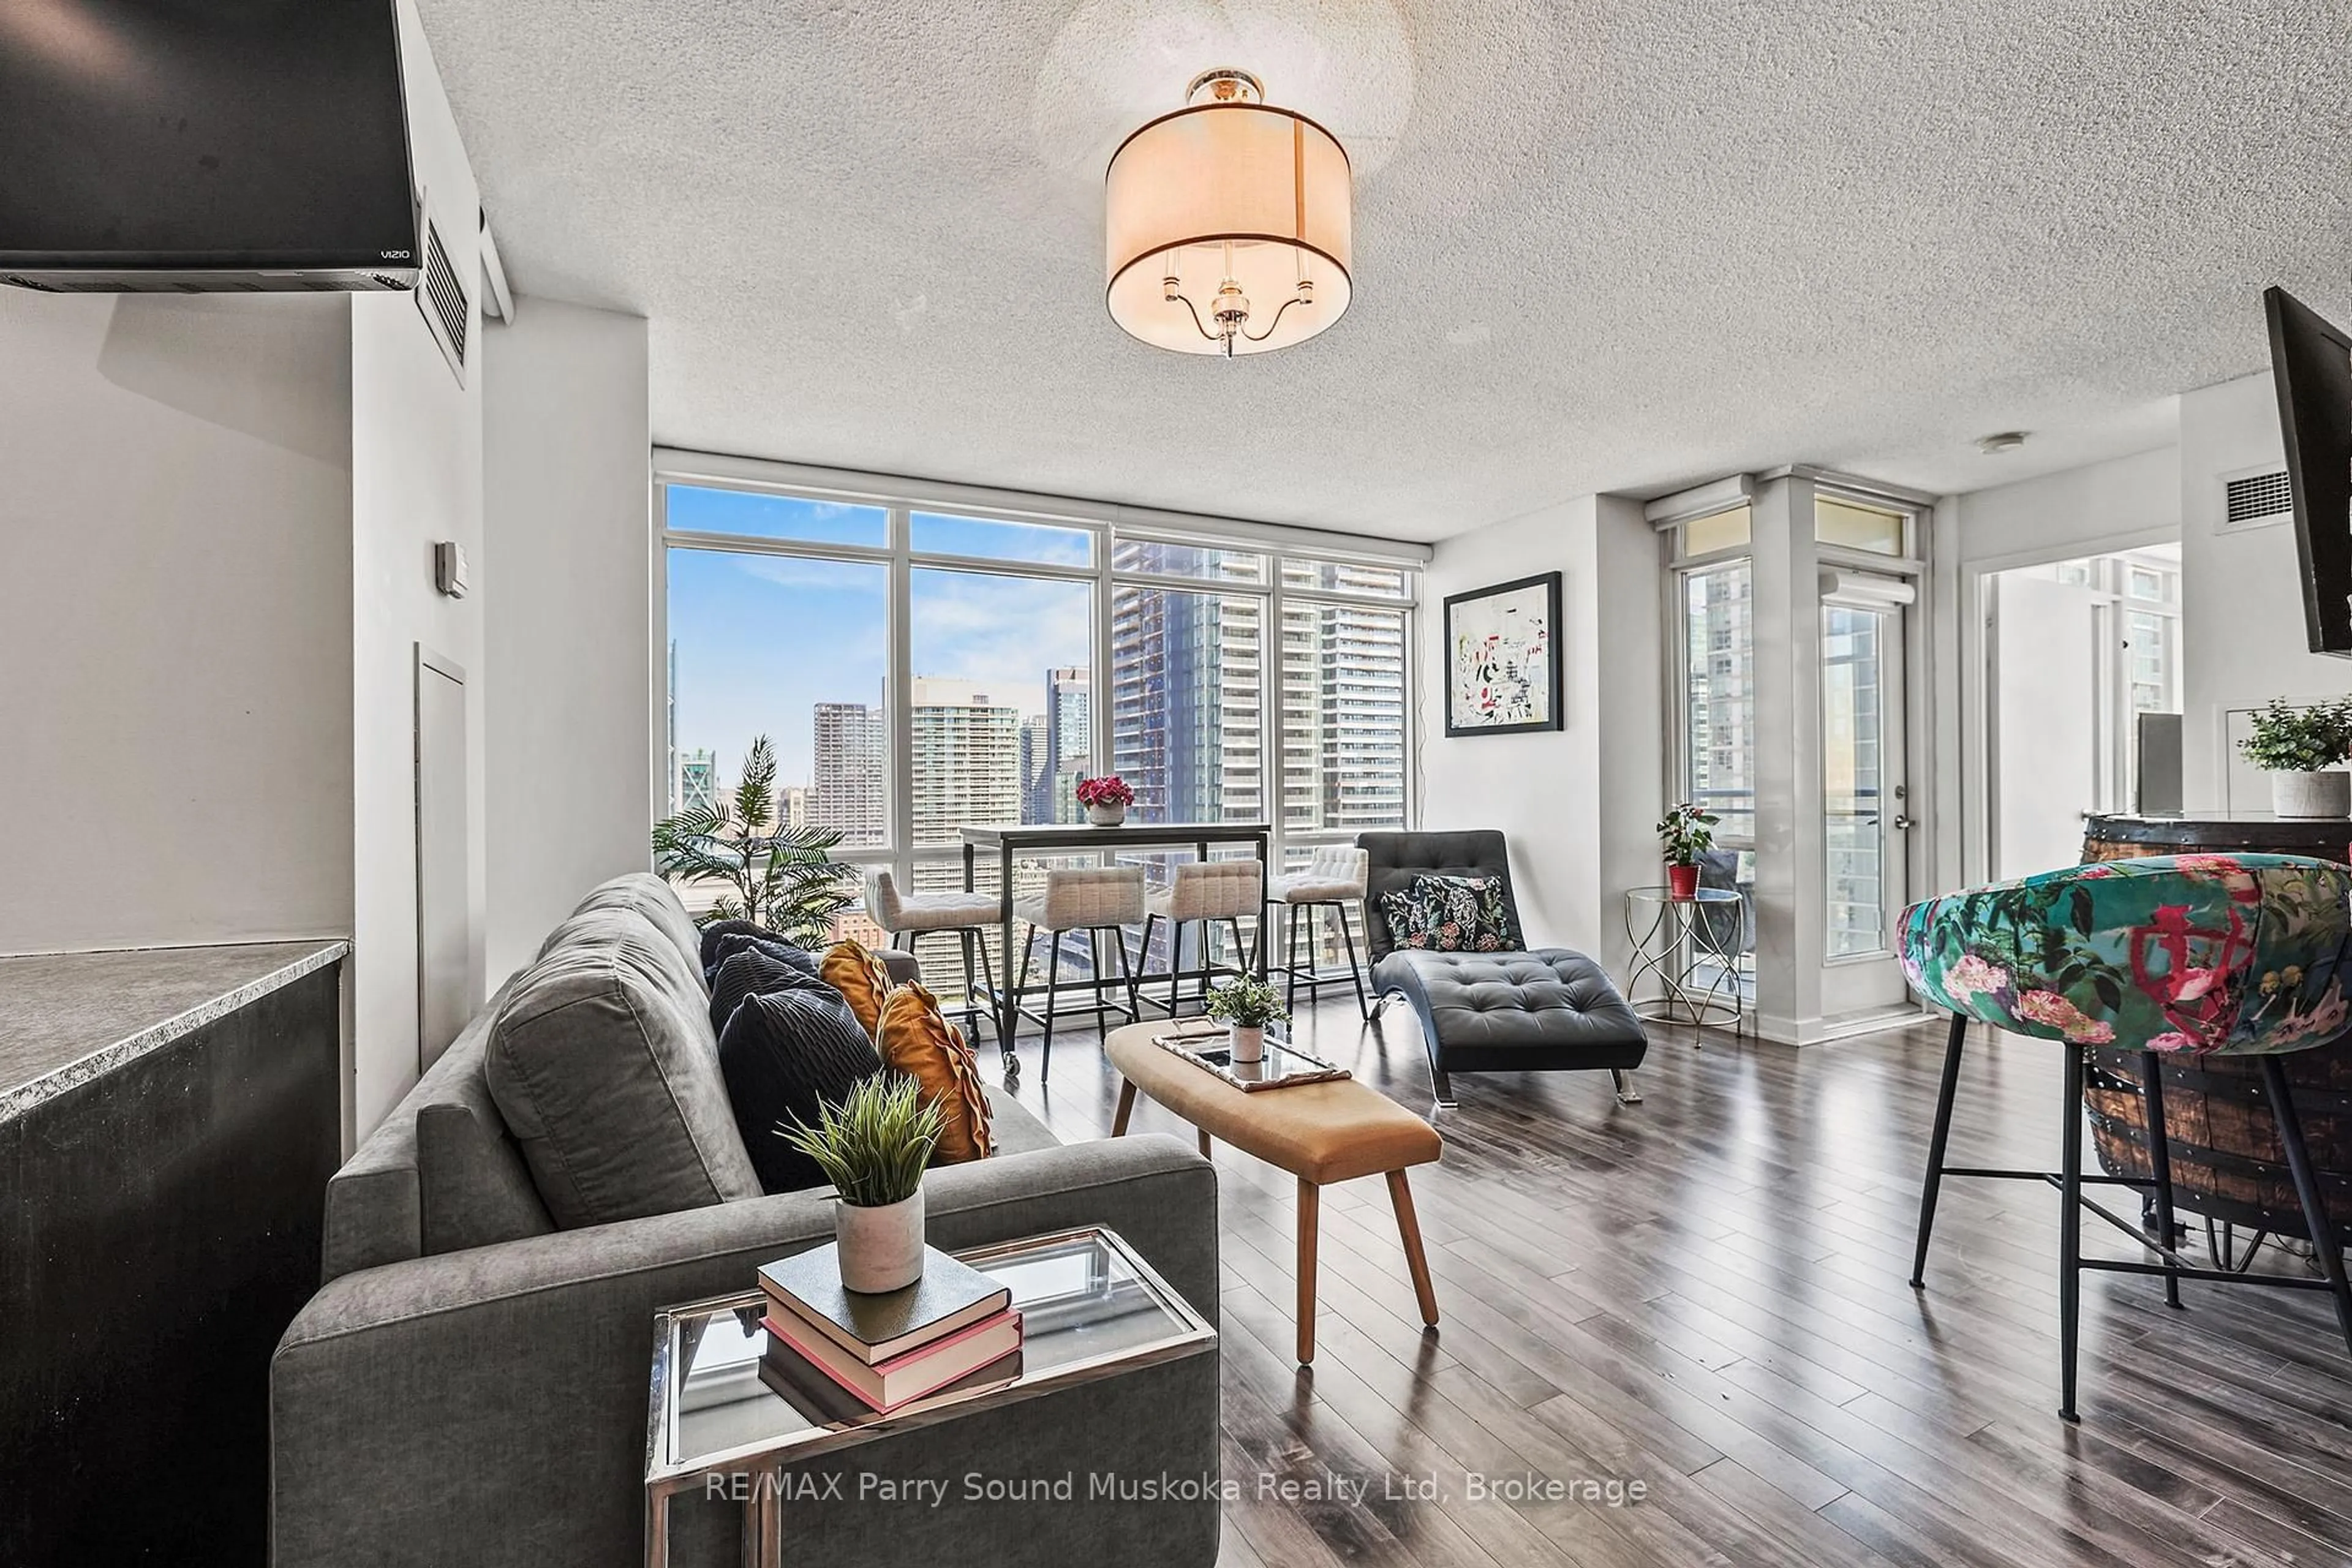
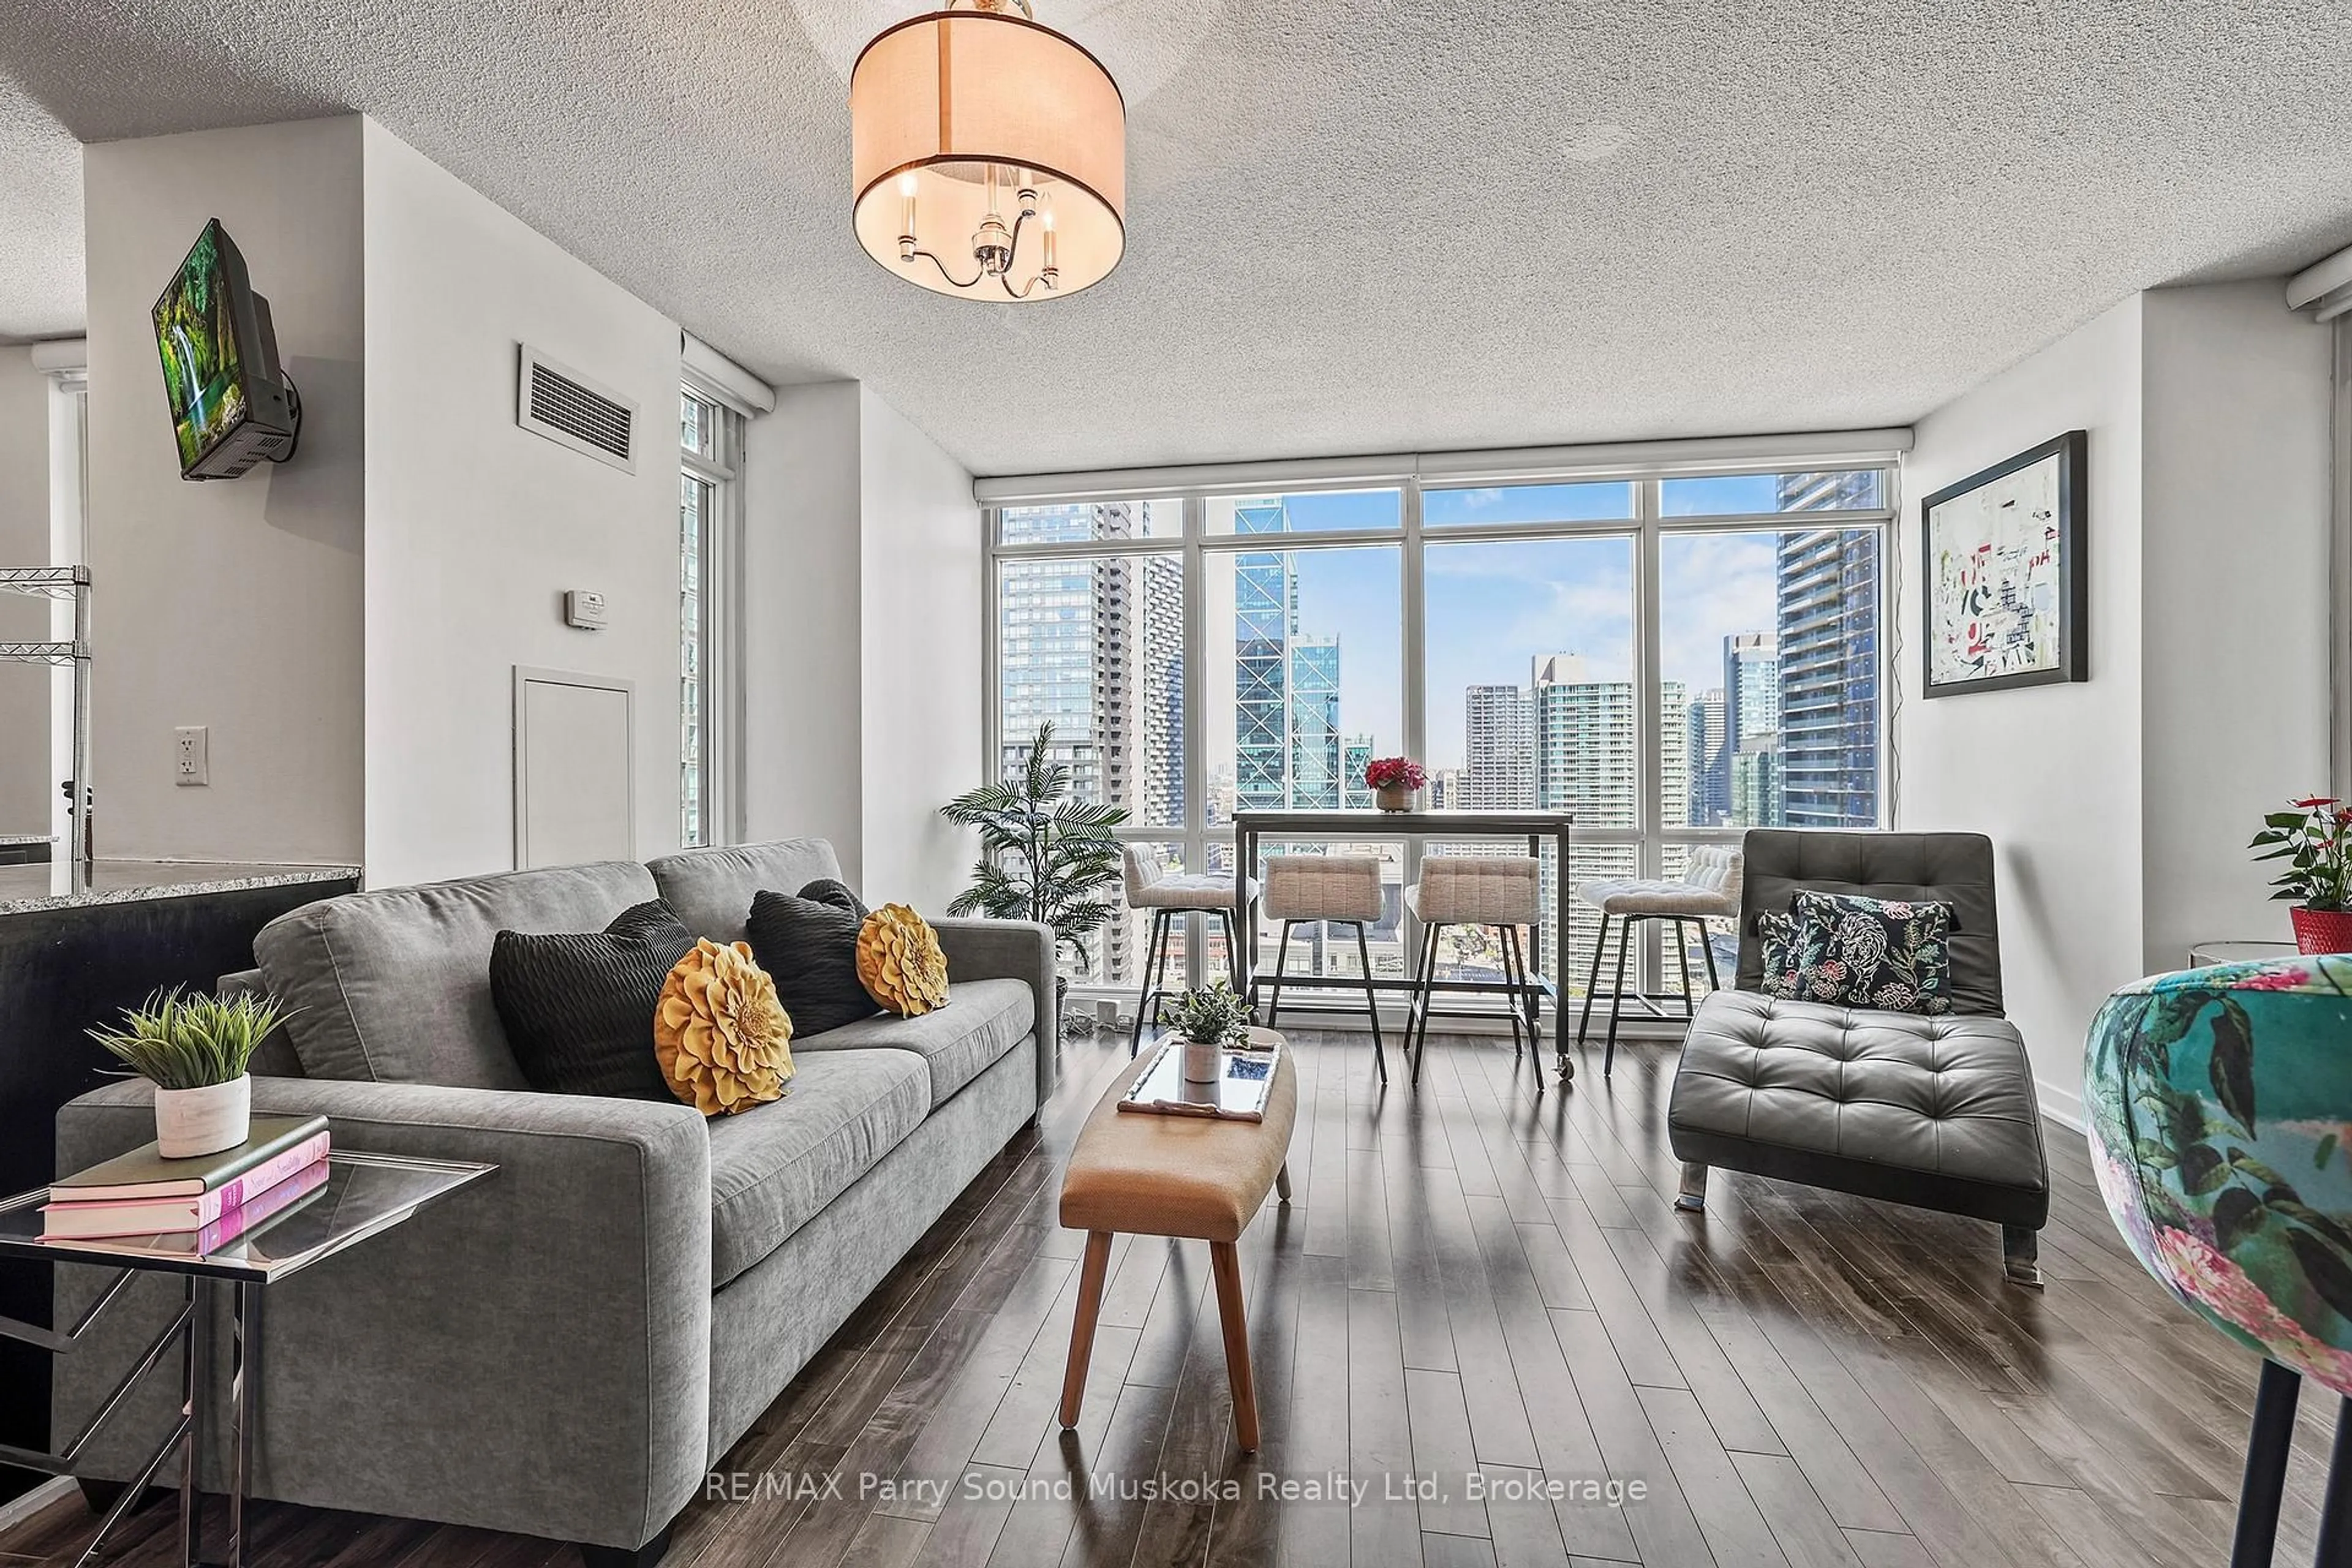
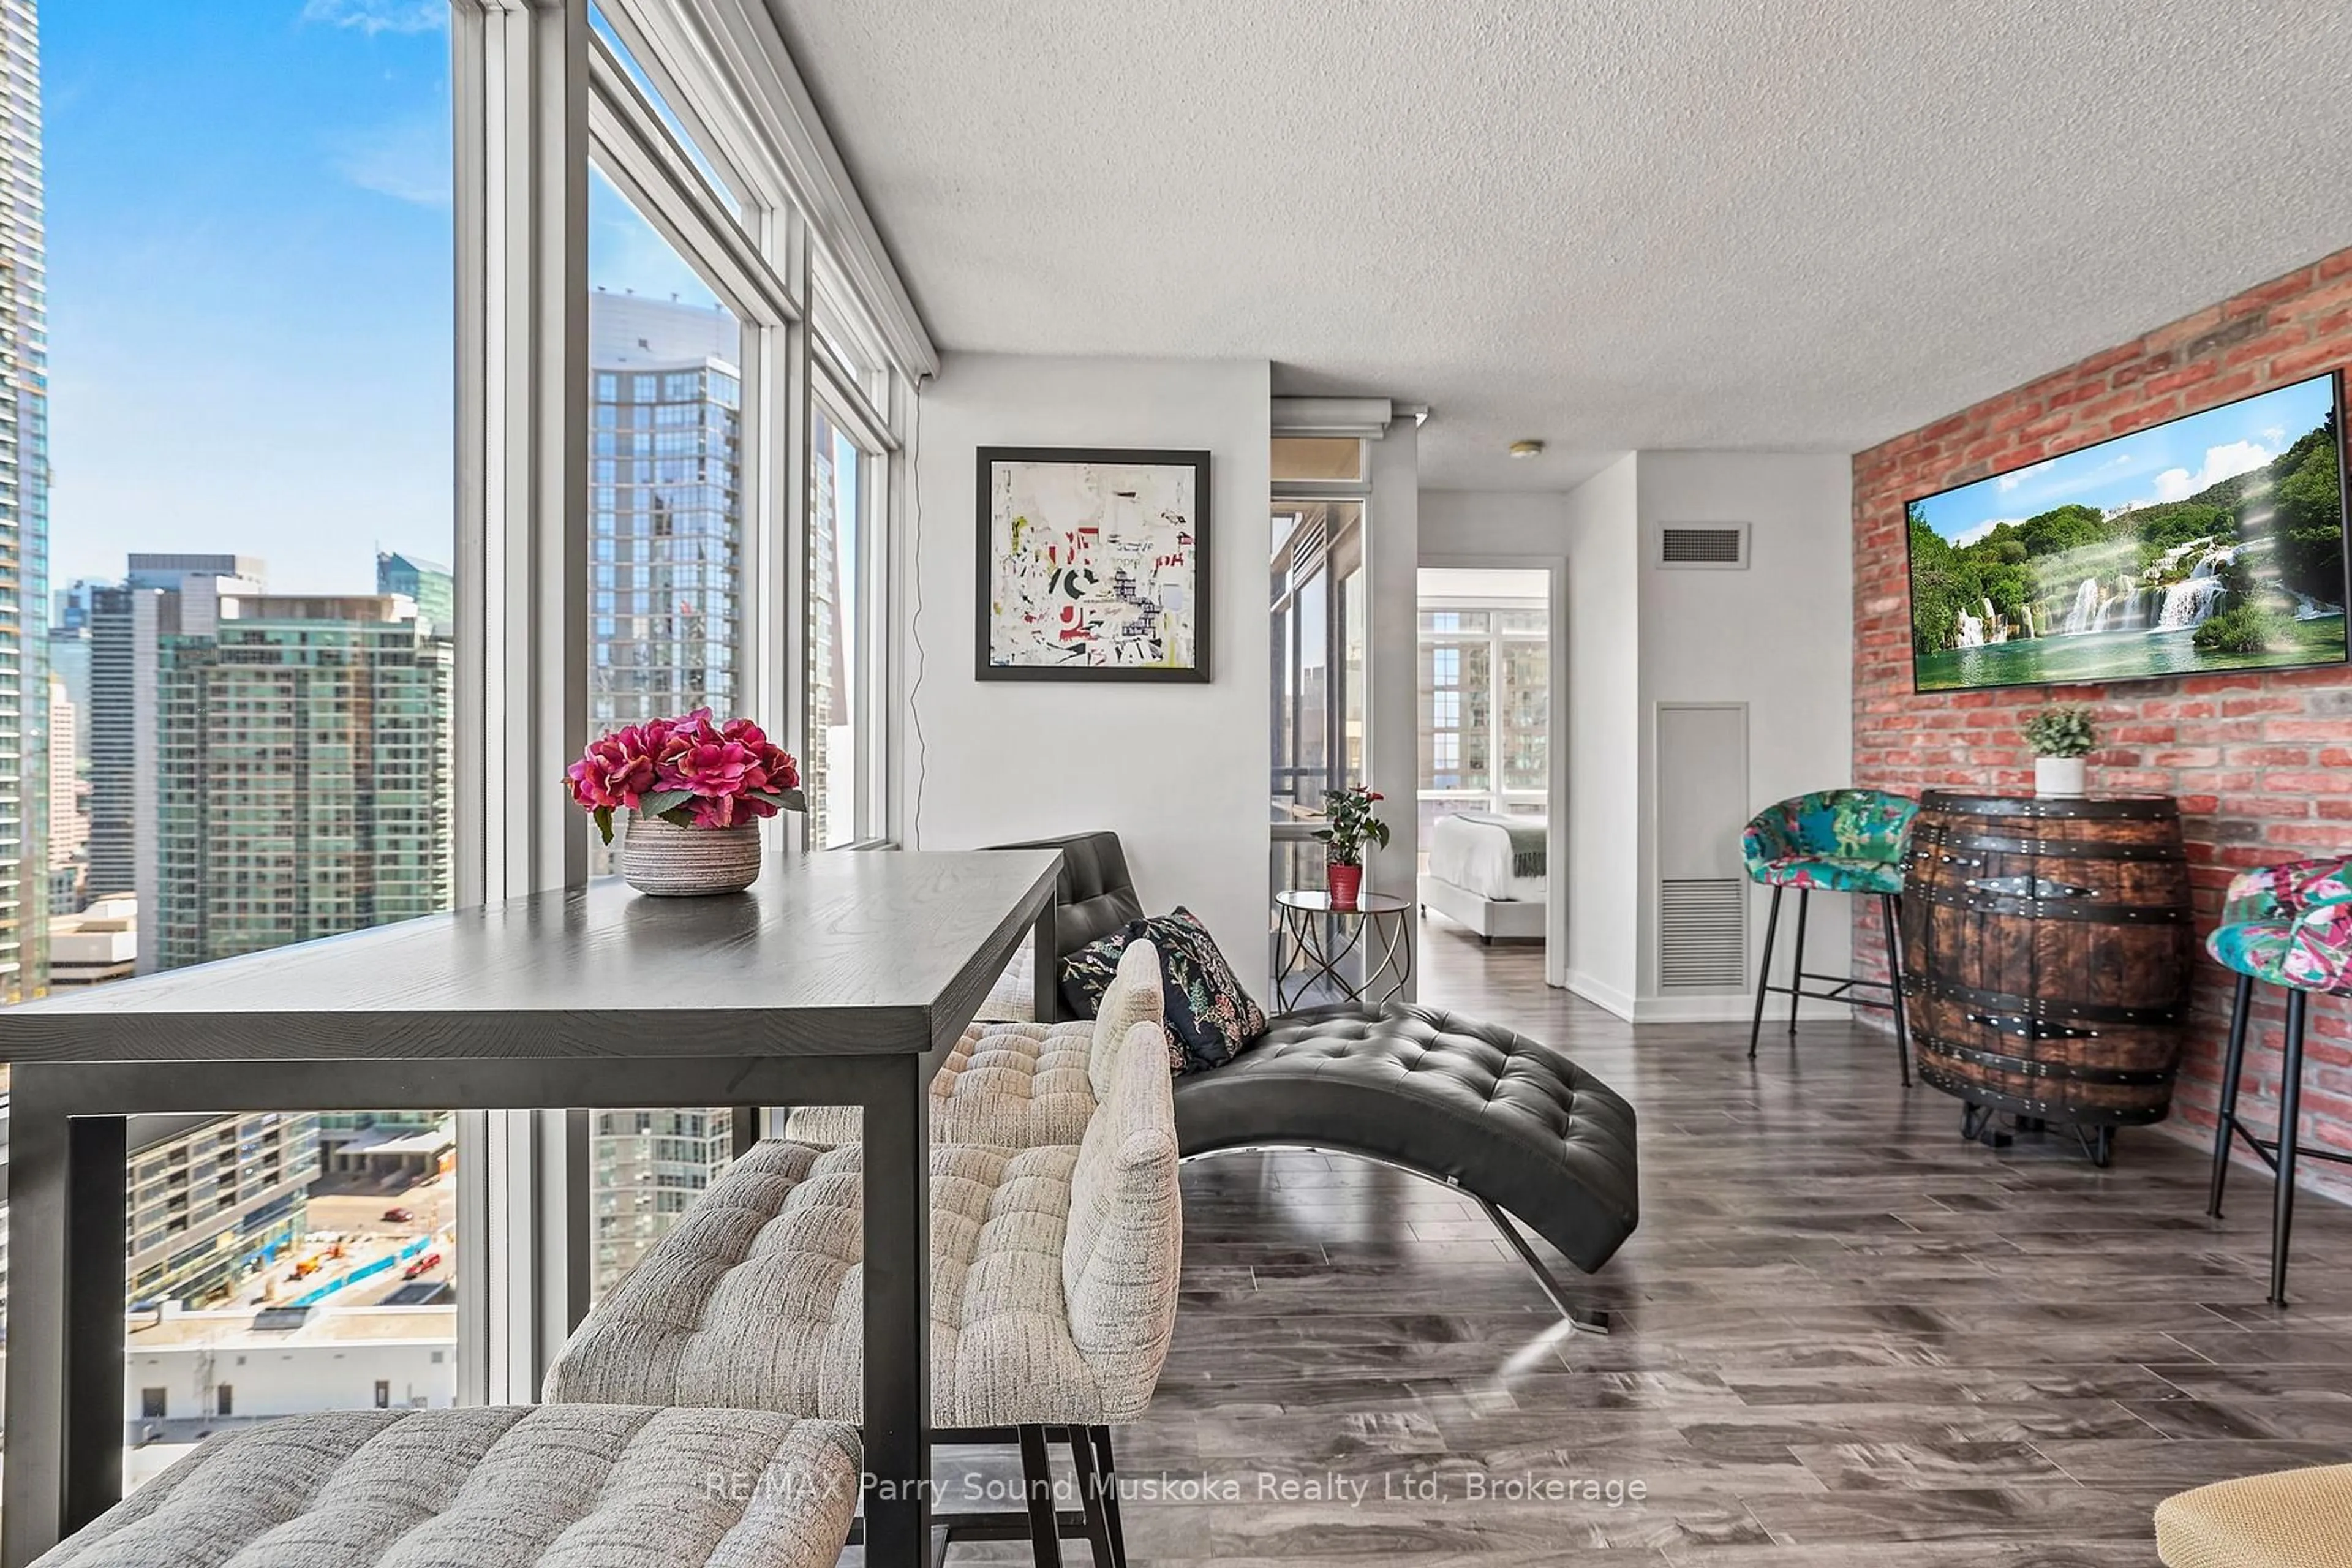
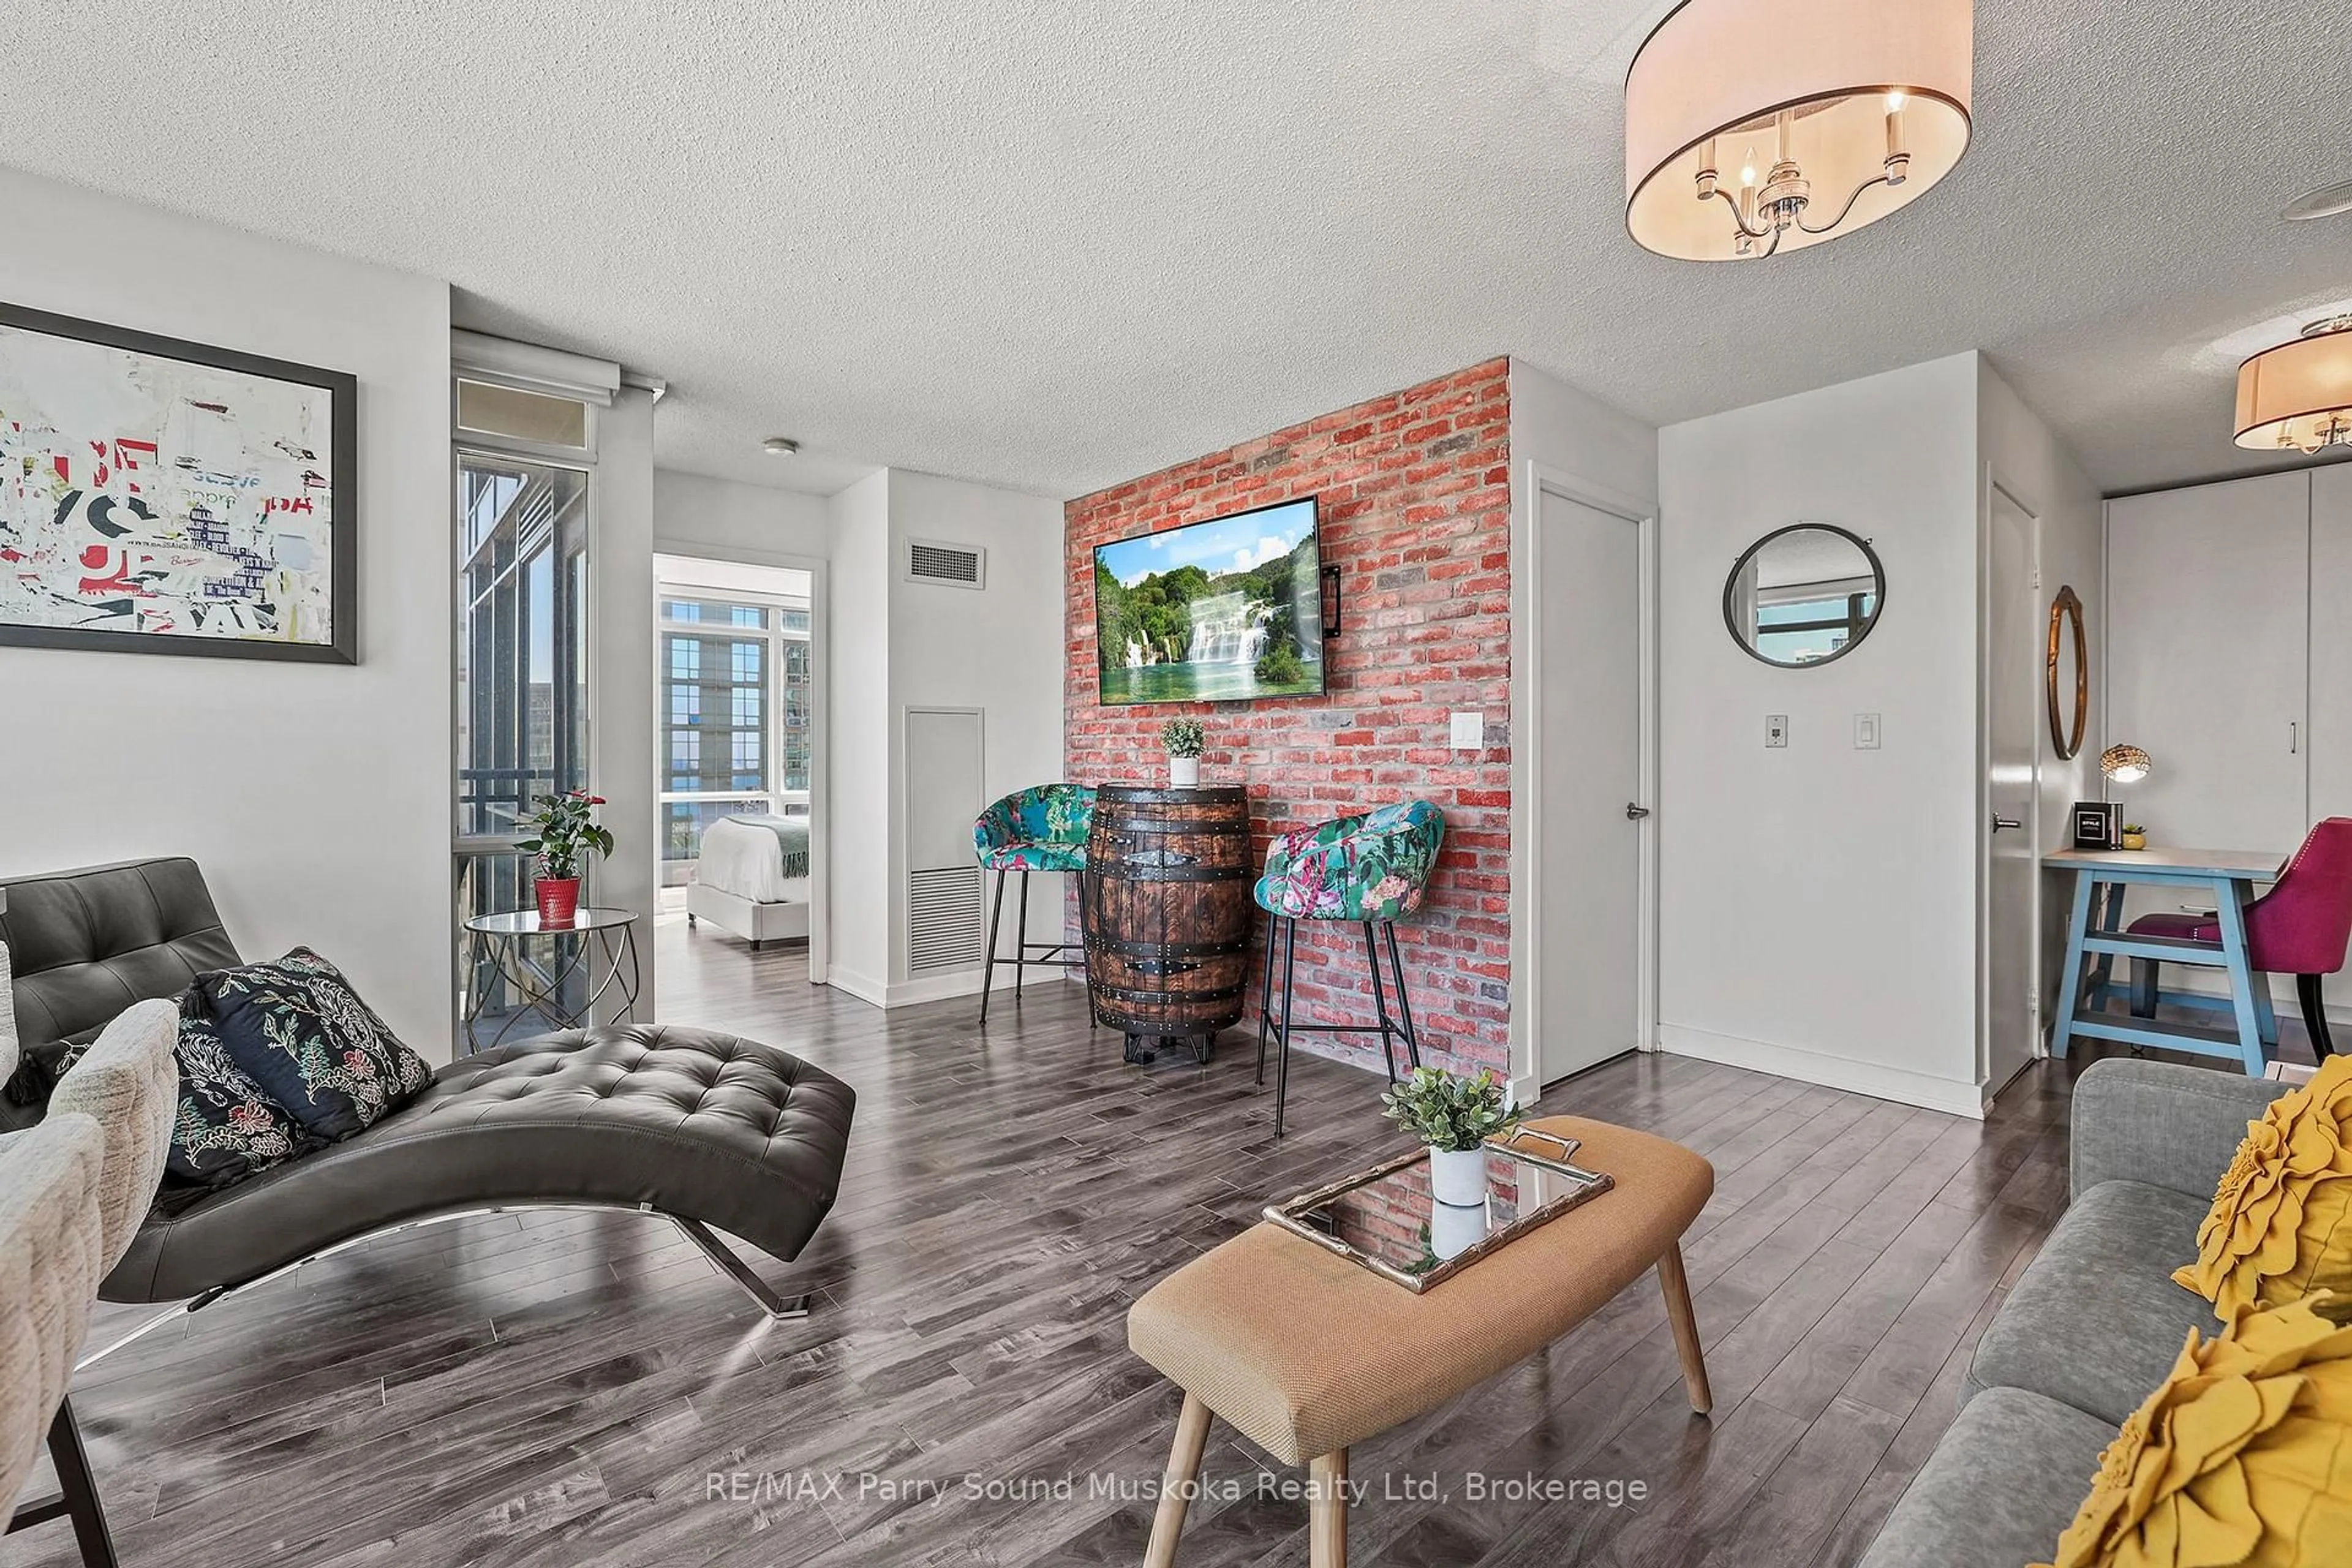
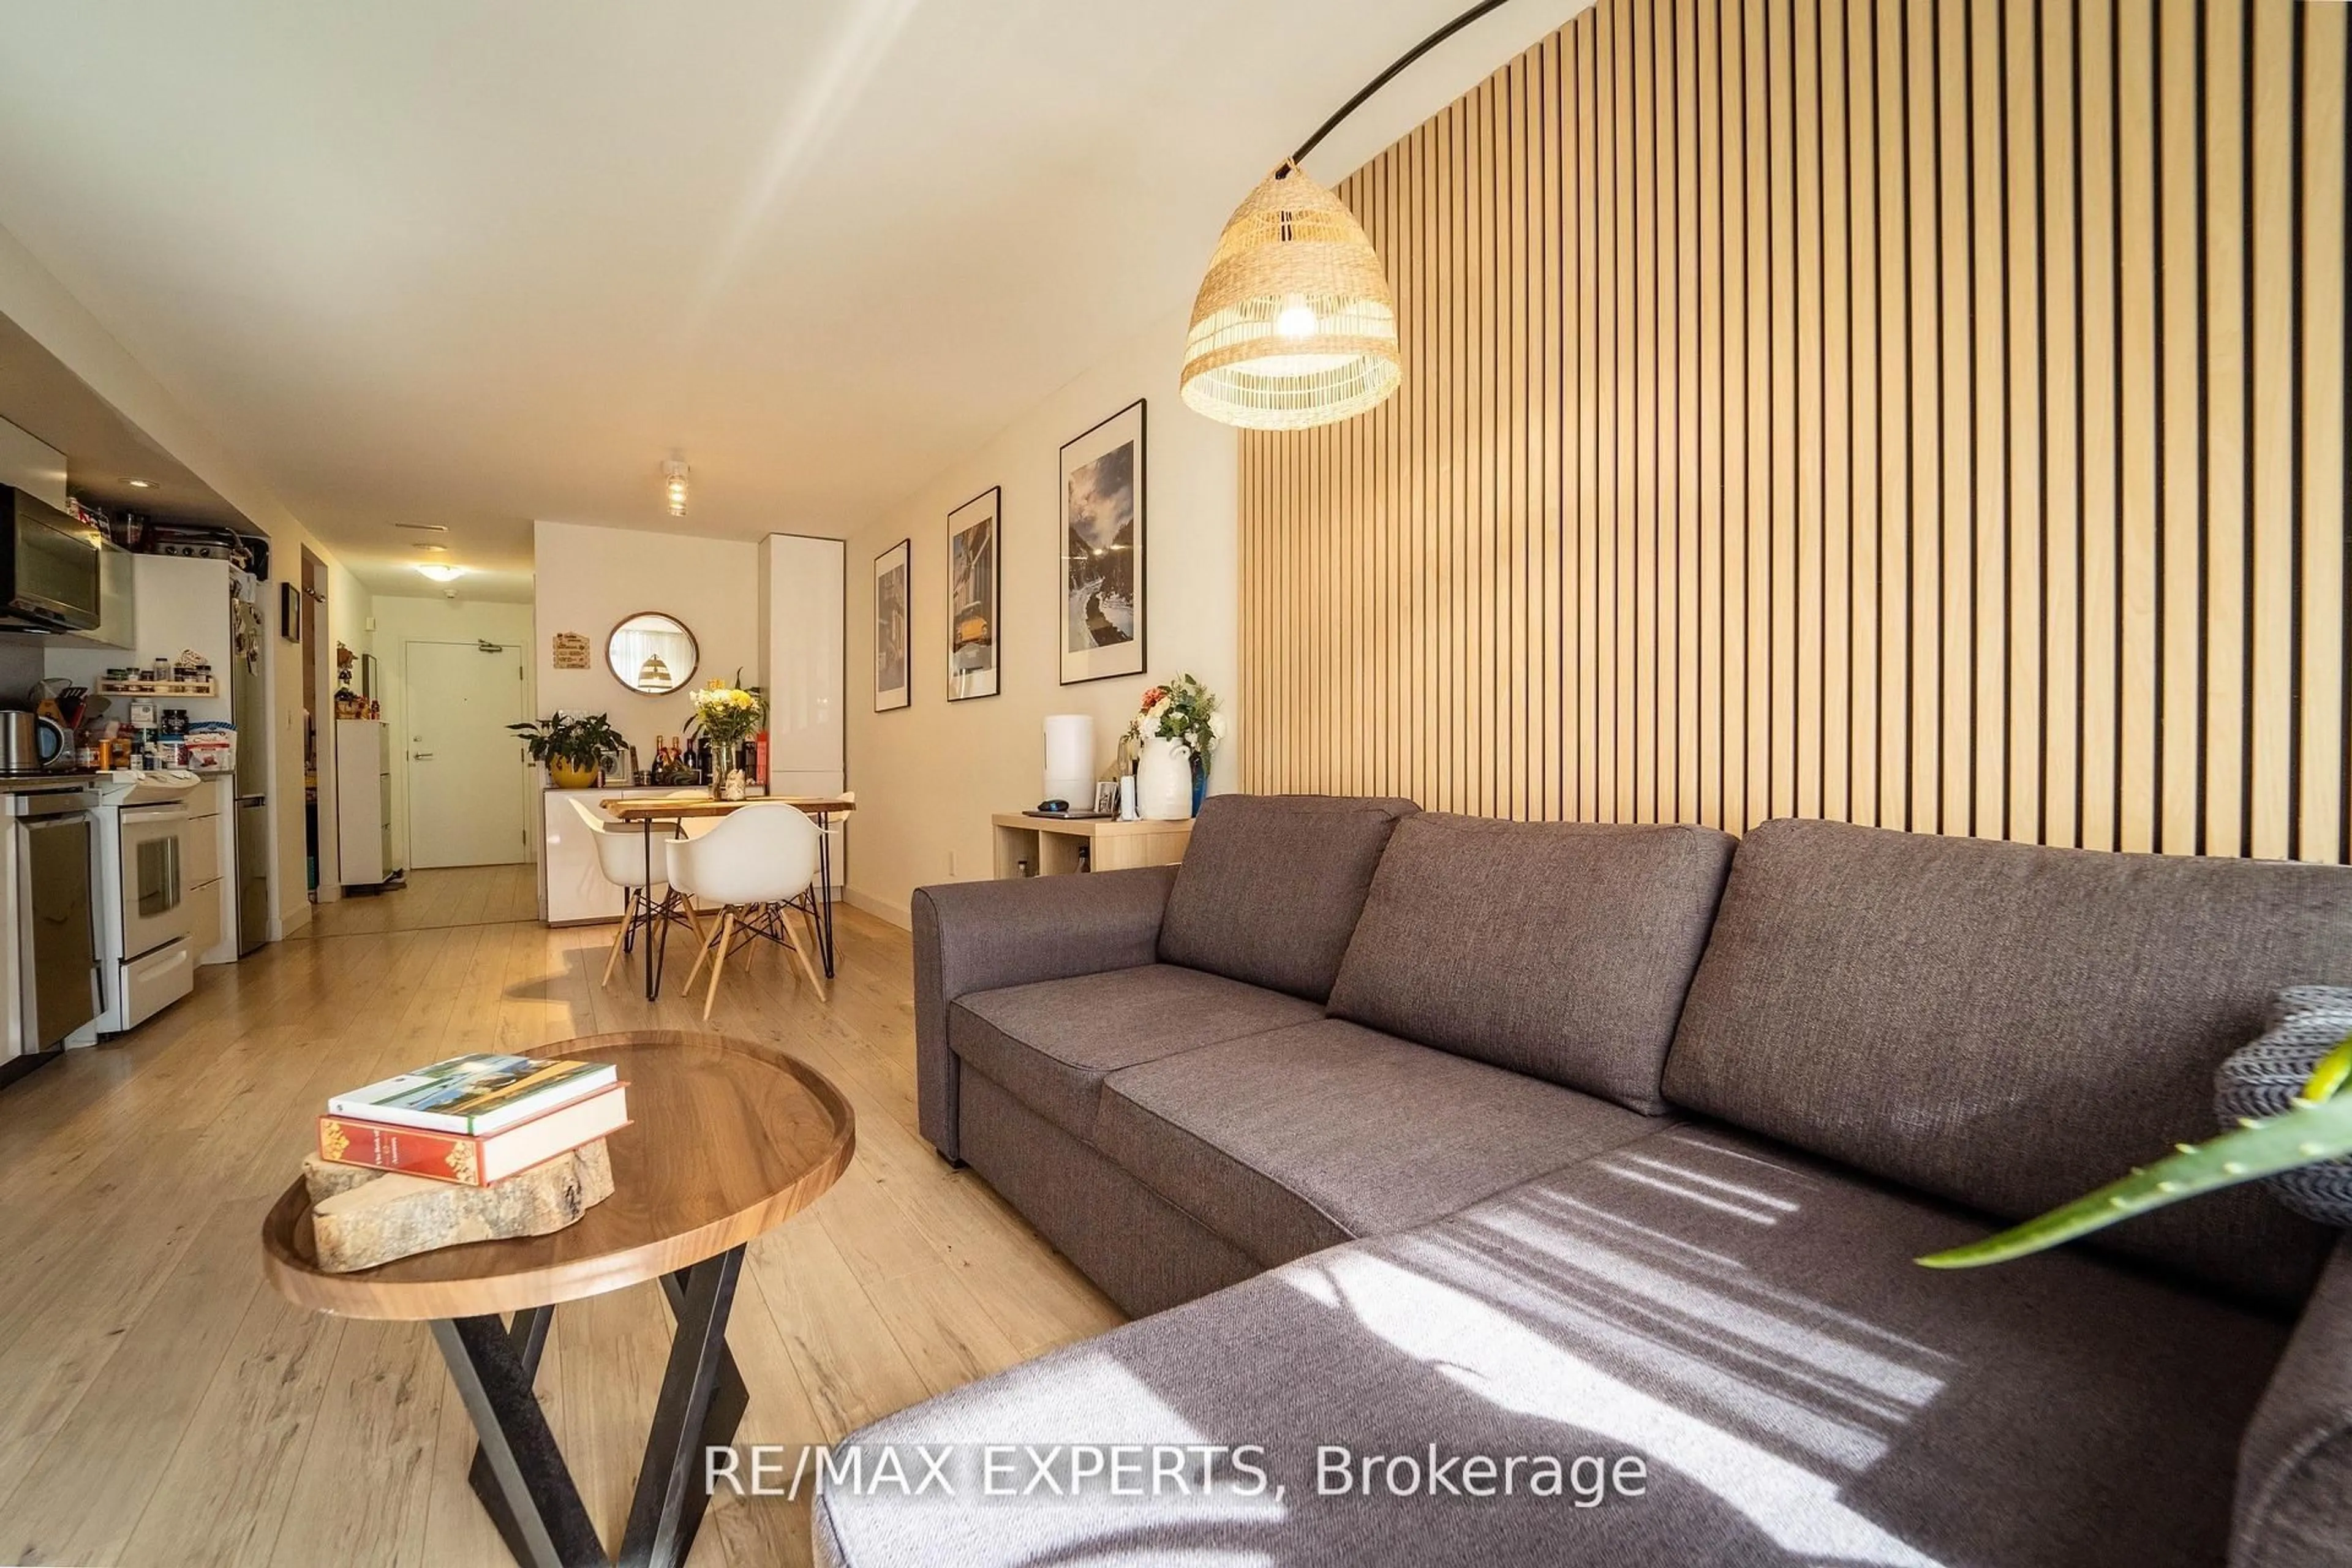
Stunning city view, CN Tower/Rogers Centre, Water view from balcony. 31st floor.1+1 corner unit will leave you breathless and wanting to move in immediately. Floor to ceiling windows with automatic zebra shades blinds. In suite laundry. Spacious living area. Built in storage closets. 1 parking space and 1 locker space. Games room, work stations, indoor pool, 27th floor hot tub room. Recently renovated gym. Pets welcome. Across from school, community centre, park and grocery store. Just a hop skip and a jump onto the highway or public transit.


Property Details

StyleMulti-Level
ViewWater, Downtown
Age of property-
SqFt~600-699 SqFt
Lot Size-
Parking Spaces1
MLS ®NumberC12435208
Community NameCityplace
Data SourceTRREB
Listing byRE/MAX Parry Sound Muskoka Realty Ltd

Features

Heating: Forced Air
Cooling: Central Air

Features

Patio: Open
Balcony: Open

Parking

Garage spaces 1

Garage type Underground

Other parking spaces 0

Total parking spaces 1


Inclusions
Hydro
Water
Parking
Cable
Heat

Property History

Sep 30, 2025
ListedActive
$899,000
43 days on market
history photo preview29
Listing by trreb®

Market Data - Cityplace

Geo Zone Map ThumbnailCityplace

Strong Buyer's Market

View Market Data

Condo - for the past 30 days

Buyer's market Seller's market

Avg. Days on Market

Past 30 days

25 days

Compared to

2024

22 days

2023

18 days

2022

21 days

New Listings

Past 30 days

56 listings

Compared to

2024

88 listings

2023

93 listings

2022

55 listings

Units sold

Past 30 days

20 units

Compared to

2024

31 units

2023

22 units

2022

22 units

Median Sold Price

Past 30 days

$675,756

Compared to

2024

$665,000

2023

$658,800

2022

$737,866


Population and Demographics

Overview

Total population 6275
Average household income $142,715

Age (%)

0 to 19
9%
20 to 34
54%
35 to 49
24%
50 to 64
8%
65 and plus
5%

Household composition (%)

Single person
49%
Single family
38%
Multi person
13%
Multi family
0%

Mother tongue (%)

English
60%
Mandarin
9%
Yue (Cantonese)
5%
Spanish
4%
Hindi
4%
French
3%
Arabic
3%
Russian
2%
Iranian Persian
2%
Others
0%

House tenancy (%)

Renters
59%
Owners
41%

What’s nearby?Essentials within 5 km

Local Logic

Transportation Scores

Estimated Budget