20 days on Market
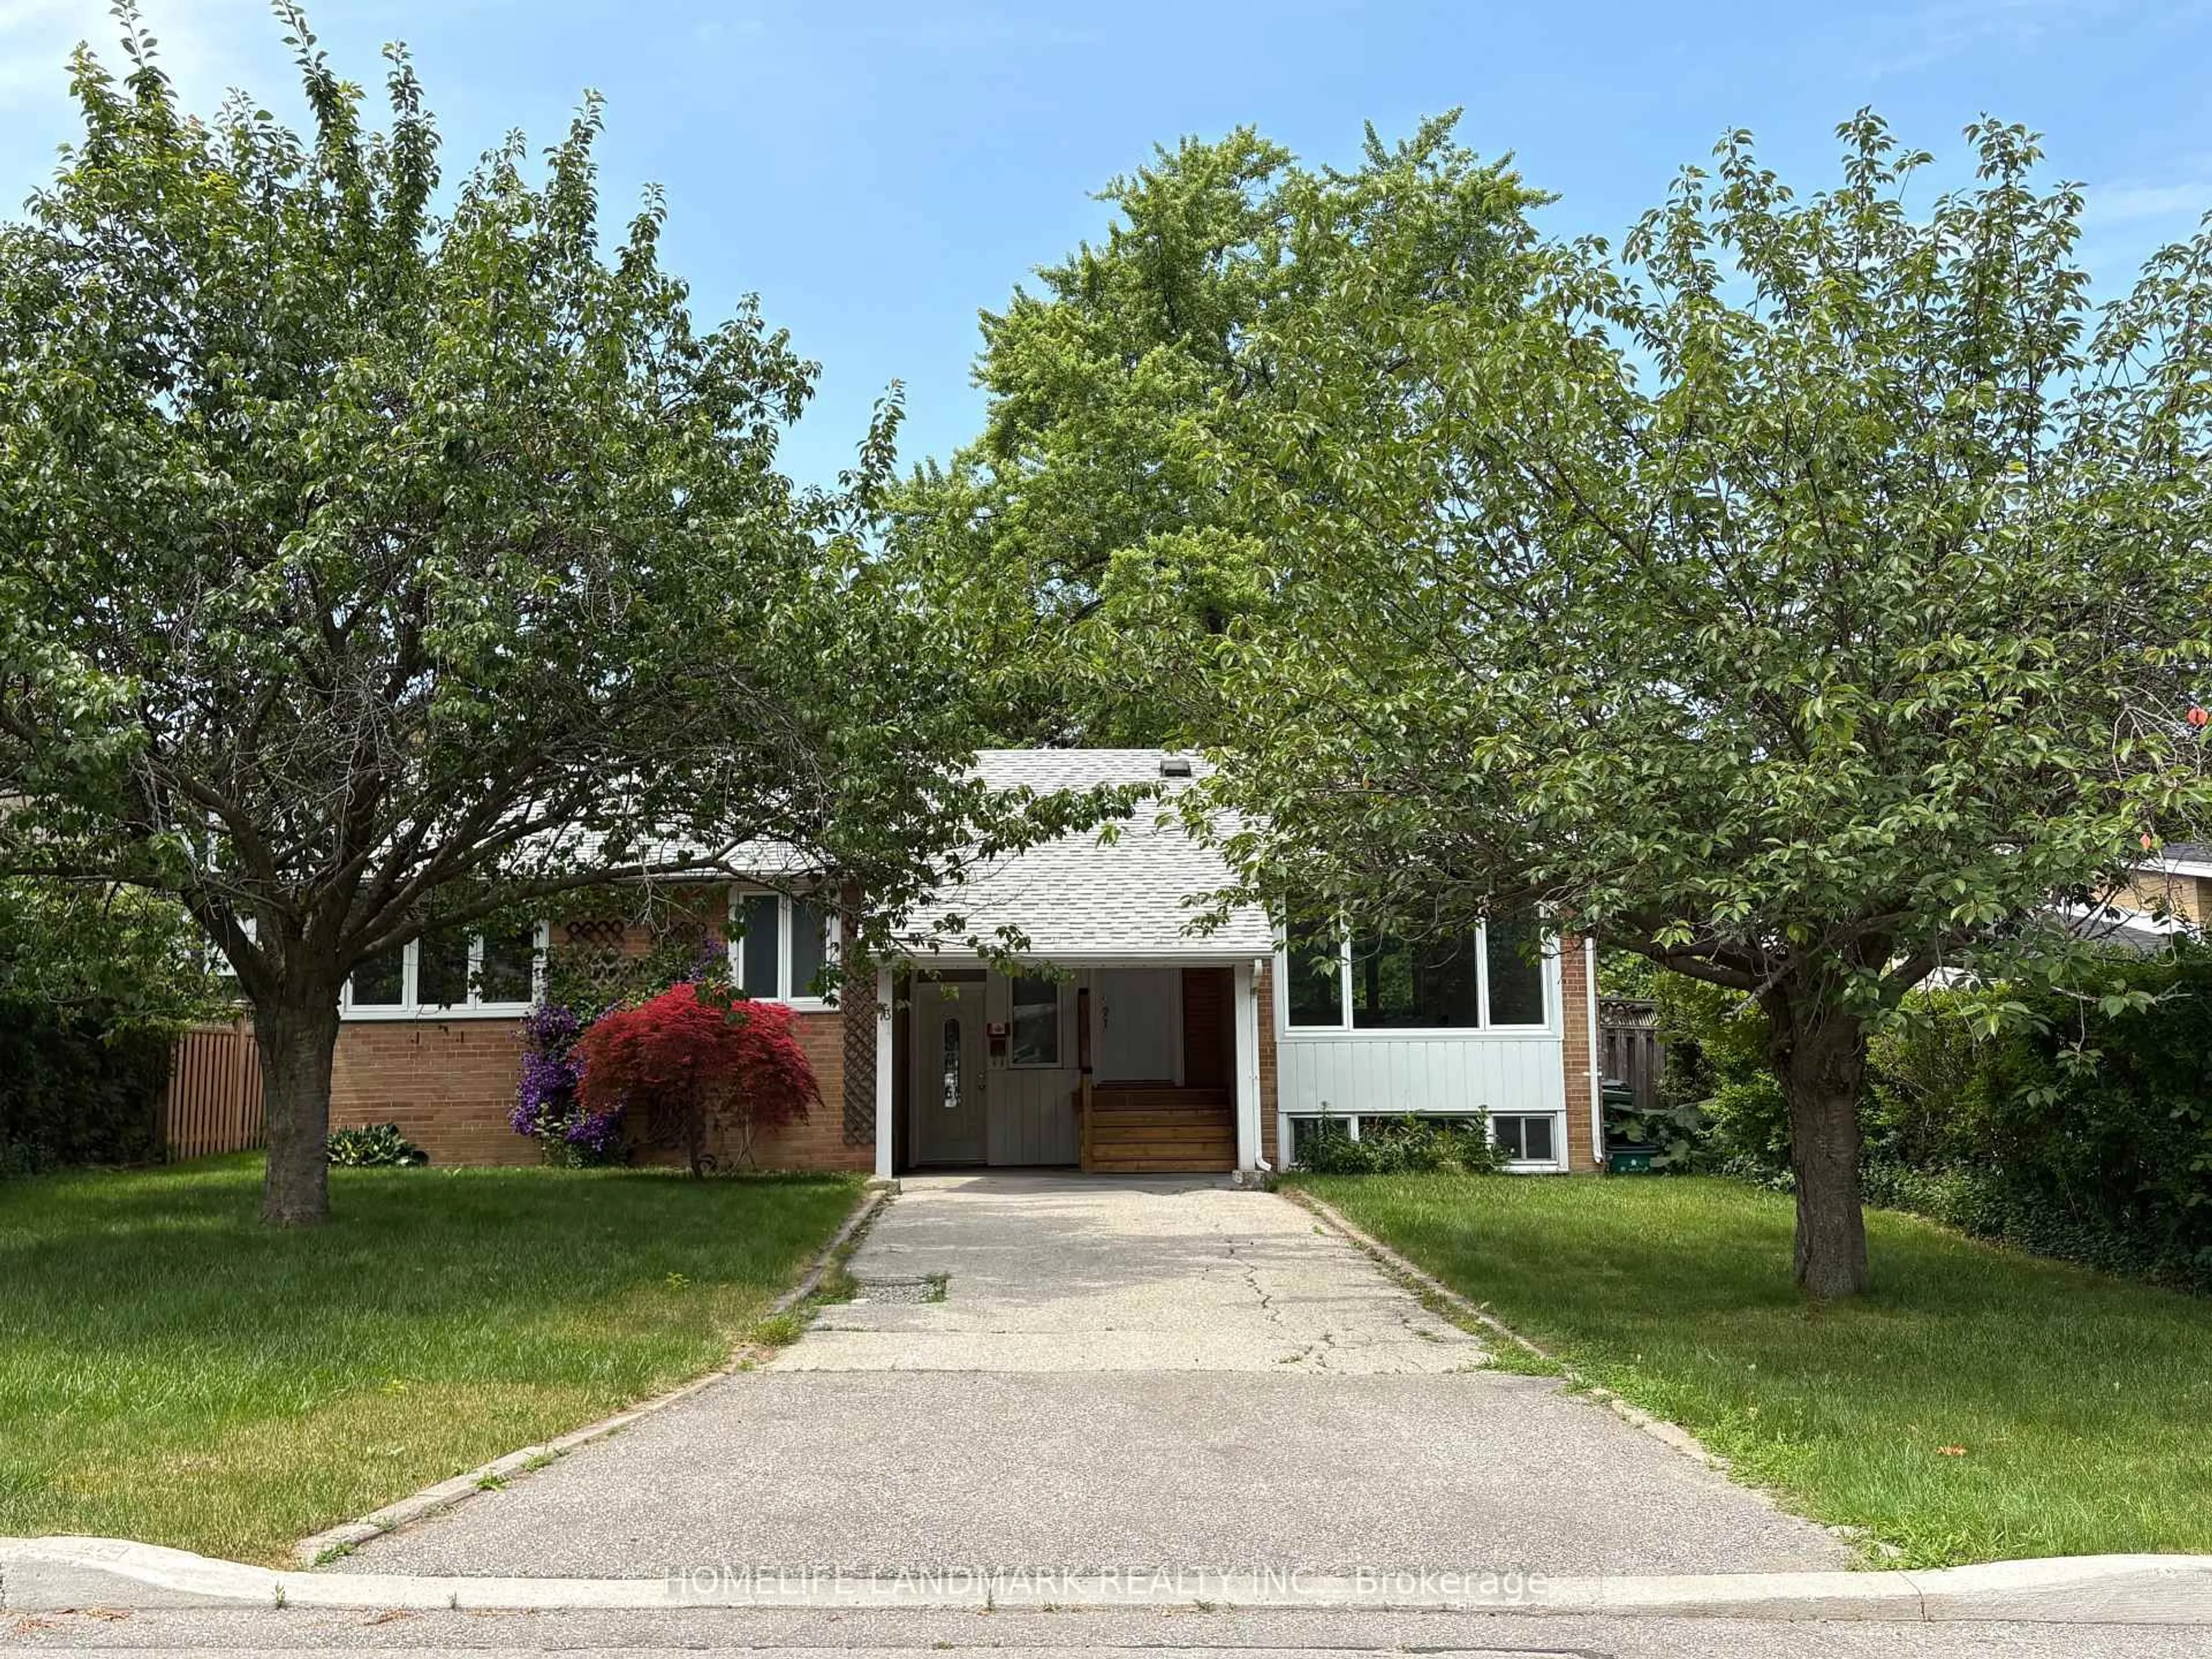
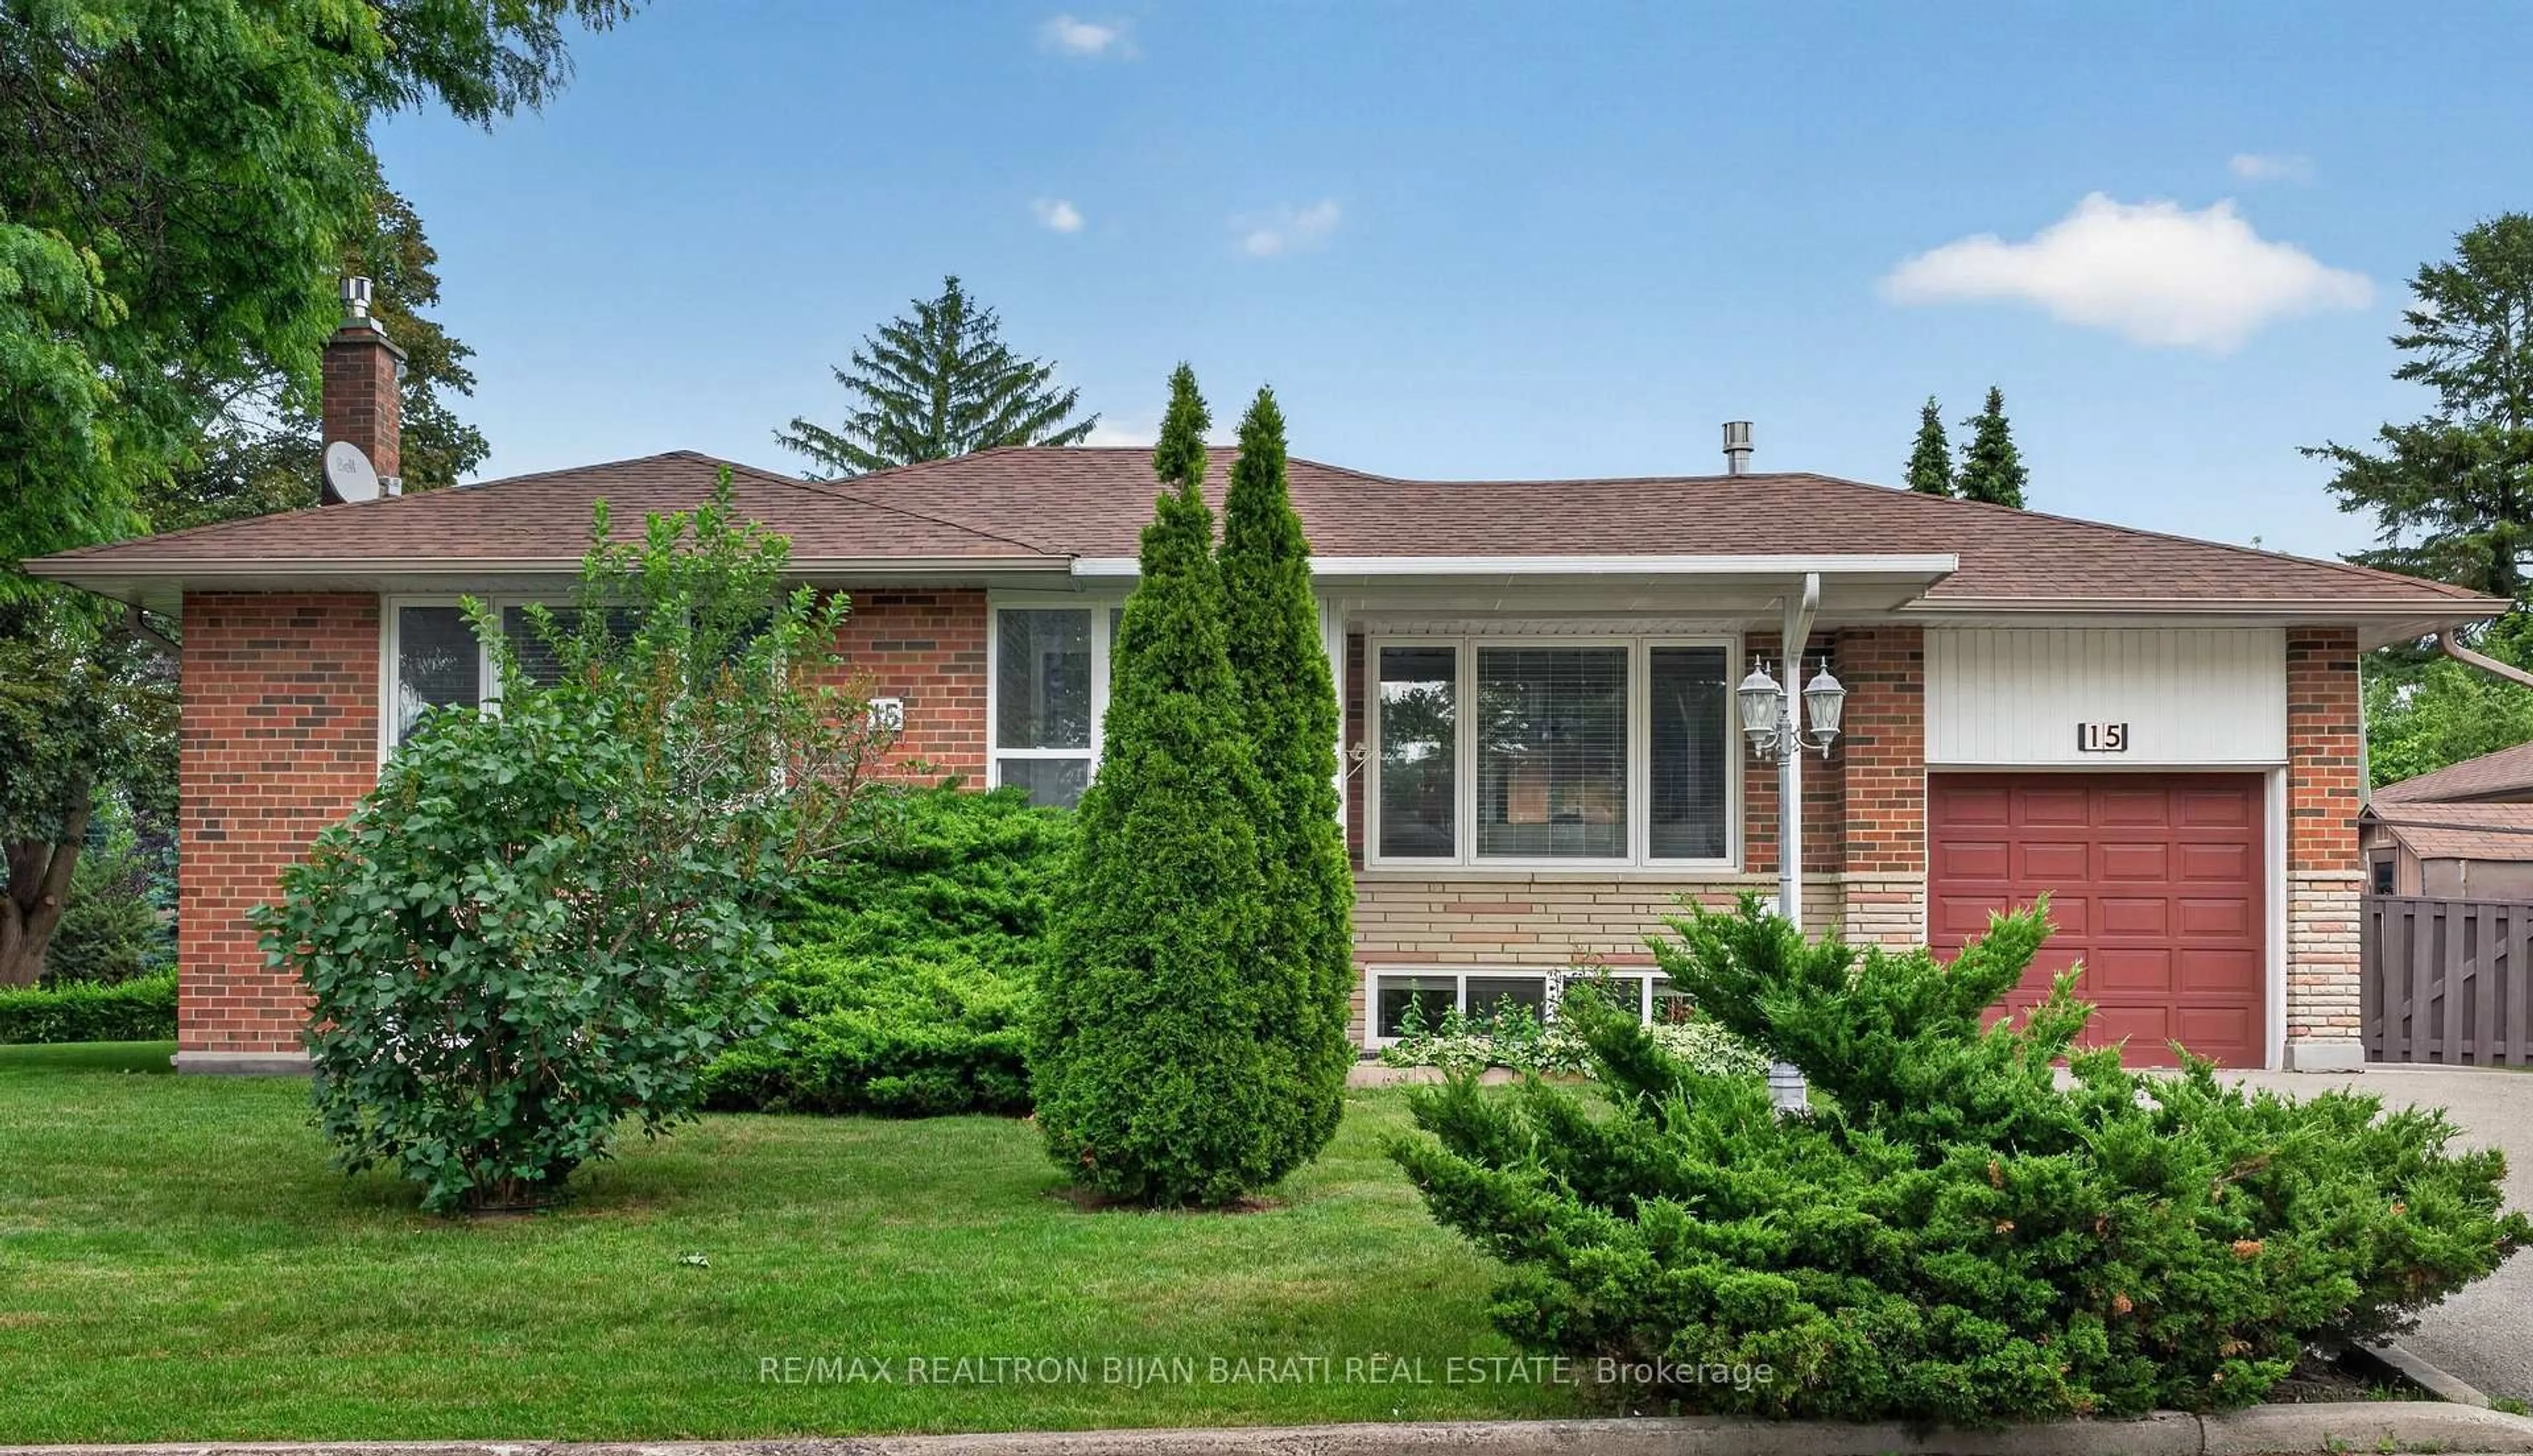
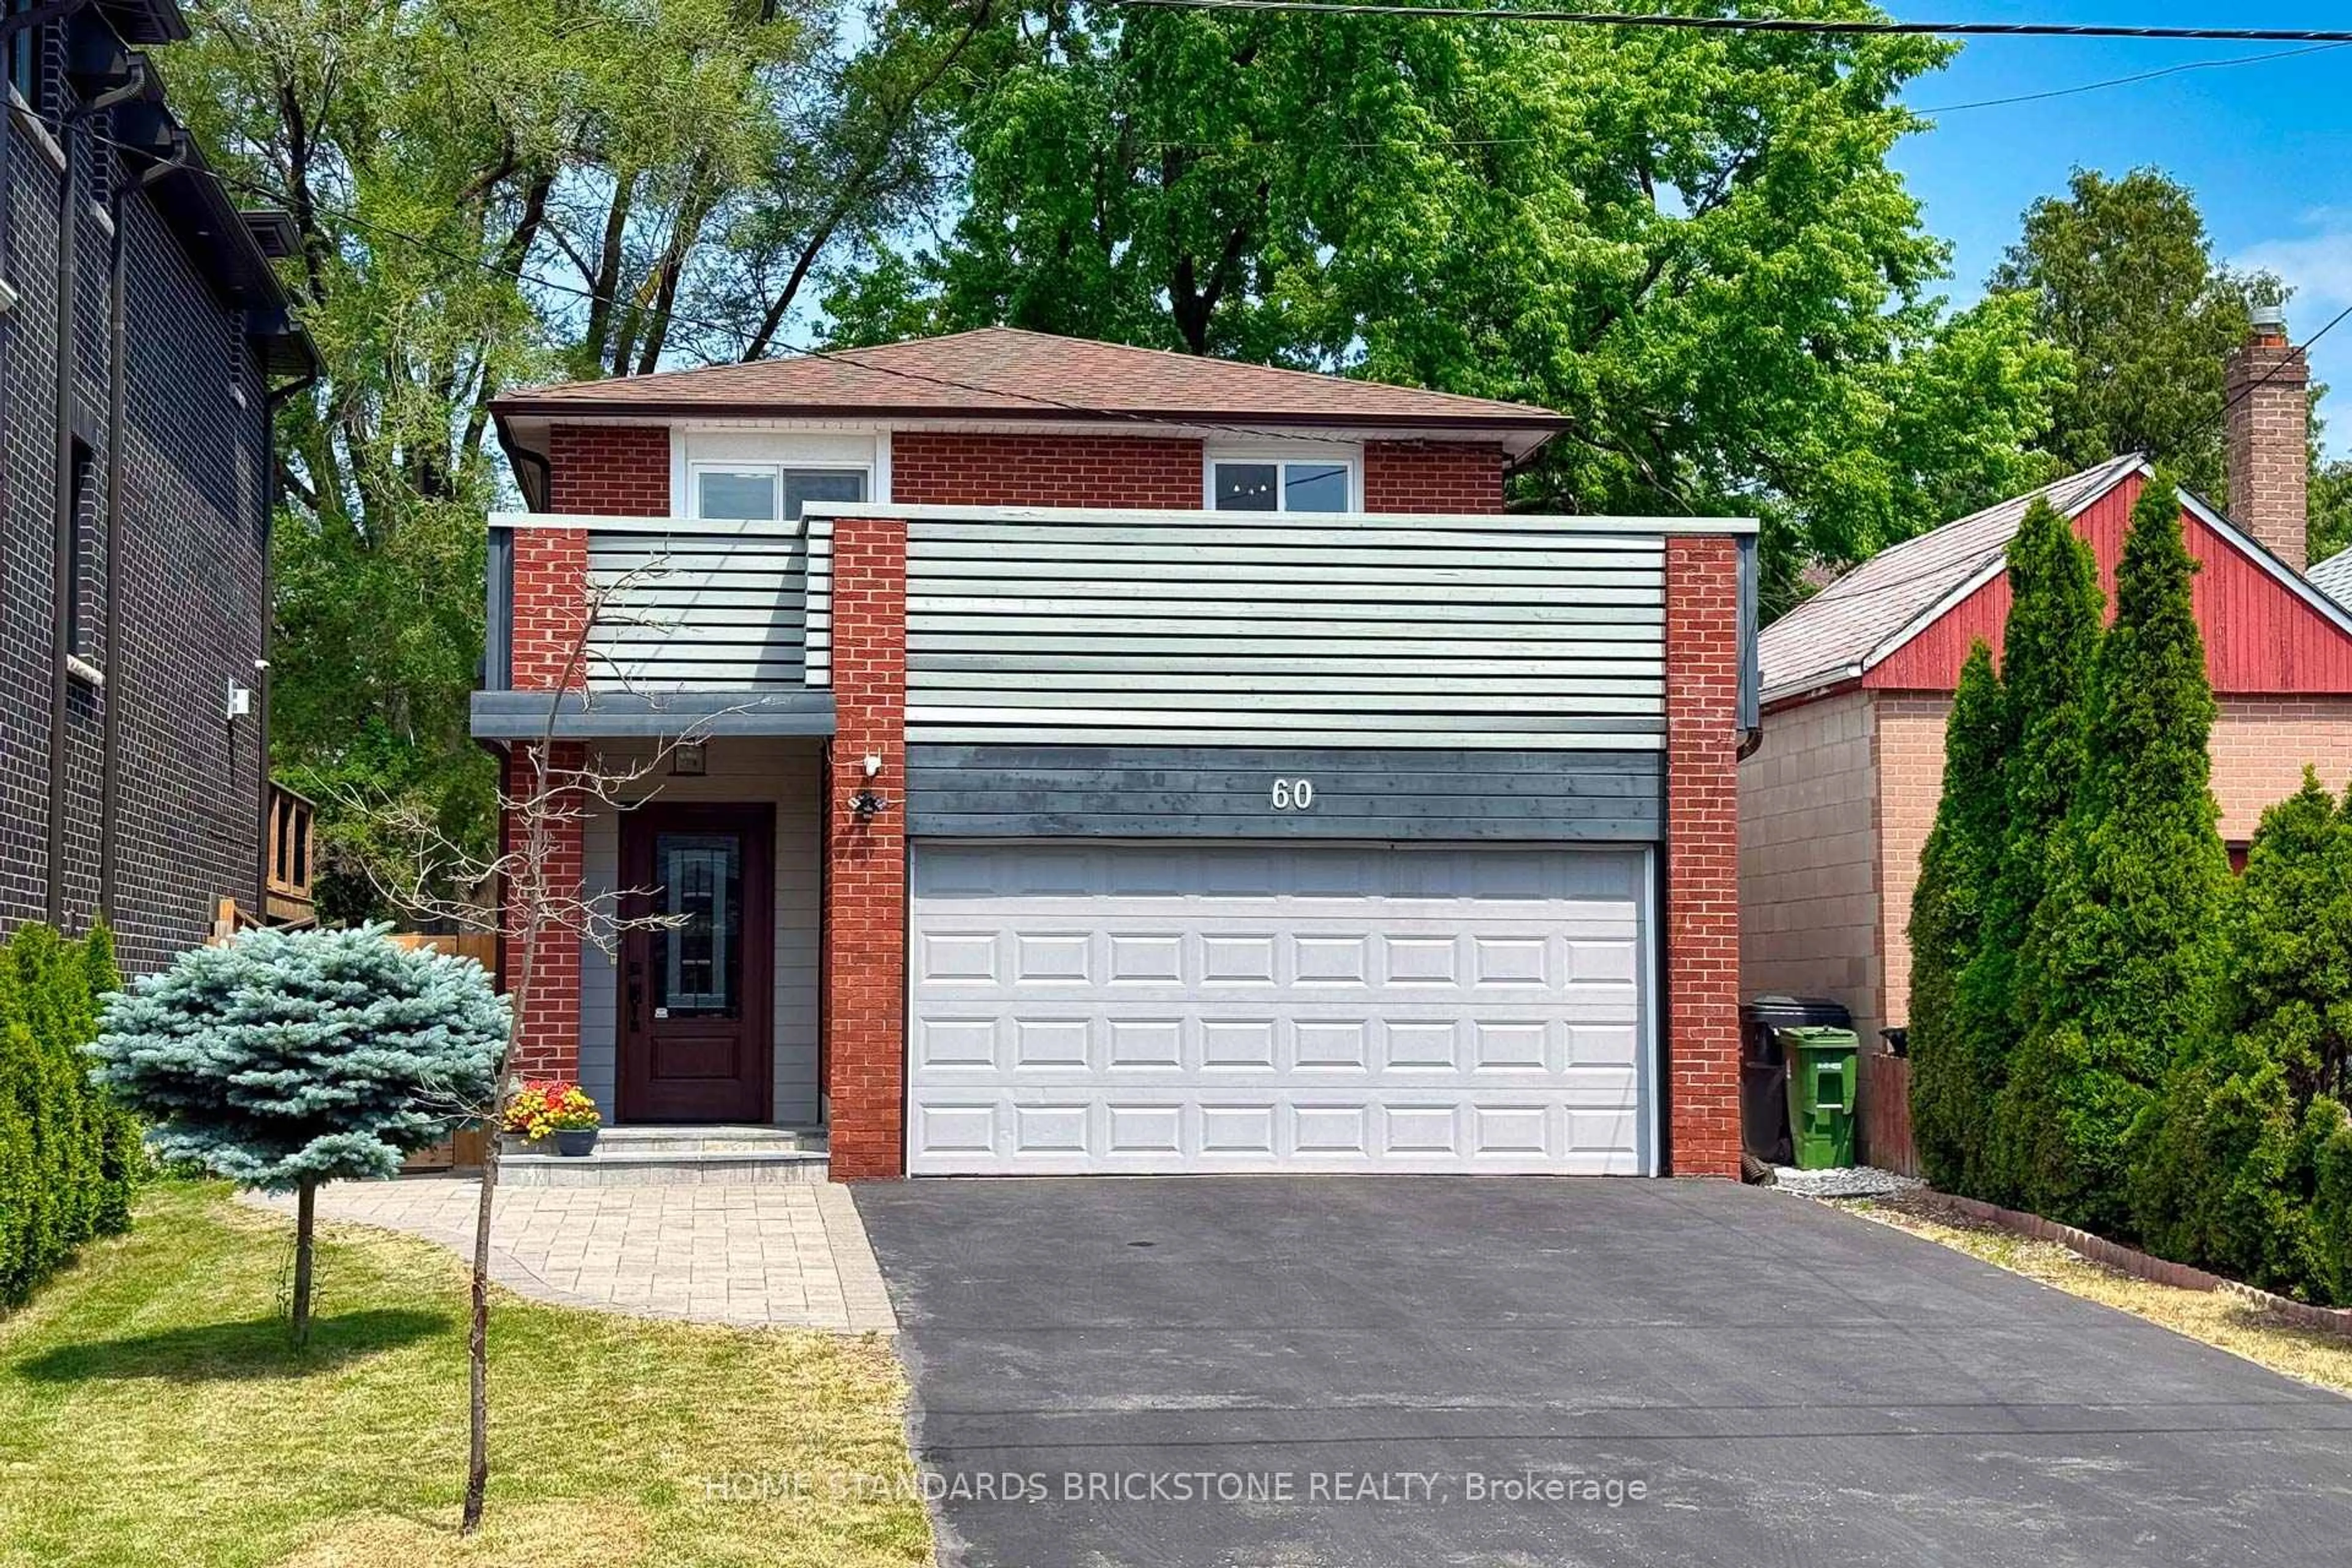
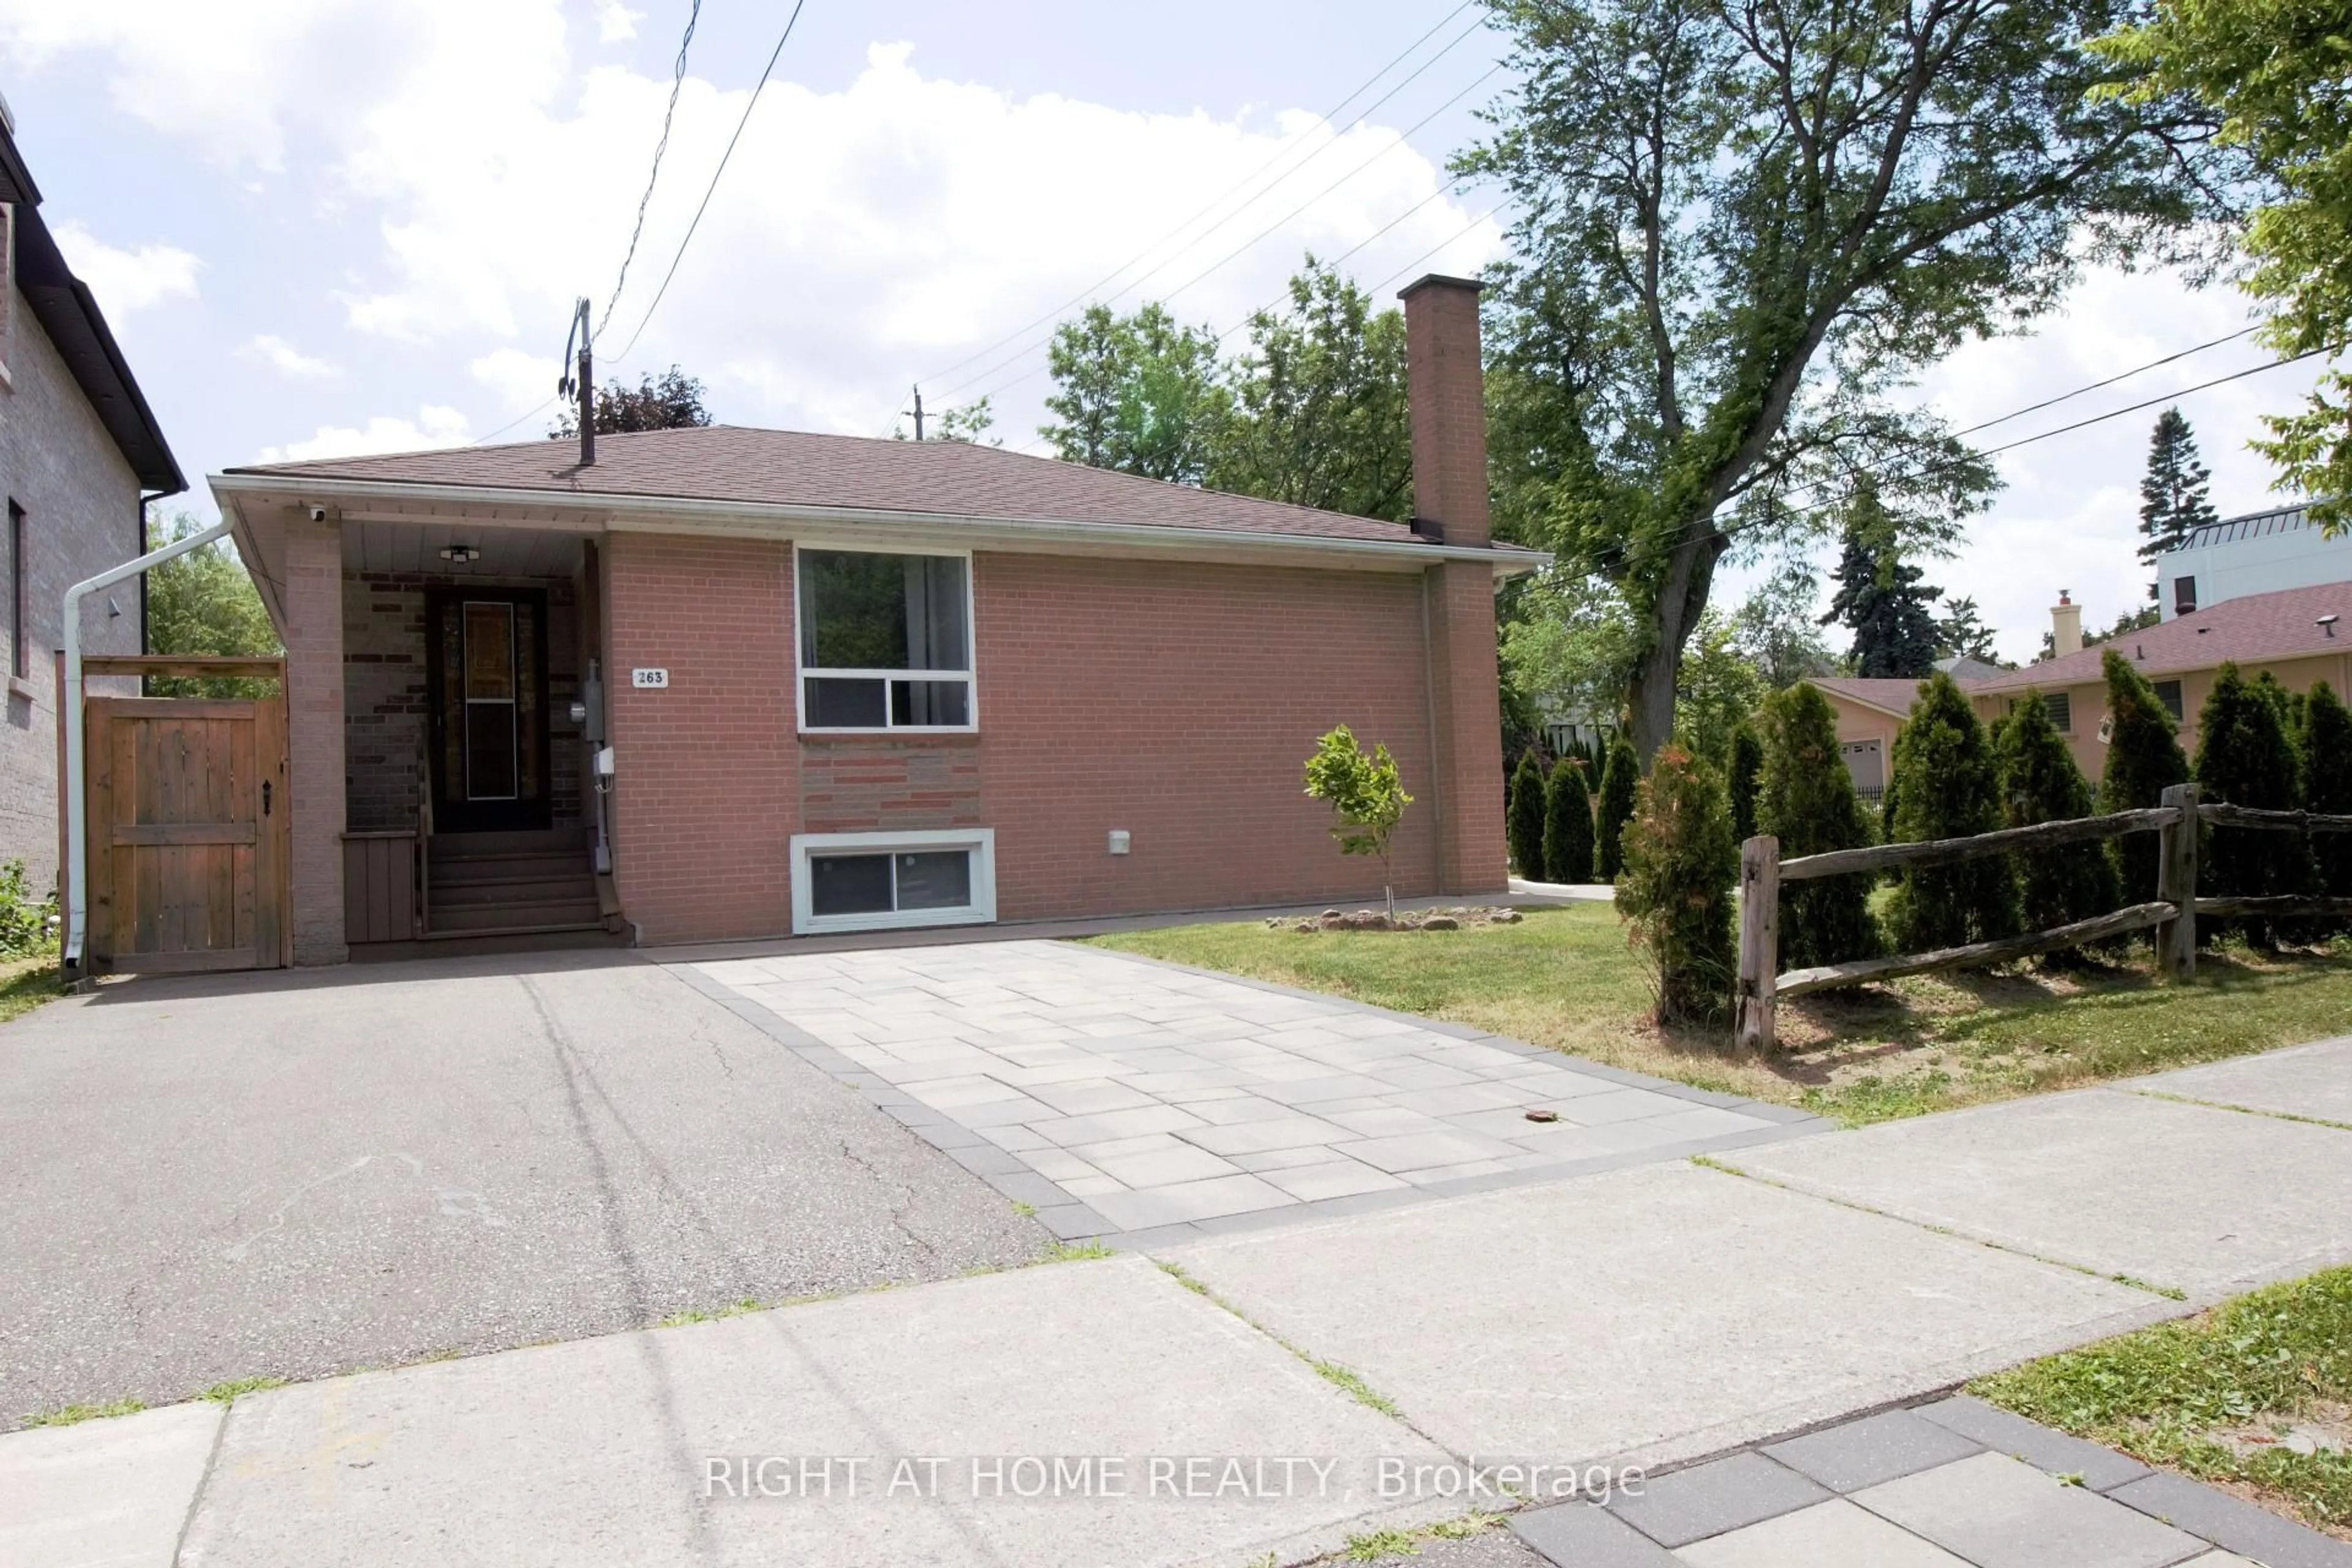
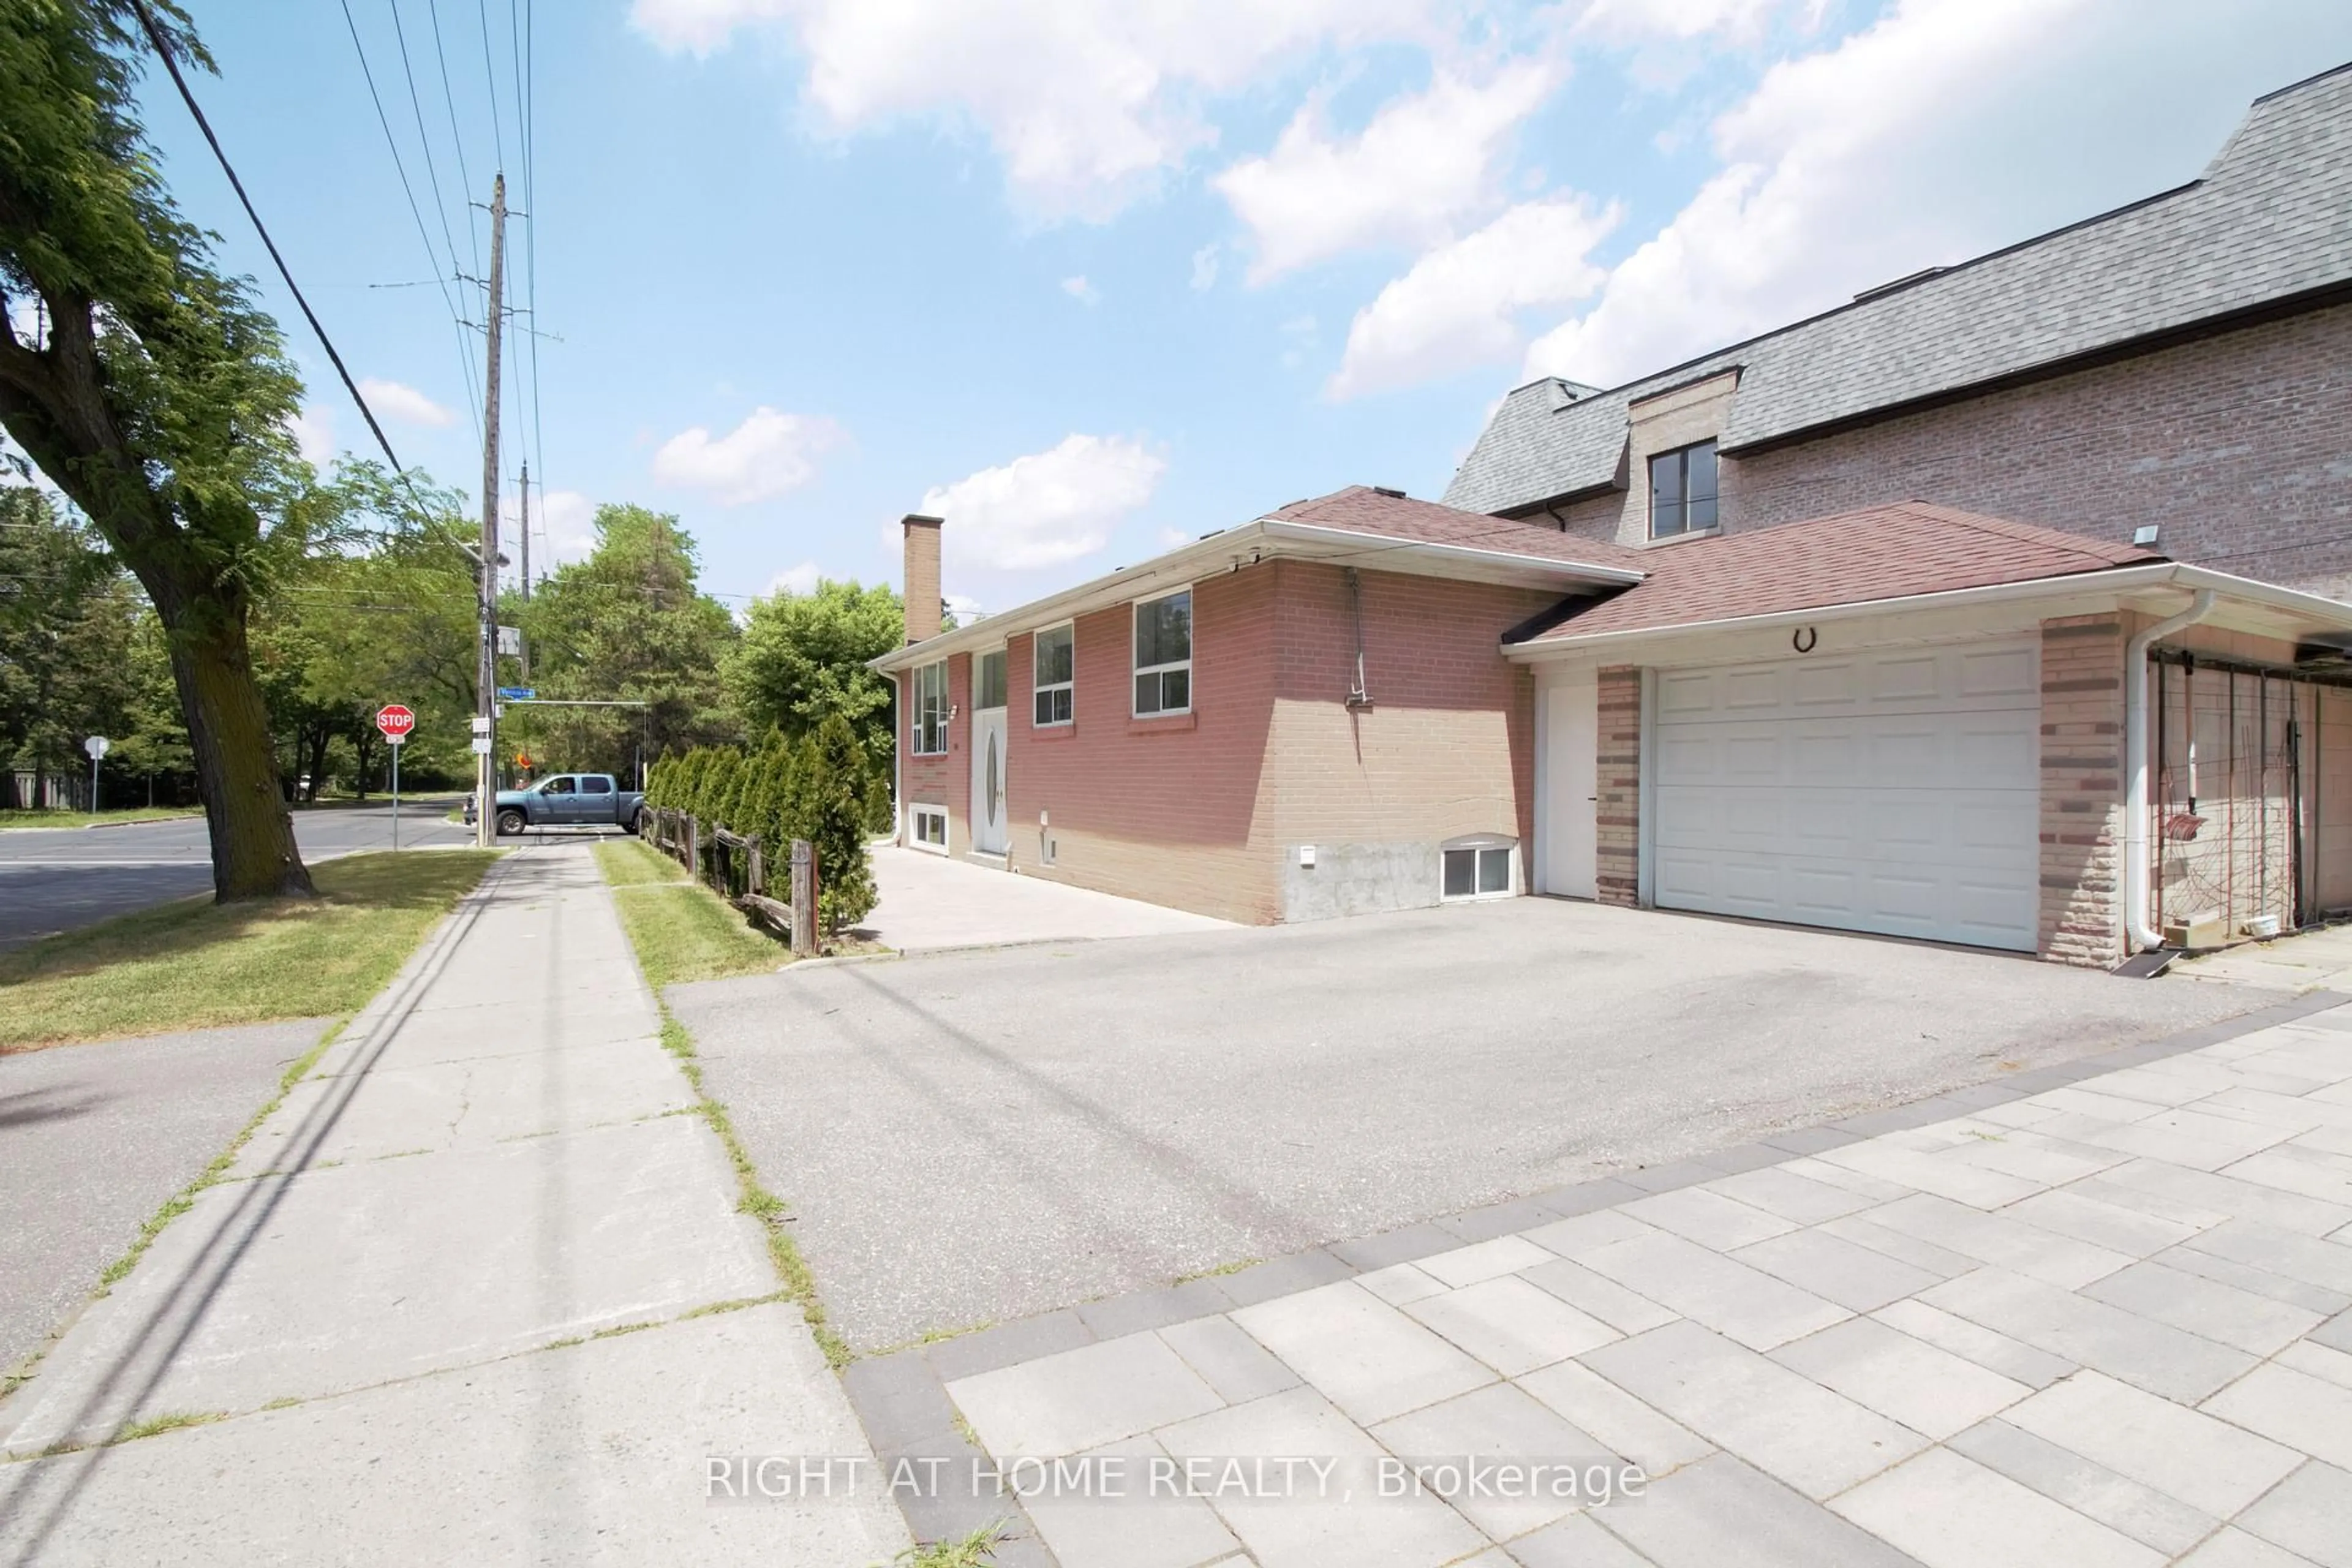
263 Patricia Ave, Toronto, Ontario M2M 1J7
Detached
3 + 4
2
~1100-1500 sqft
$1,338,900
Get pre-qualifiedPowered by nesto
Detached
3 + 4
2
~1100-1500 sqft
Contact us about this property
Highlights
Days on market20 days
Estimated valueThis is the price Wahi expects this property to sell for.
The calculation is powered by our Instant Home Value Estimate, which uses current market and property price trends to estimate your home’s value with a 90% accuracy rate.Not available
Price/Sqft$1,055/sqft
Monthly cost
Open Calculator
Description
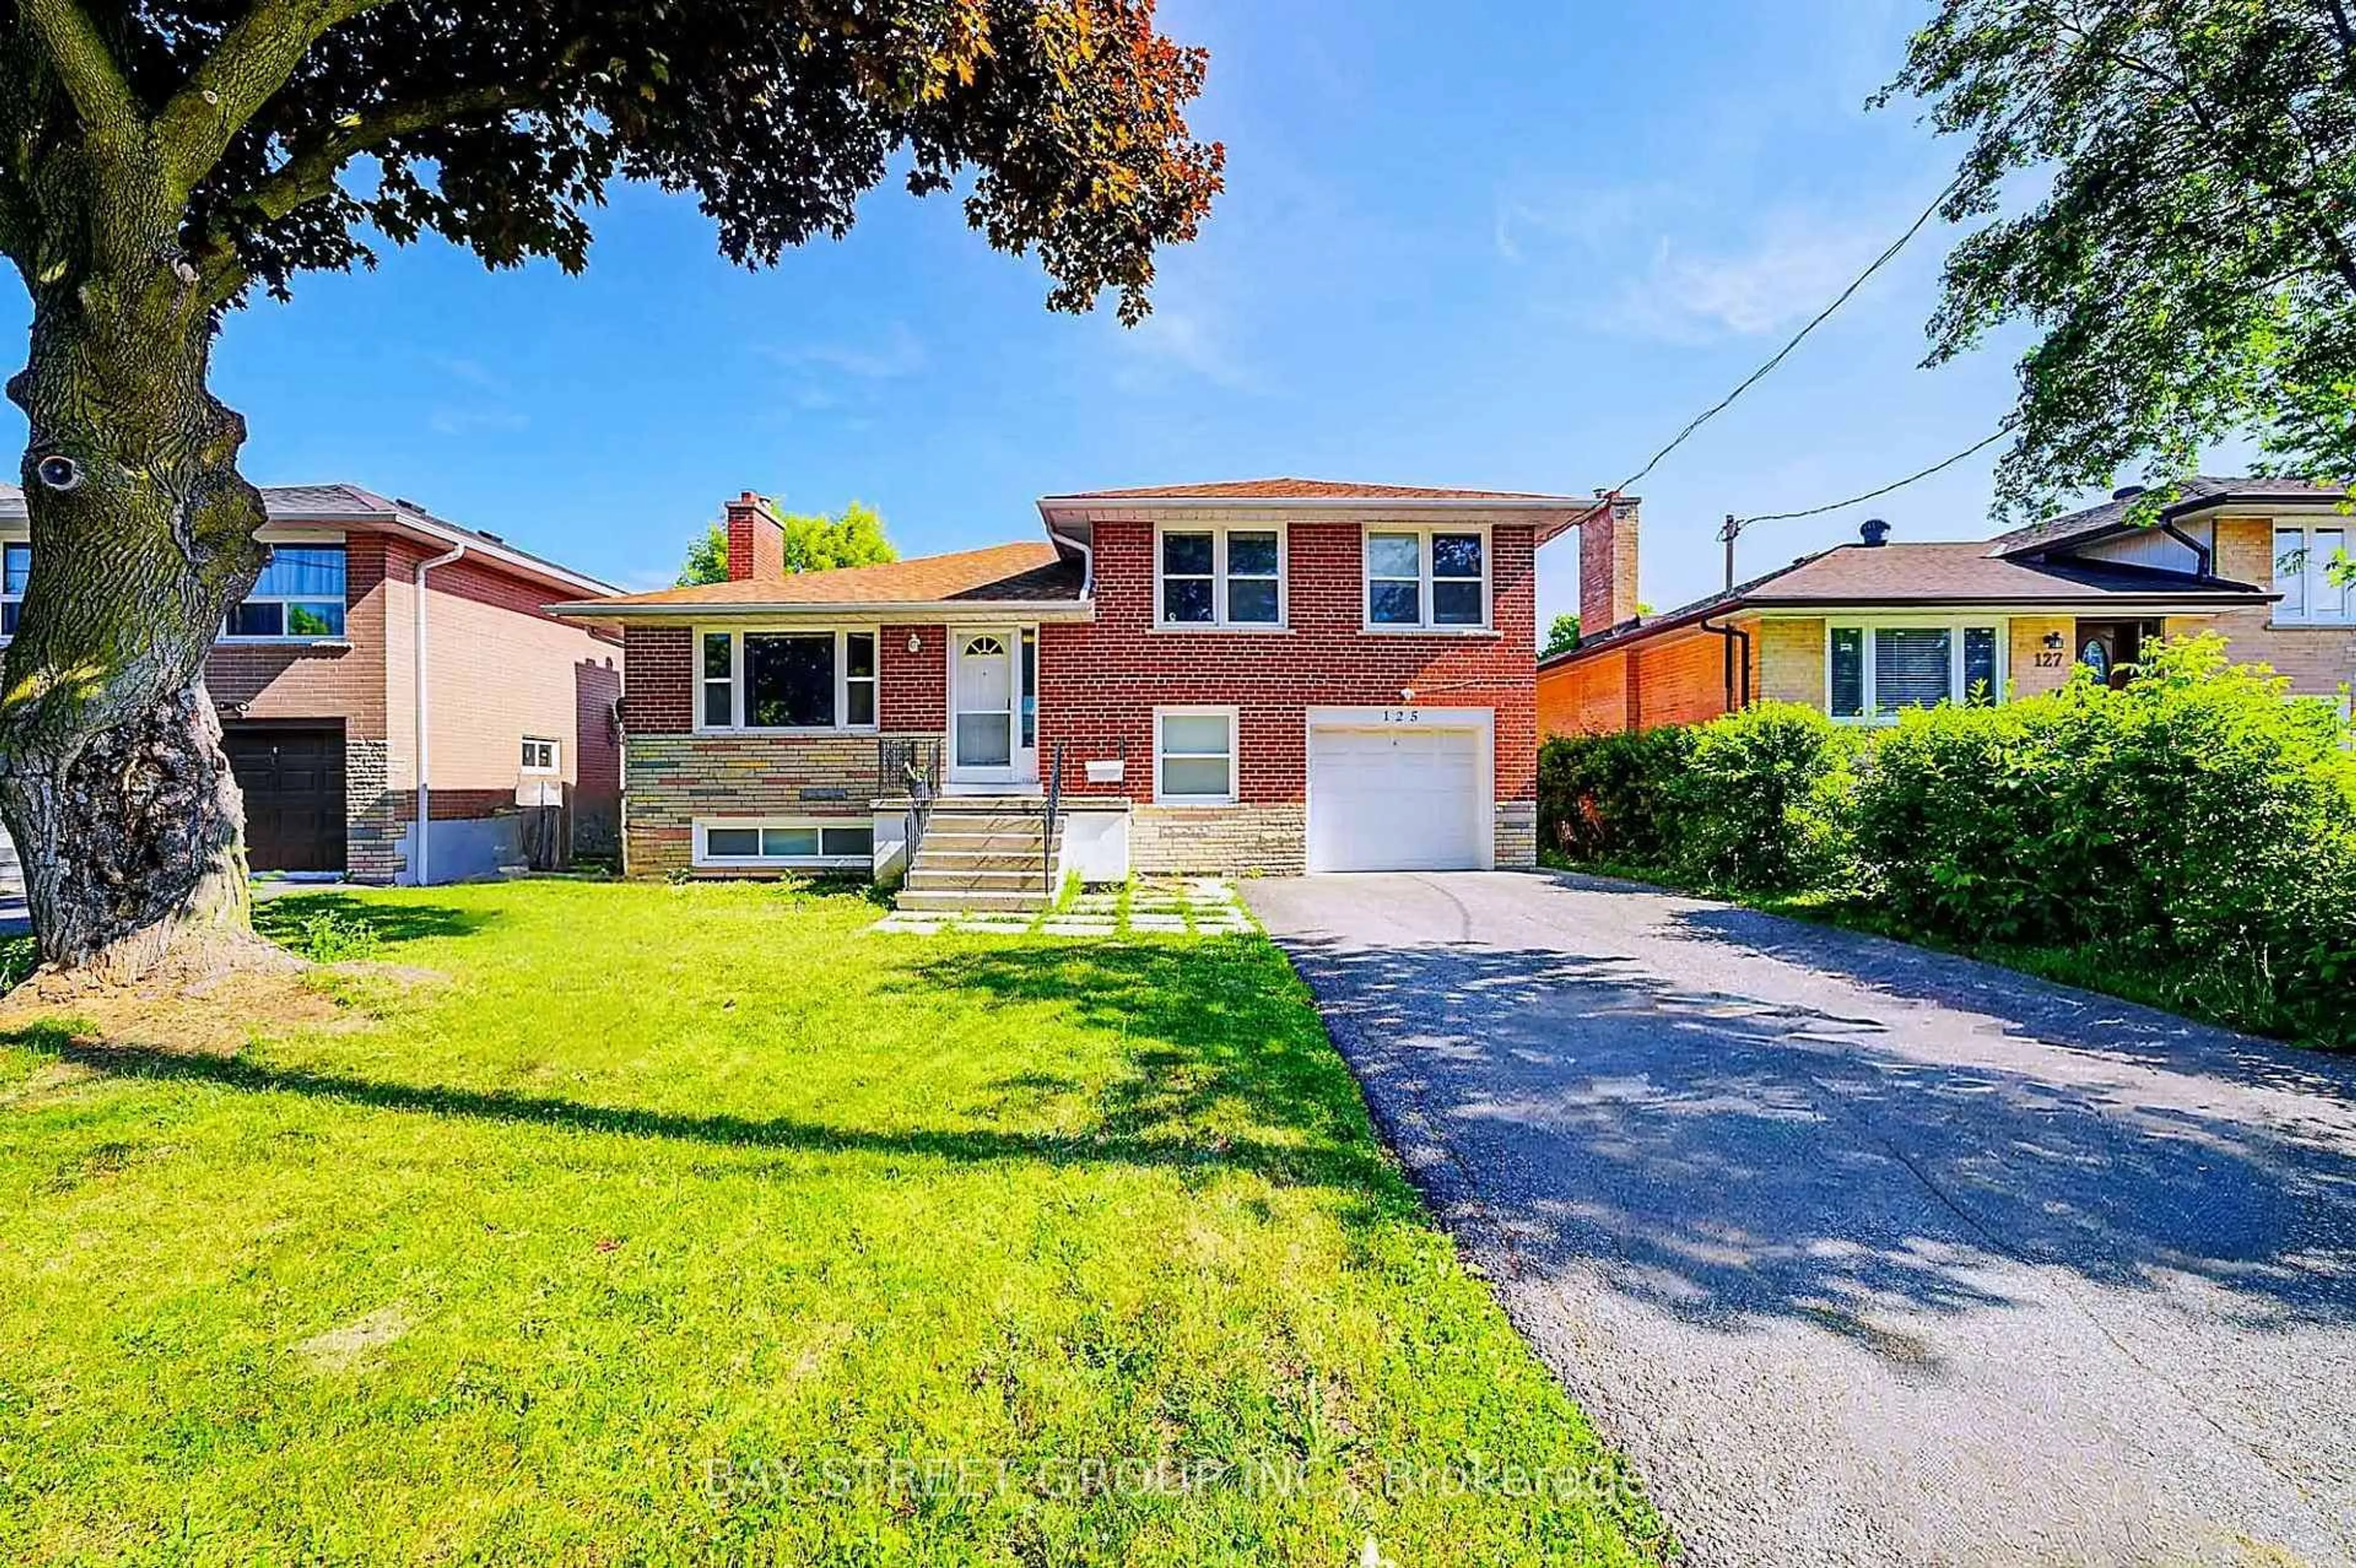
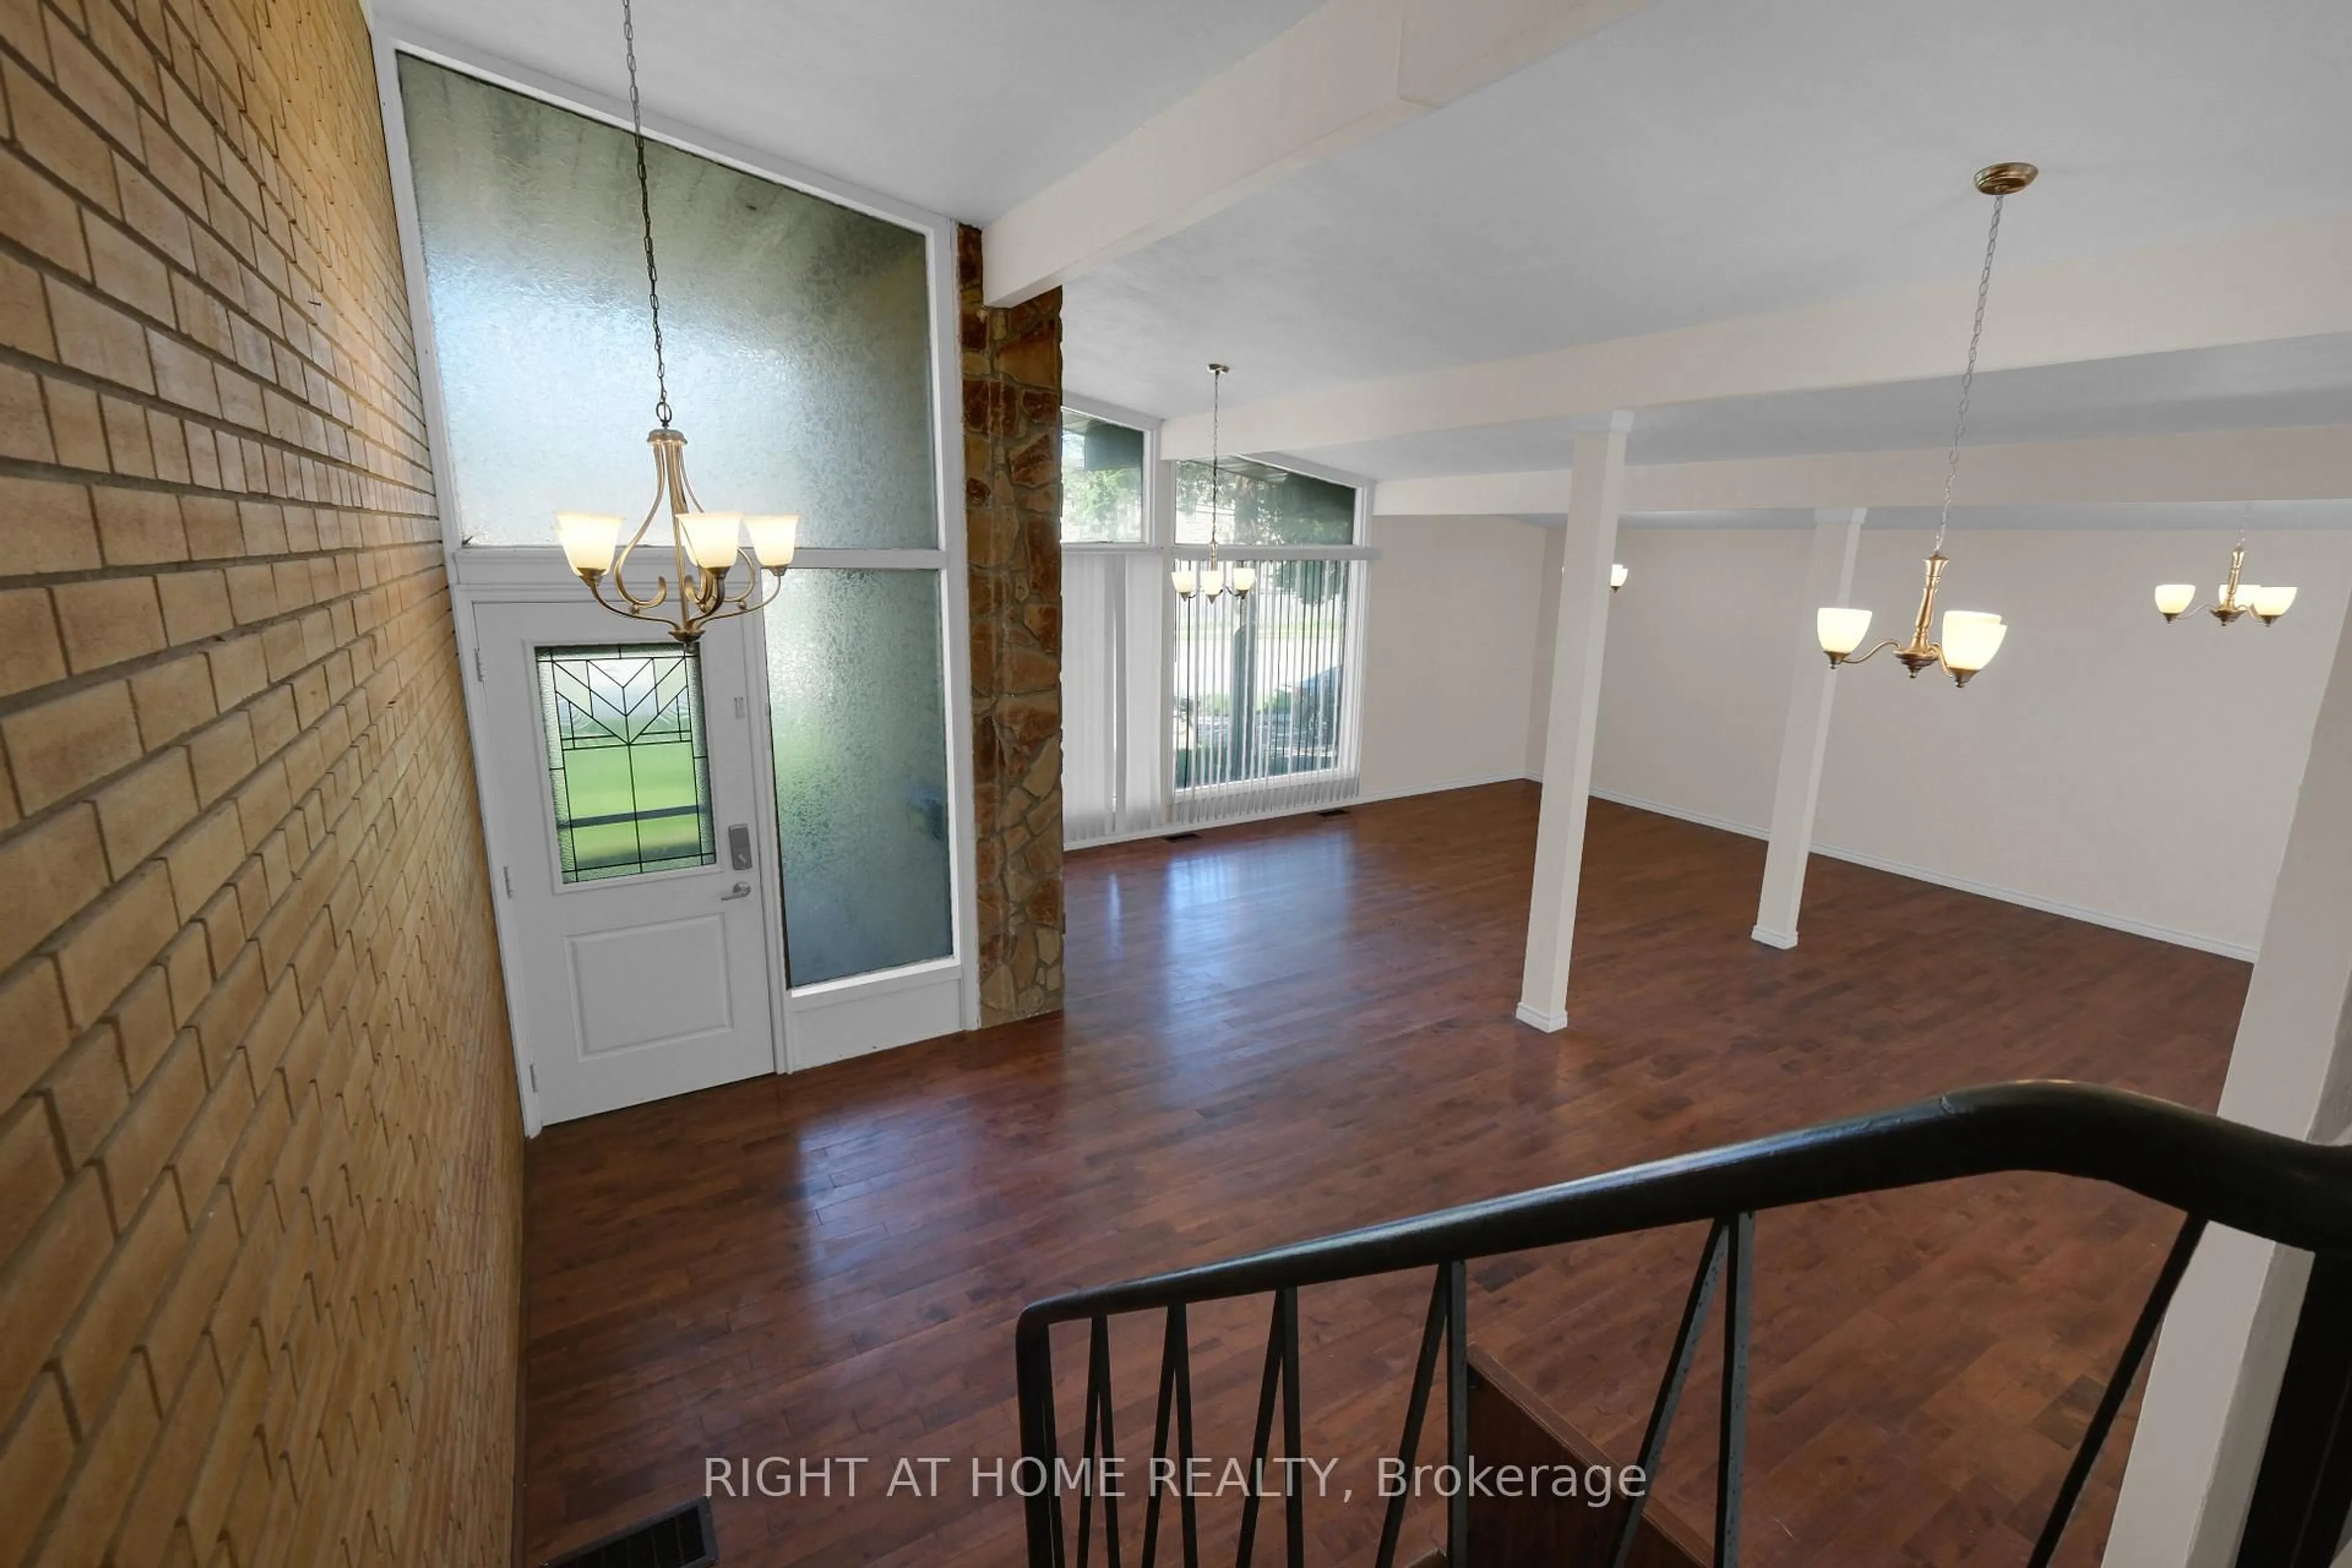
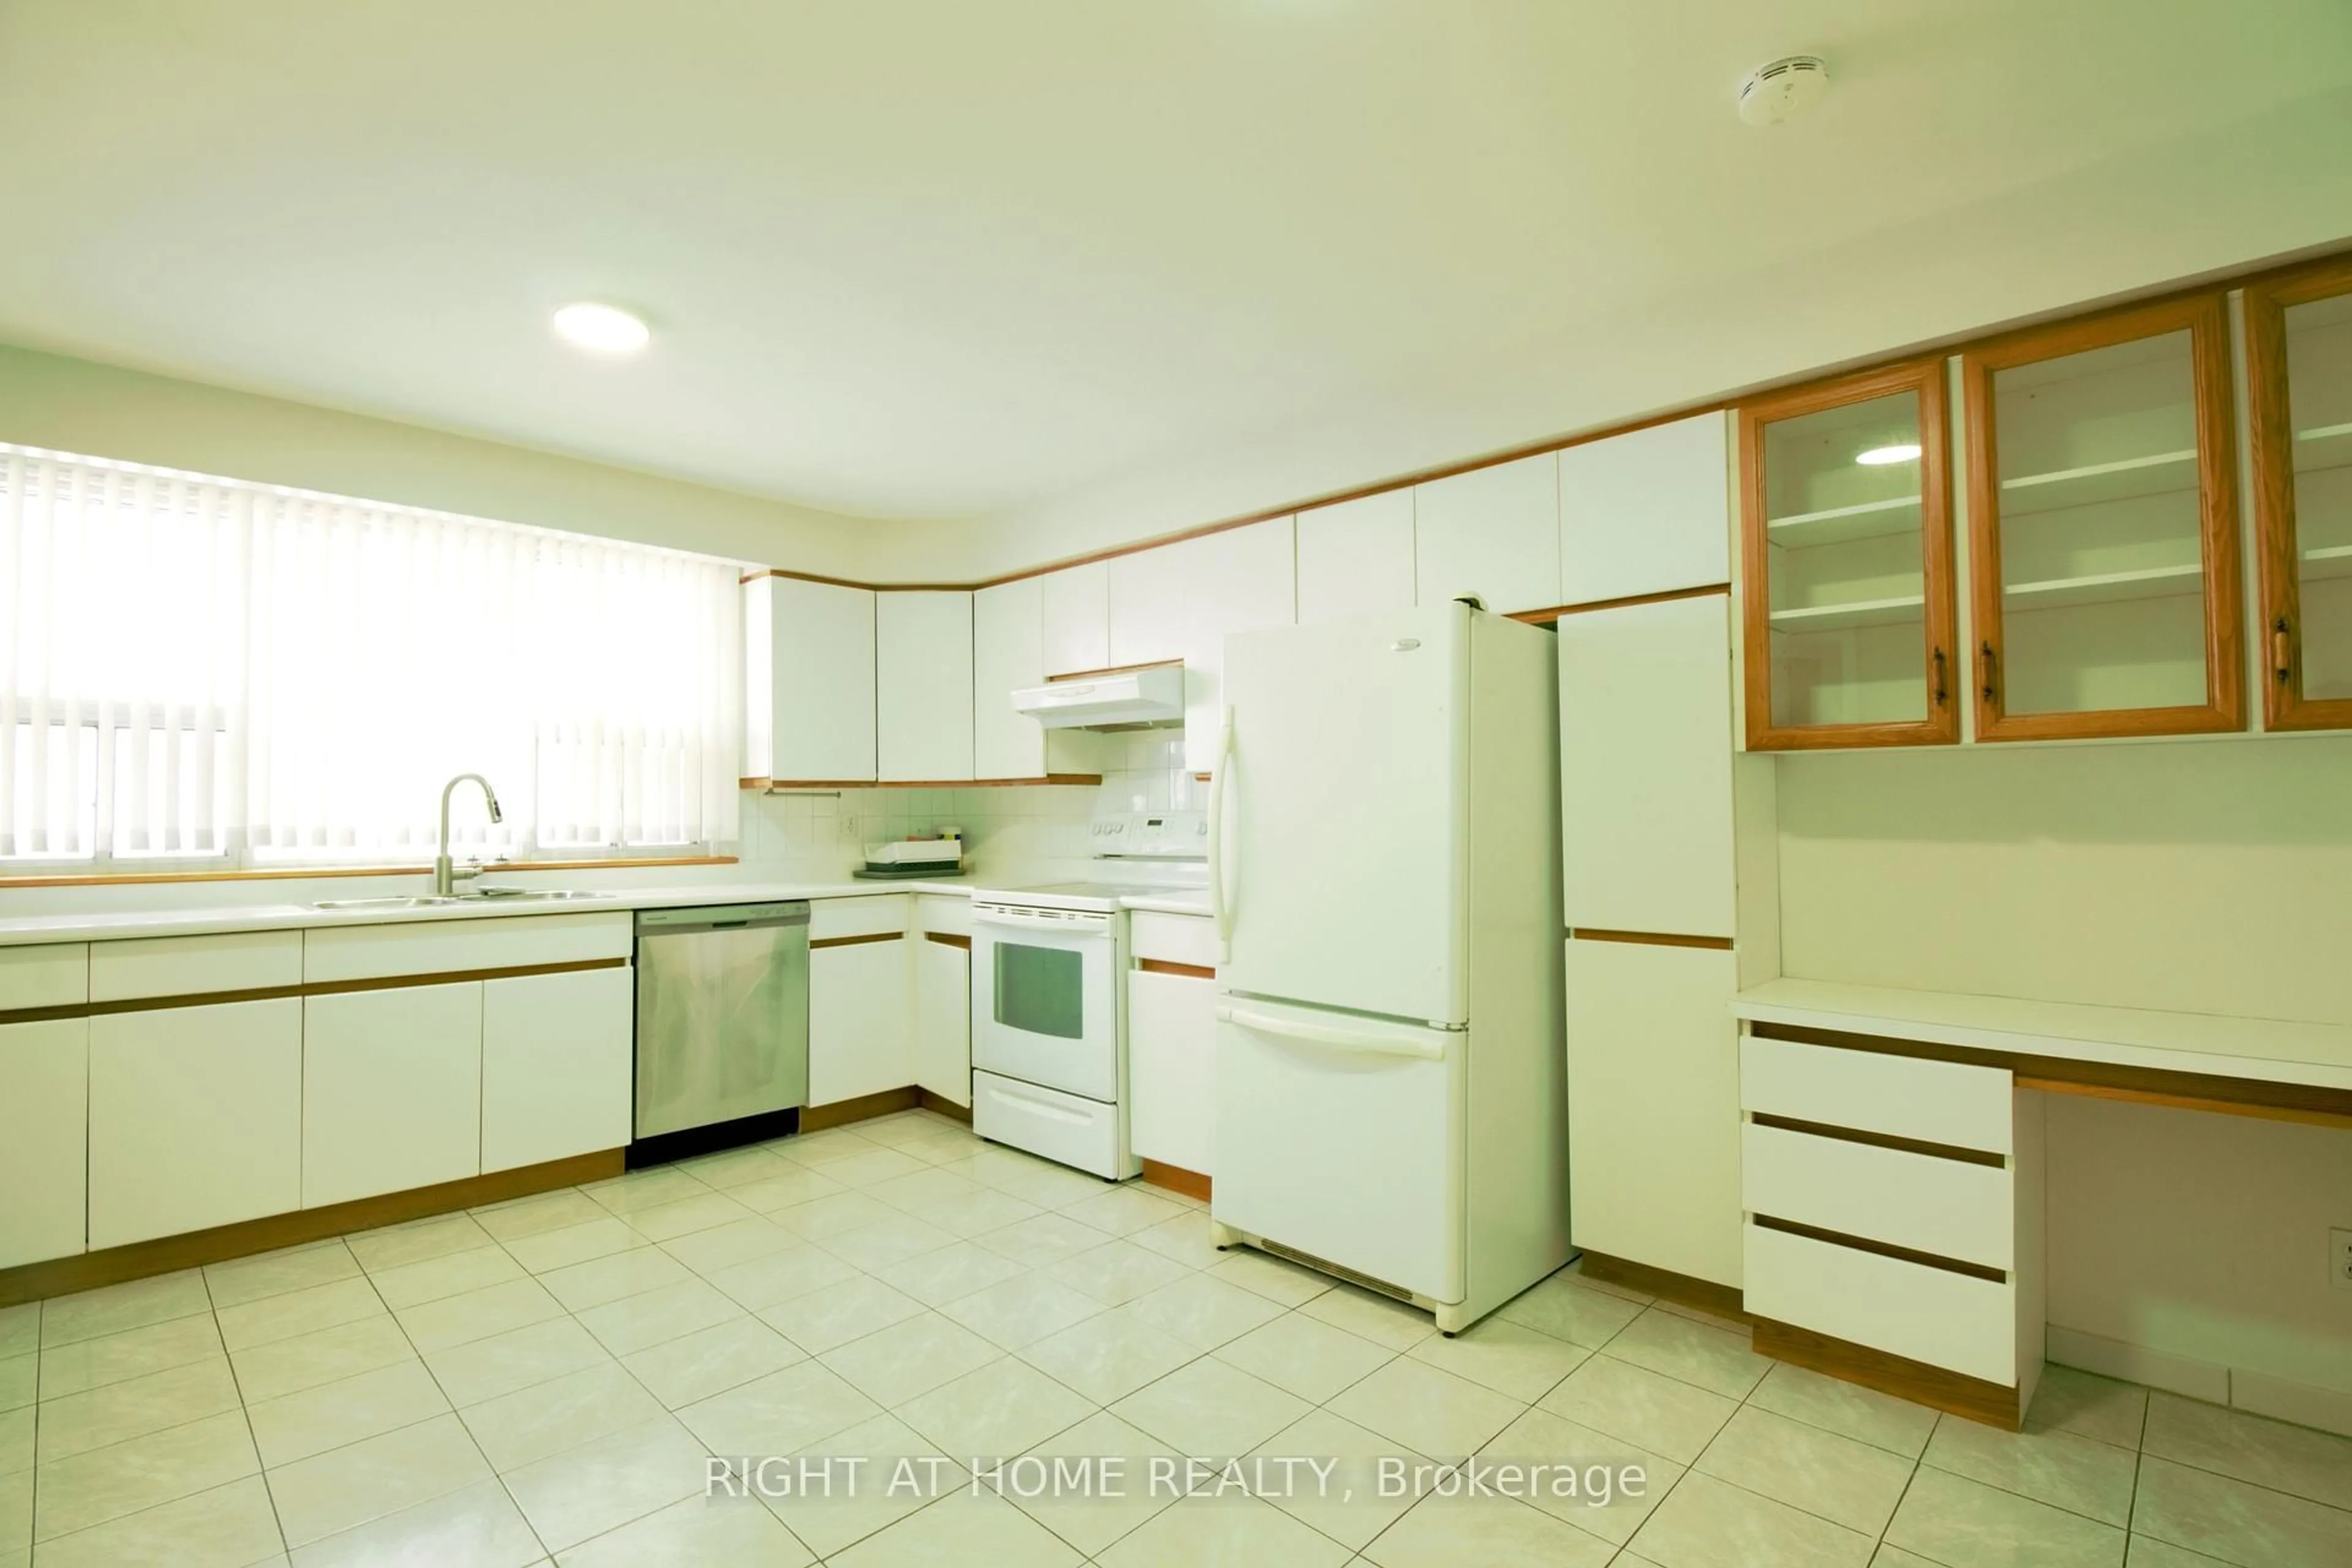
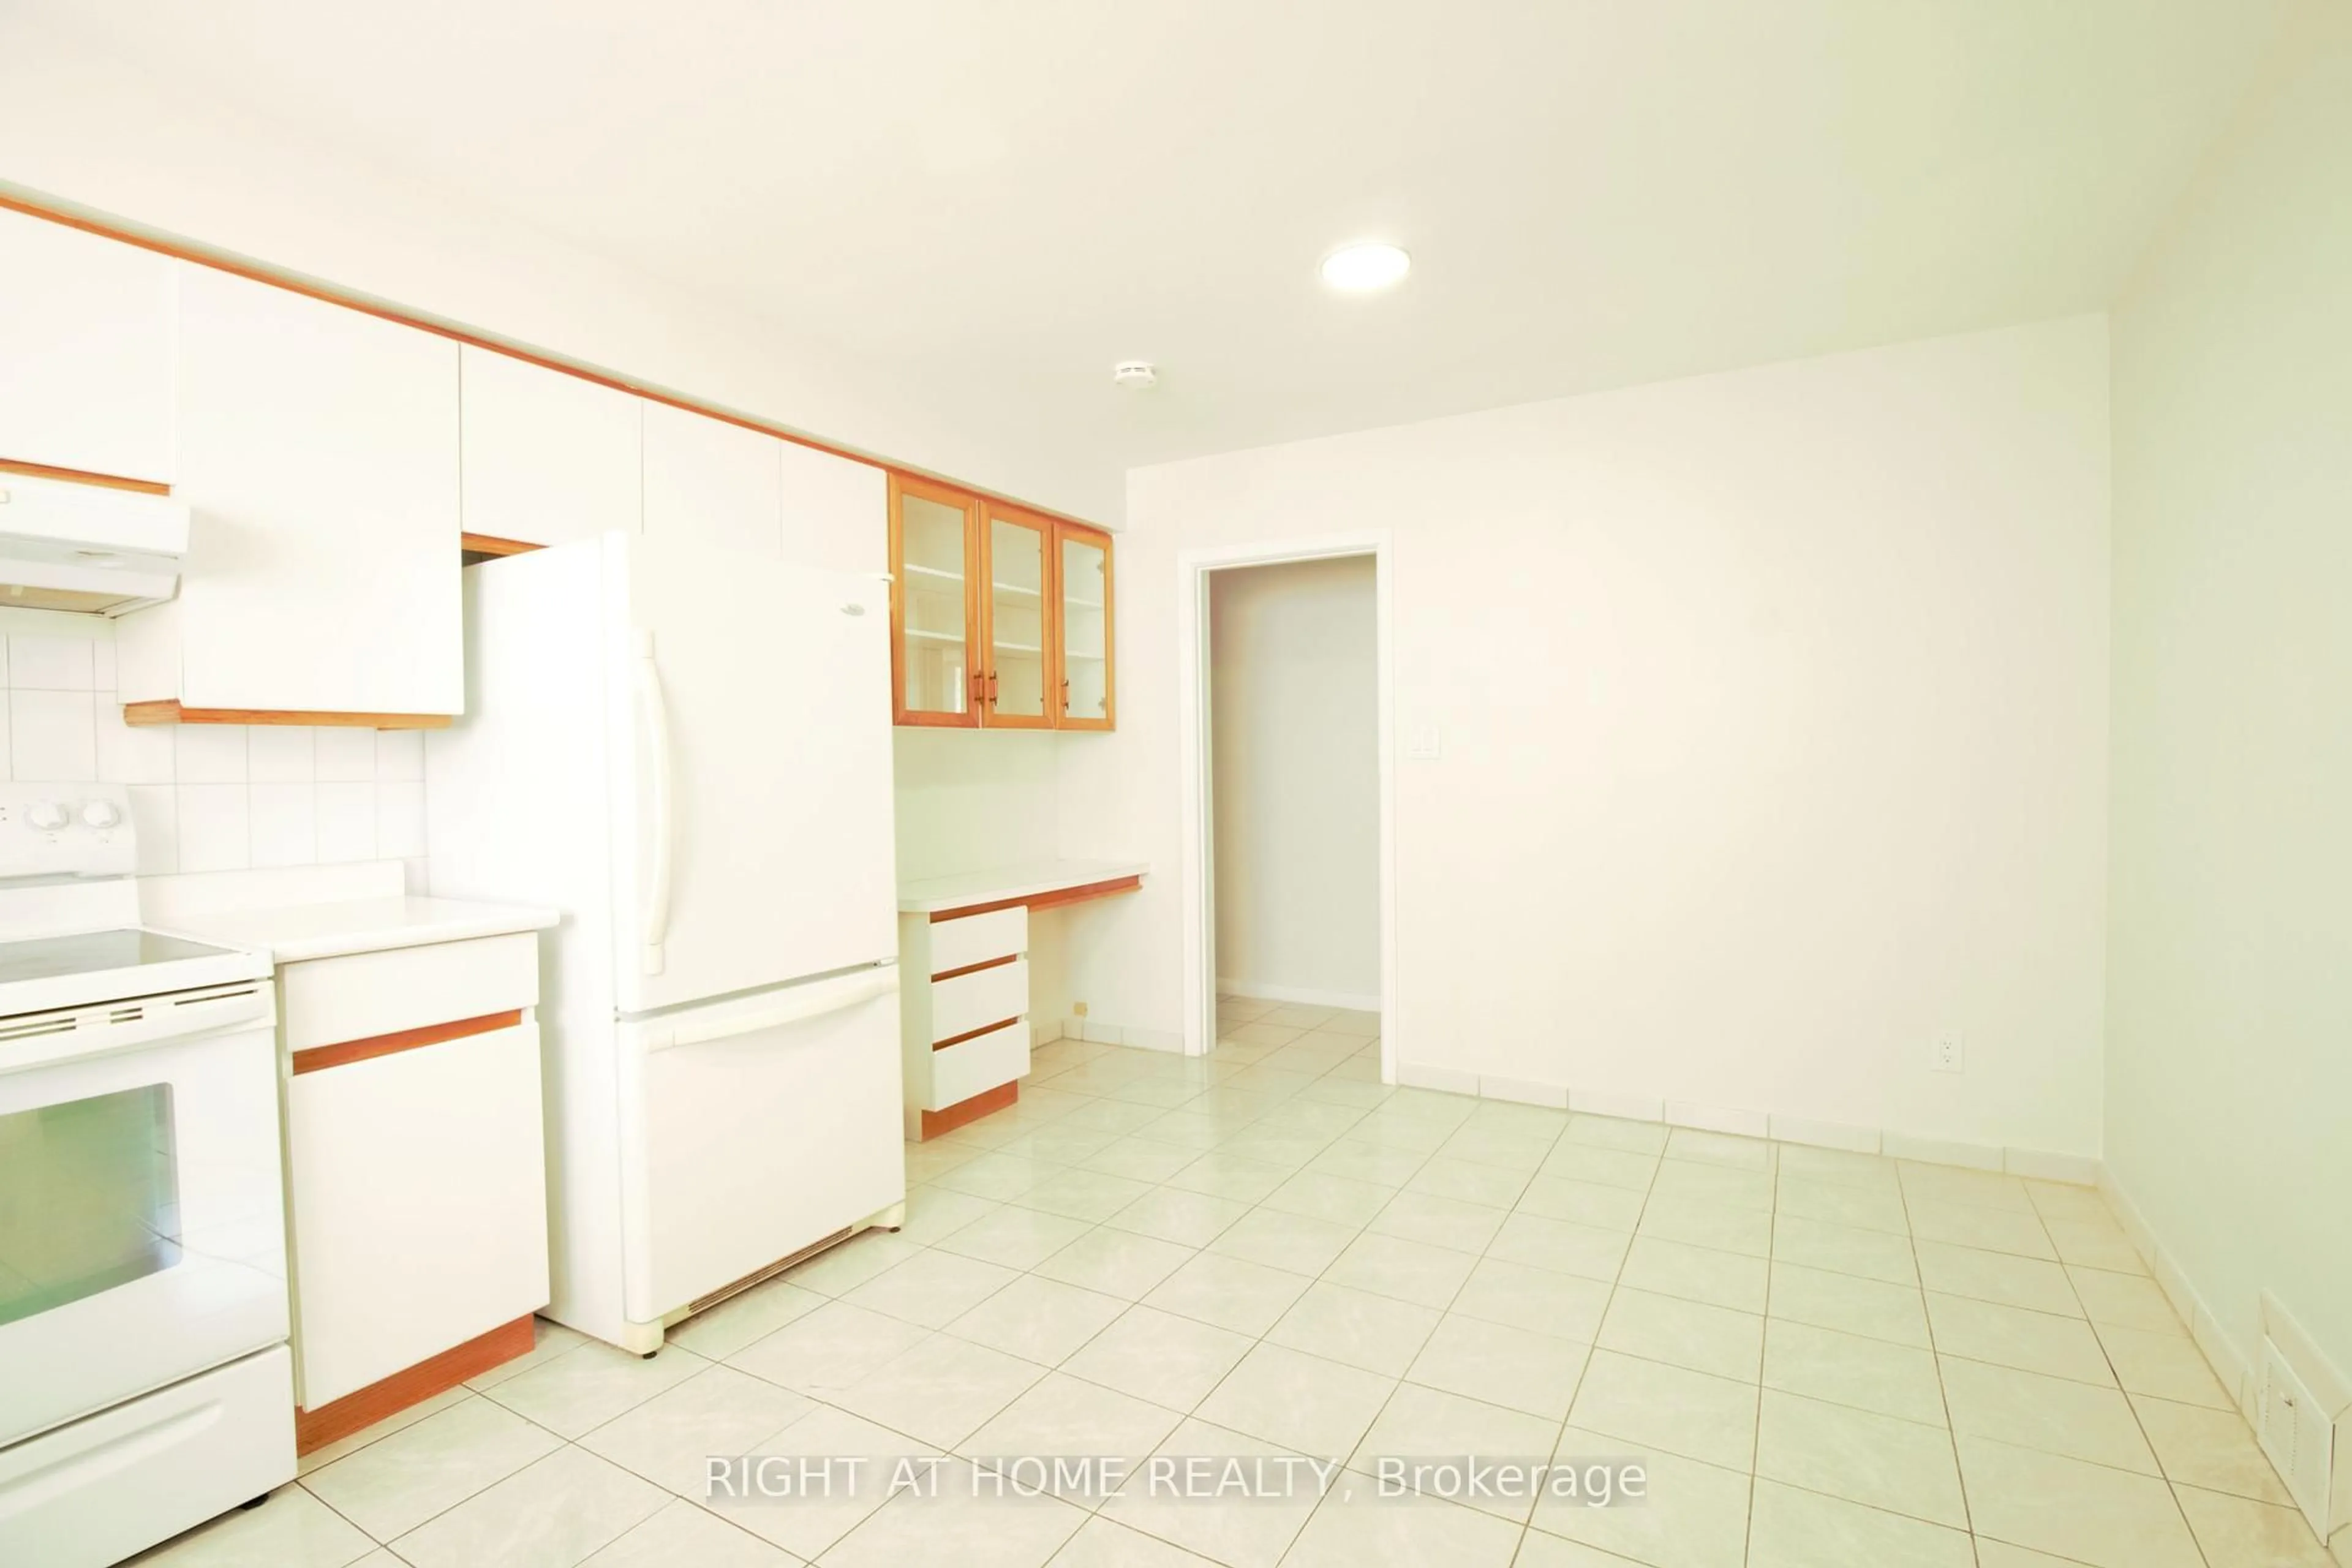
Well maintained Bungalow near Yonge/Finch, beautiful flat corner lot 50x132ft surrounded by luxury custom-built homes, bright & spacious, large kitchen, fully finished lower level with separate walk-out, 2 driveways, Close to all amenities, walking distance to Yonge St, Schools, park & TTC
Property Details
StyleBungalow
View-
Age of property-
SqFt~1100-1500 SqFt
Lot Size6,600 SqFt(132 x 50)
Parking Spaces5
MLS ®NumberC13516822
Community NameNewtonbrook
Data SourceTRREB
Listing byRIGHT AT HOME REALTY
Interior
Features
Heating: Forced Air
Cooling: Central Air
Basement: Fin W/O
Exterior
Features
Lot size: 6,600 SqFt
Parking
Garage spaces 1
Garage type Attached
Other parking spaces 4
Total parking spaces 5
Property History
Jul 3, 2026
ListedActive
$1,338,900
20 days on market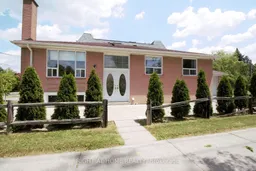 14Listing by trreb®
14Login required
Sold
$•••,•••
Login required
Listed
$•••,•••
Stayed --2 days on market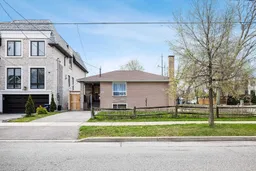 Listing by trreb®
Property listed by RIGHT AT HOME REALTY, Brokerage

Interested in this property?Get in touch to get the inside scoop.