The Smarter, Faster, Dreamier Home Search.
With Wahi, your perfect home finds you.
Property type
Detached
Semi Detached
Condo
Townhouse
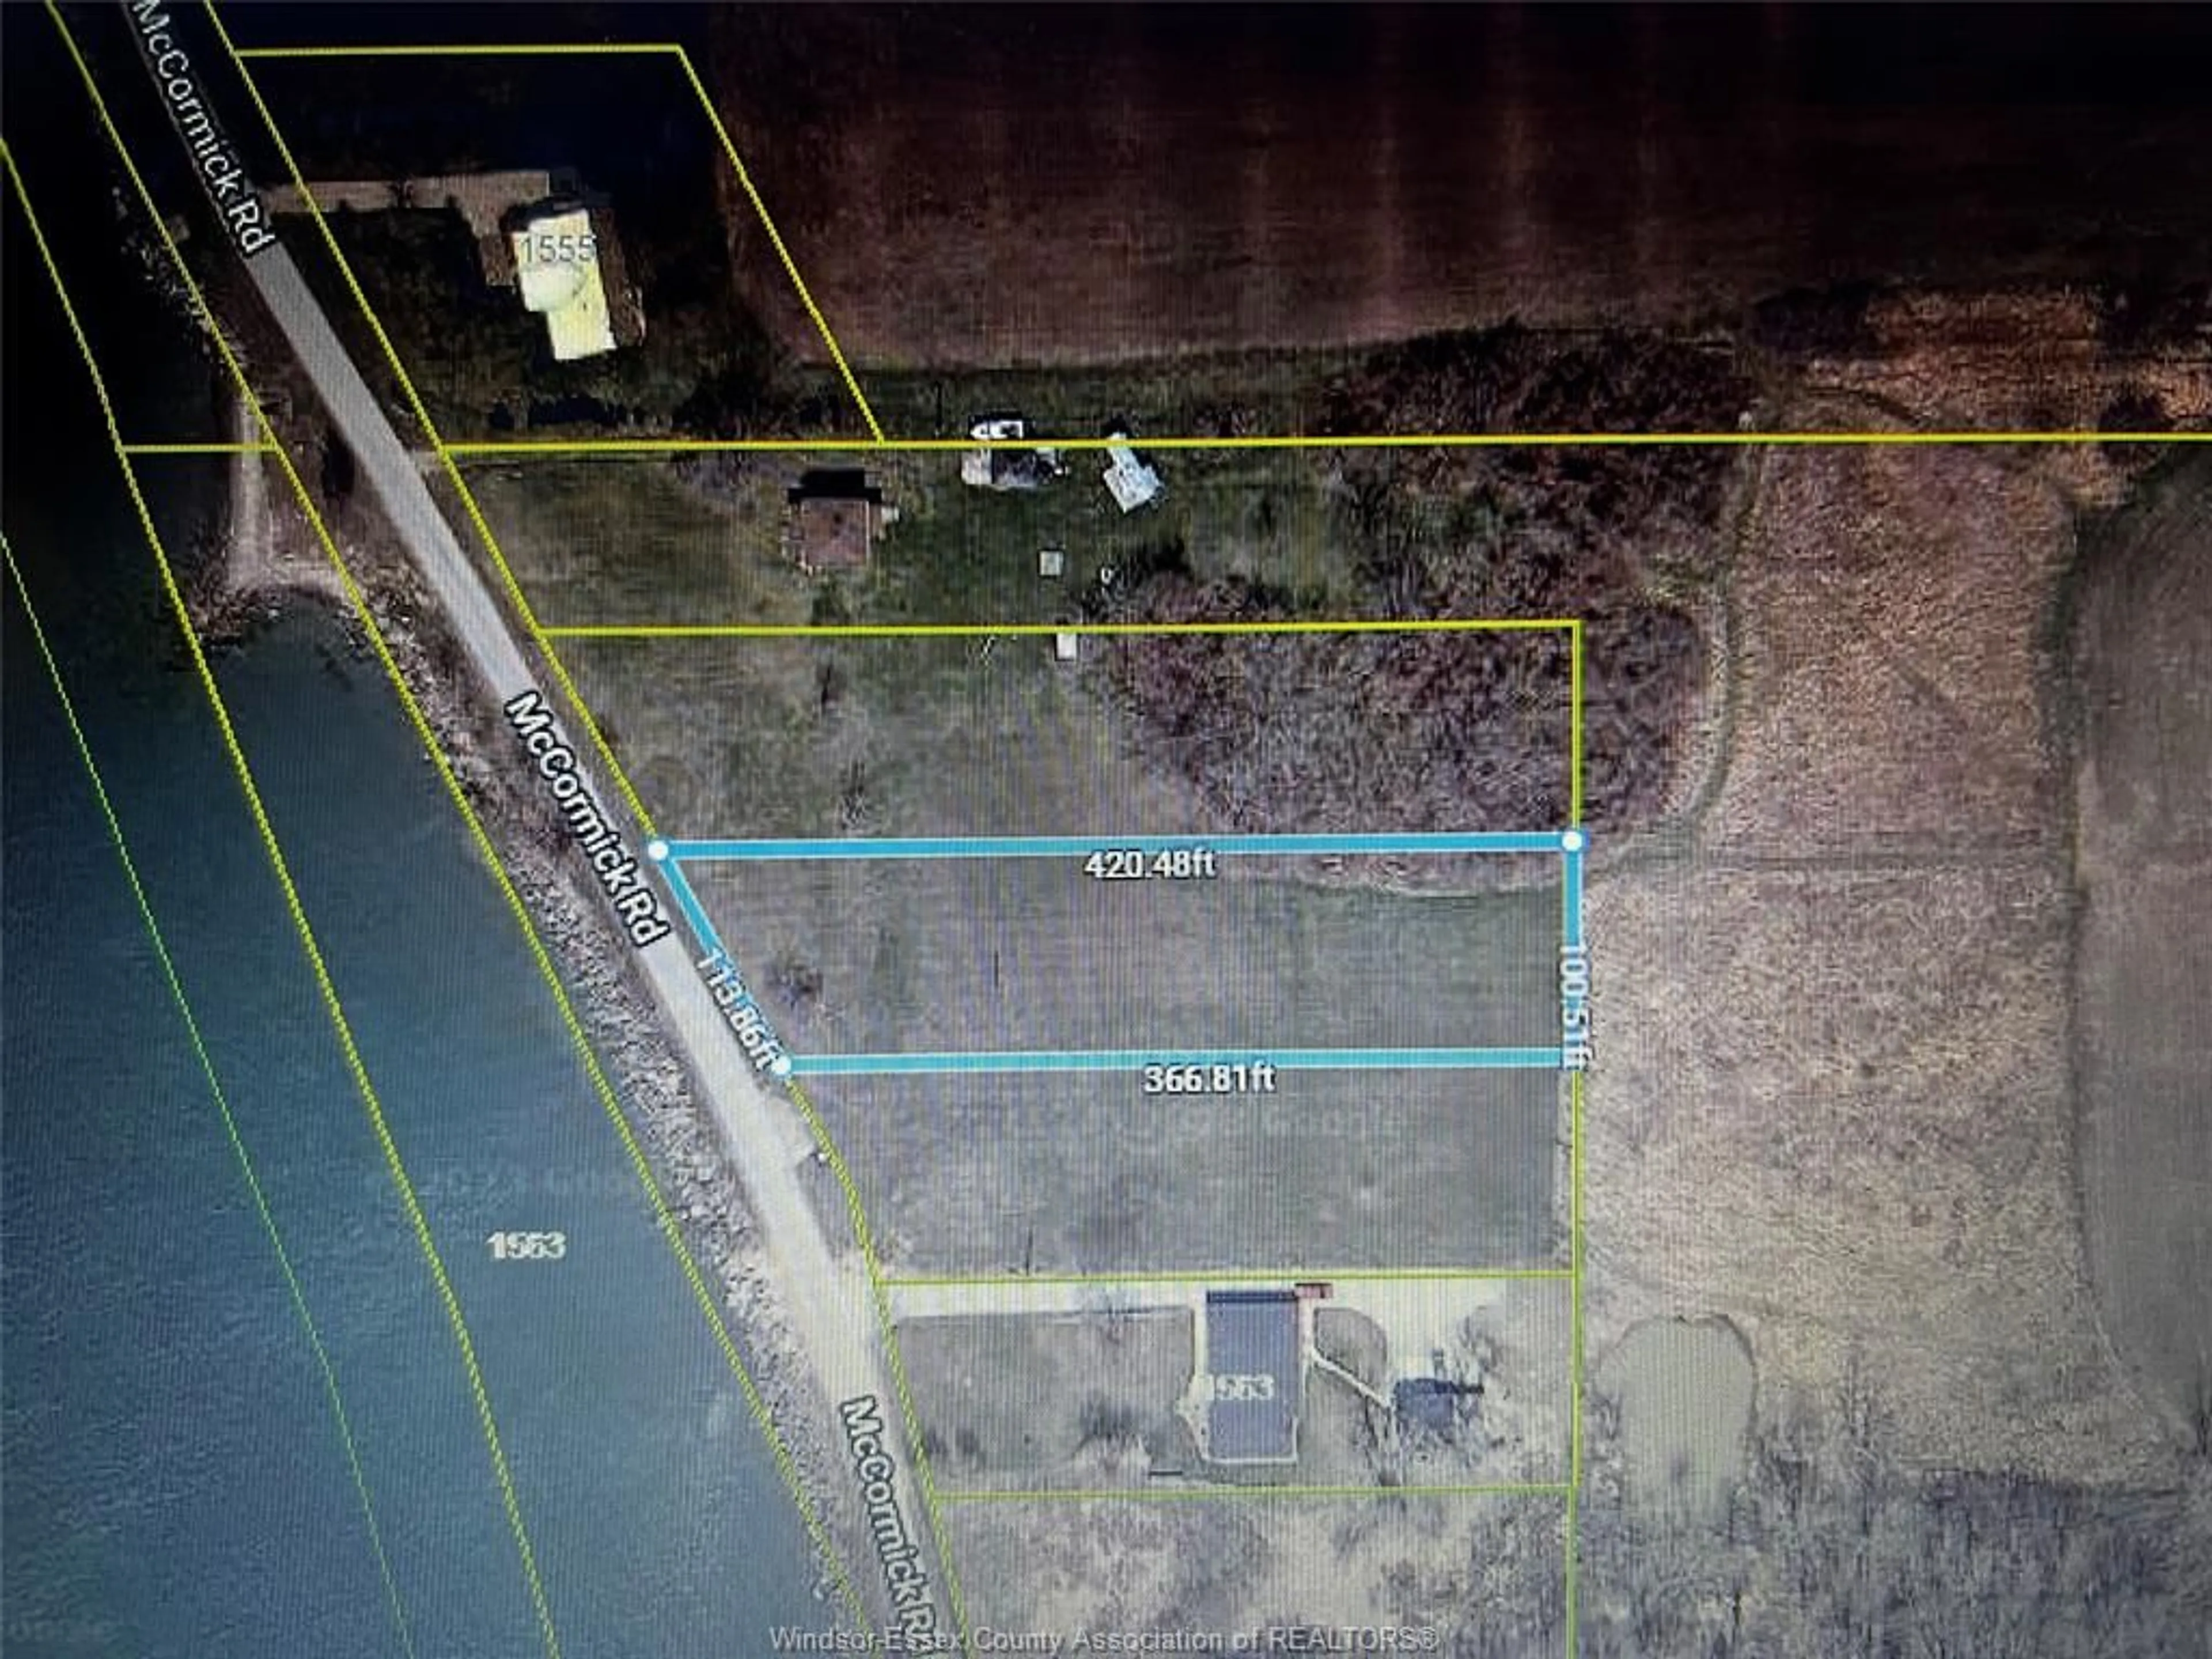
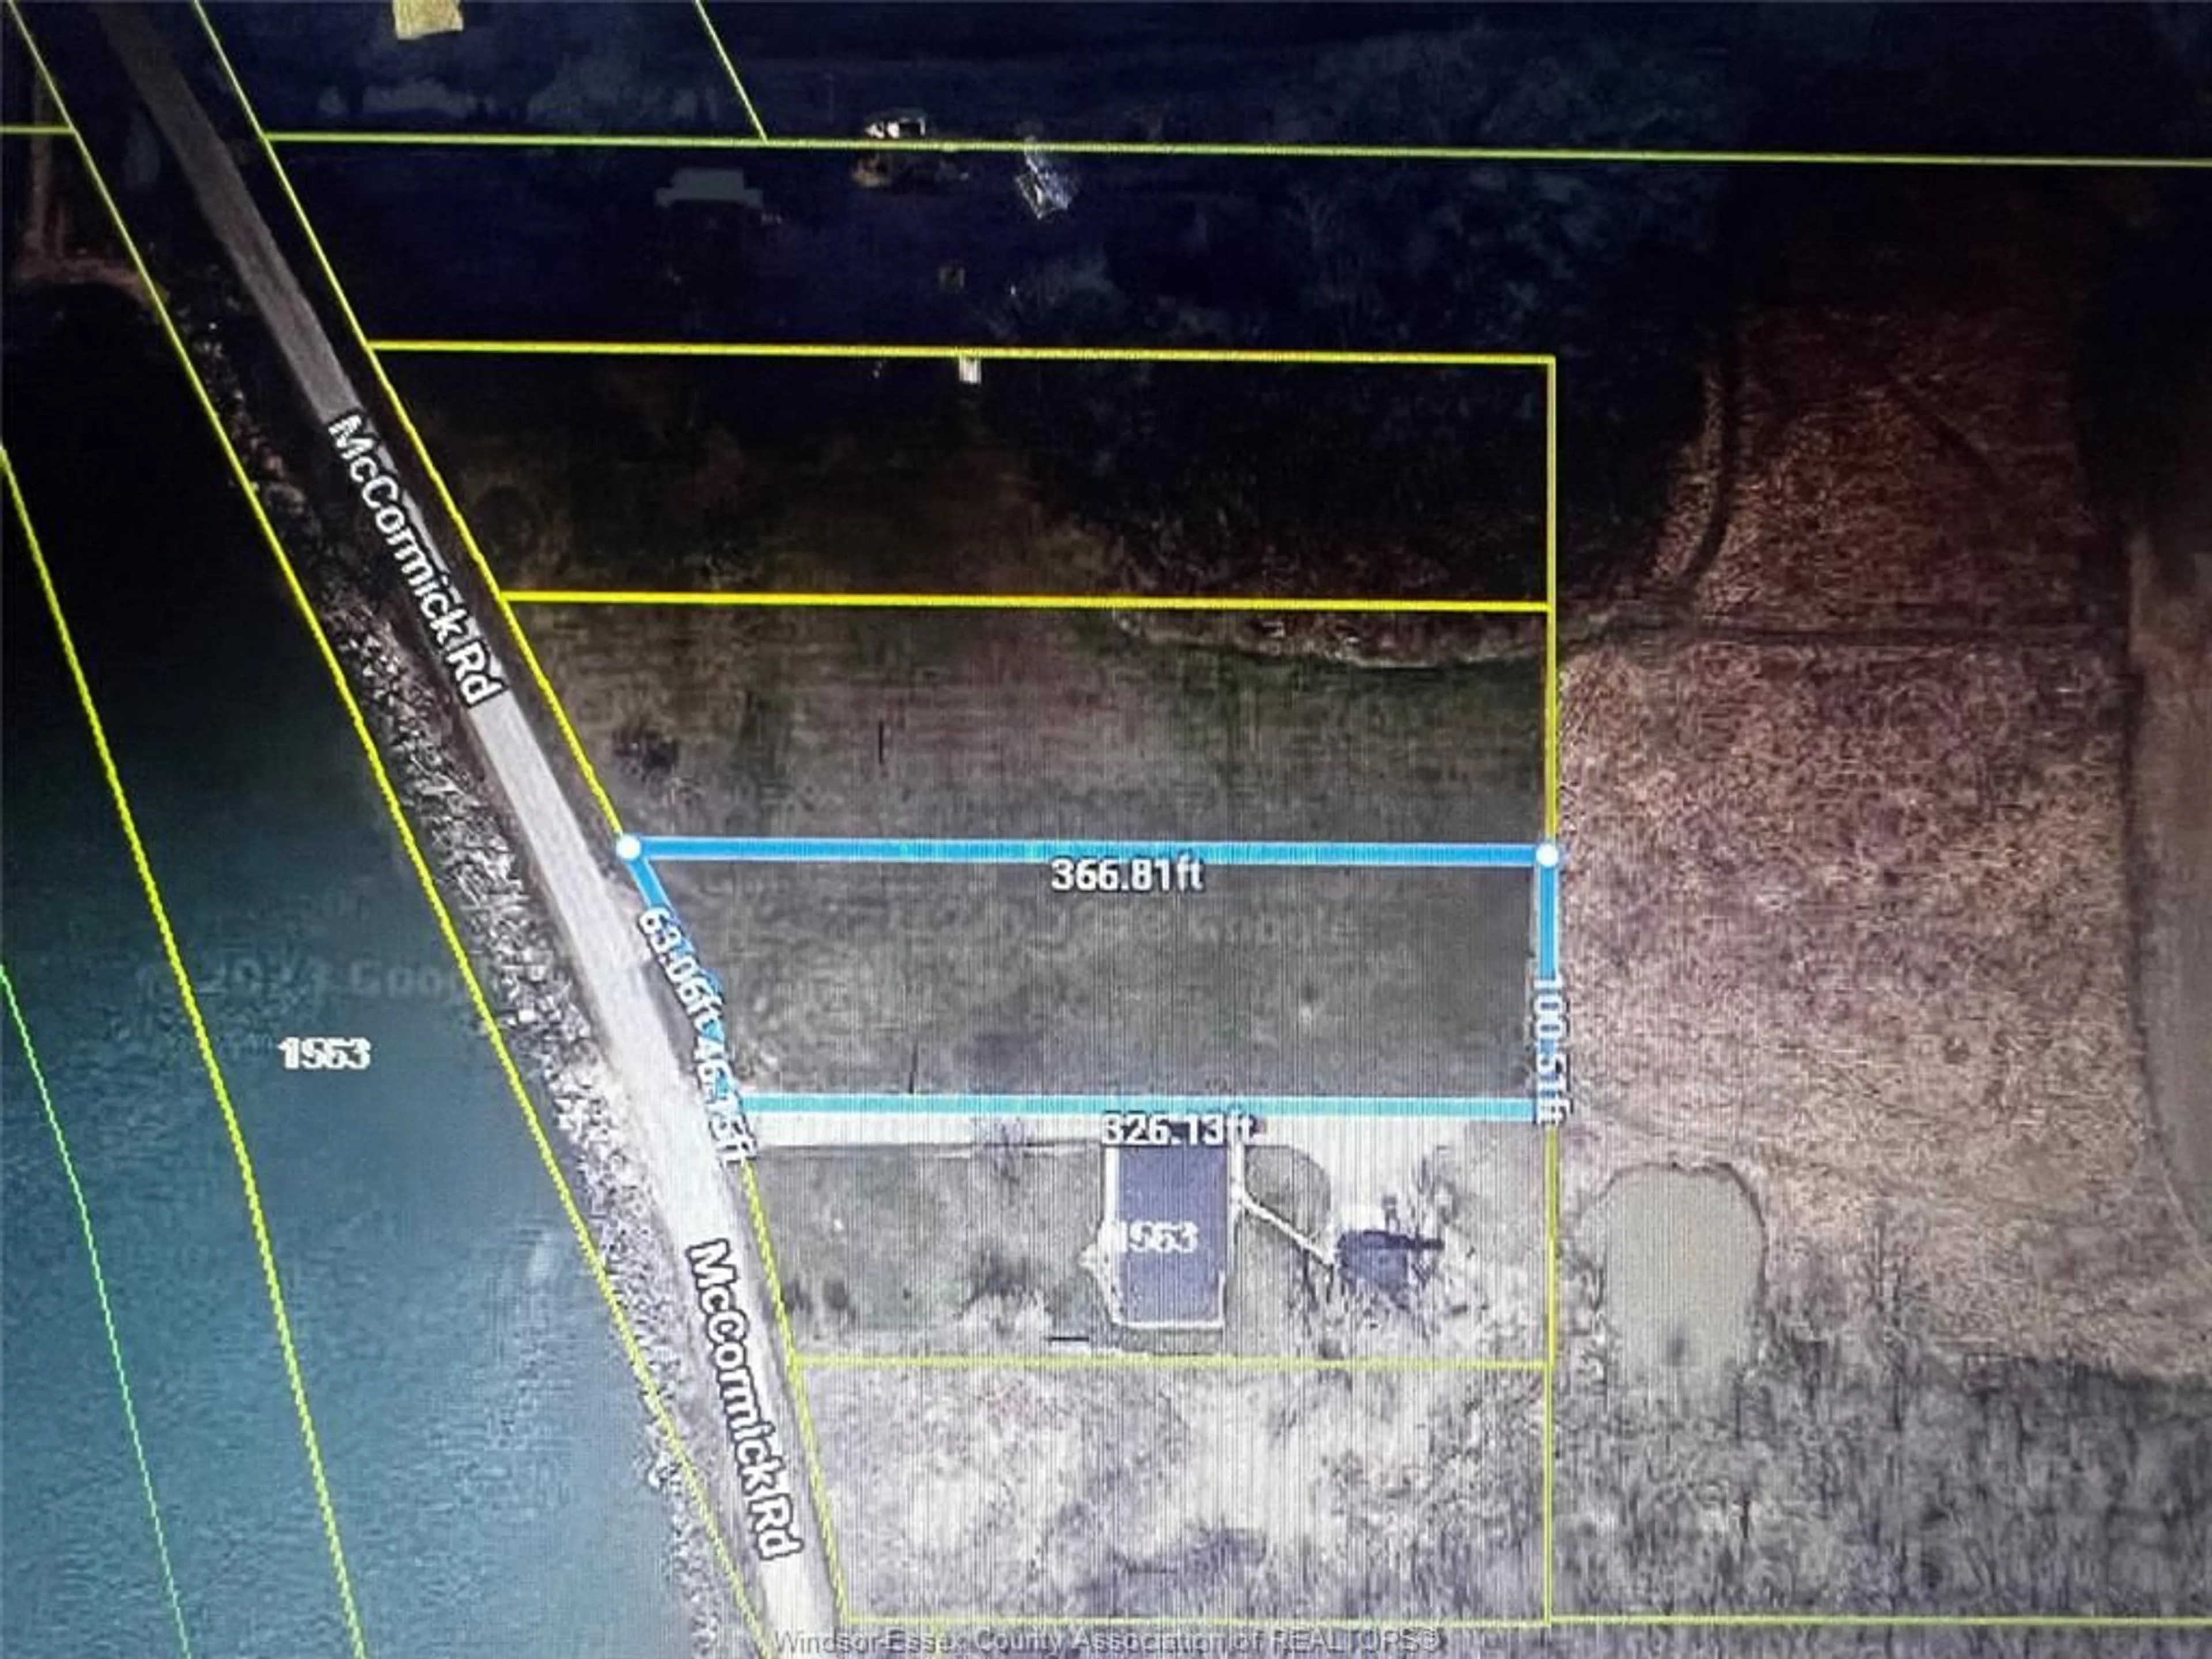
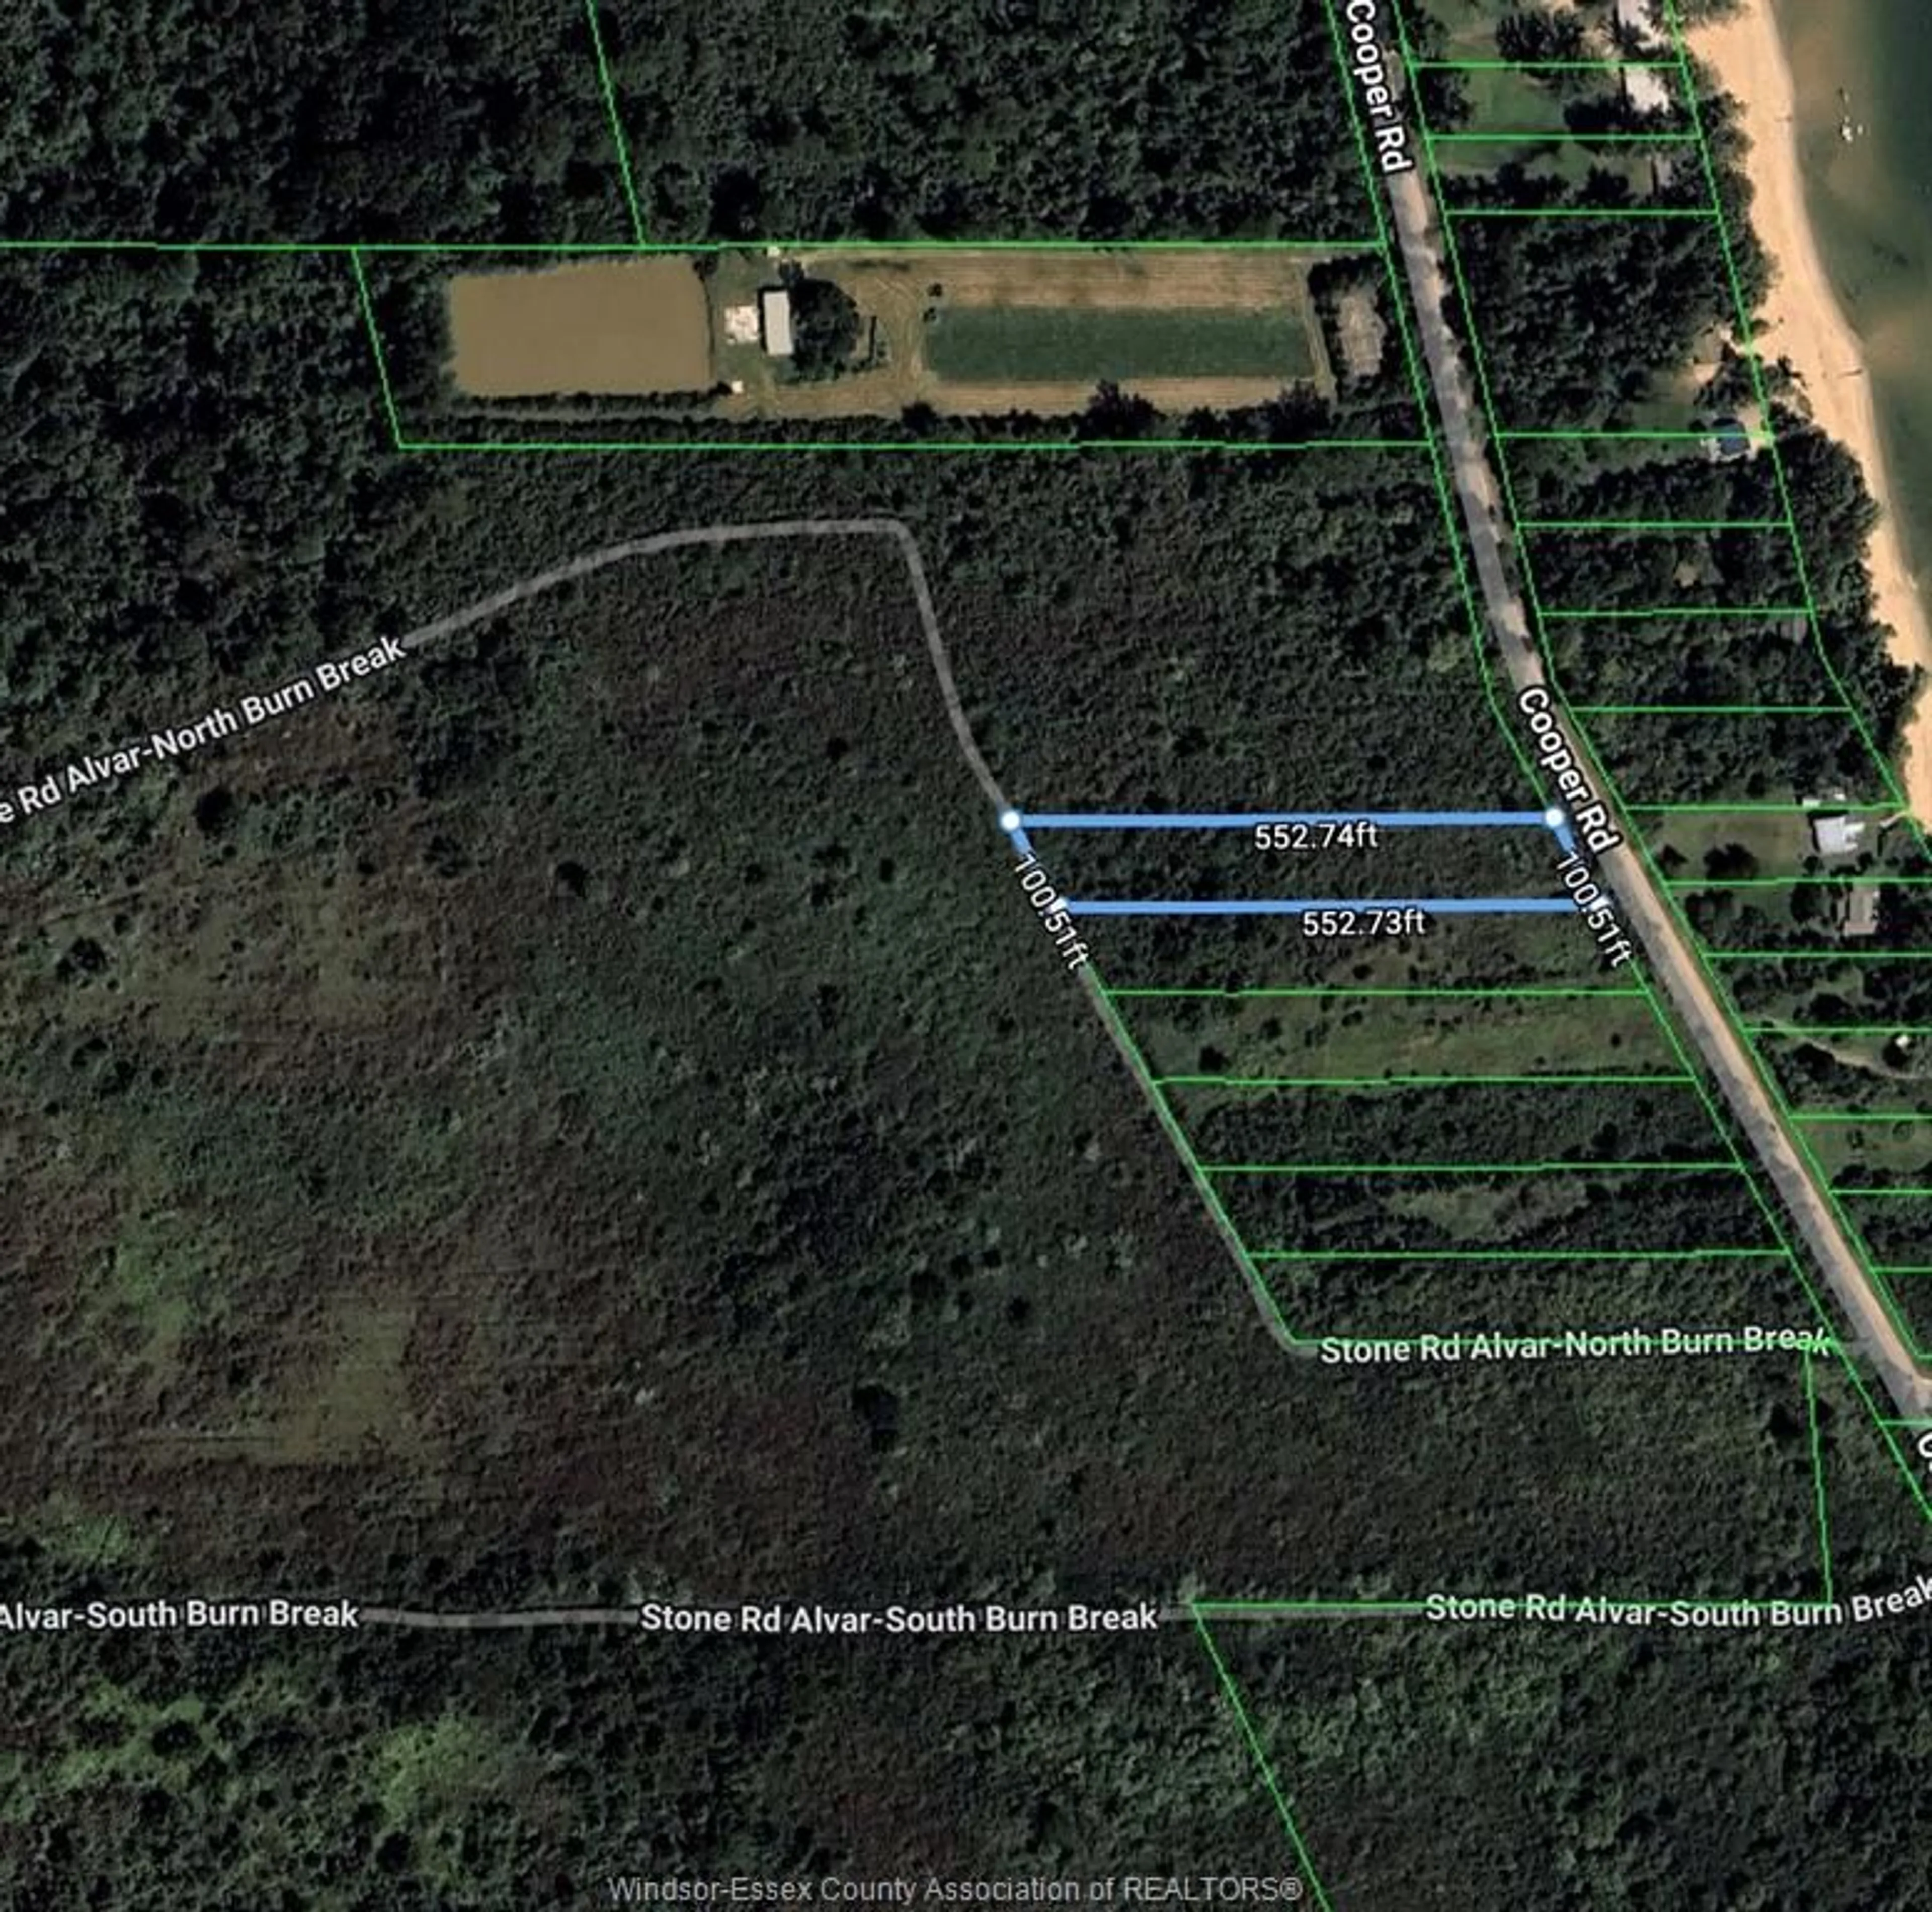
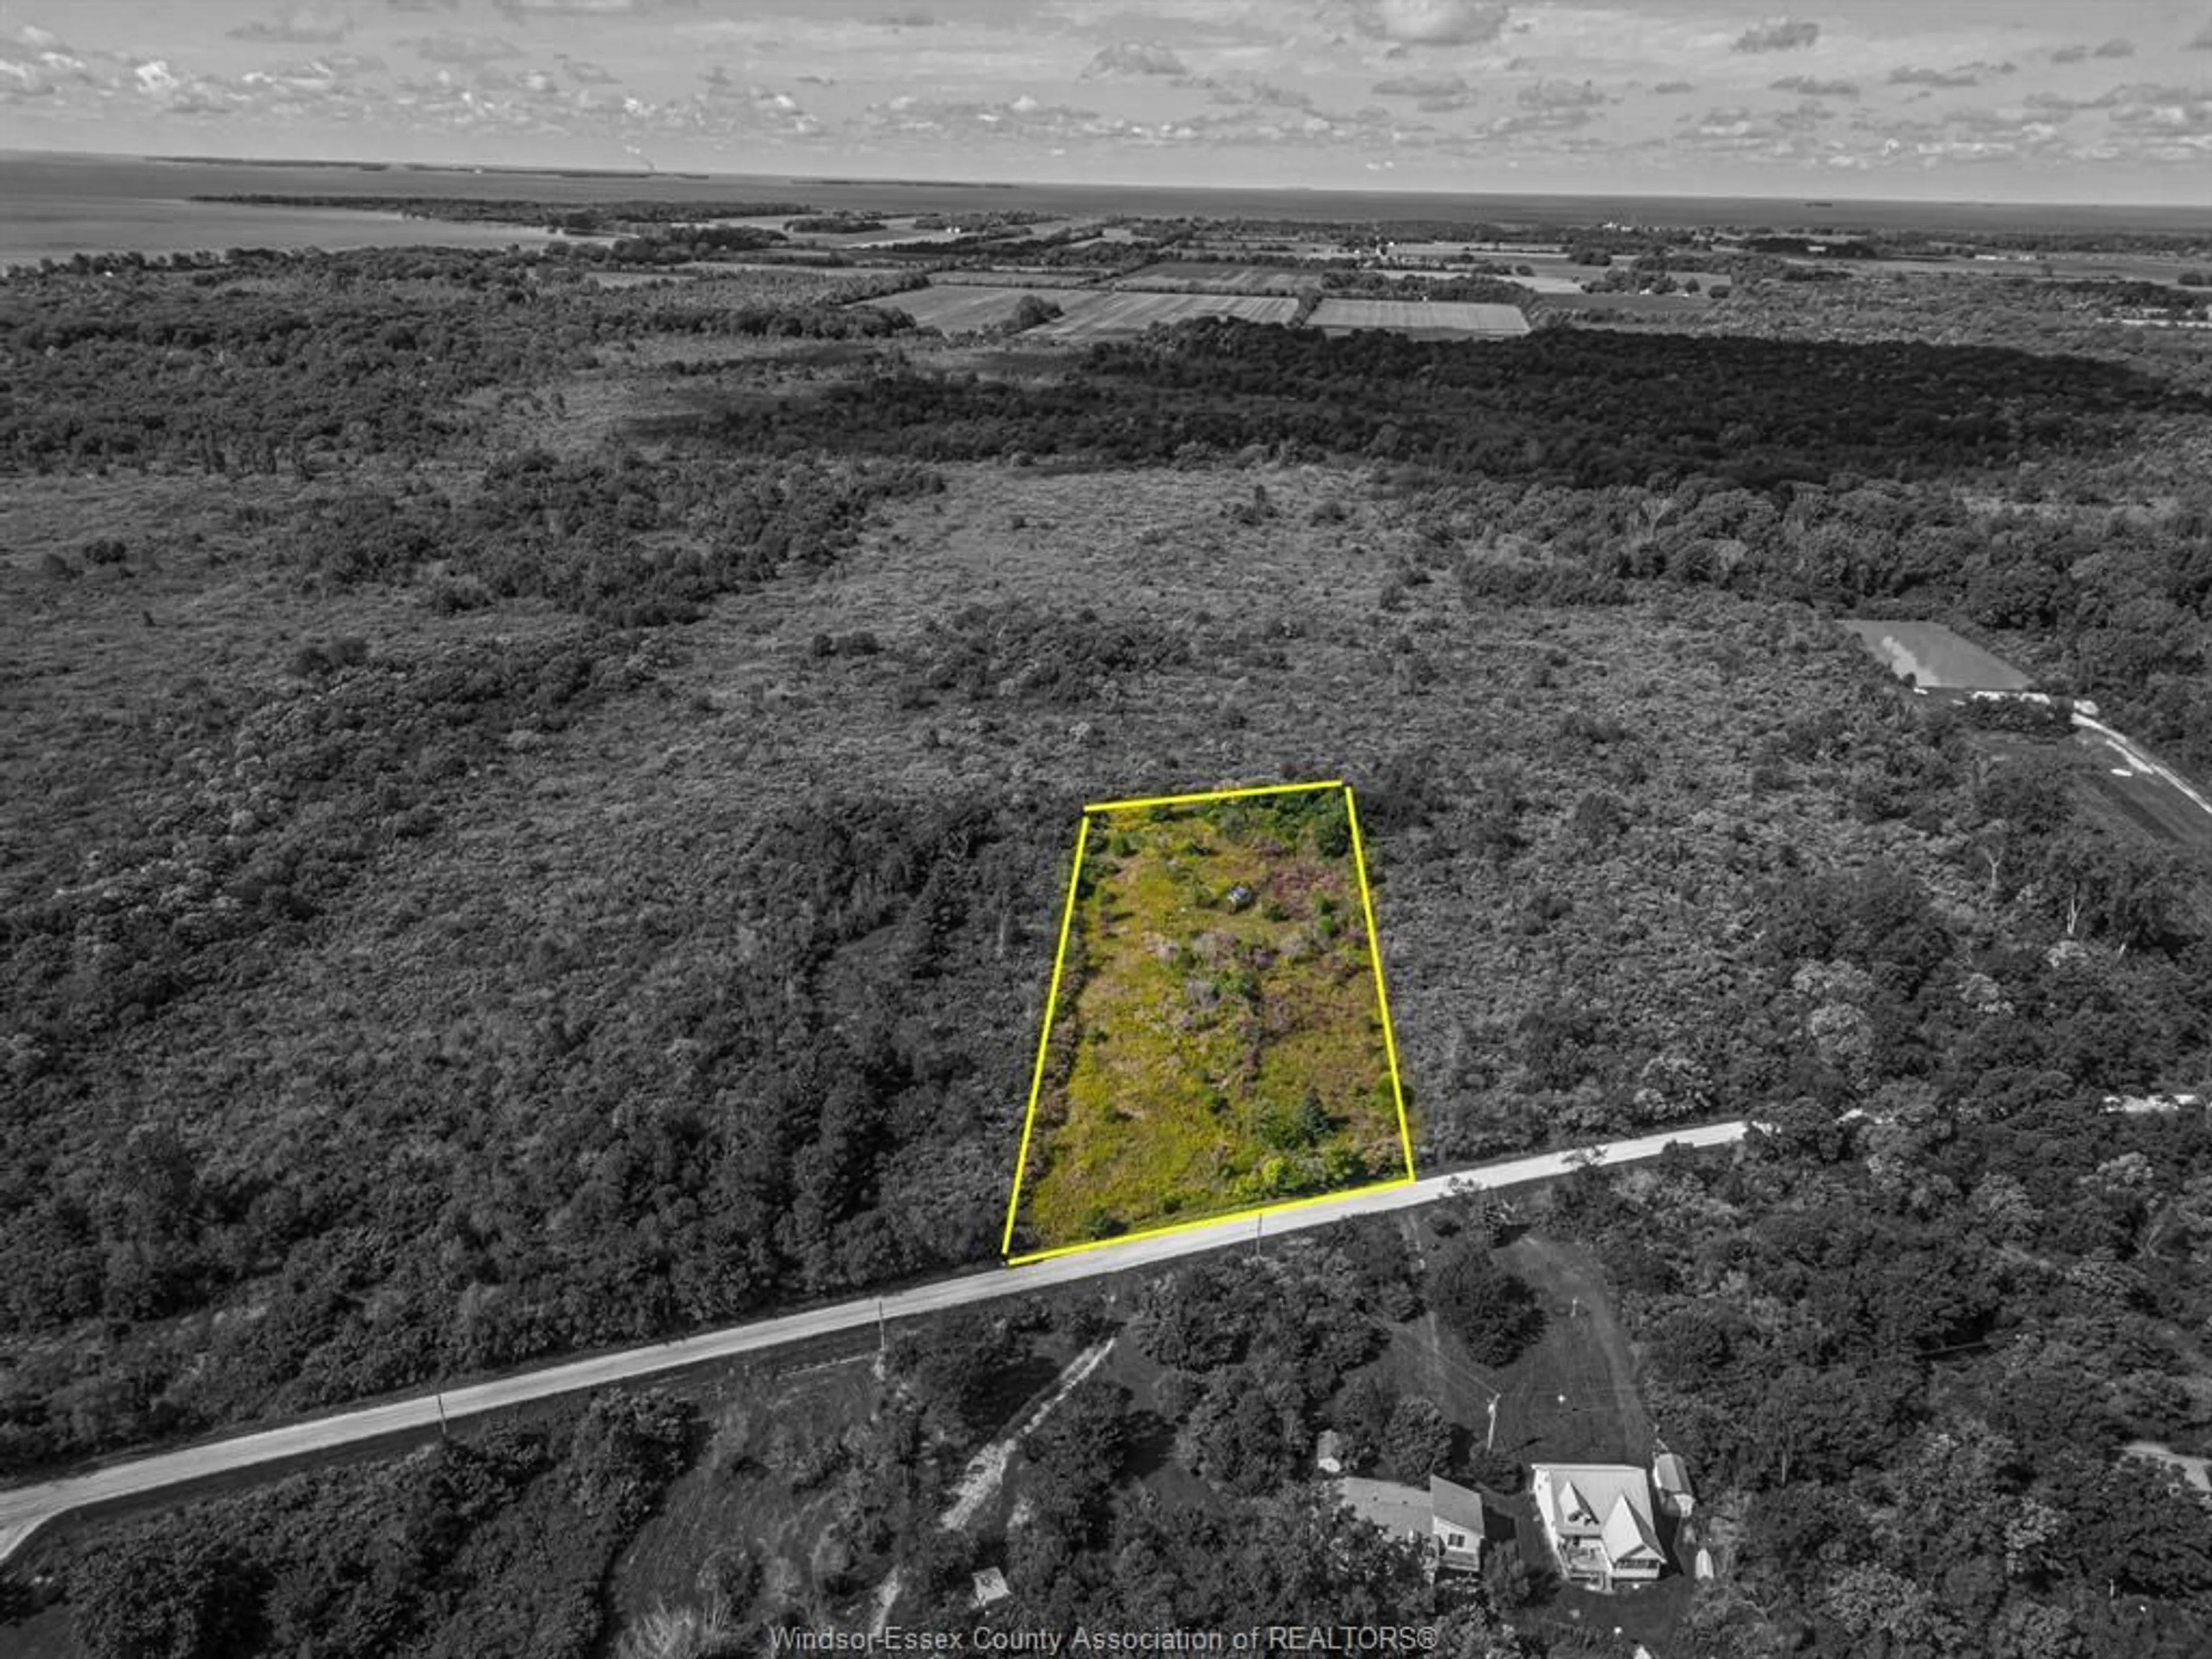
Land
Other
Bedrooms
Exclude den and basement’ means that any den or basement bedrooms is not counted in the property’s total listed area.
Bathrooms
Great REALTORS®. Modern Tools. A Smarter Experience.
Get full-service support from a Wahi Select Realtor in your area — powered by data, driven by results.
As Featured In:


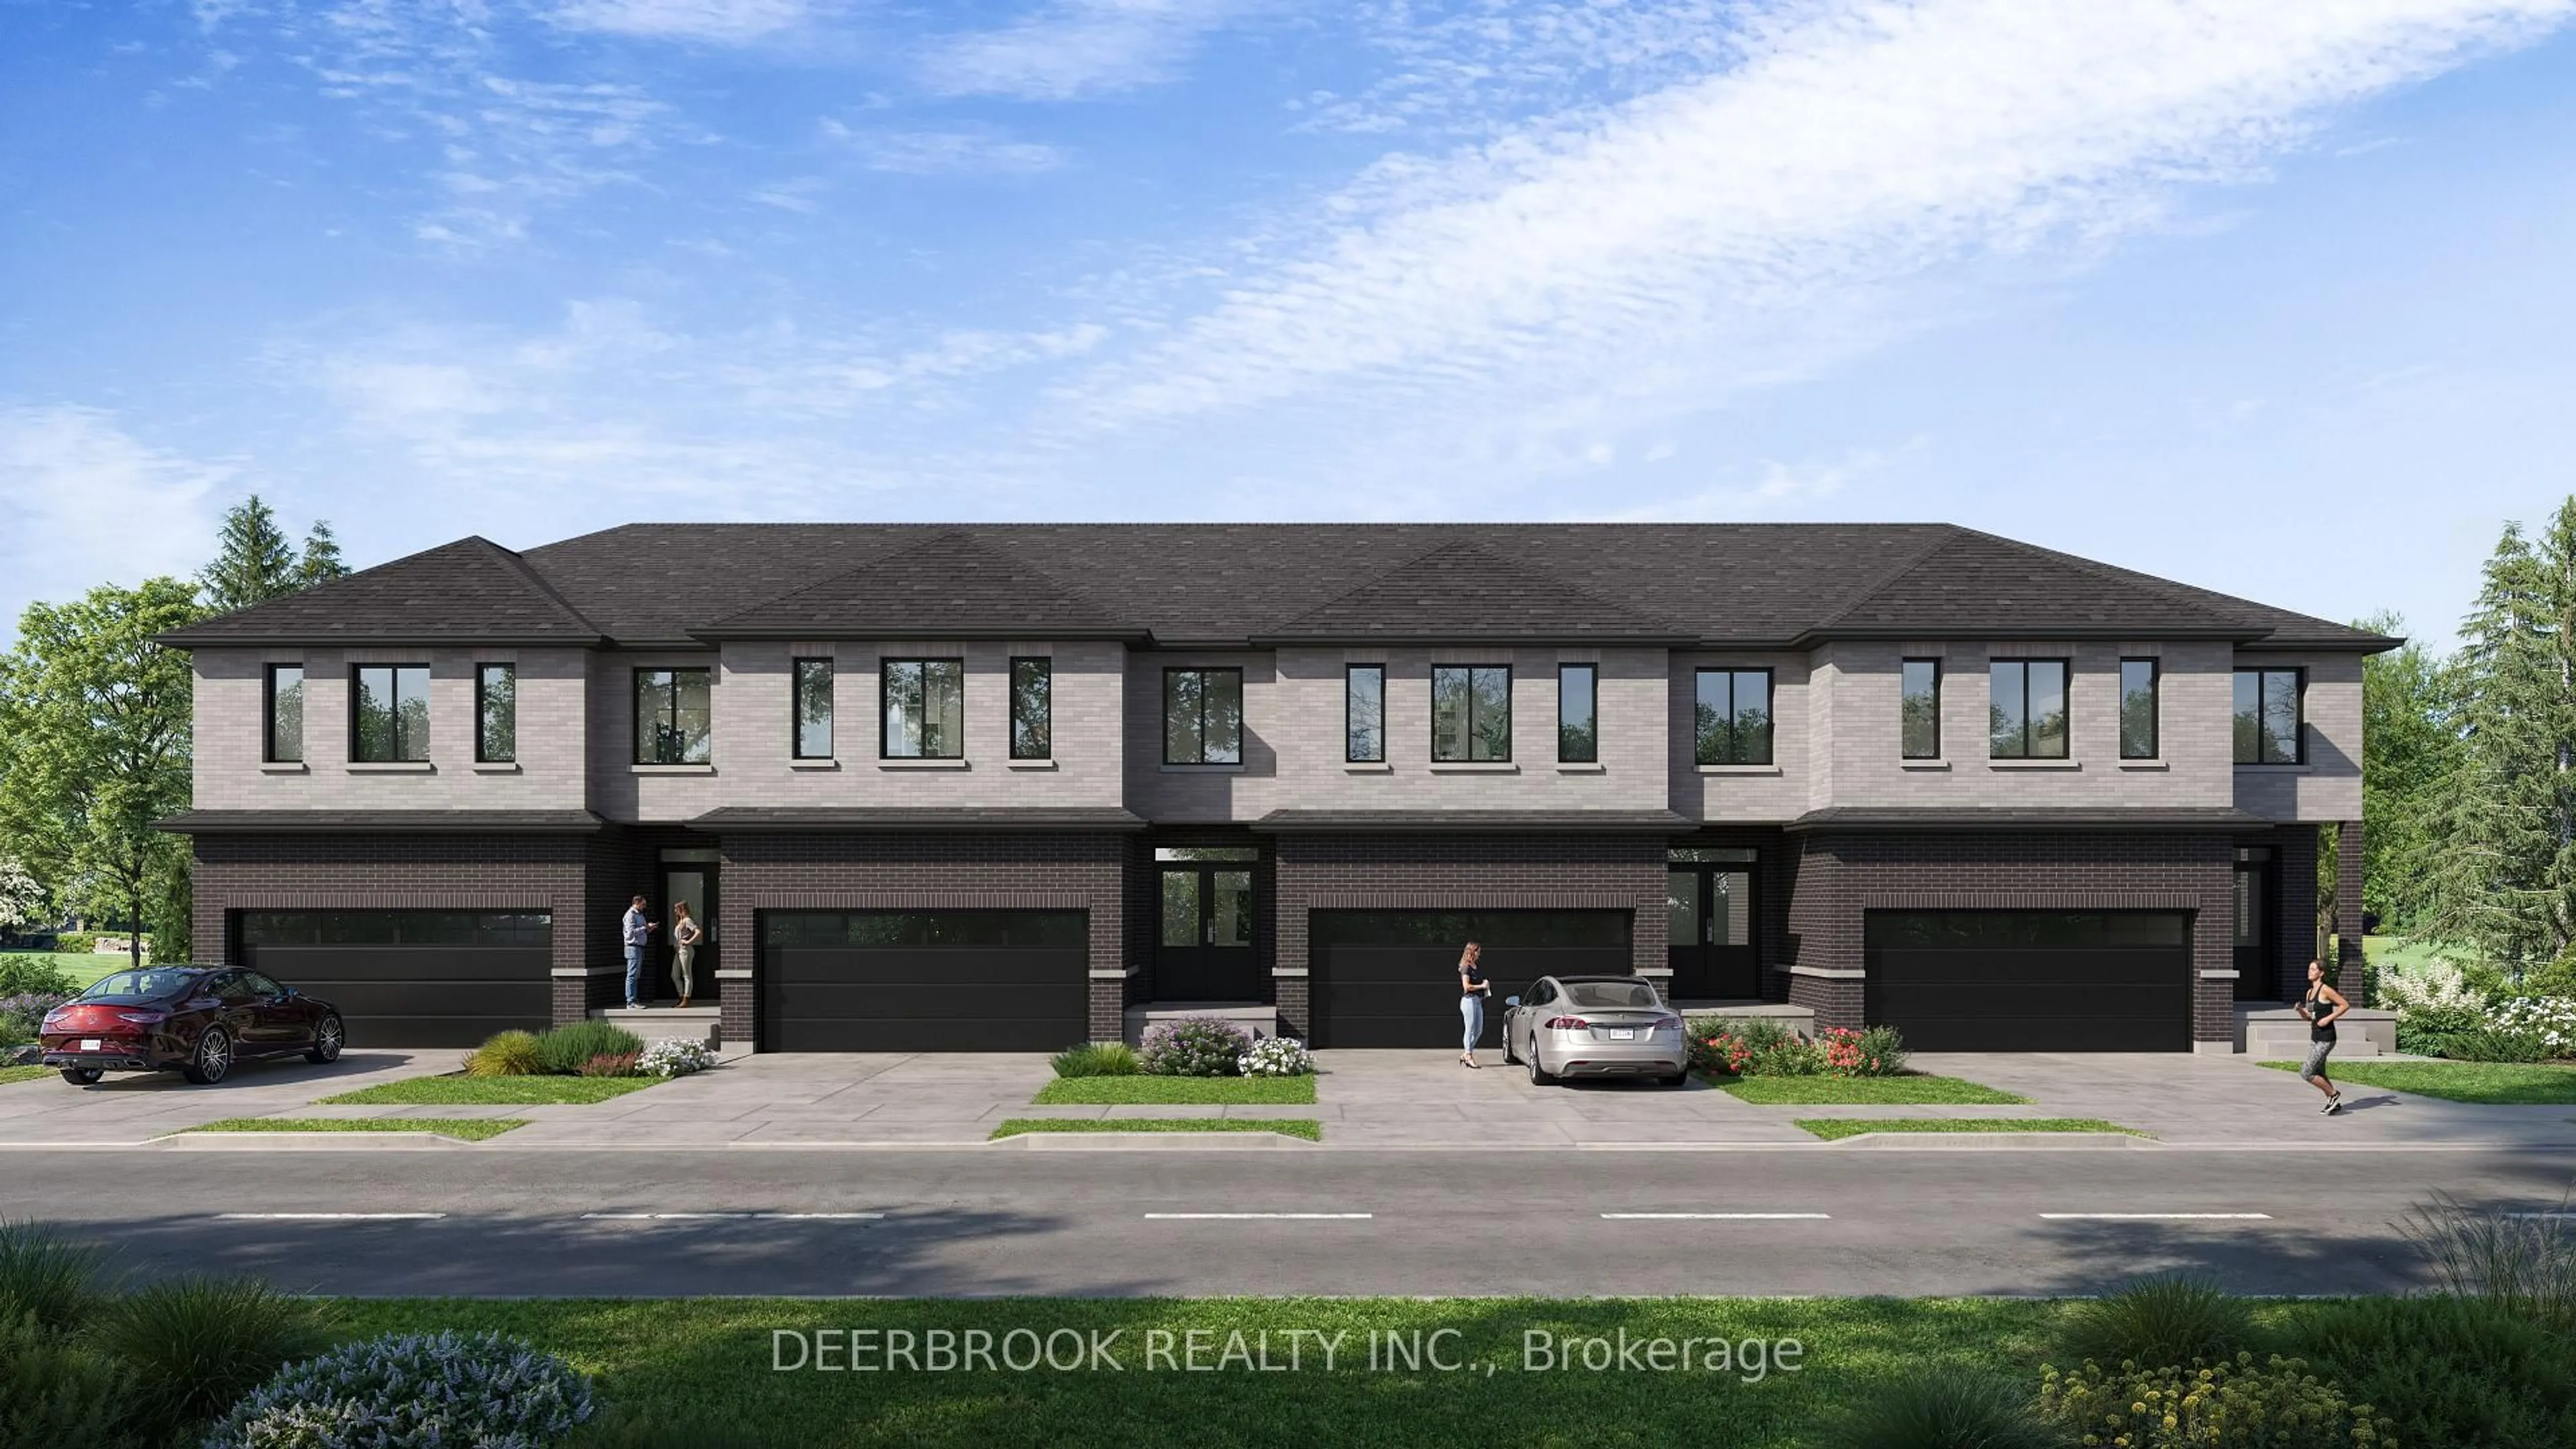
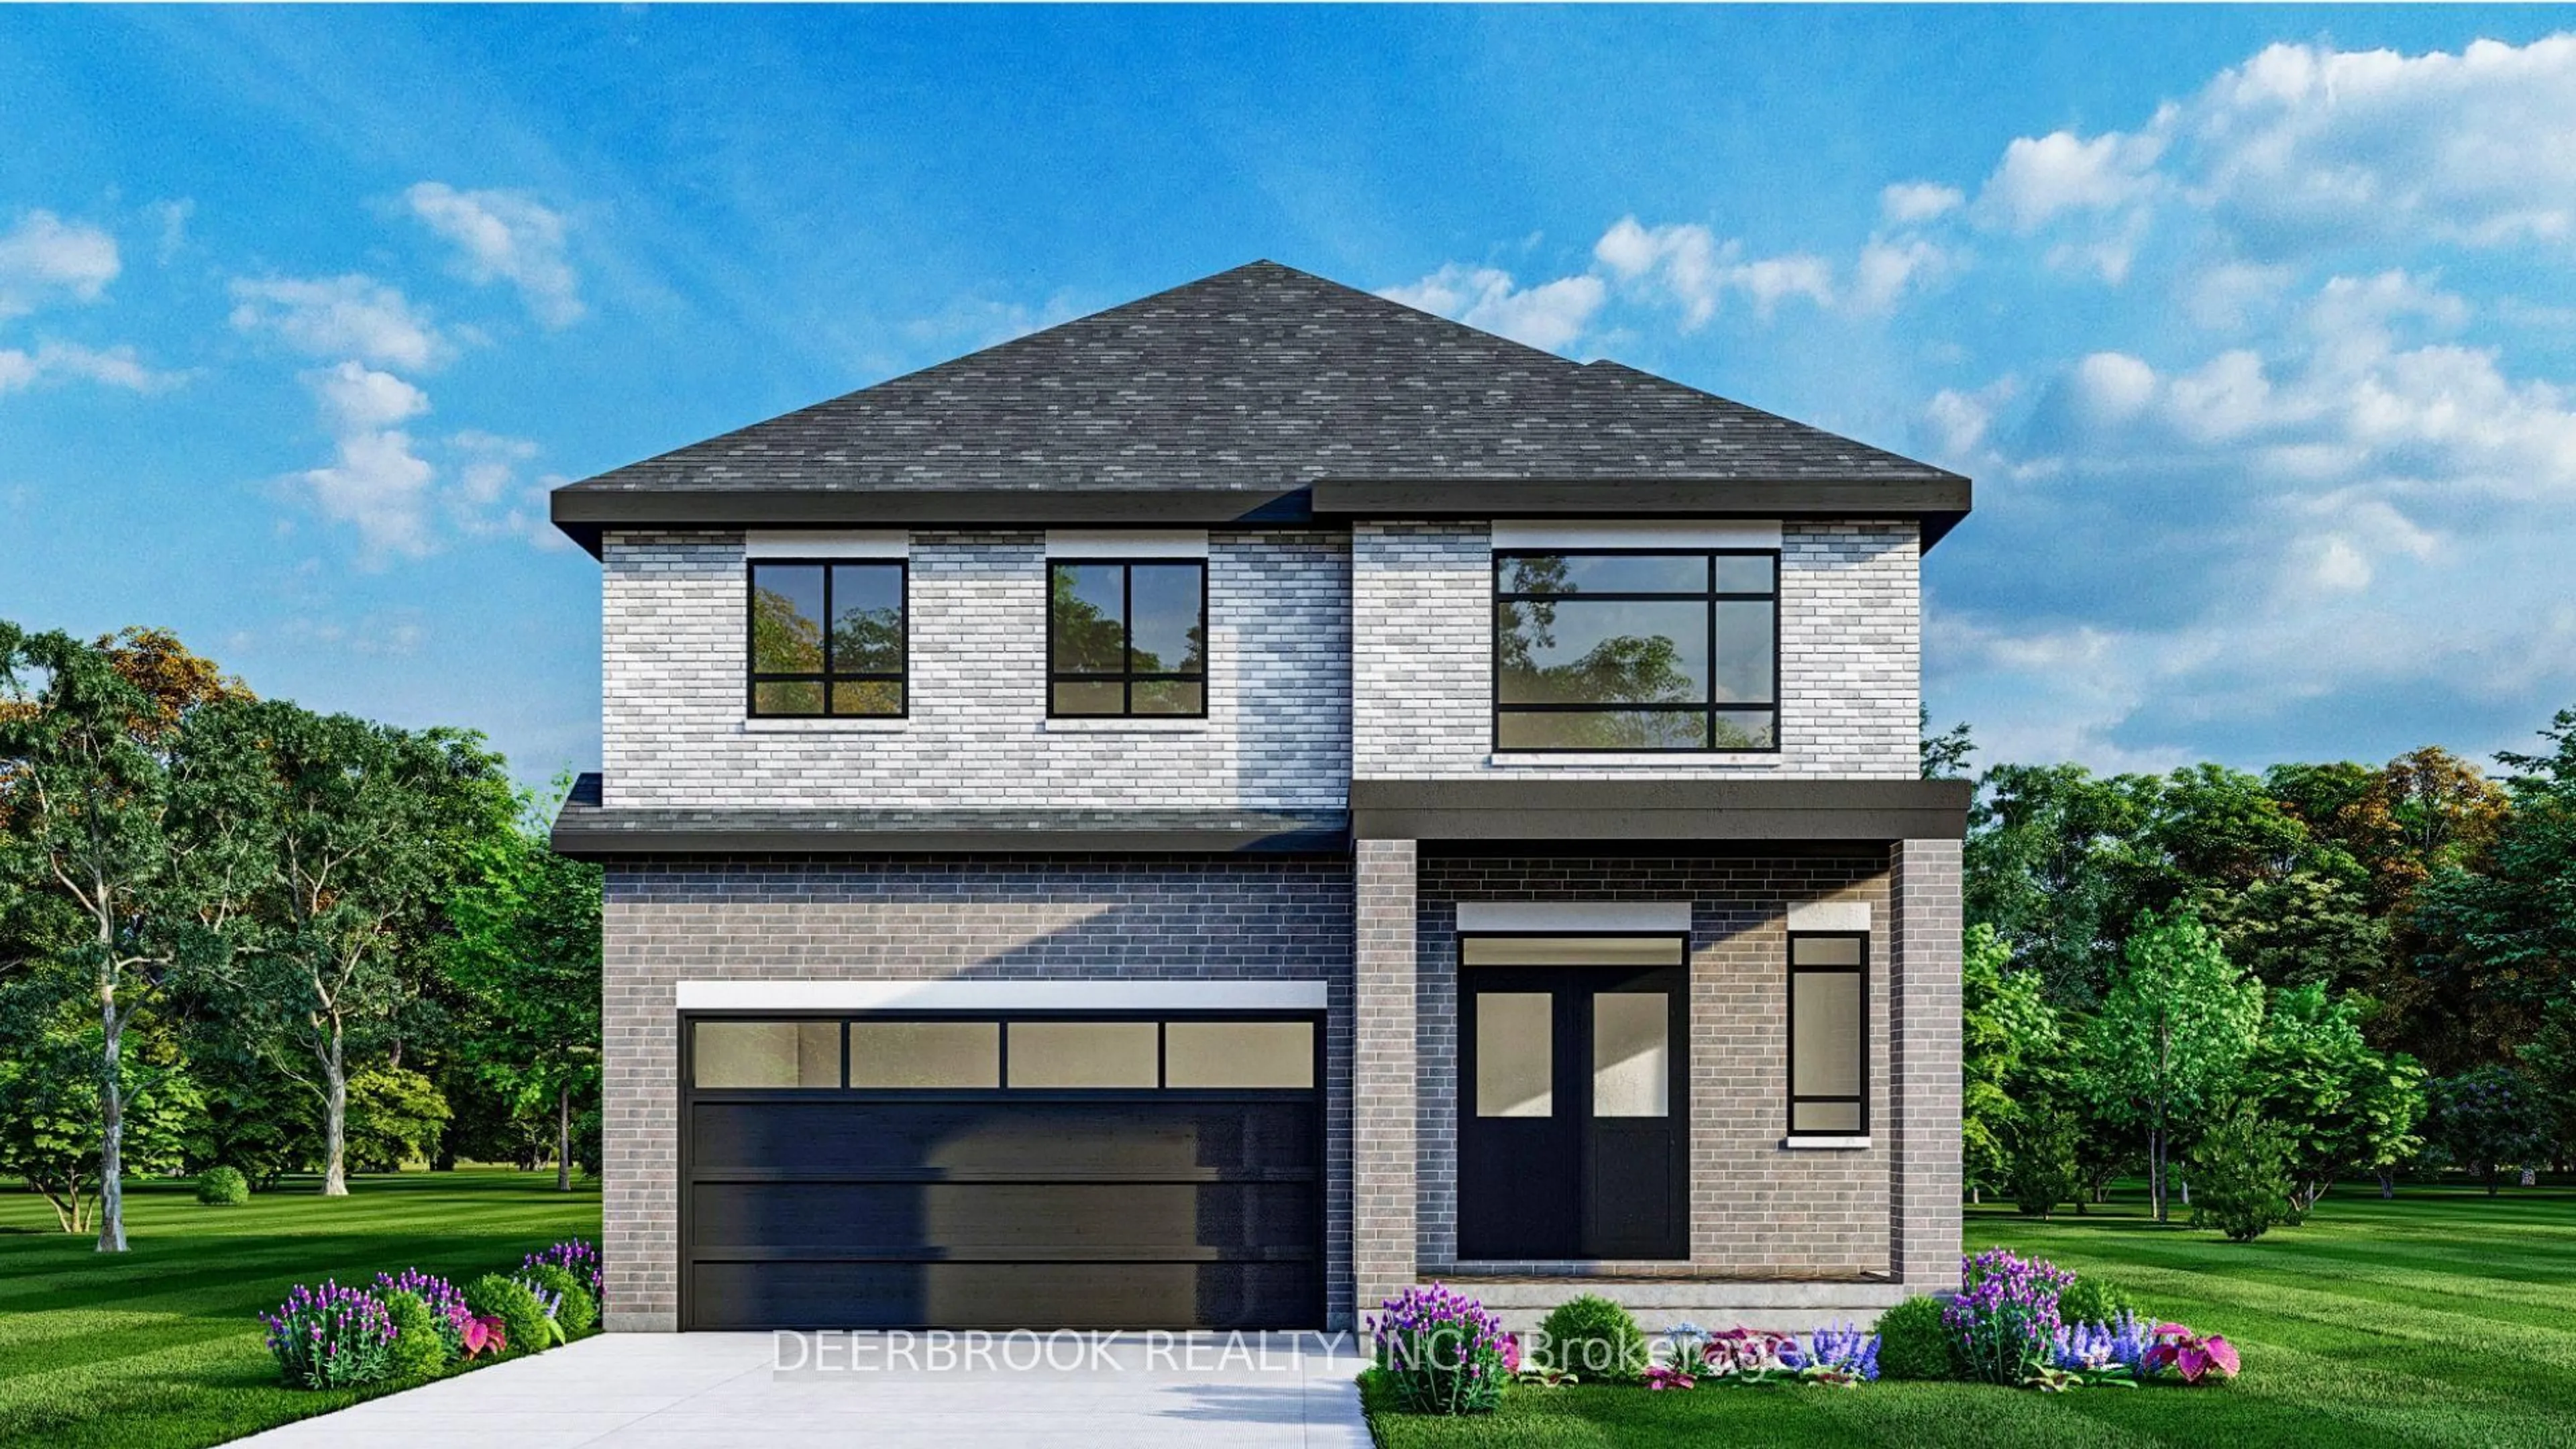
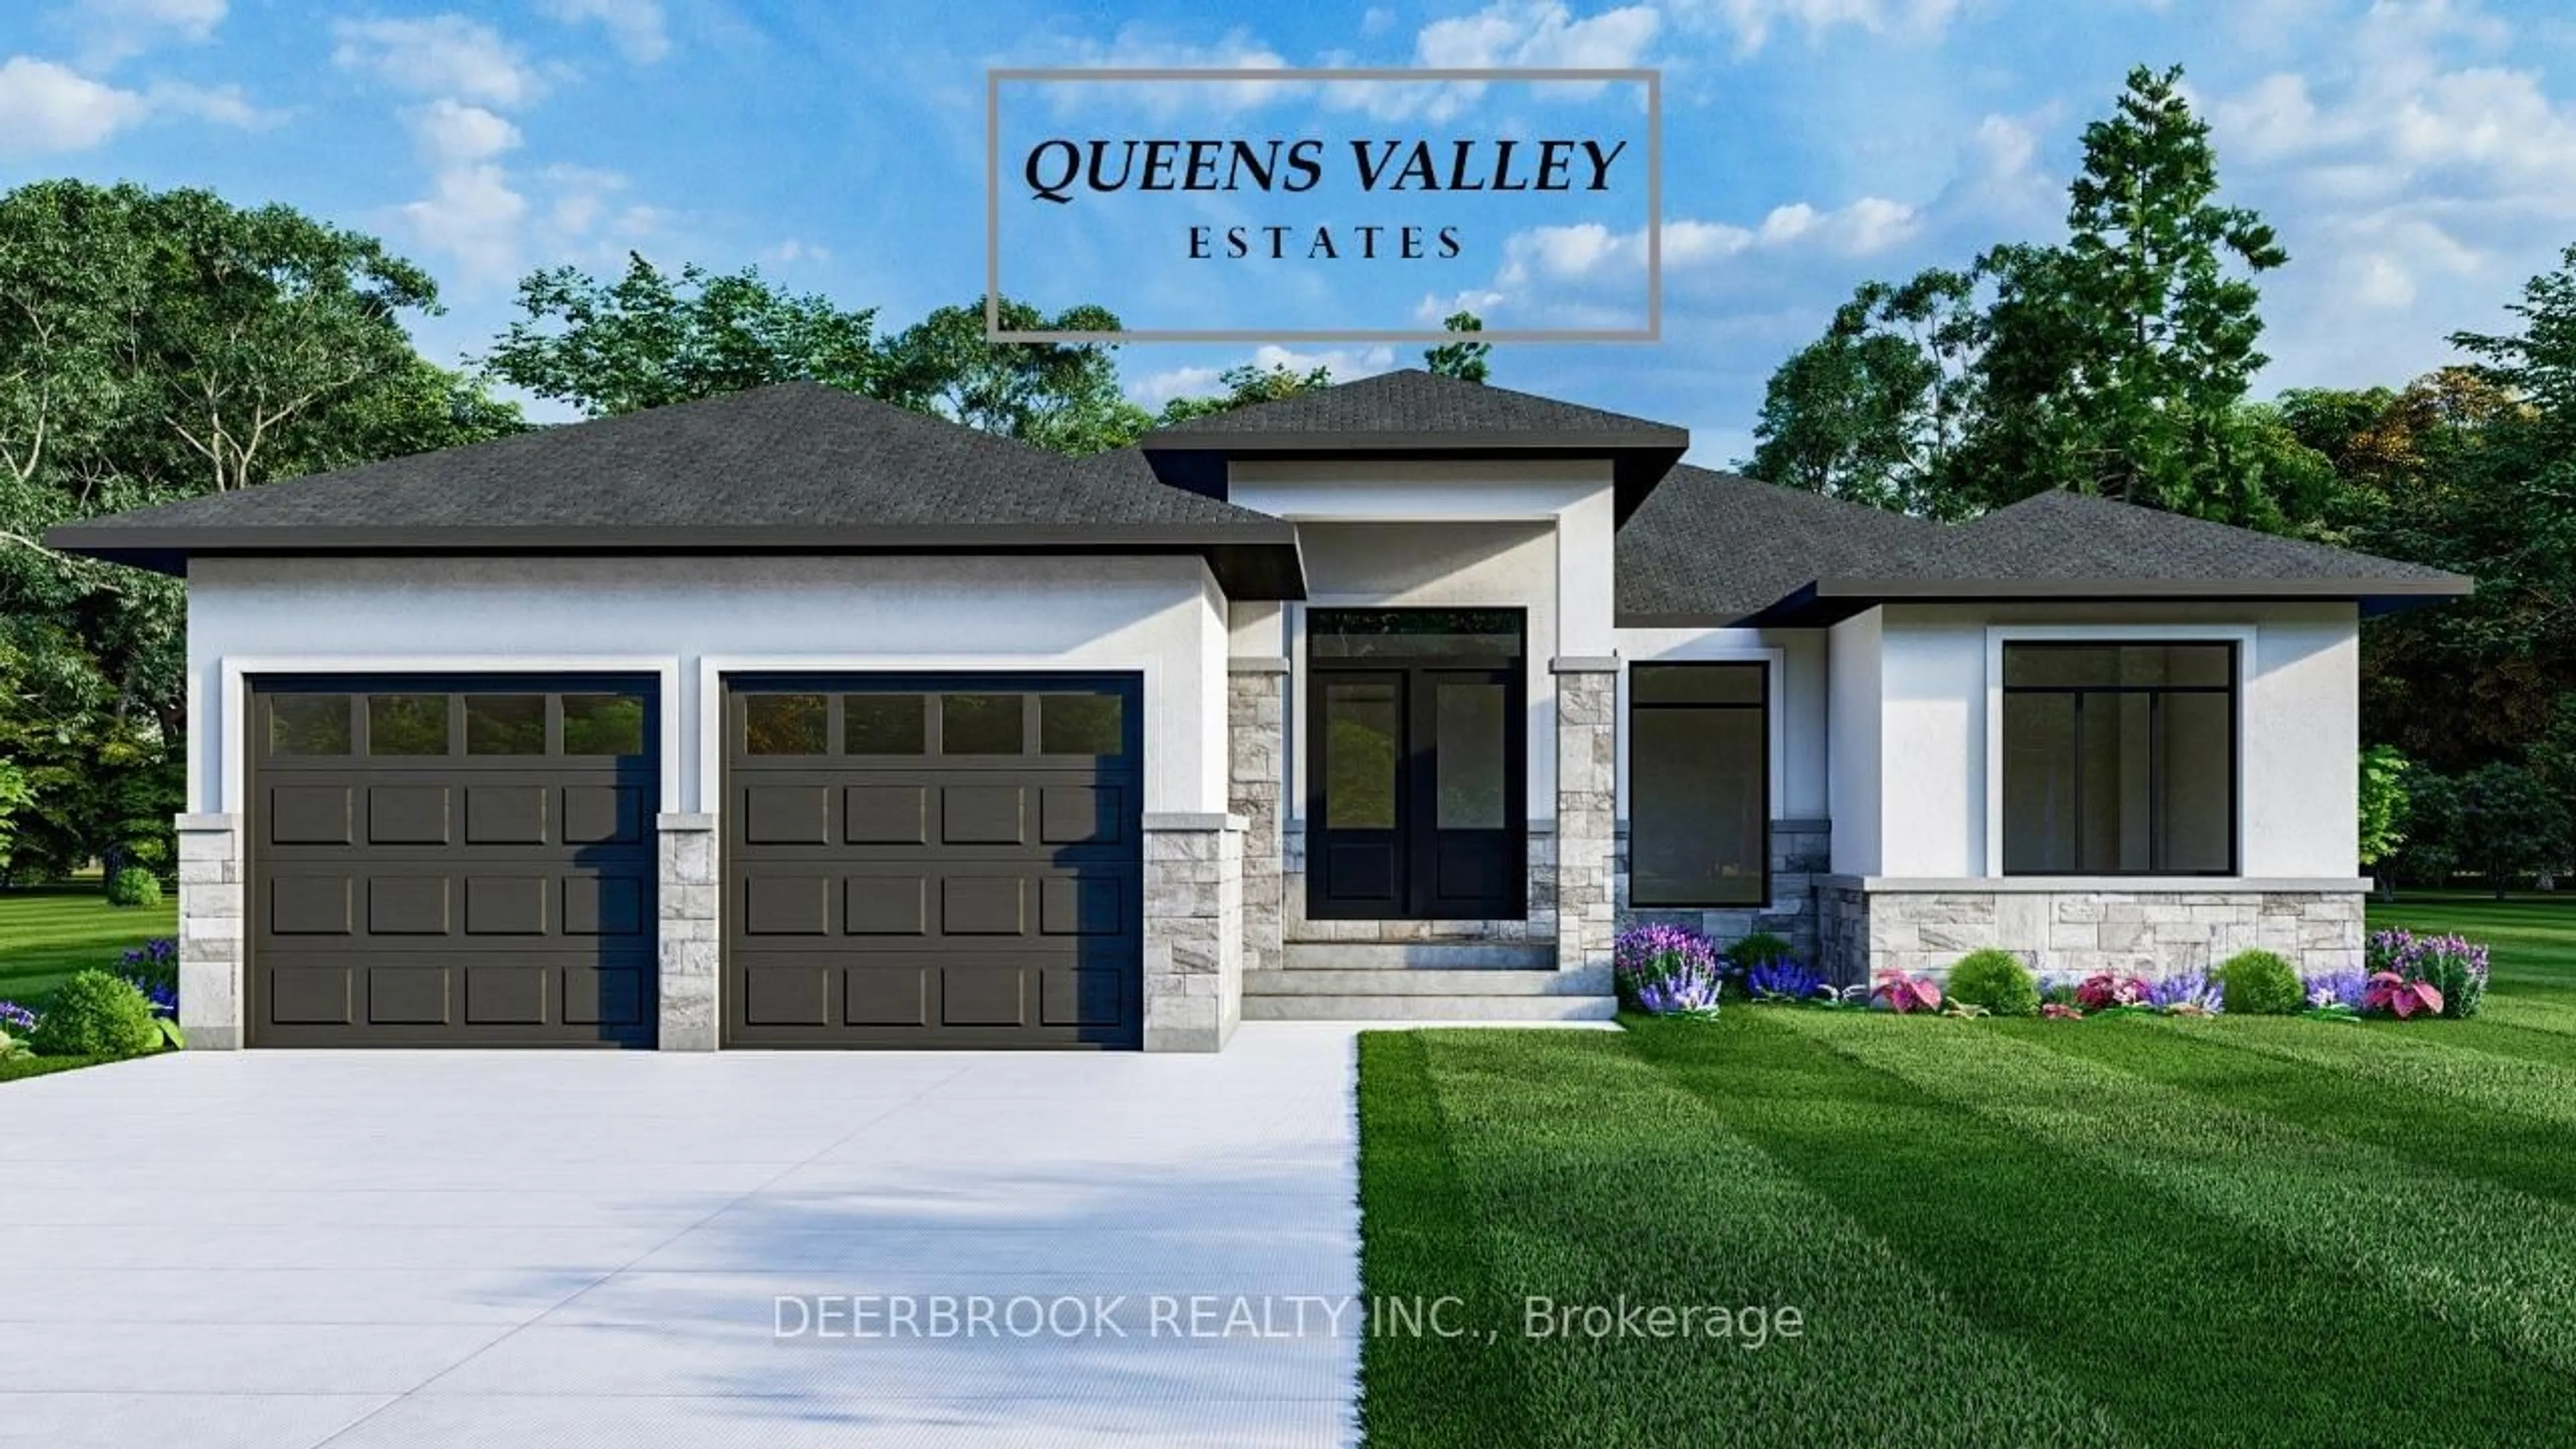
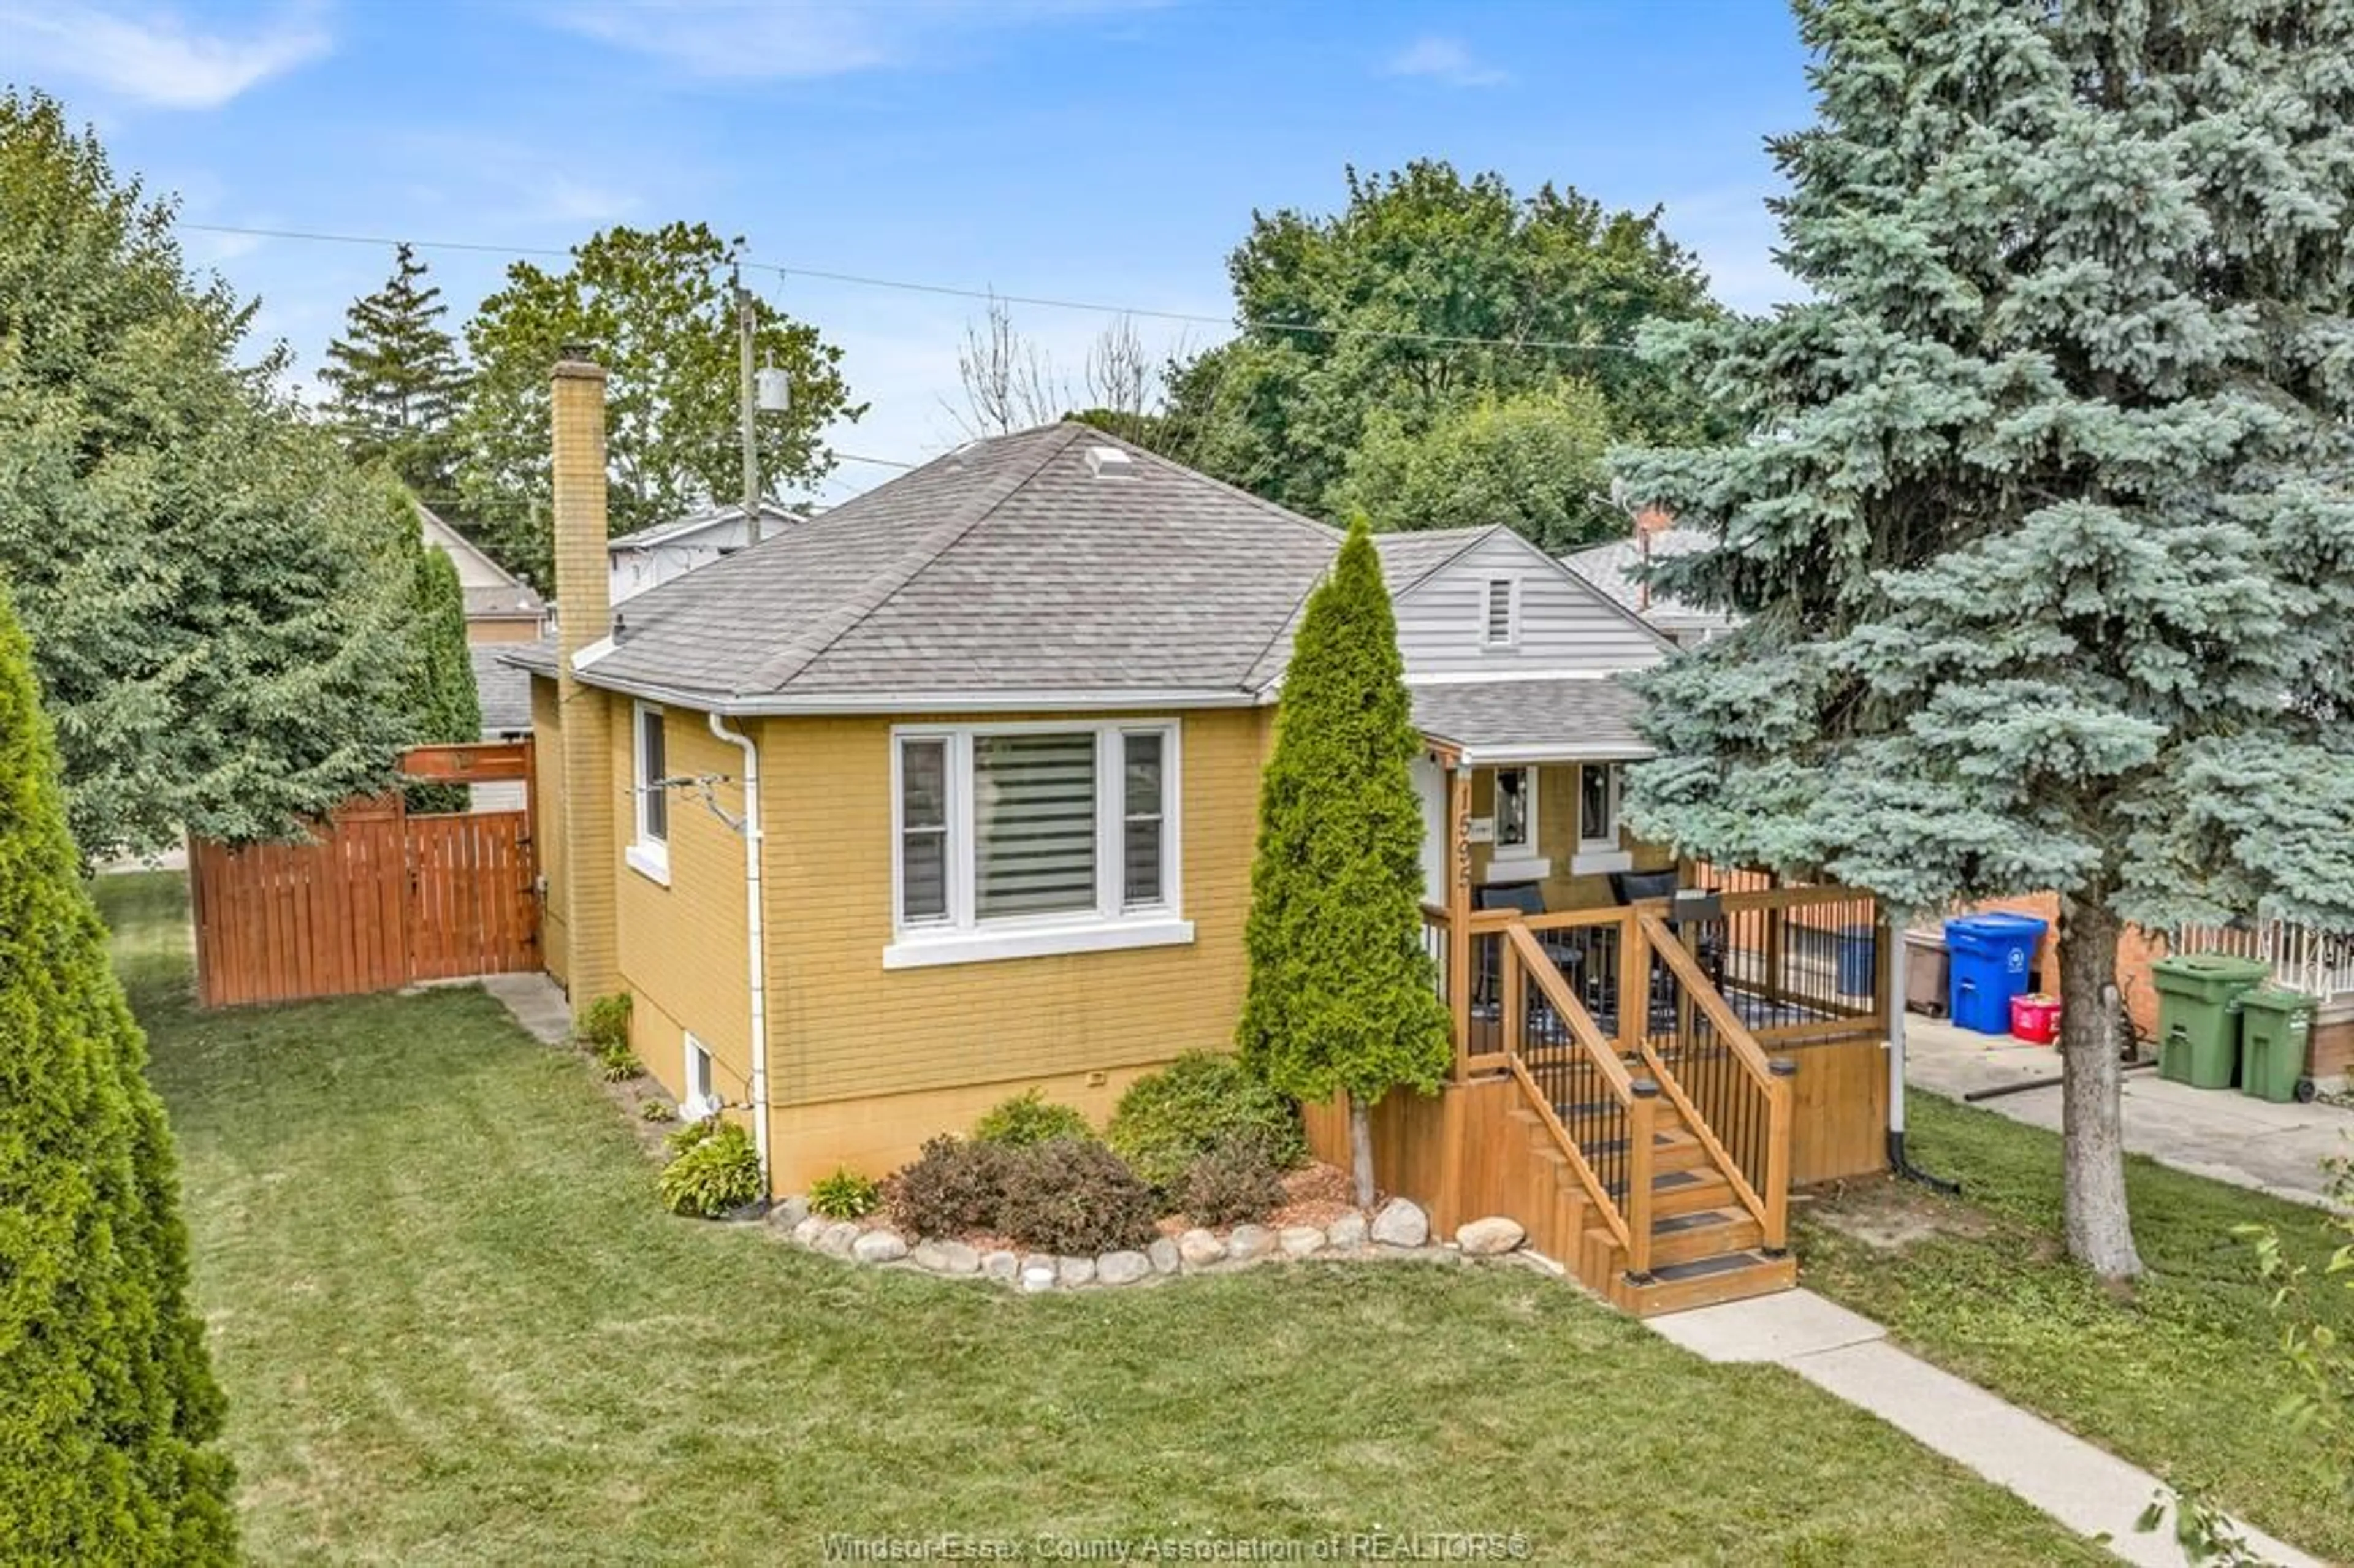
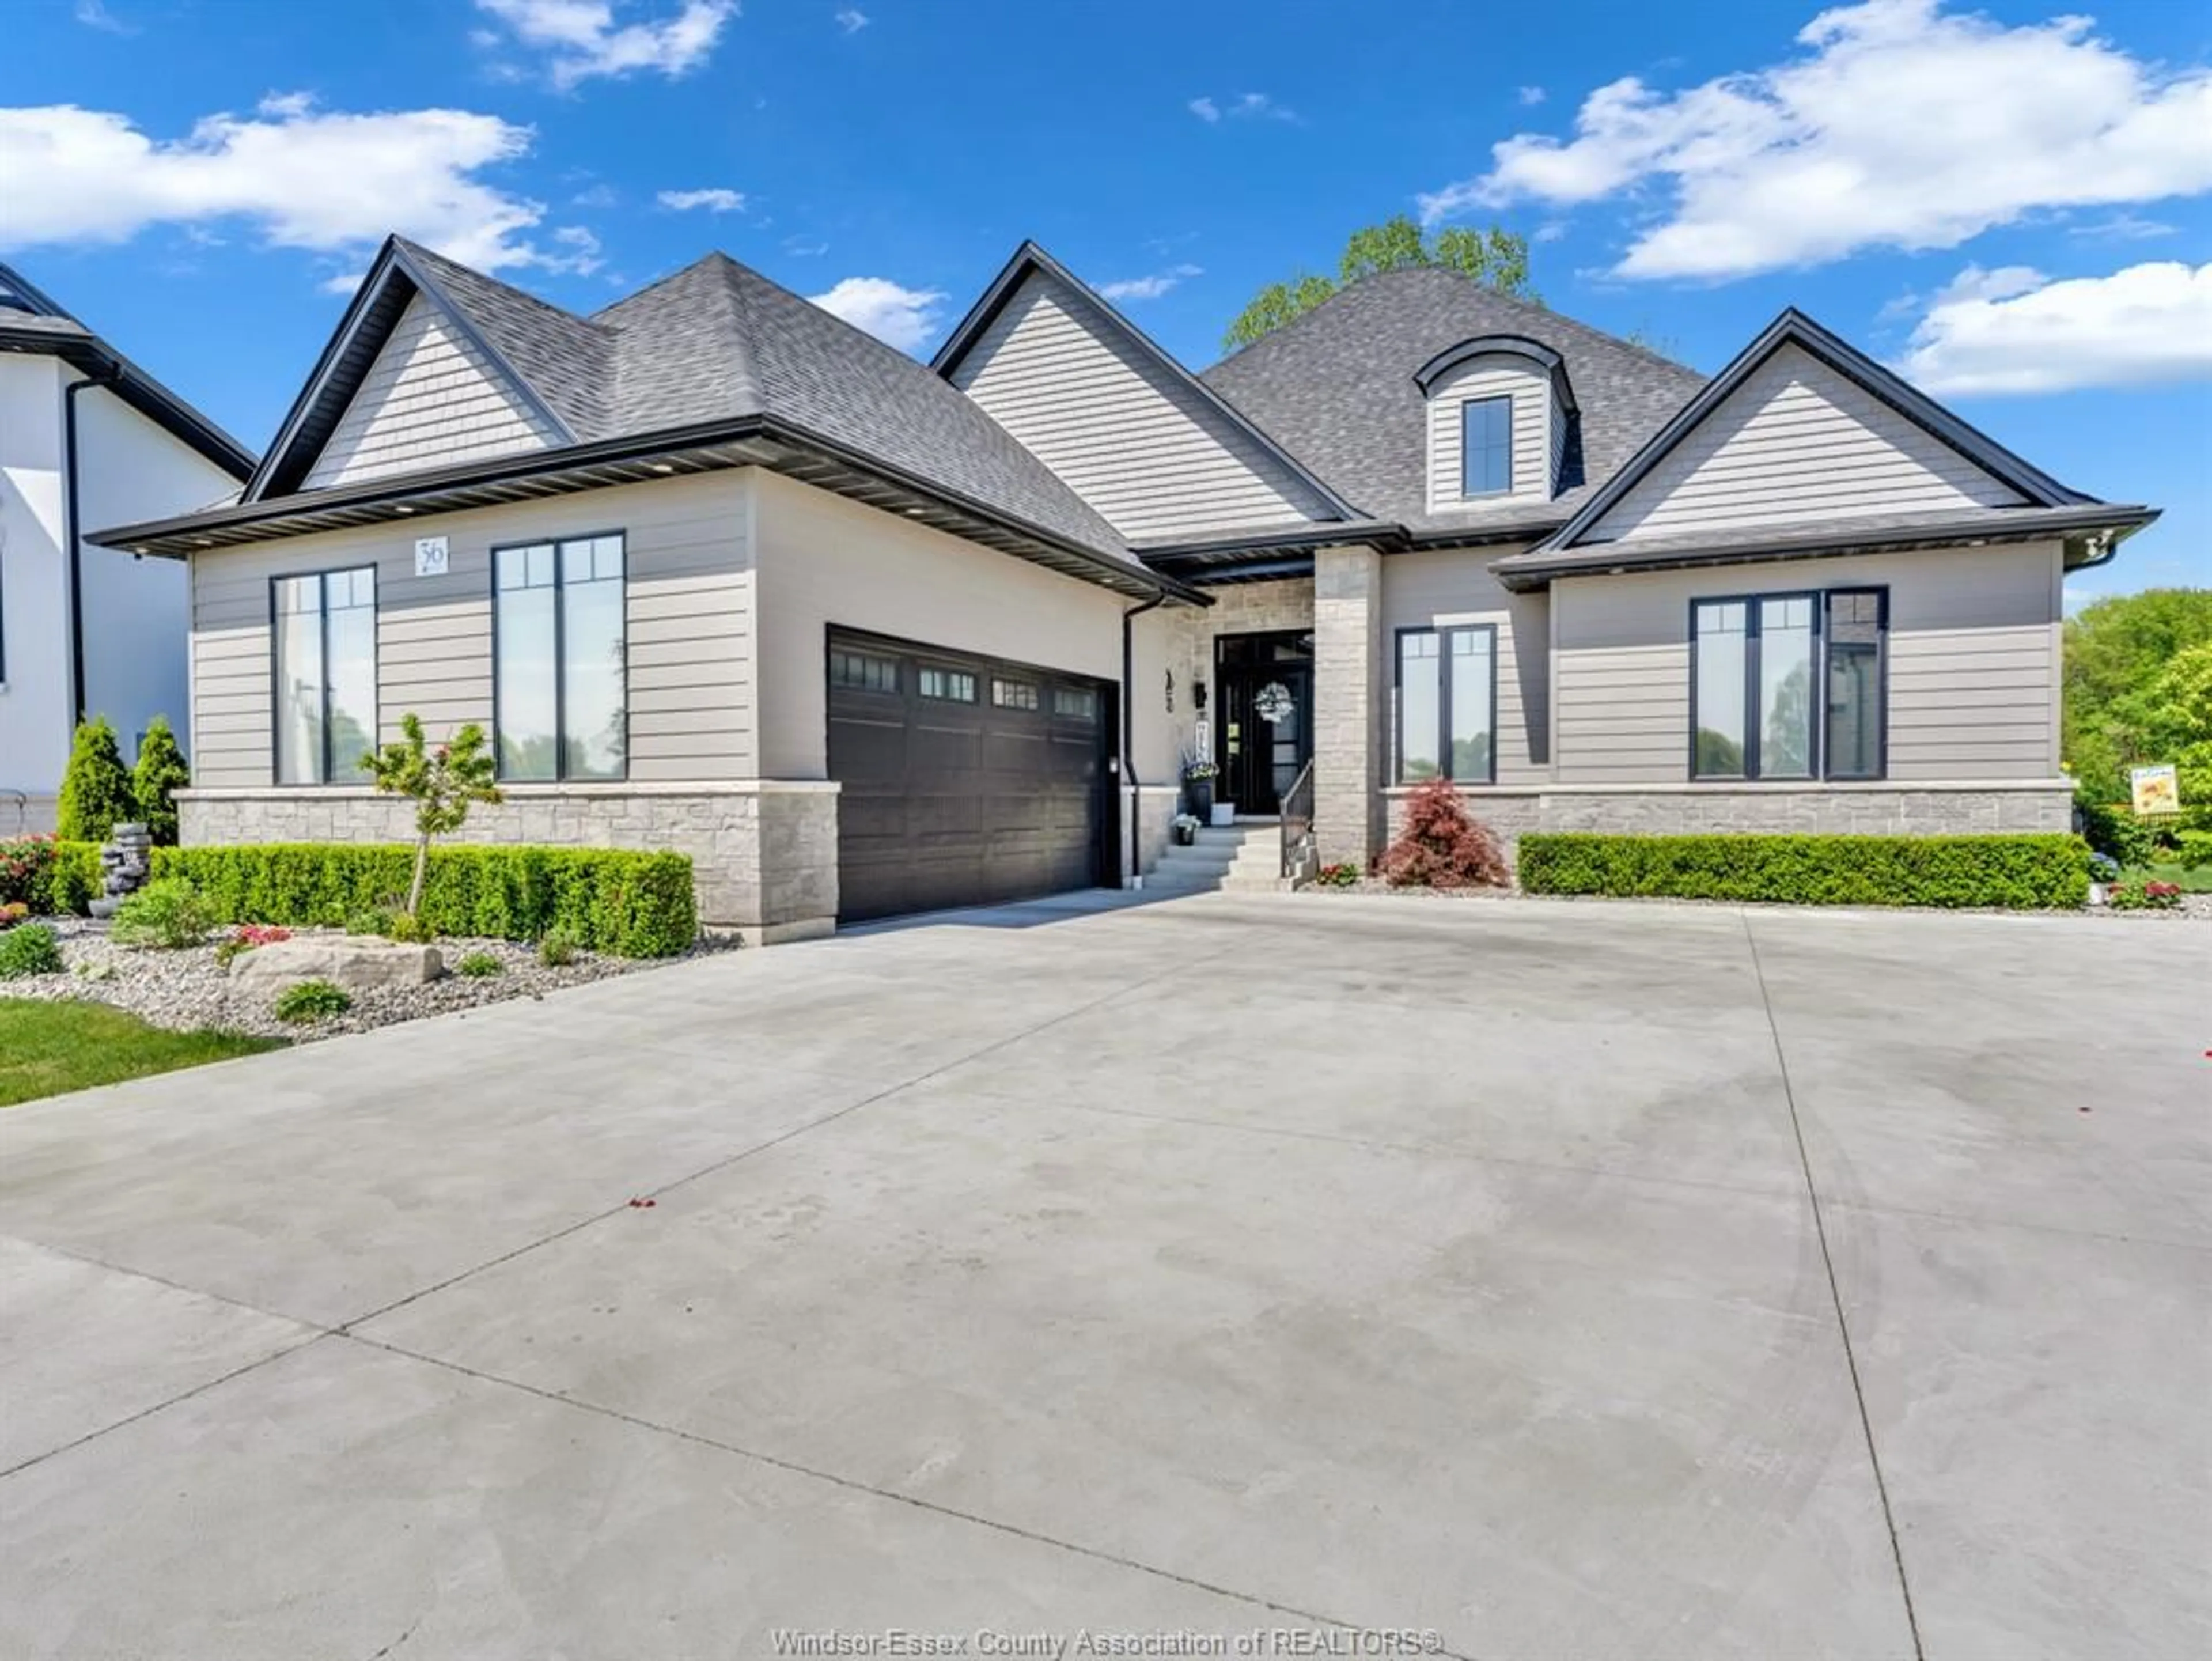
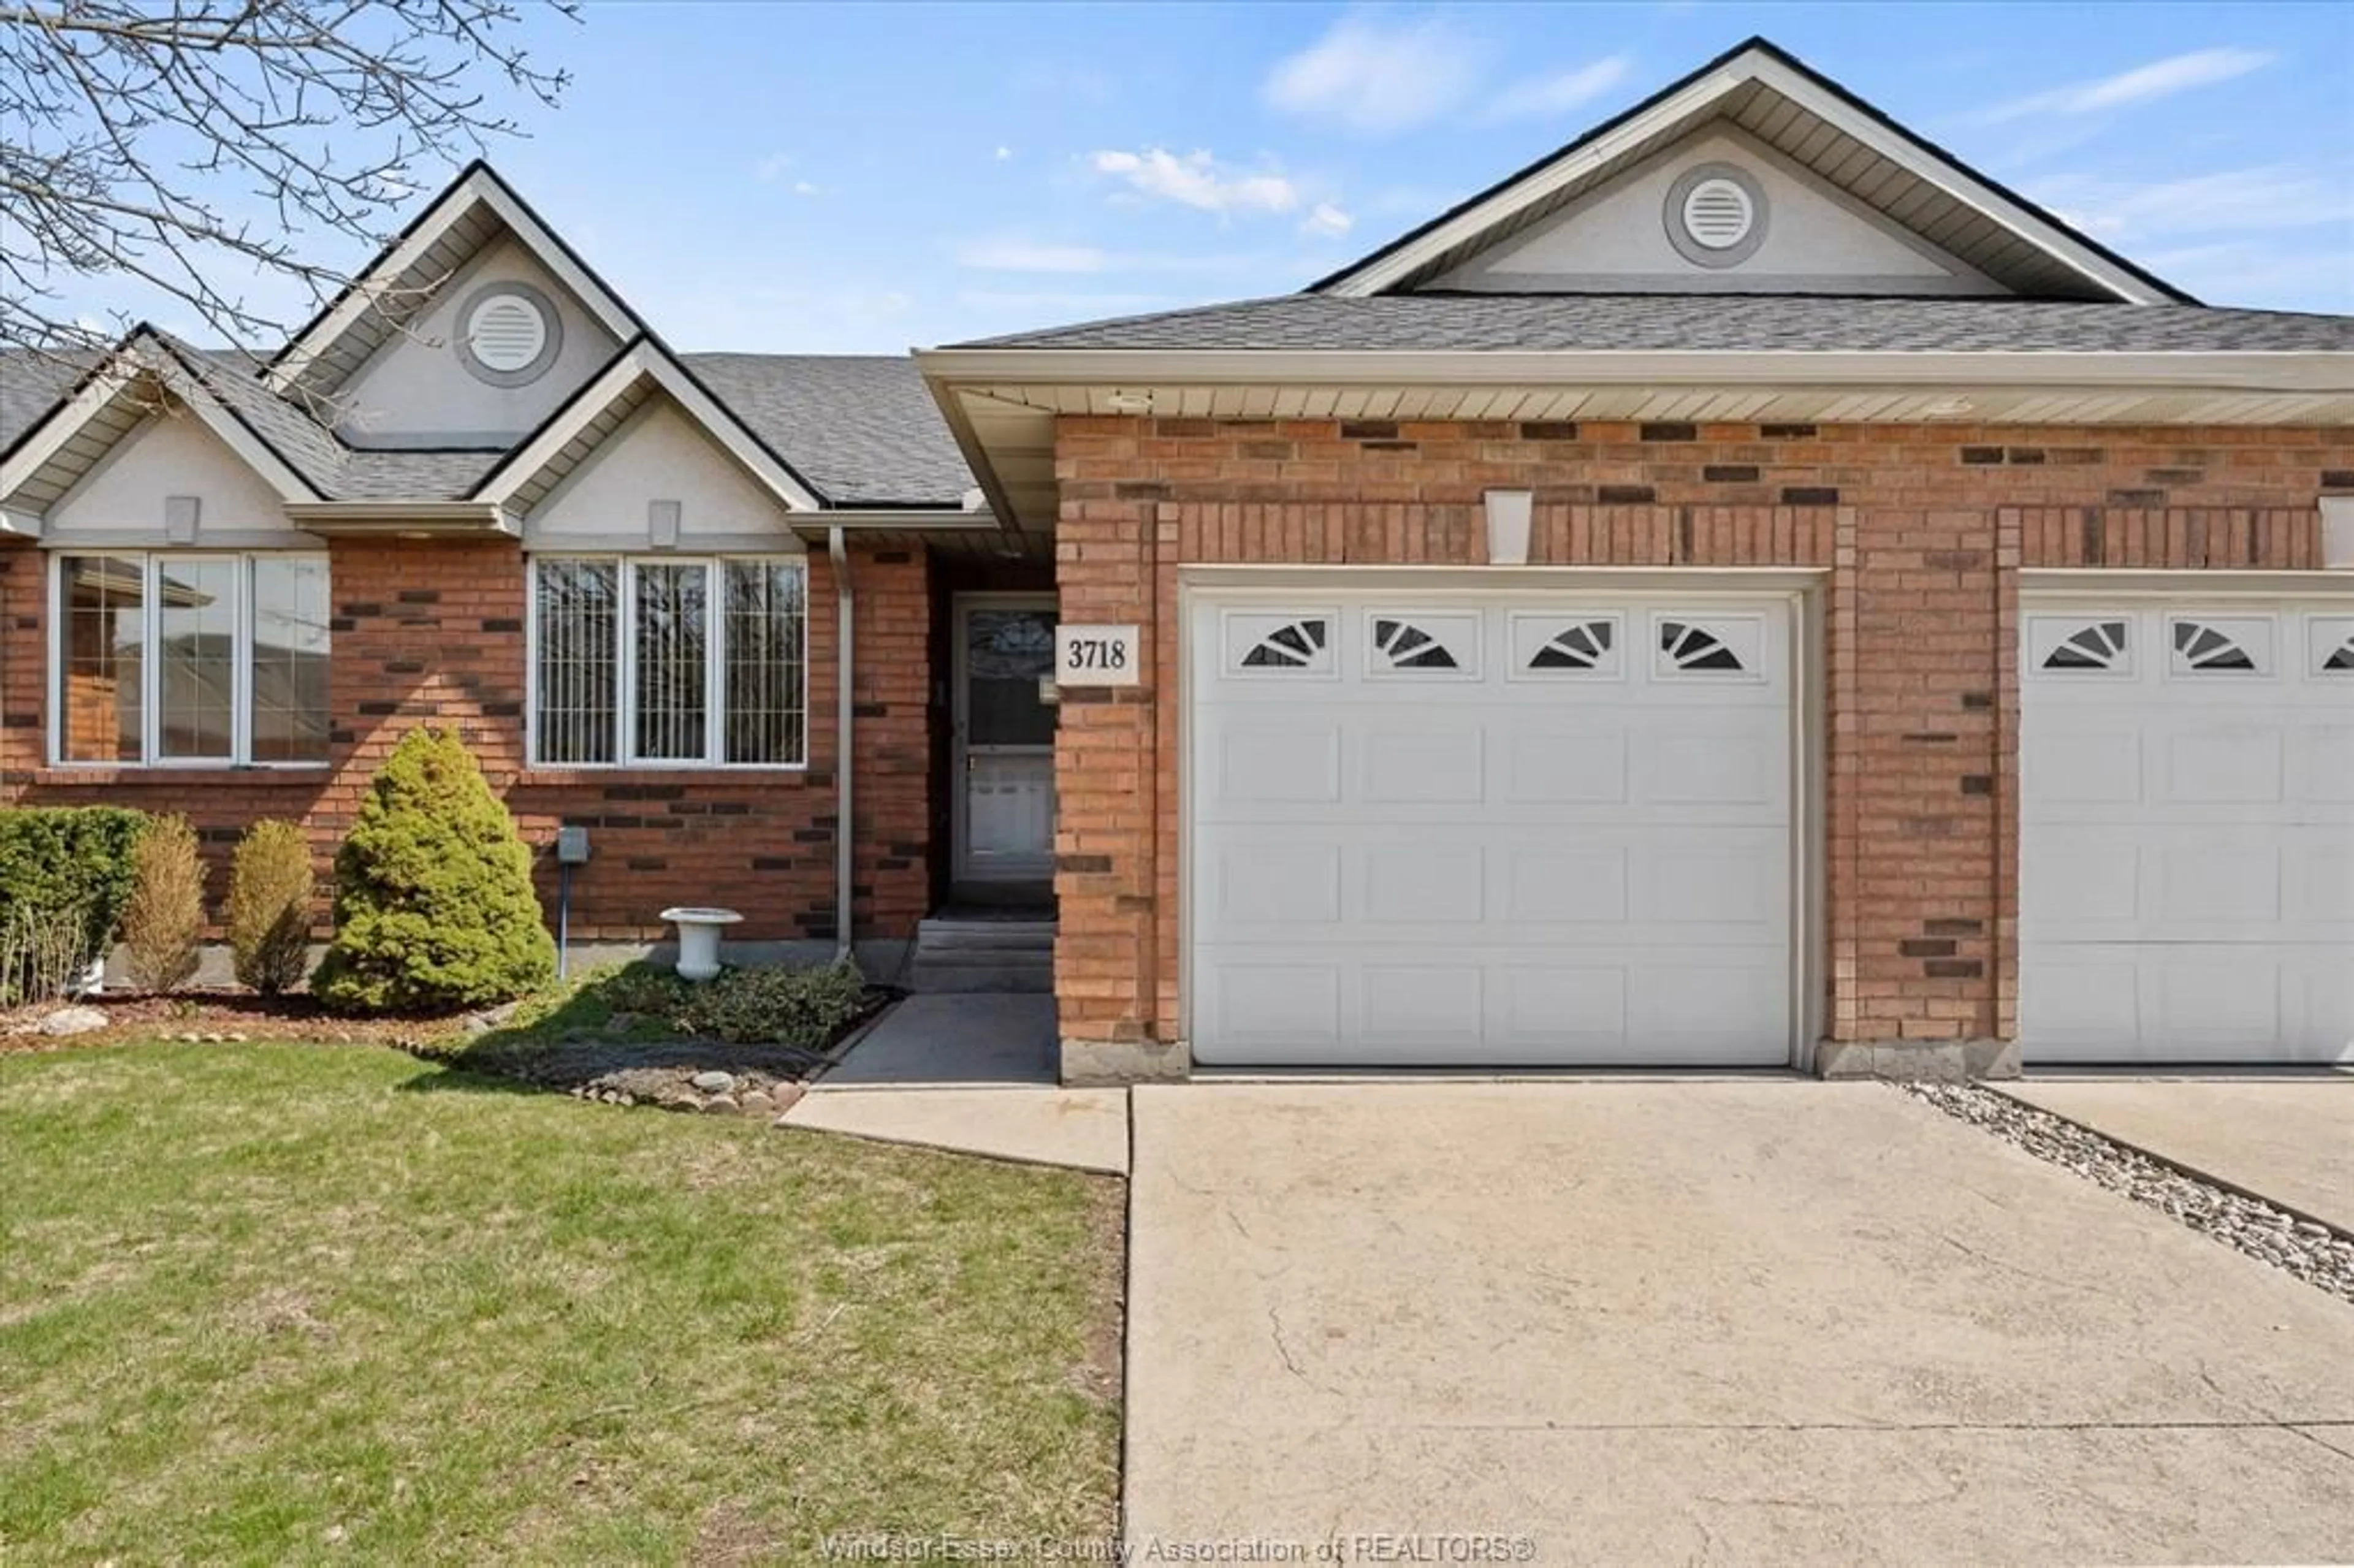
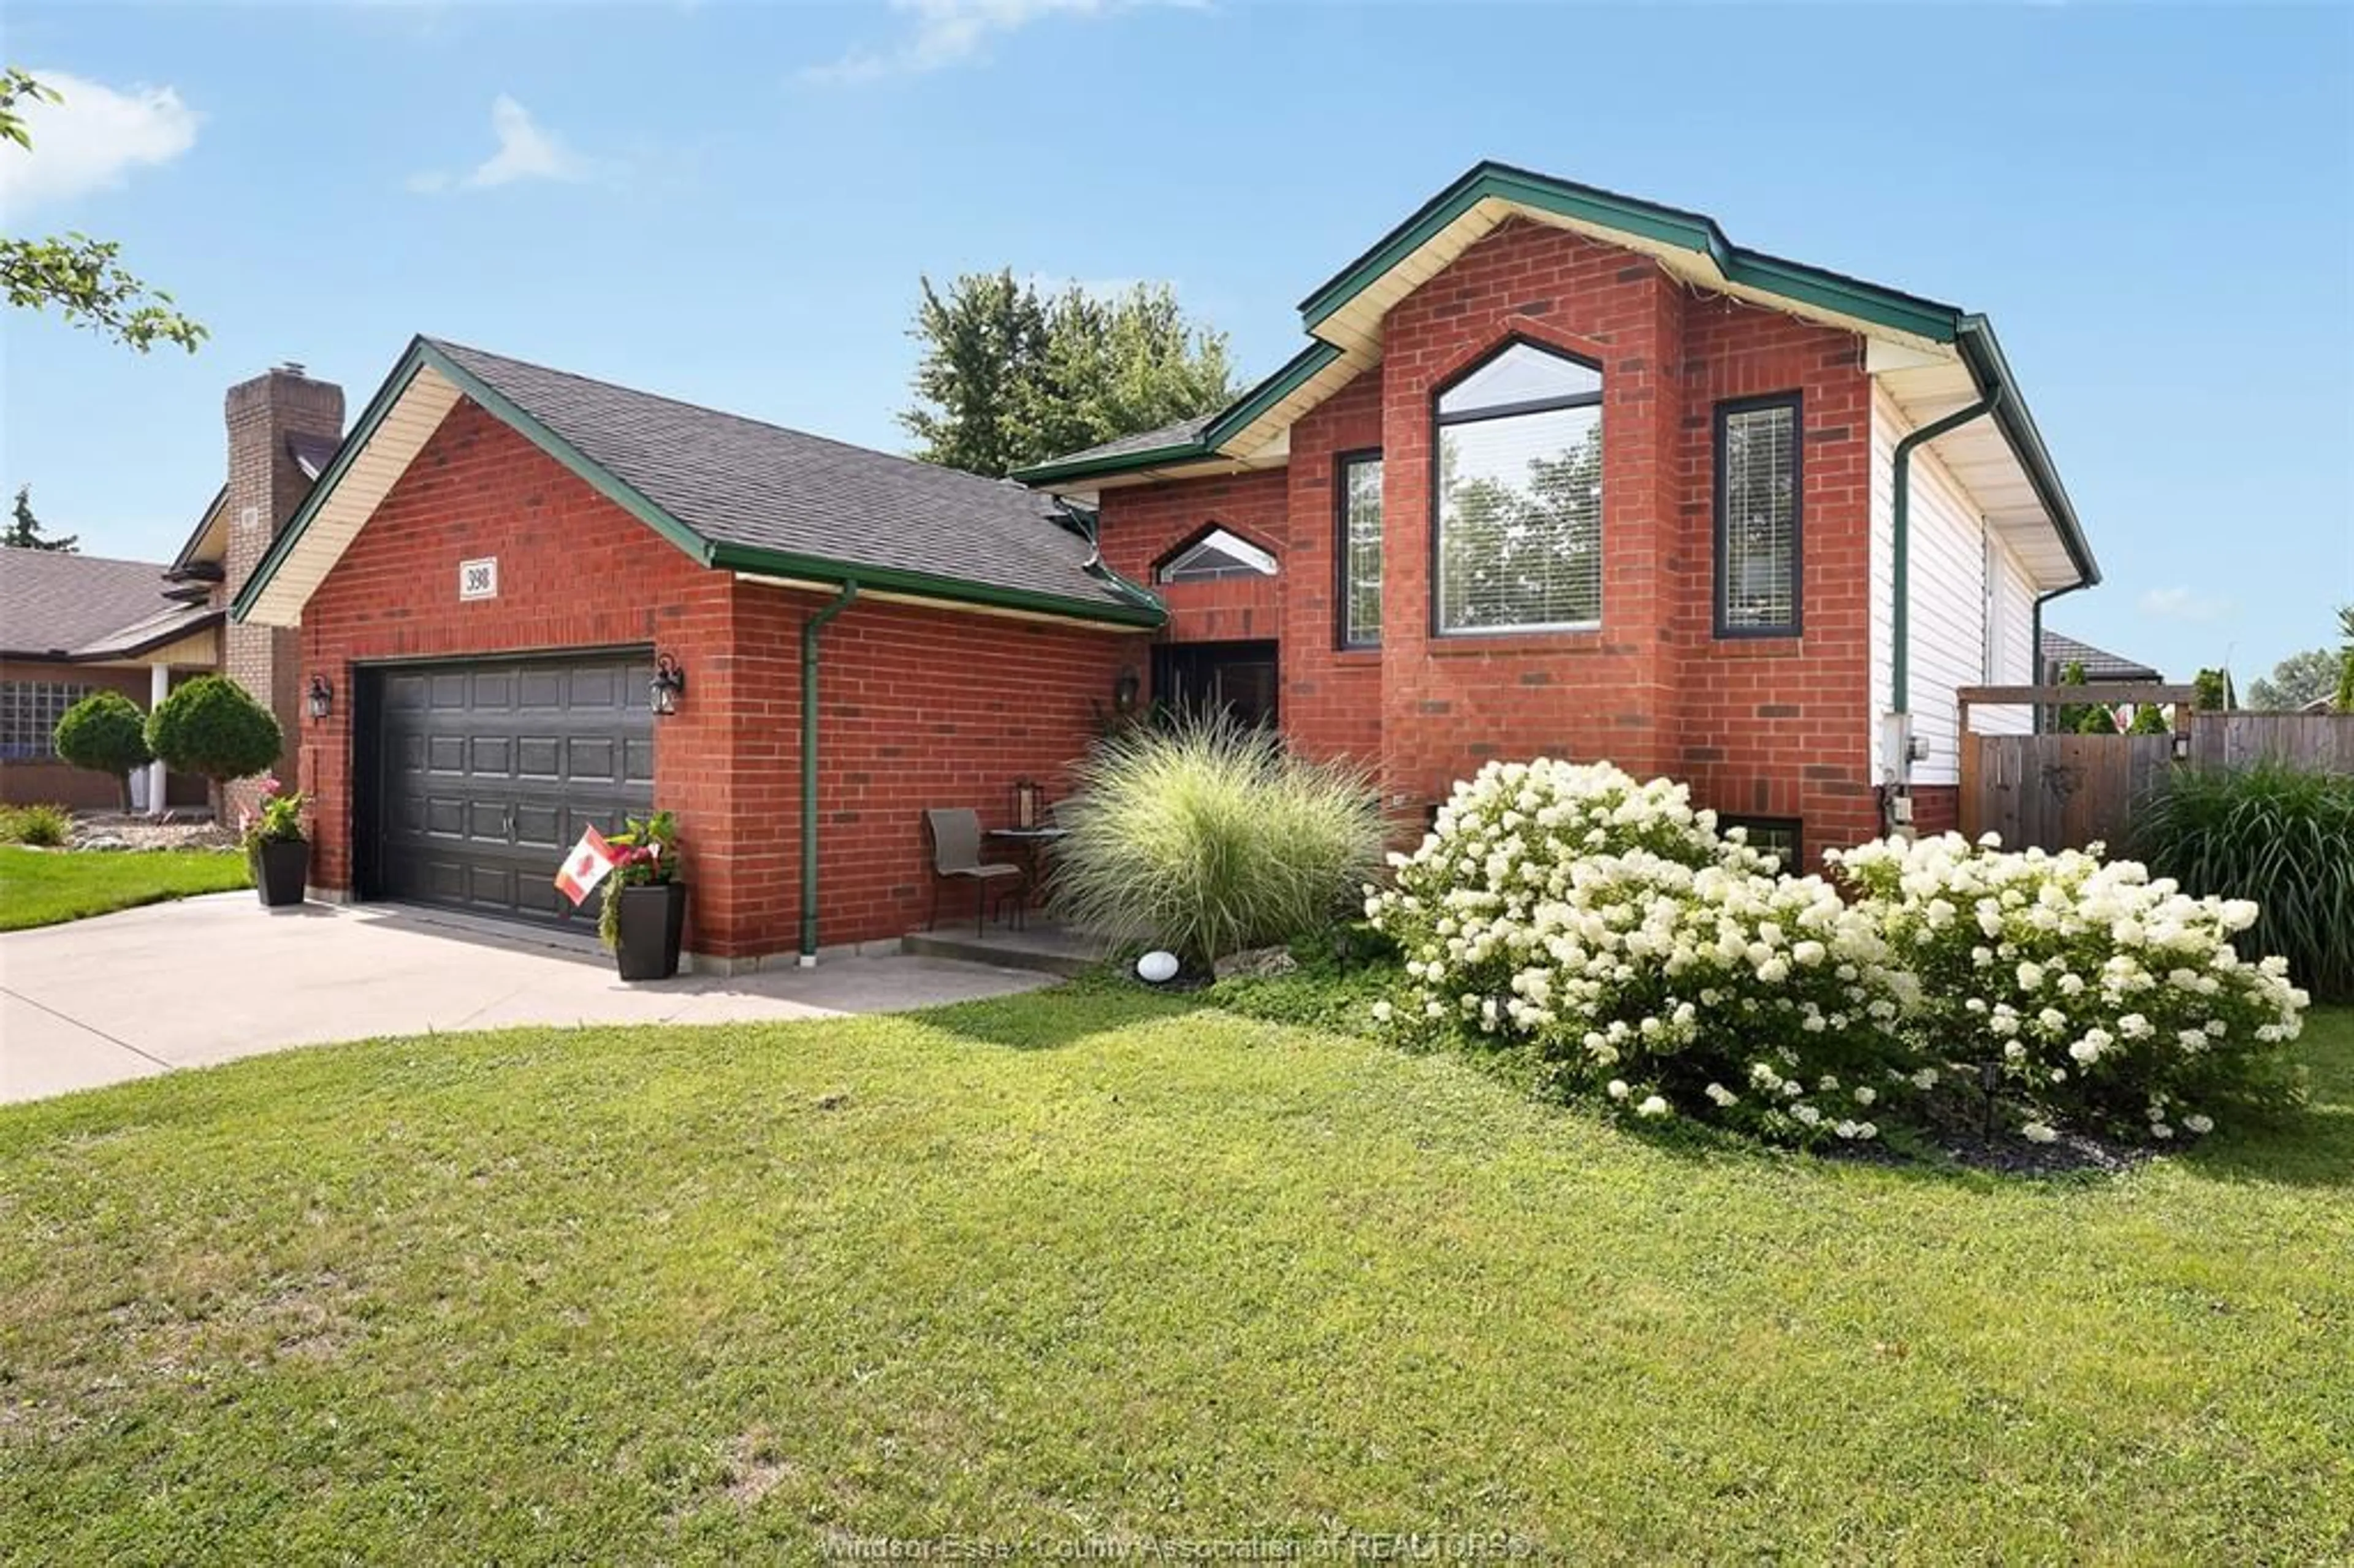
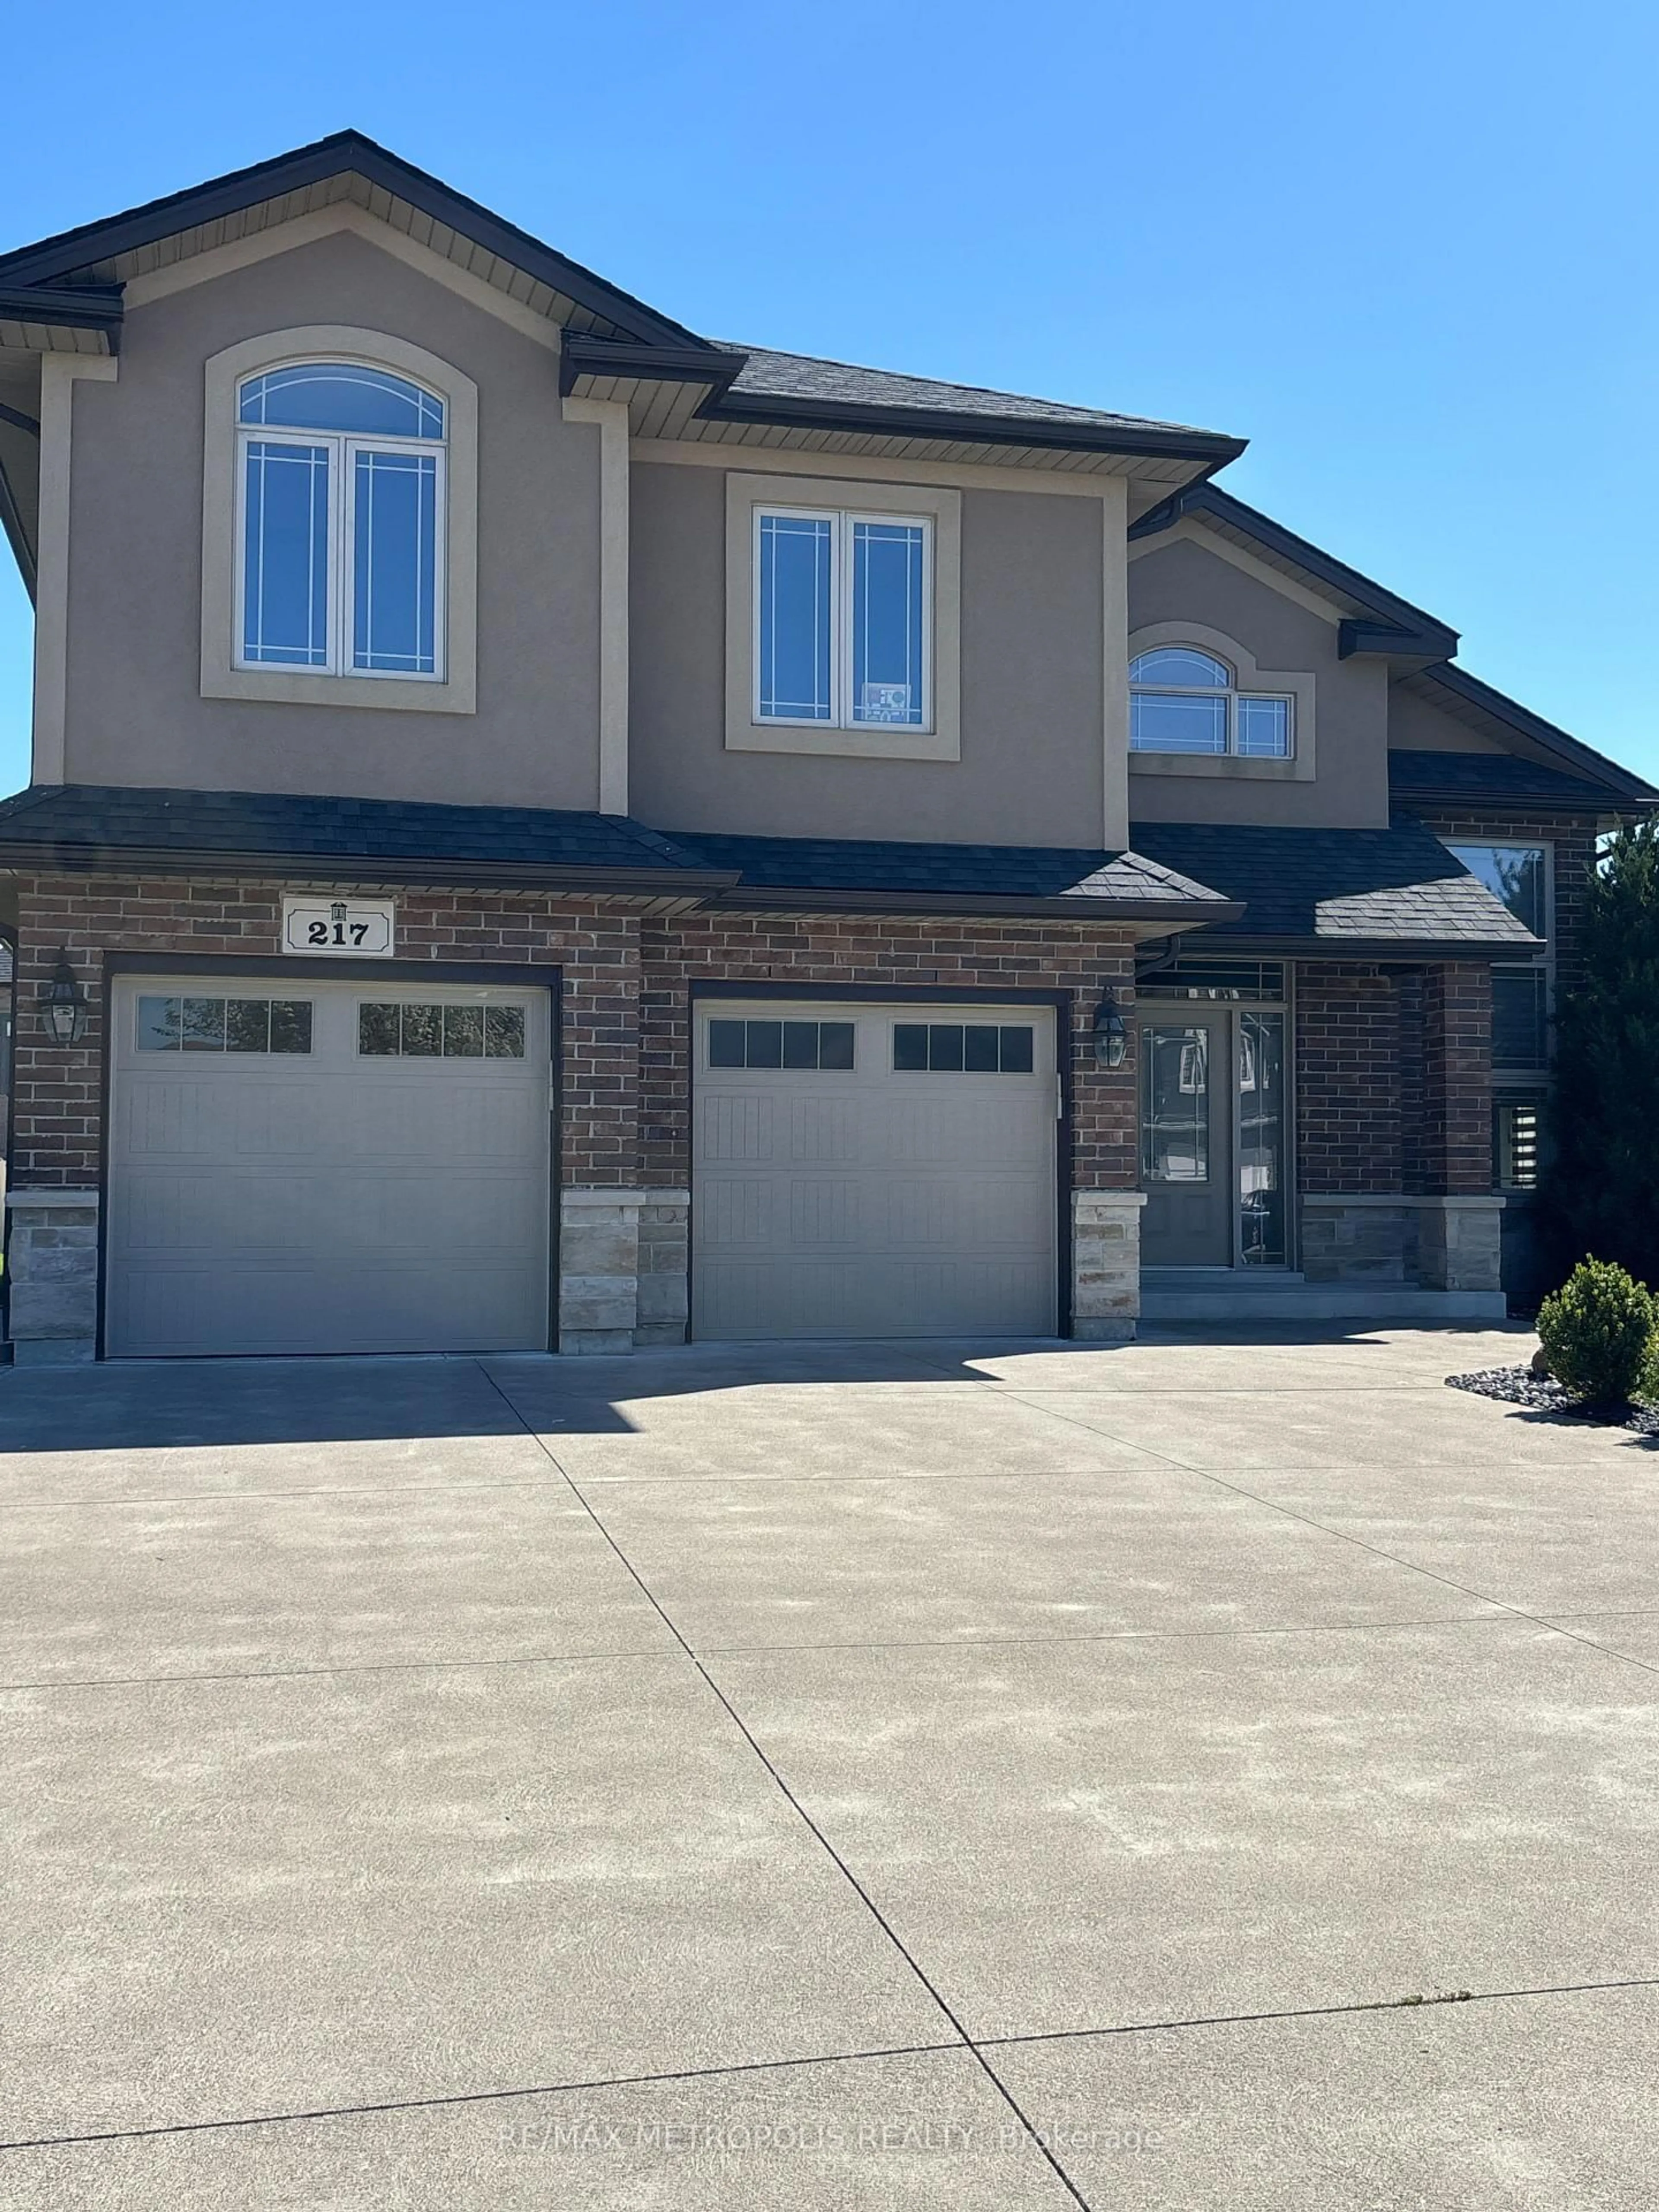
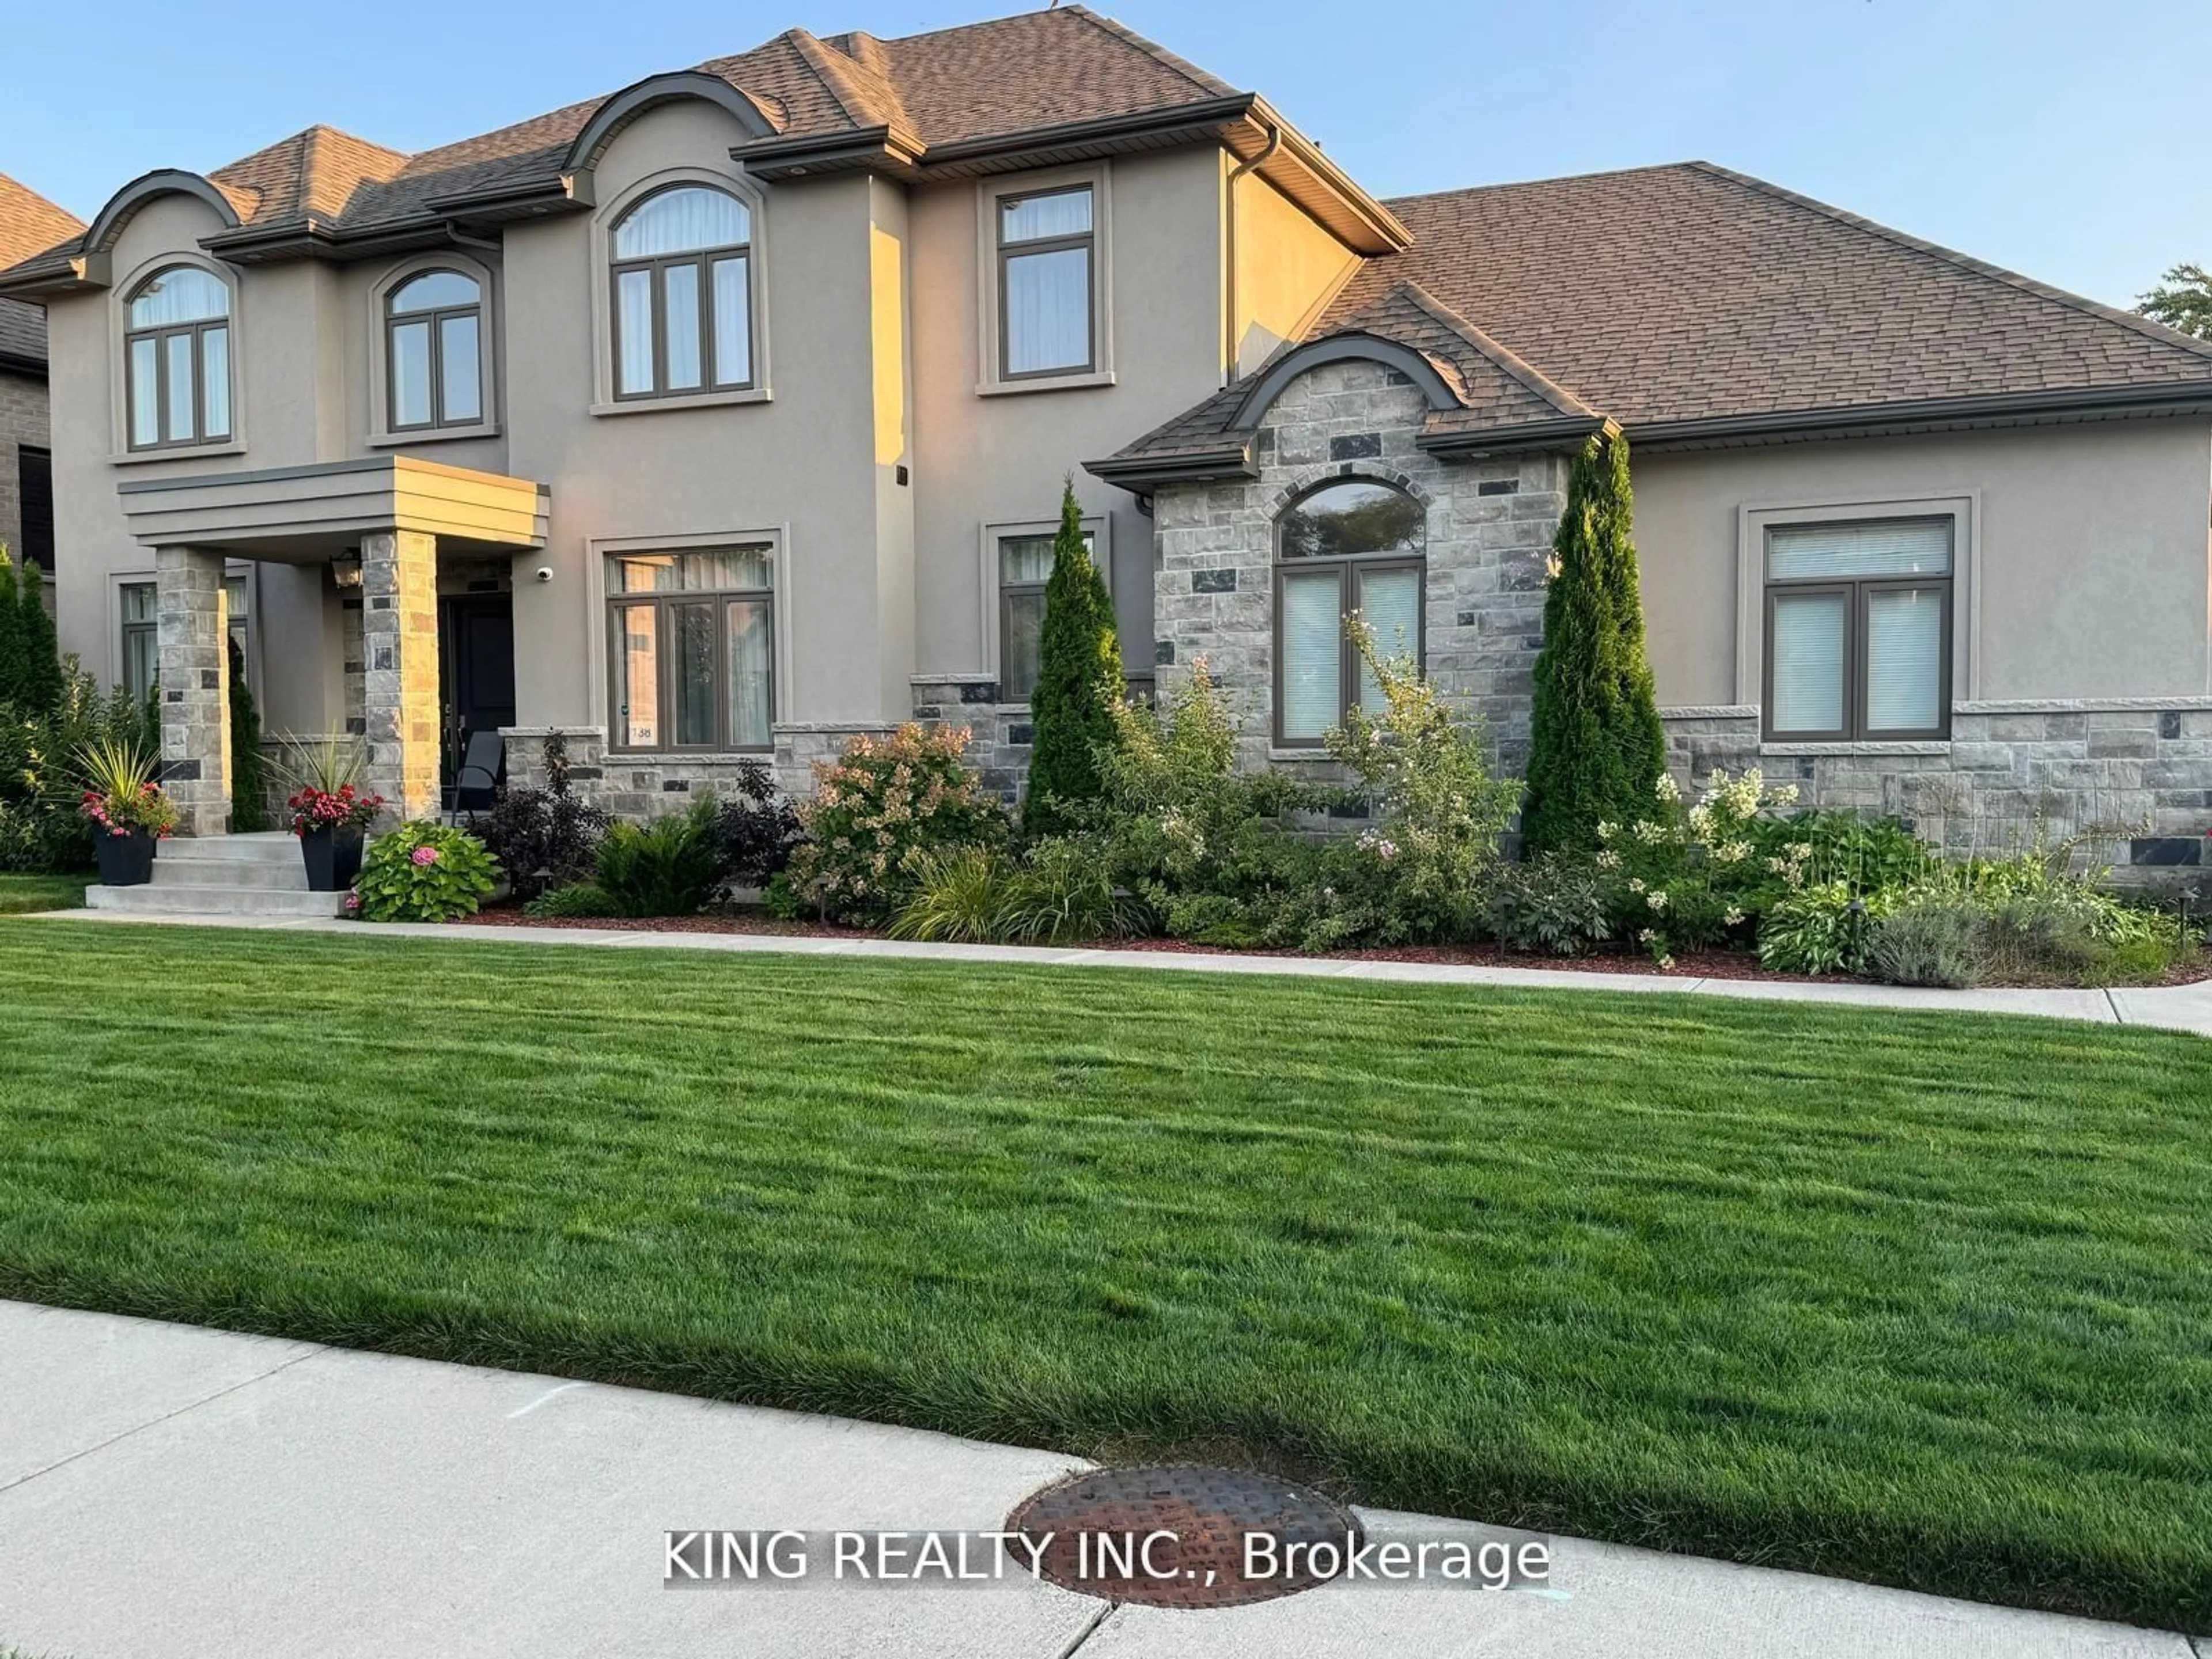
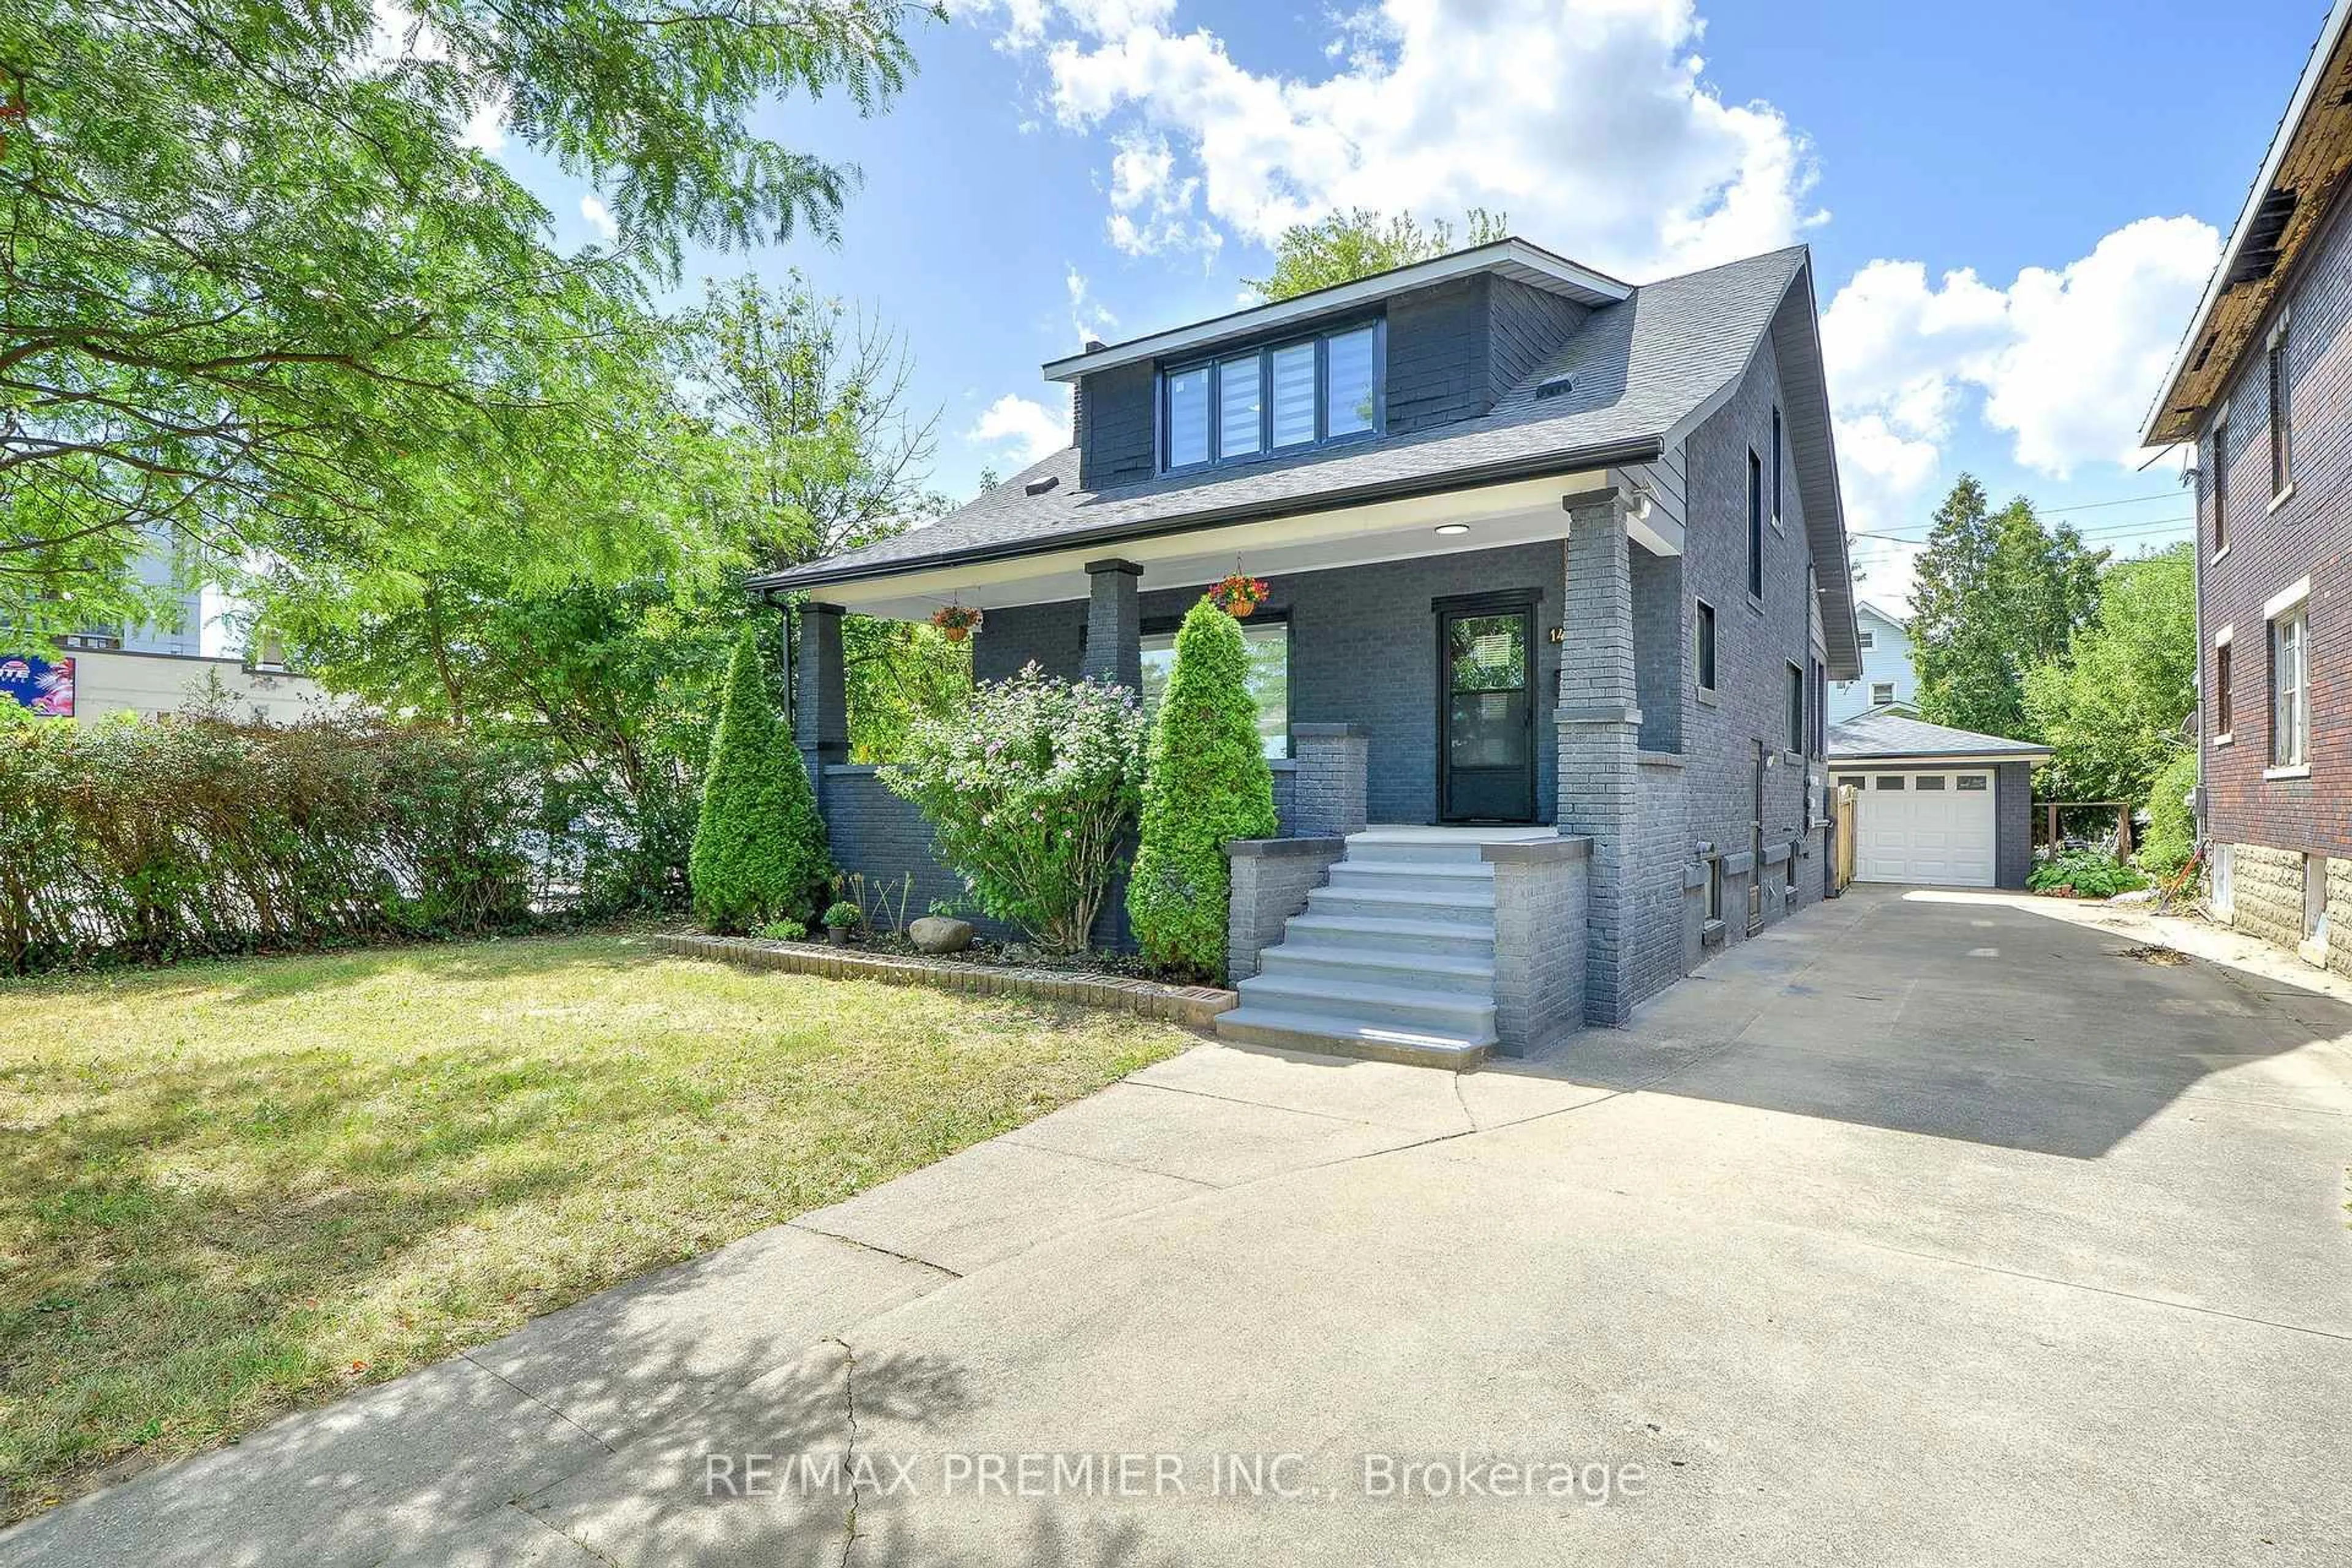
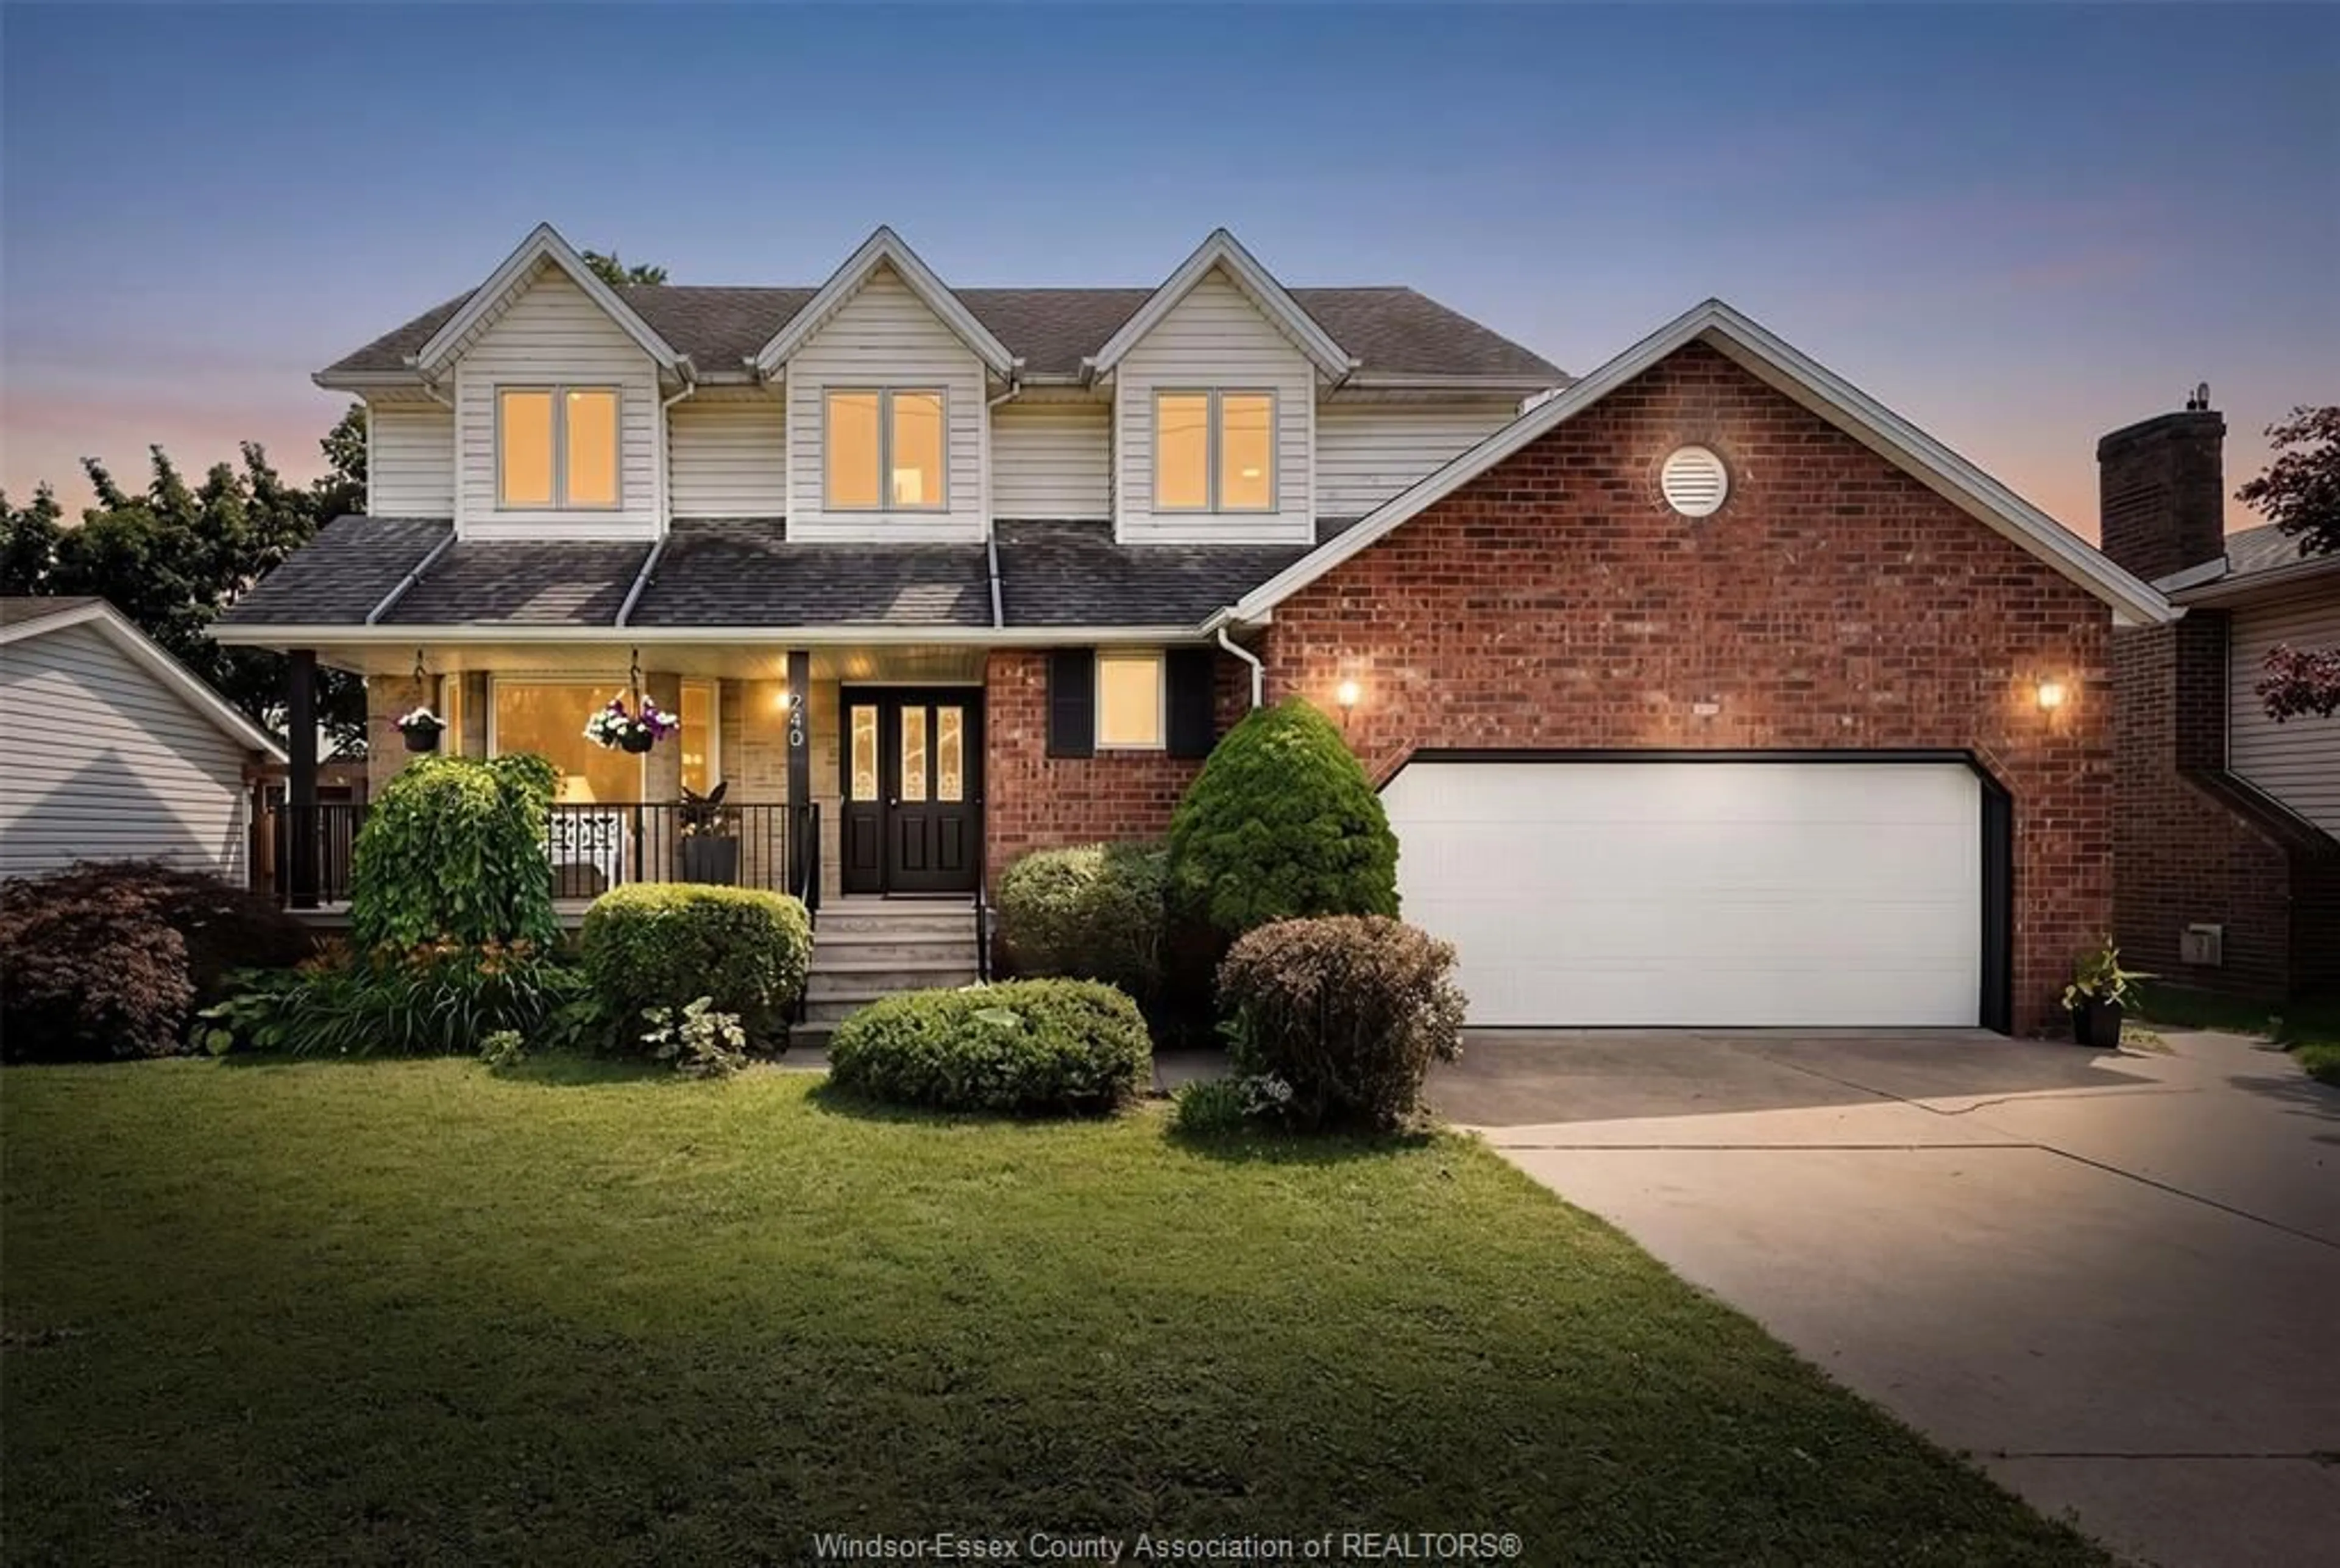
Homes for Sale
Just Listed in Essex CountyView all
Open Houses in Essex CountyView all
Just Sold in Essex CountyView all
Price Decreased in Essex CountyView all
Homes near top schools in Essex CountyView all
Discover Nearby Homes in Essex CountyView all
What Customers Are Saying:
Overall Google Review Rating
4.8/5
Latest Real Estate Market Insights and News


The smarter way to buy and sell a home.
Join thousands who love Wahi!
Download the Wahi app
