1 day on Market

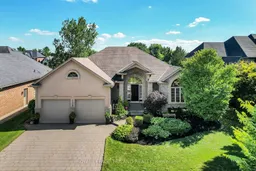
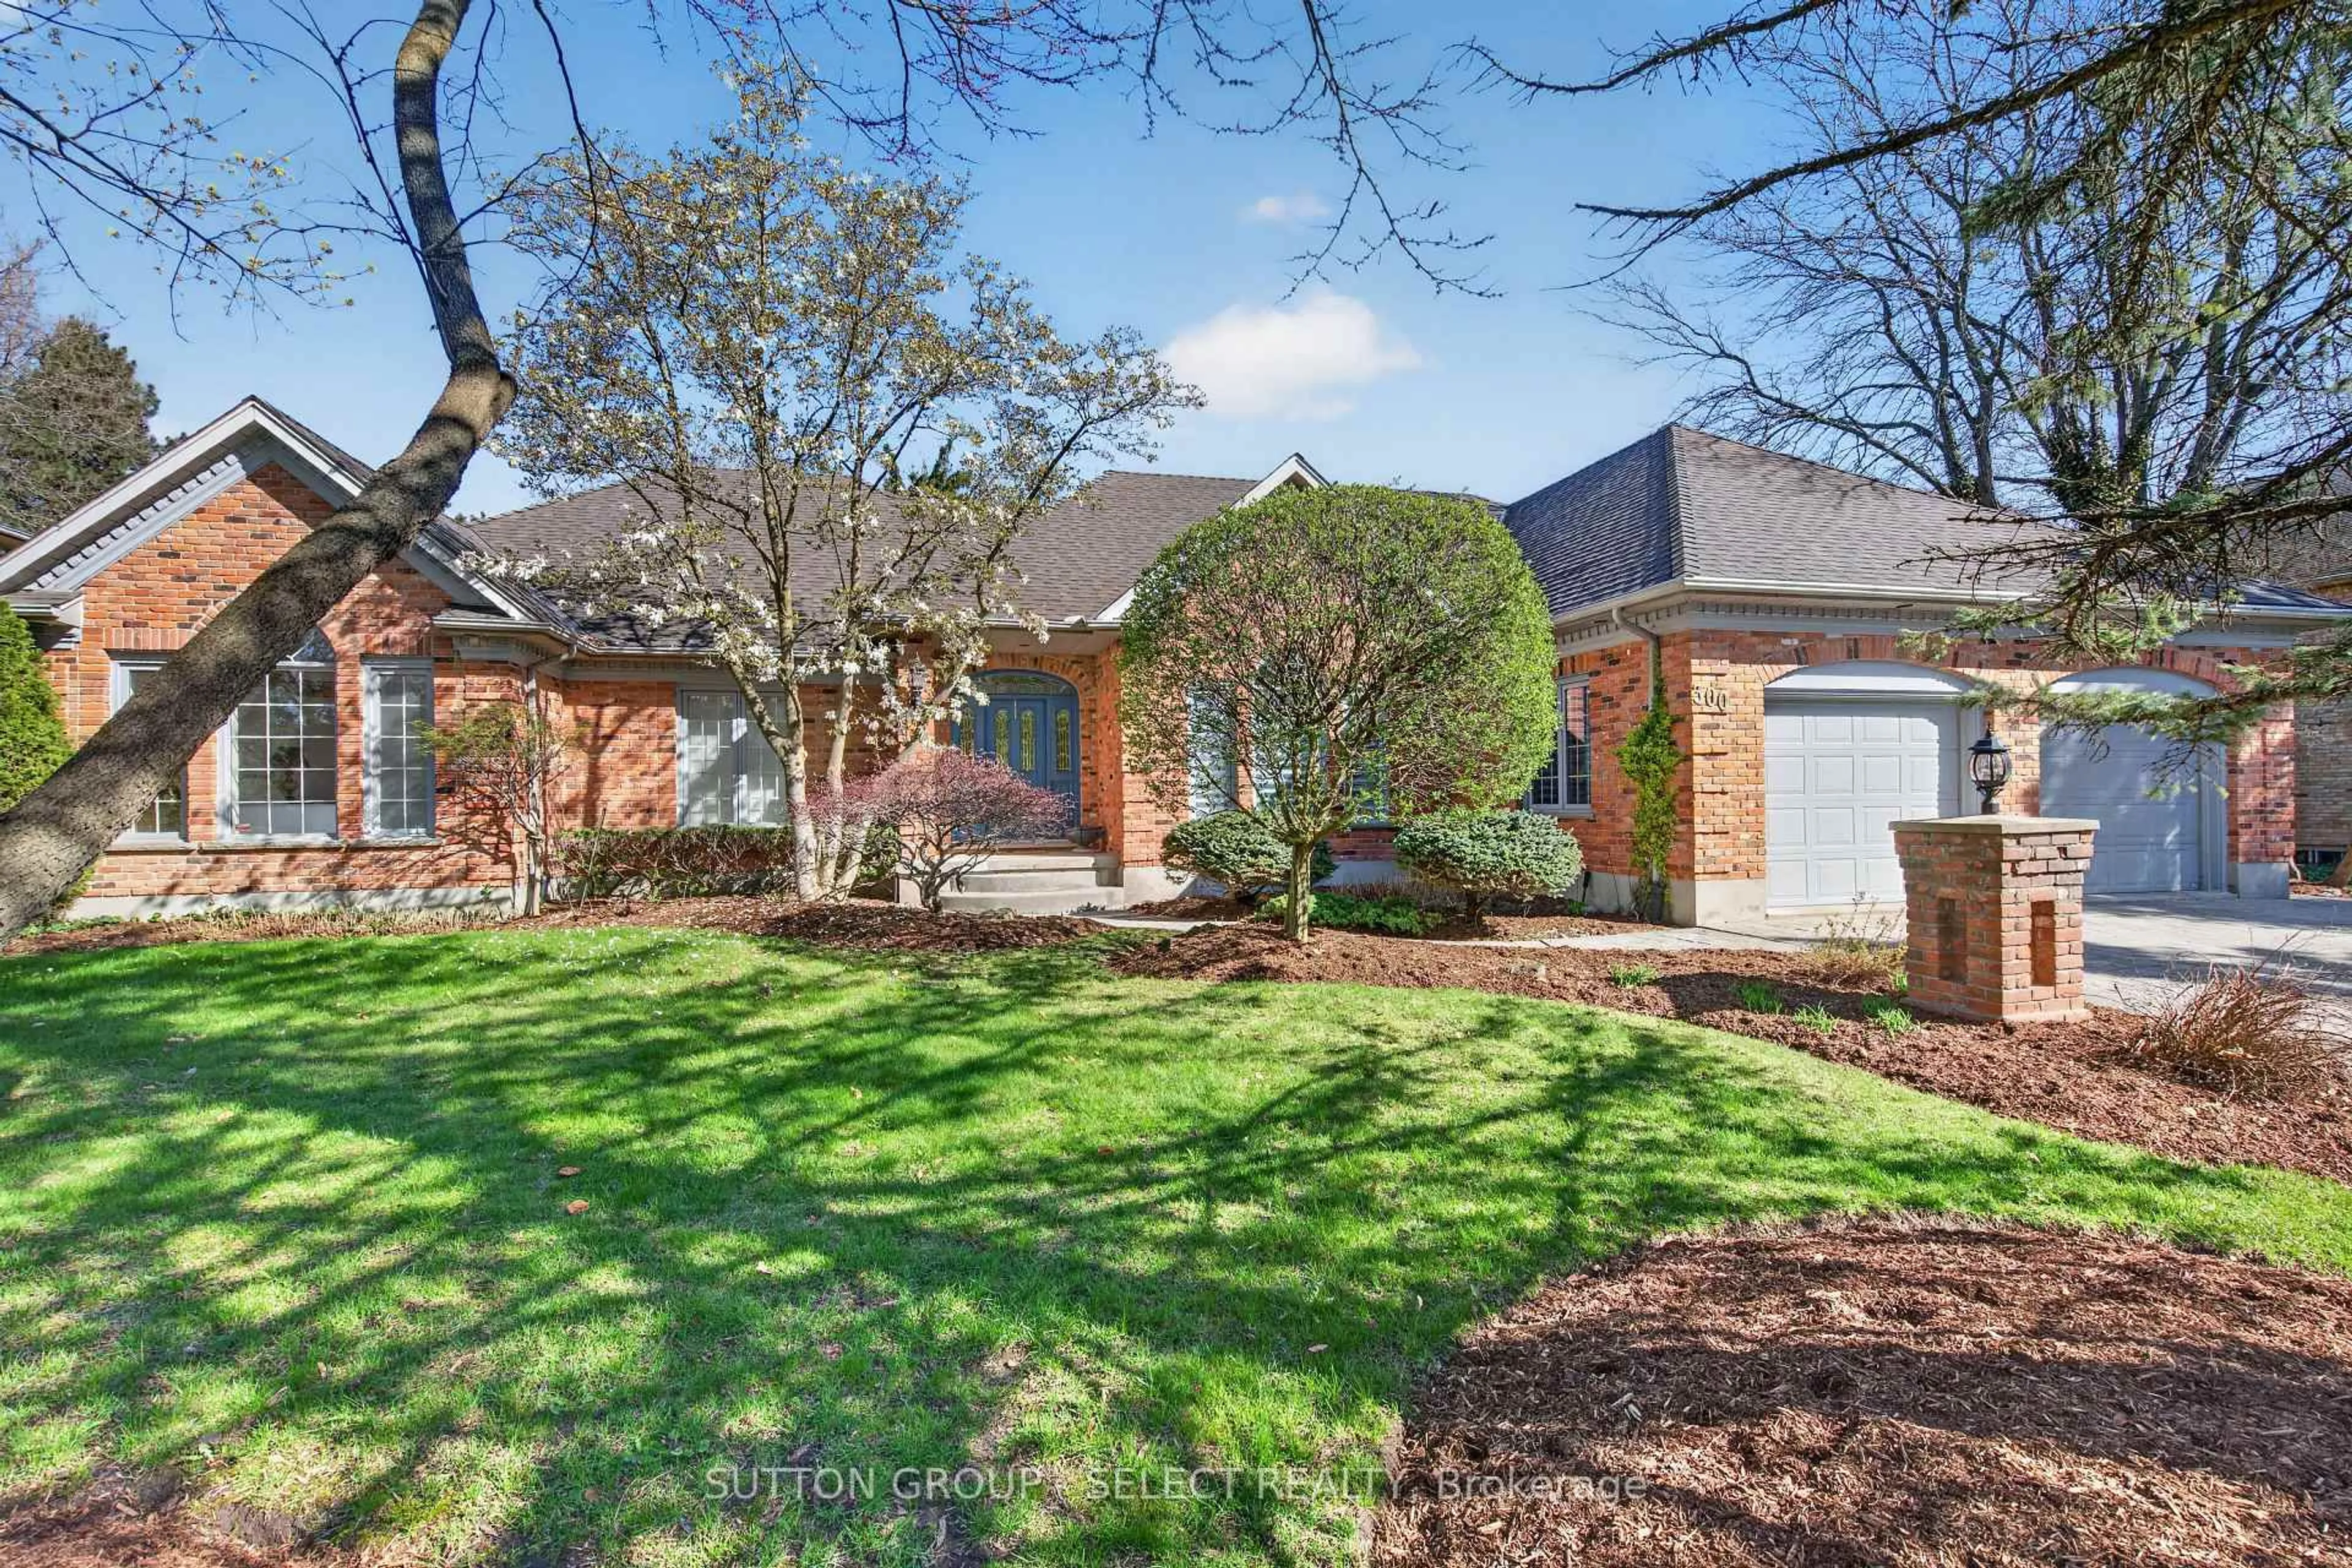
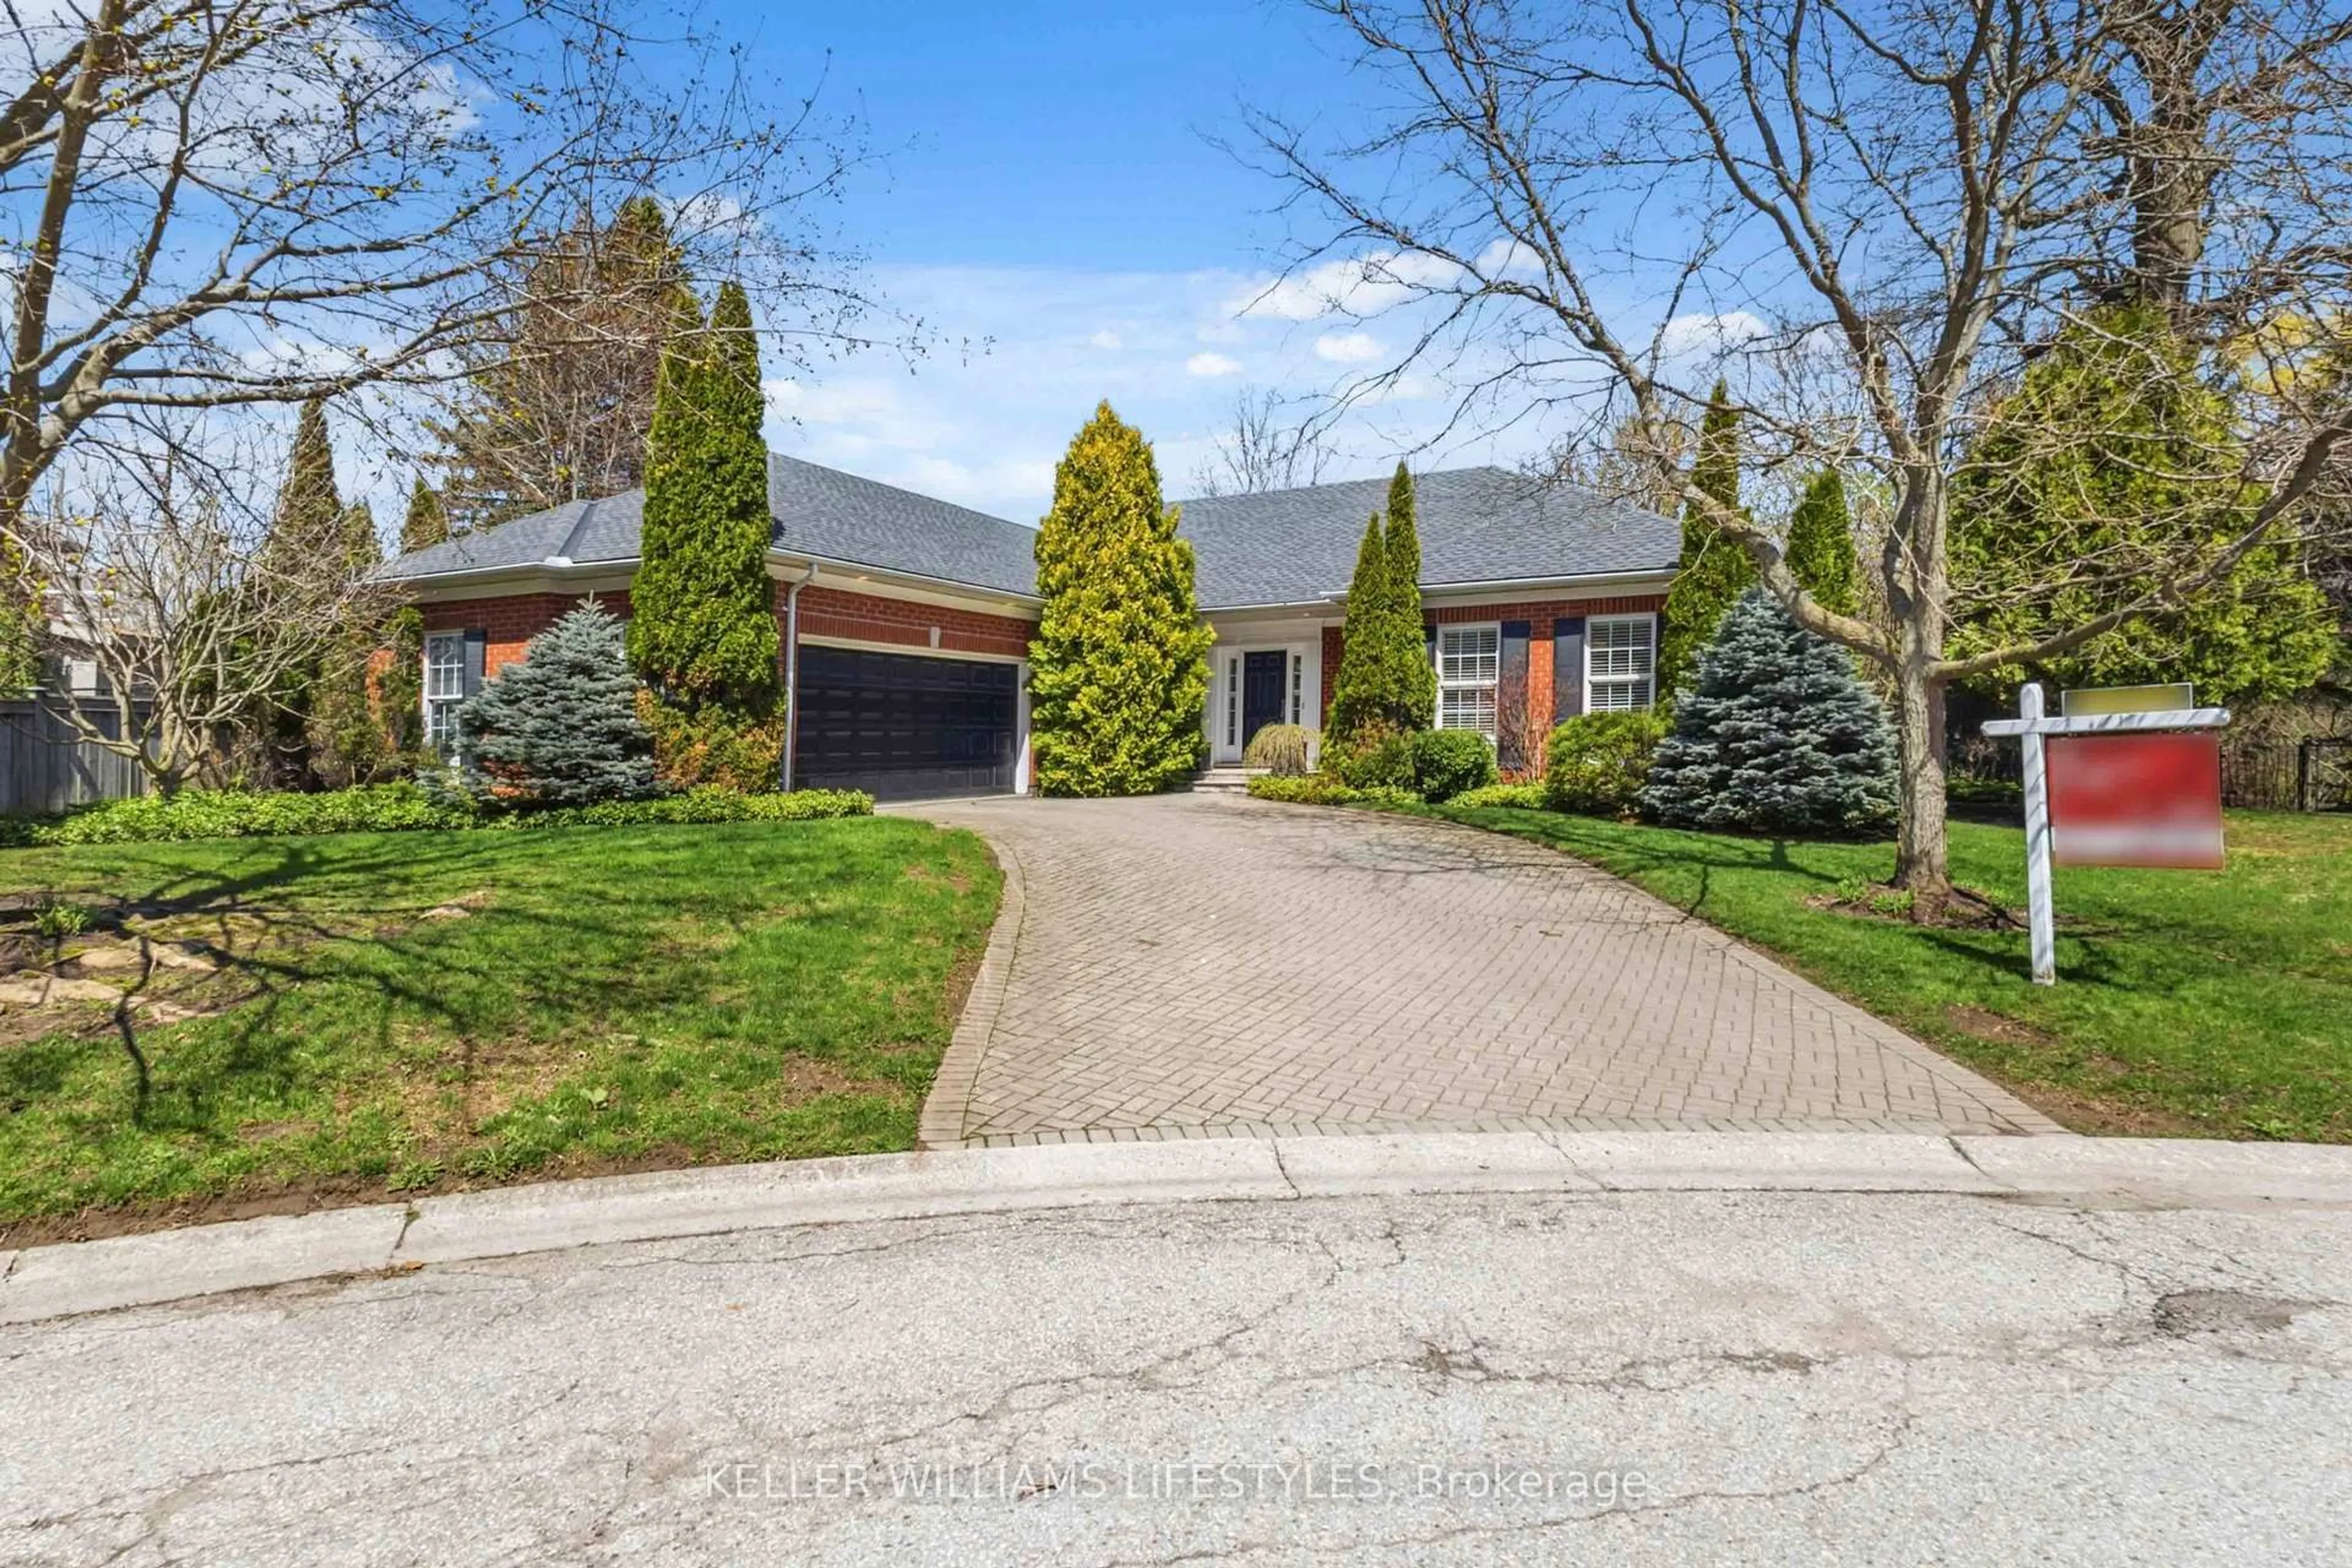
7119 Clayton Walk, London South, Ontario N6P 1V3

Detached
2 + 3
3
~2000-2500 sqft
$1,299,900
Get pre-qualifiedPowered by nesto
Buy with Wahi to get
Up to
$6,500Cashback
Detached
2 + 3
3
~2000-2500 sqft

Contact us about this property

Call

Highlights

Property Estimate

Days on market1 day

Estimated valueNot available

Price/Sqft$584/sqft

Monthly cost

Open Calculator

CMA Subject Property

Curious about what homes are selling for in this area?

Get a report on comparable homes with helpful insights and trends.

+5

Properties sold*

$895K

Median sold price*

*Based on last 30 days

Description

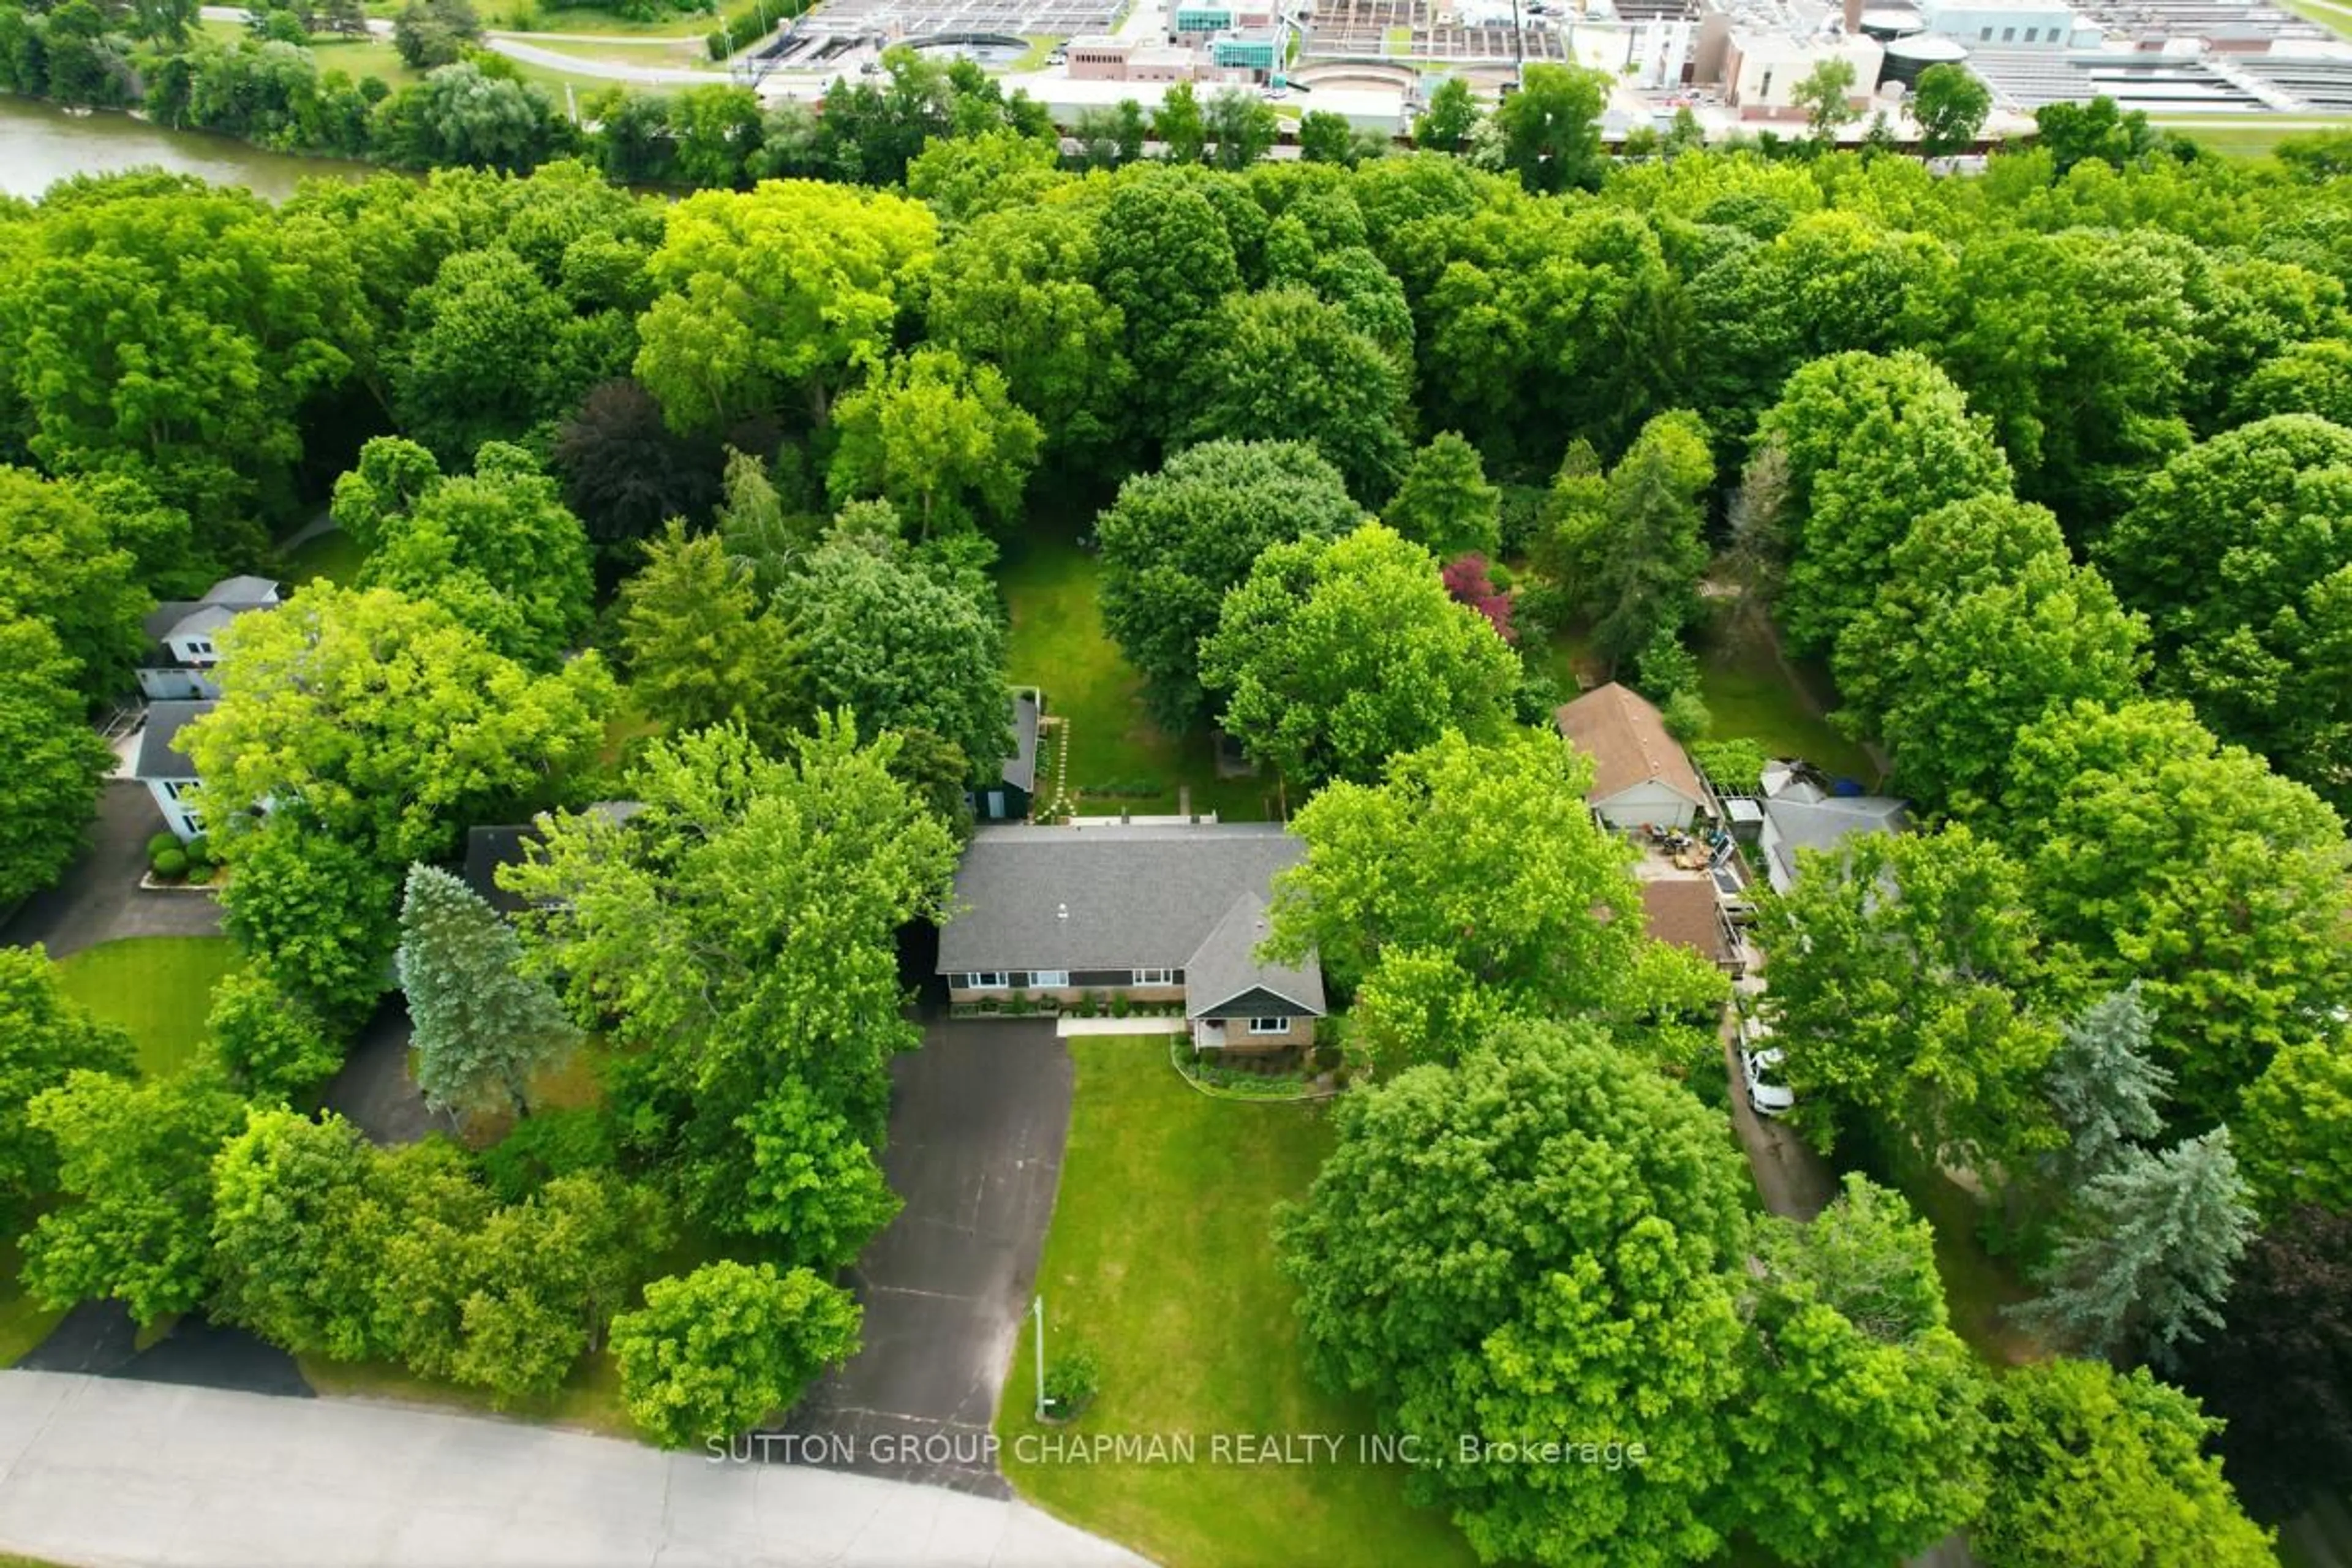
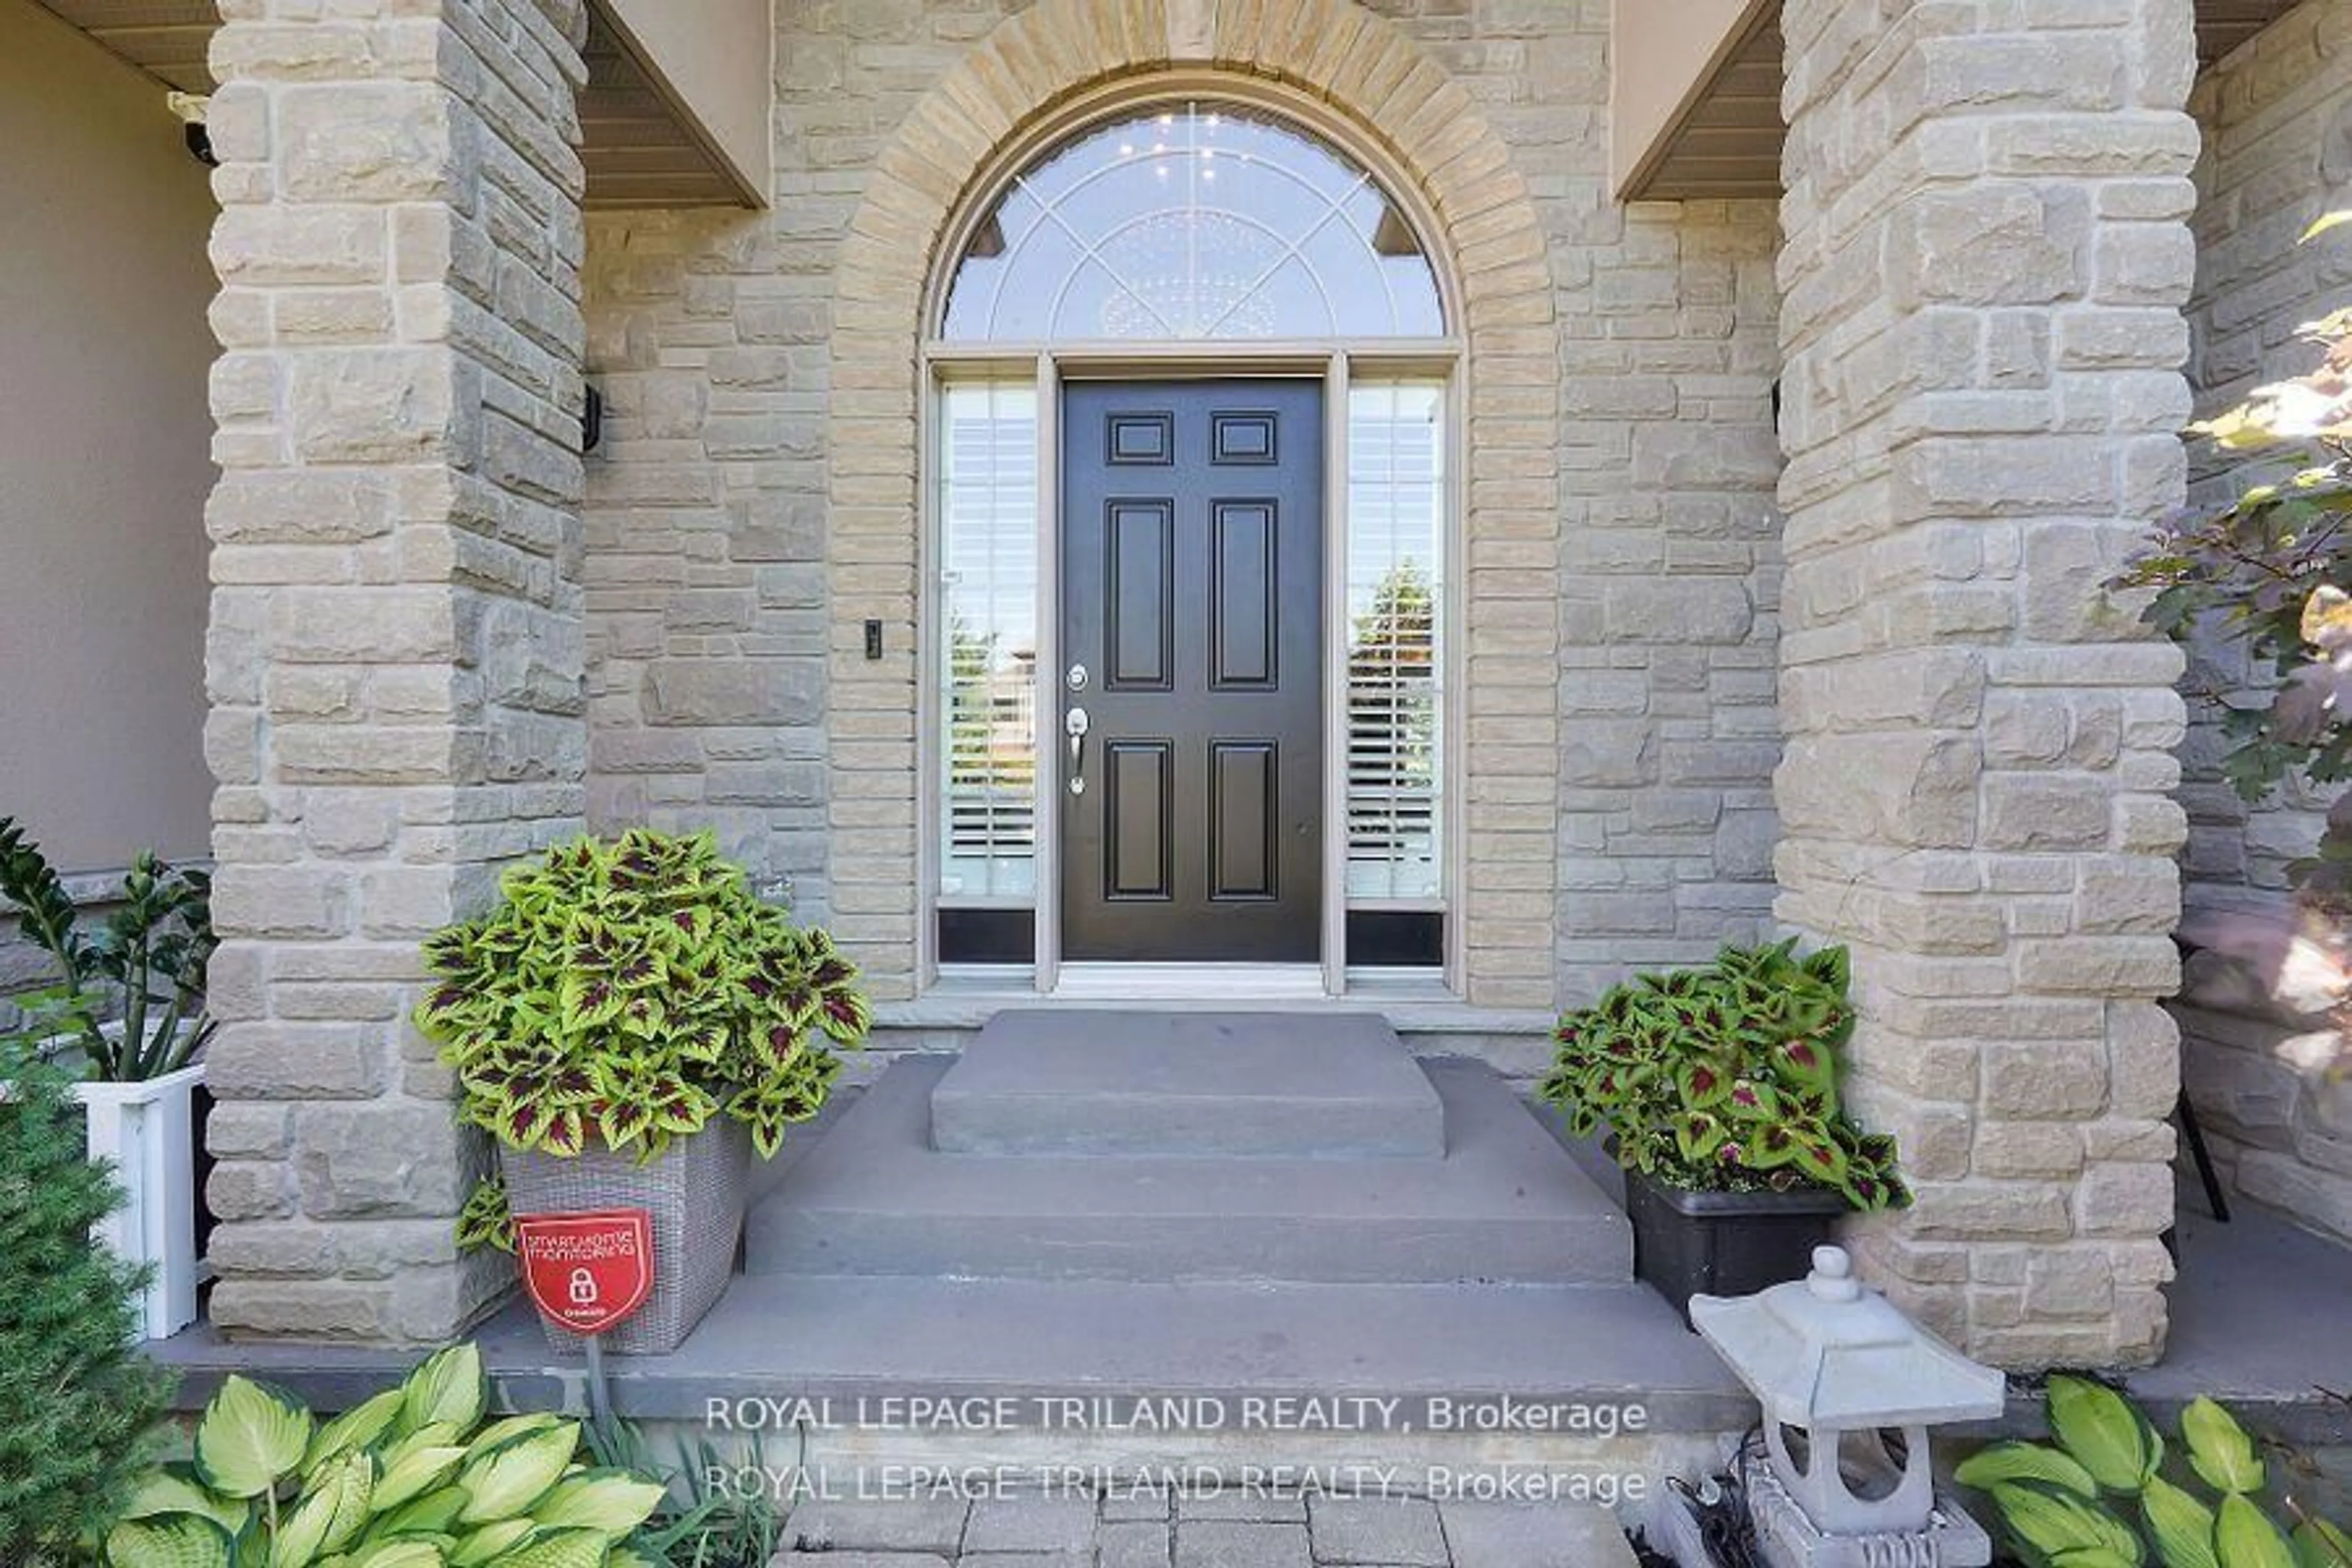
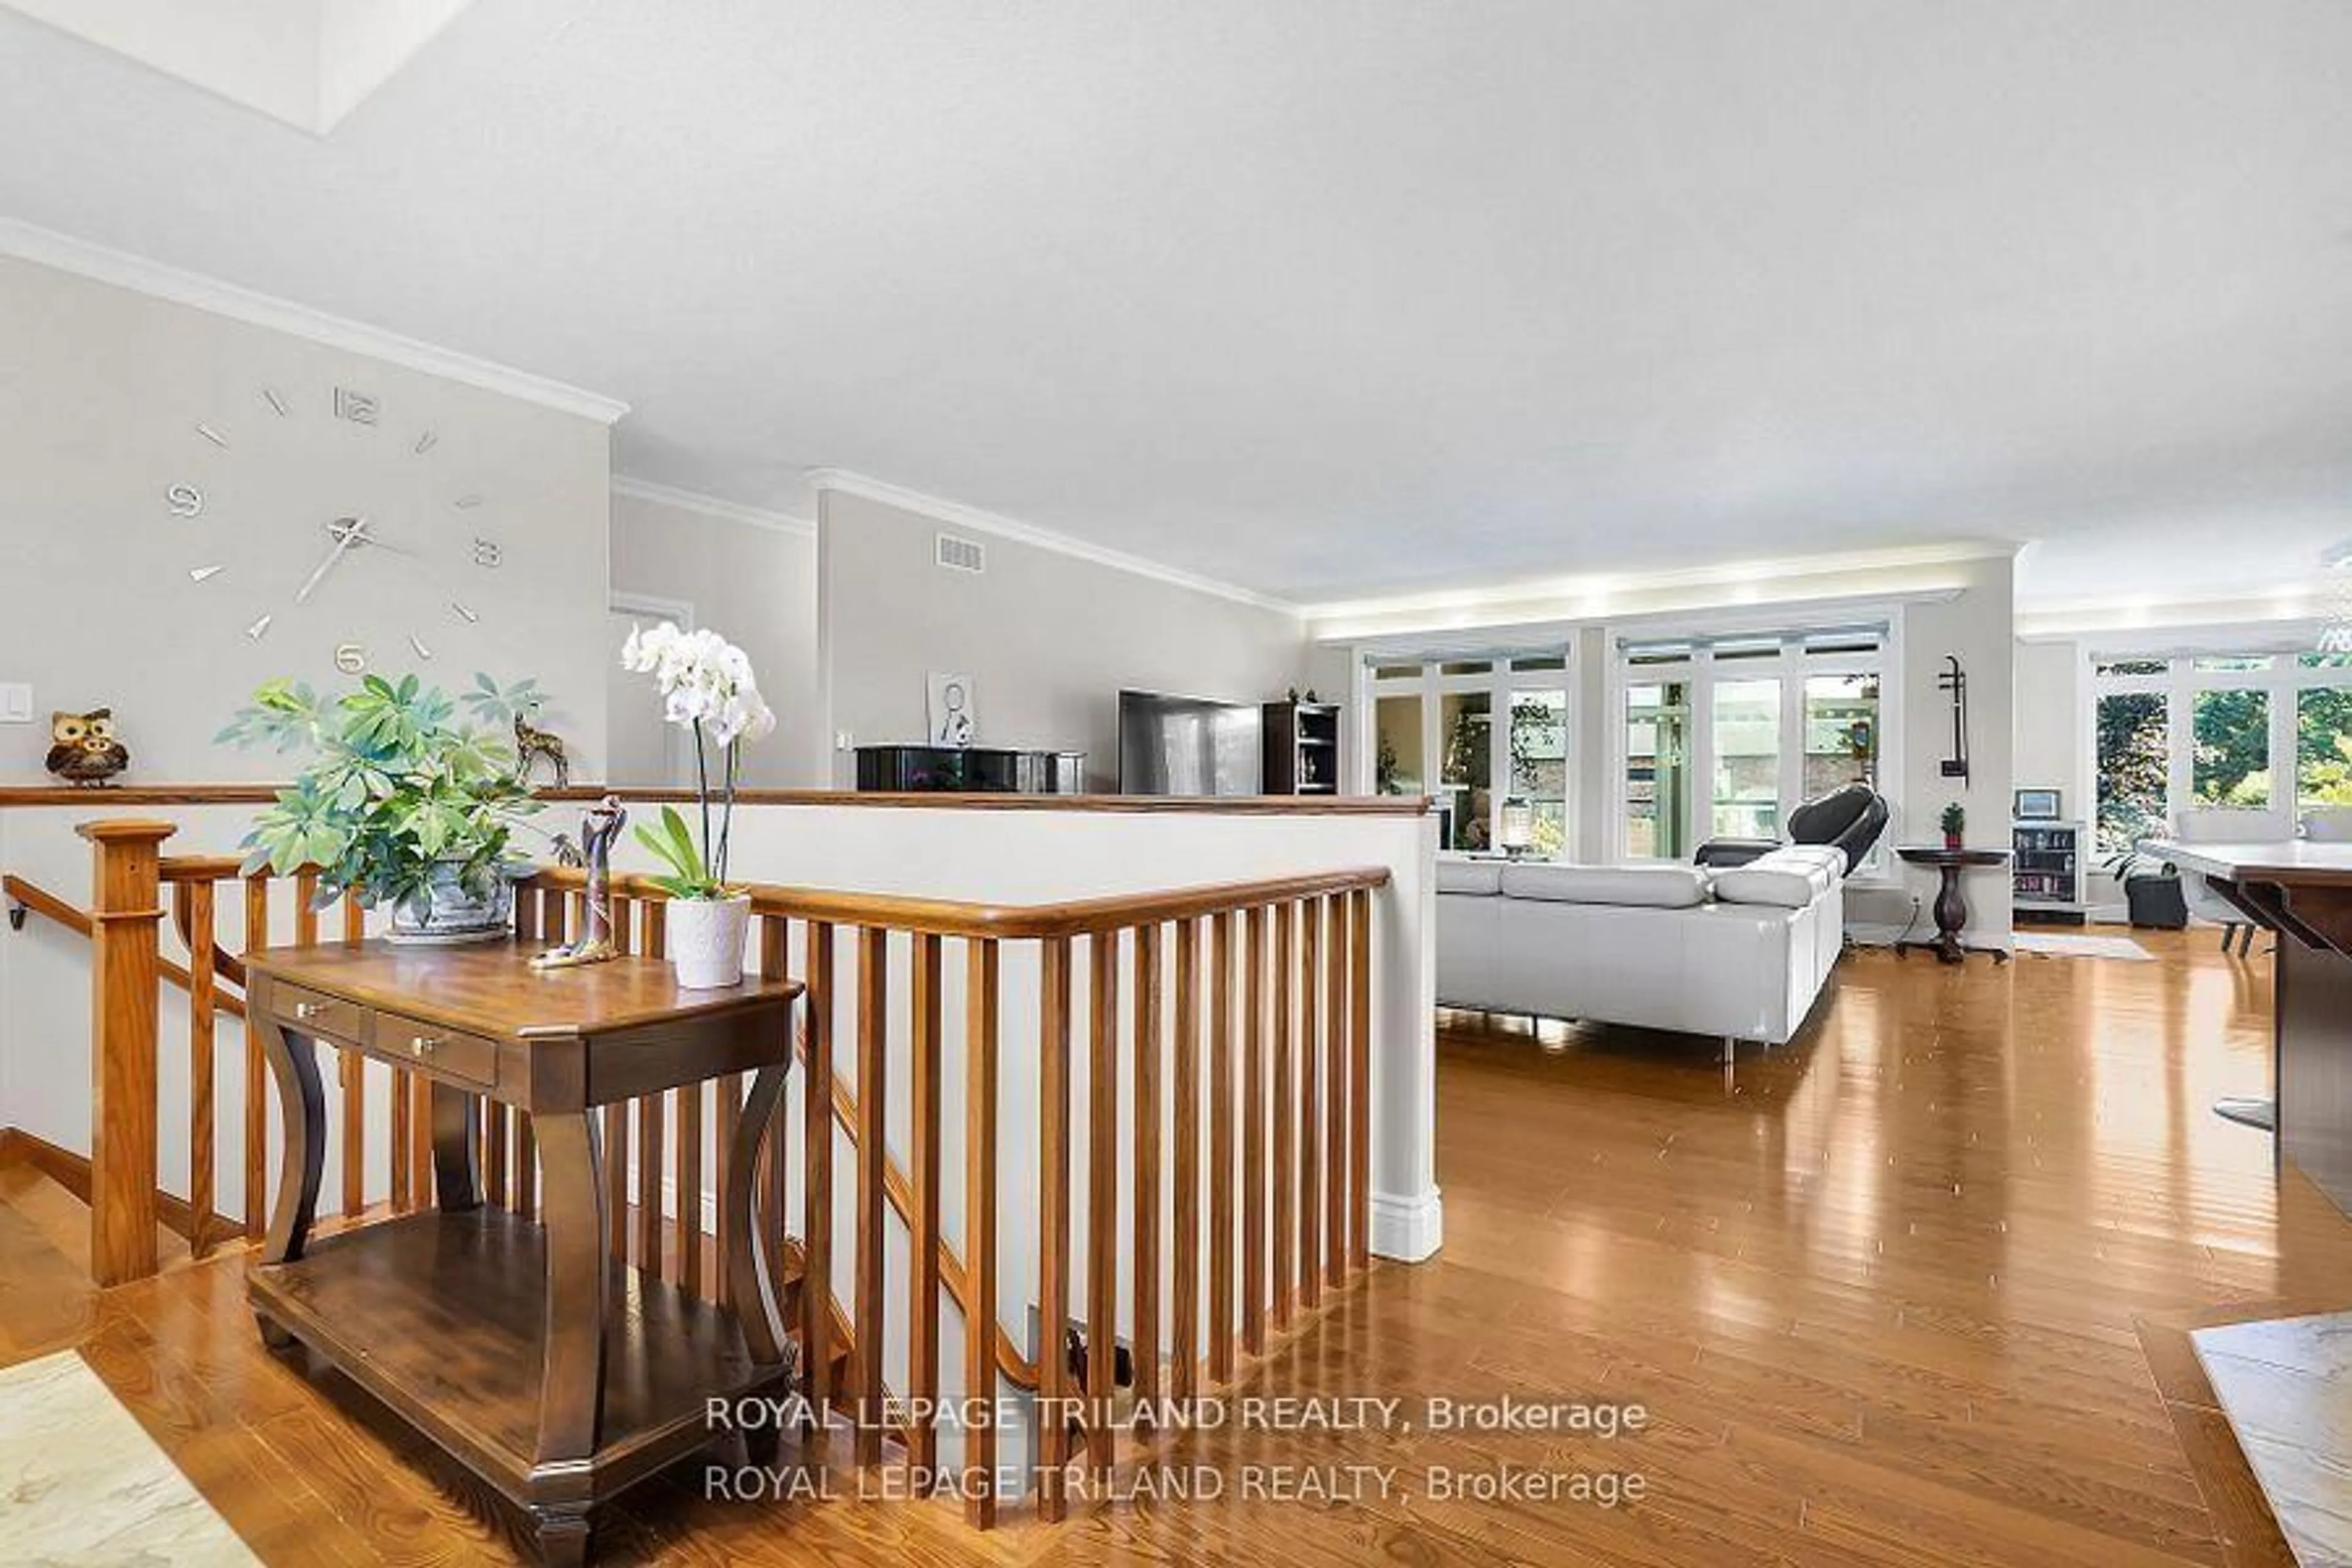
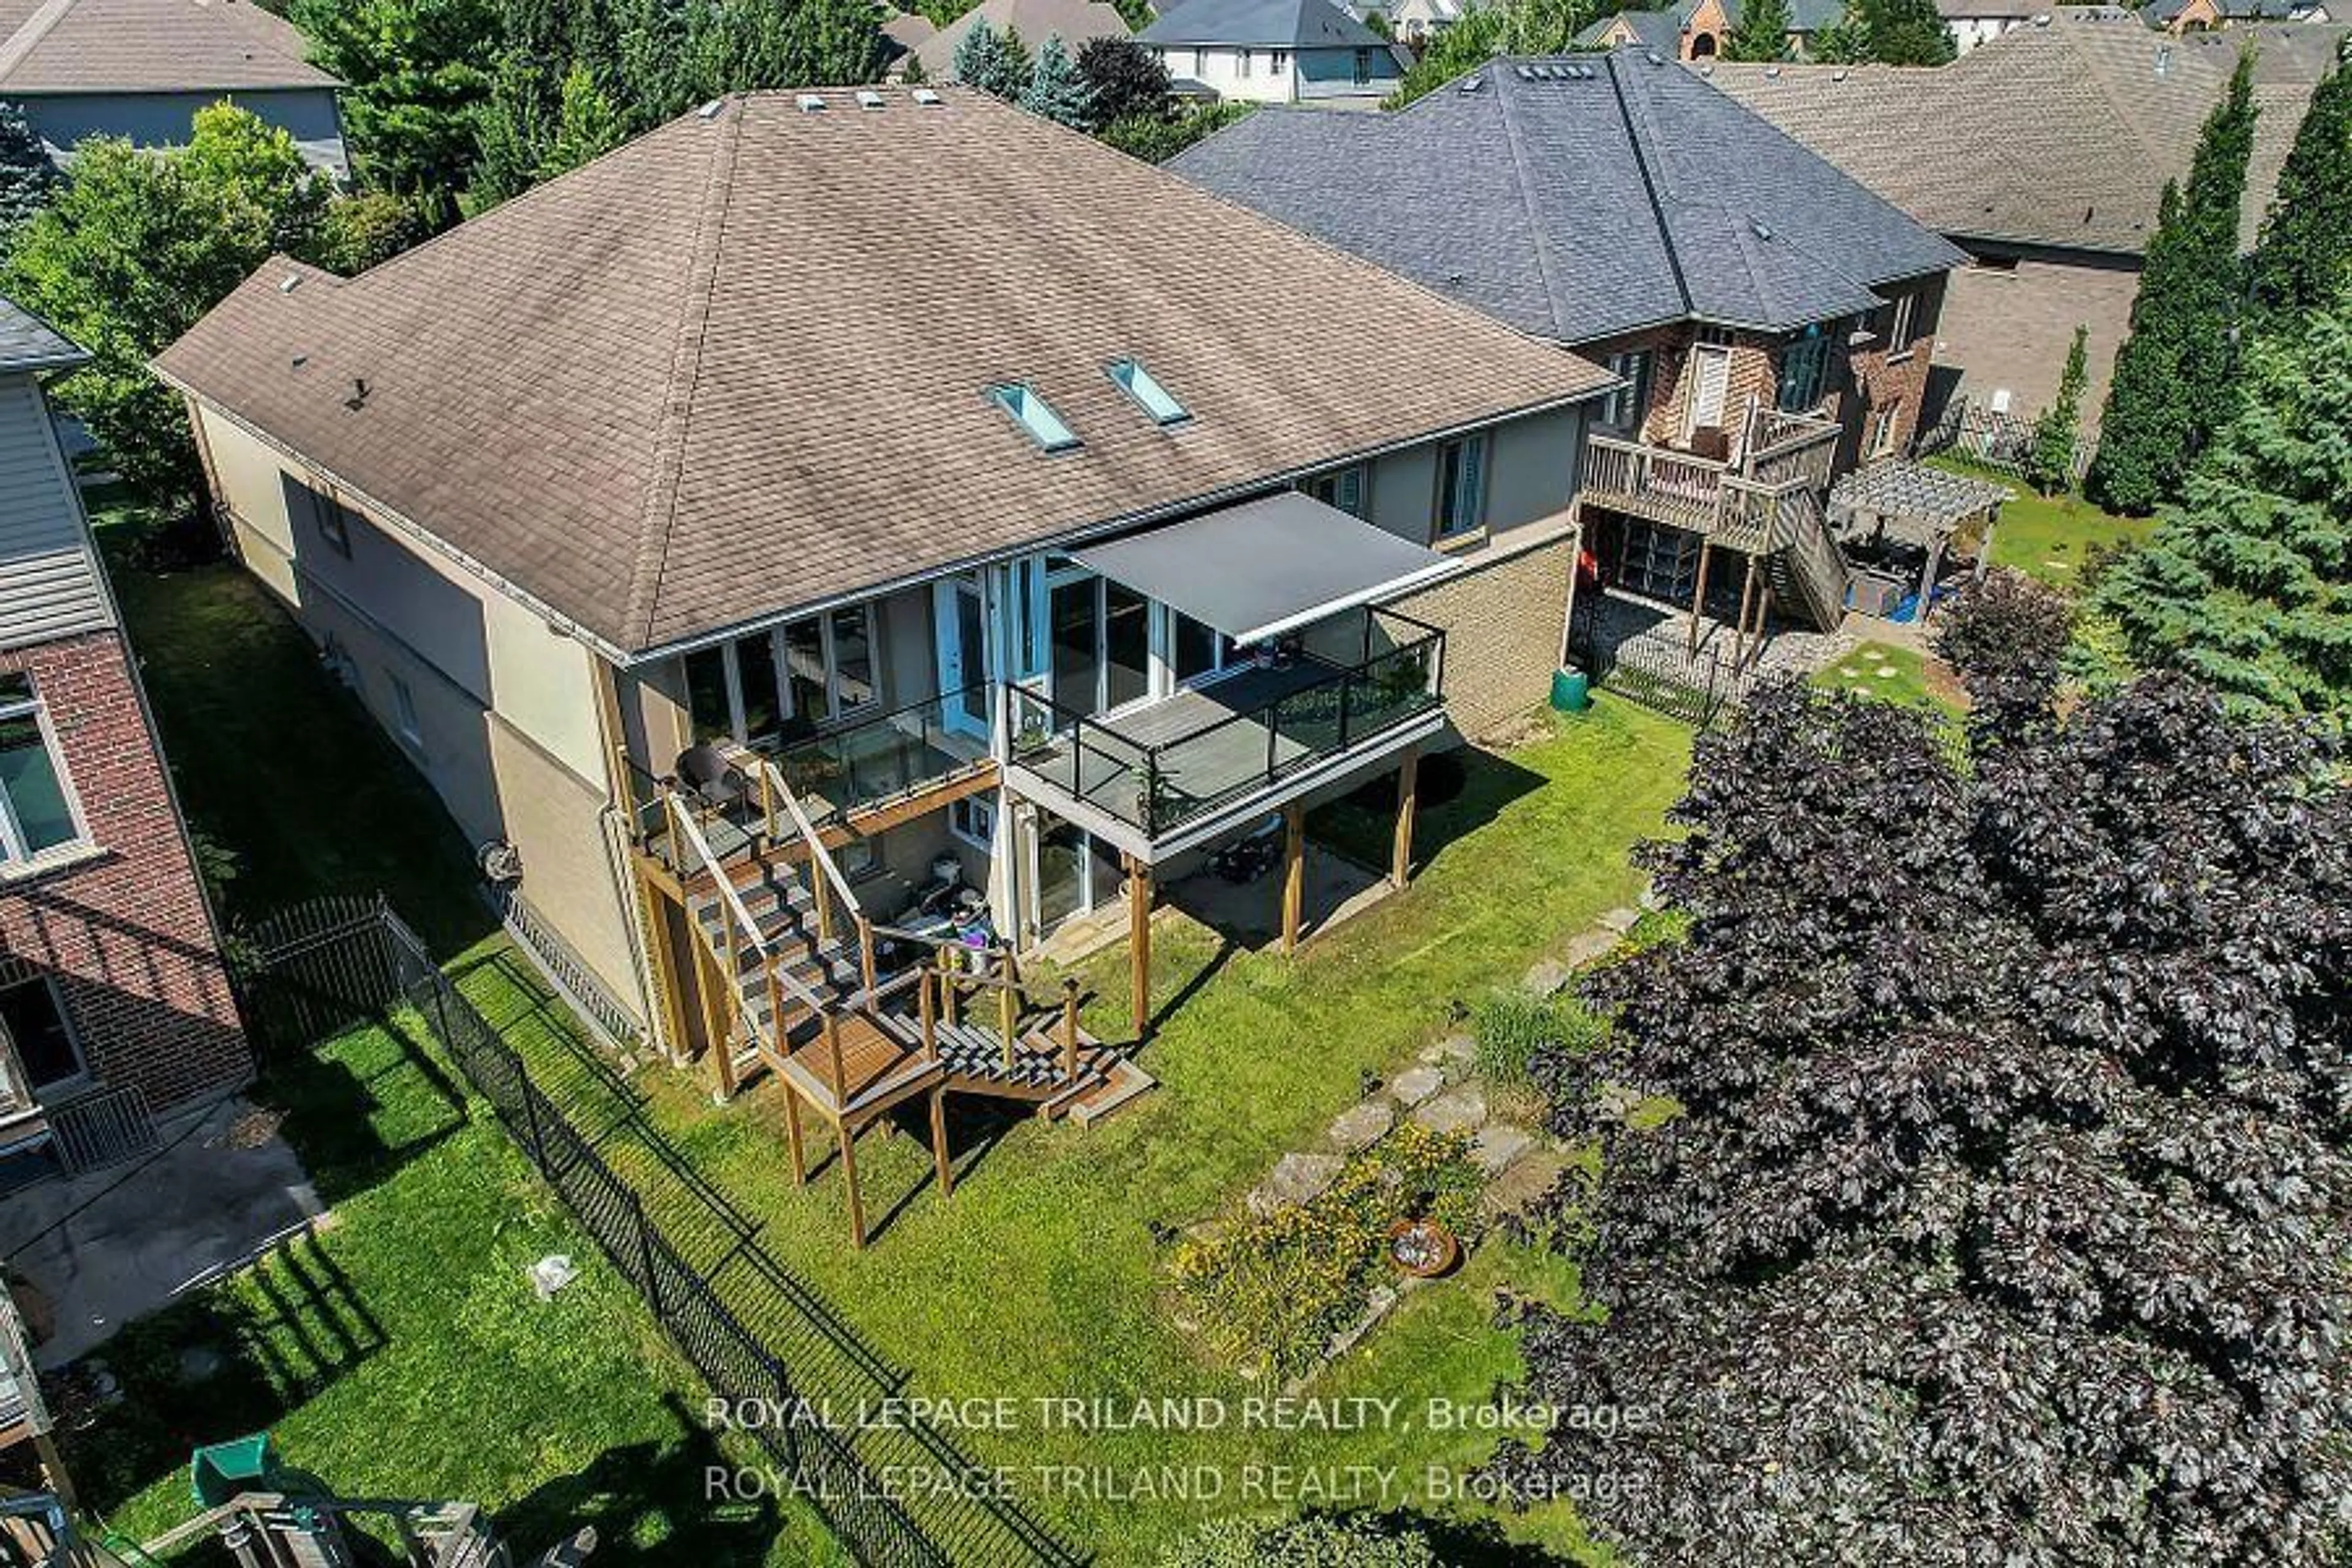
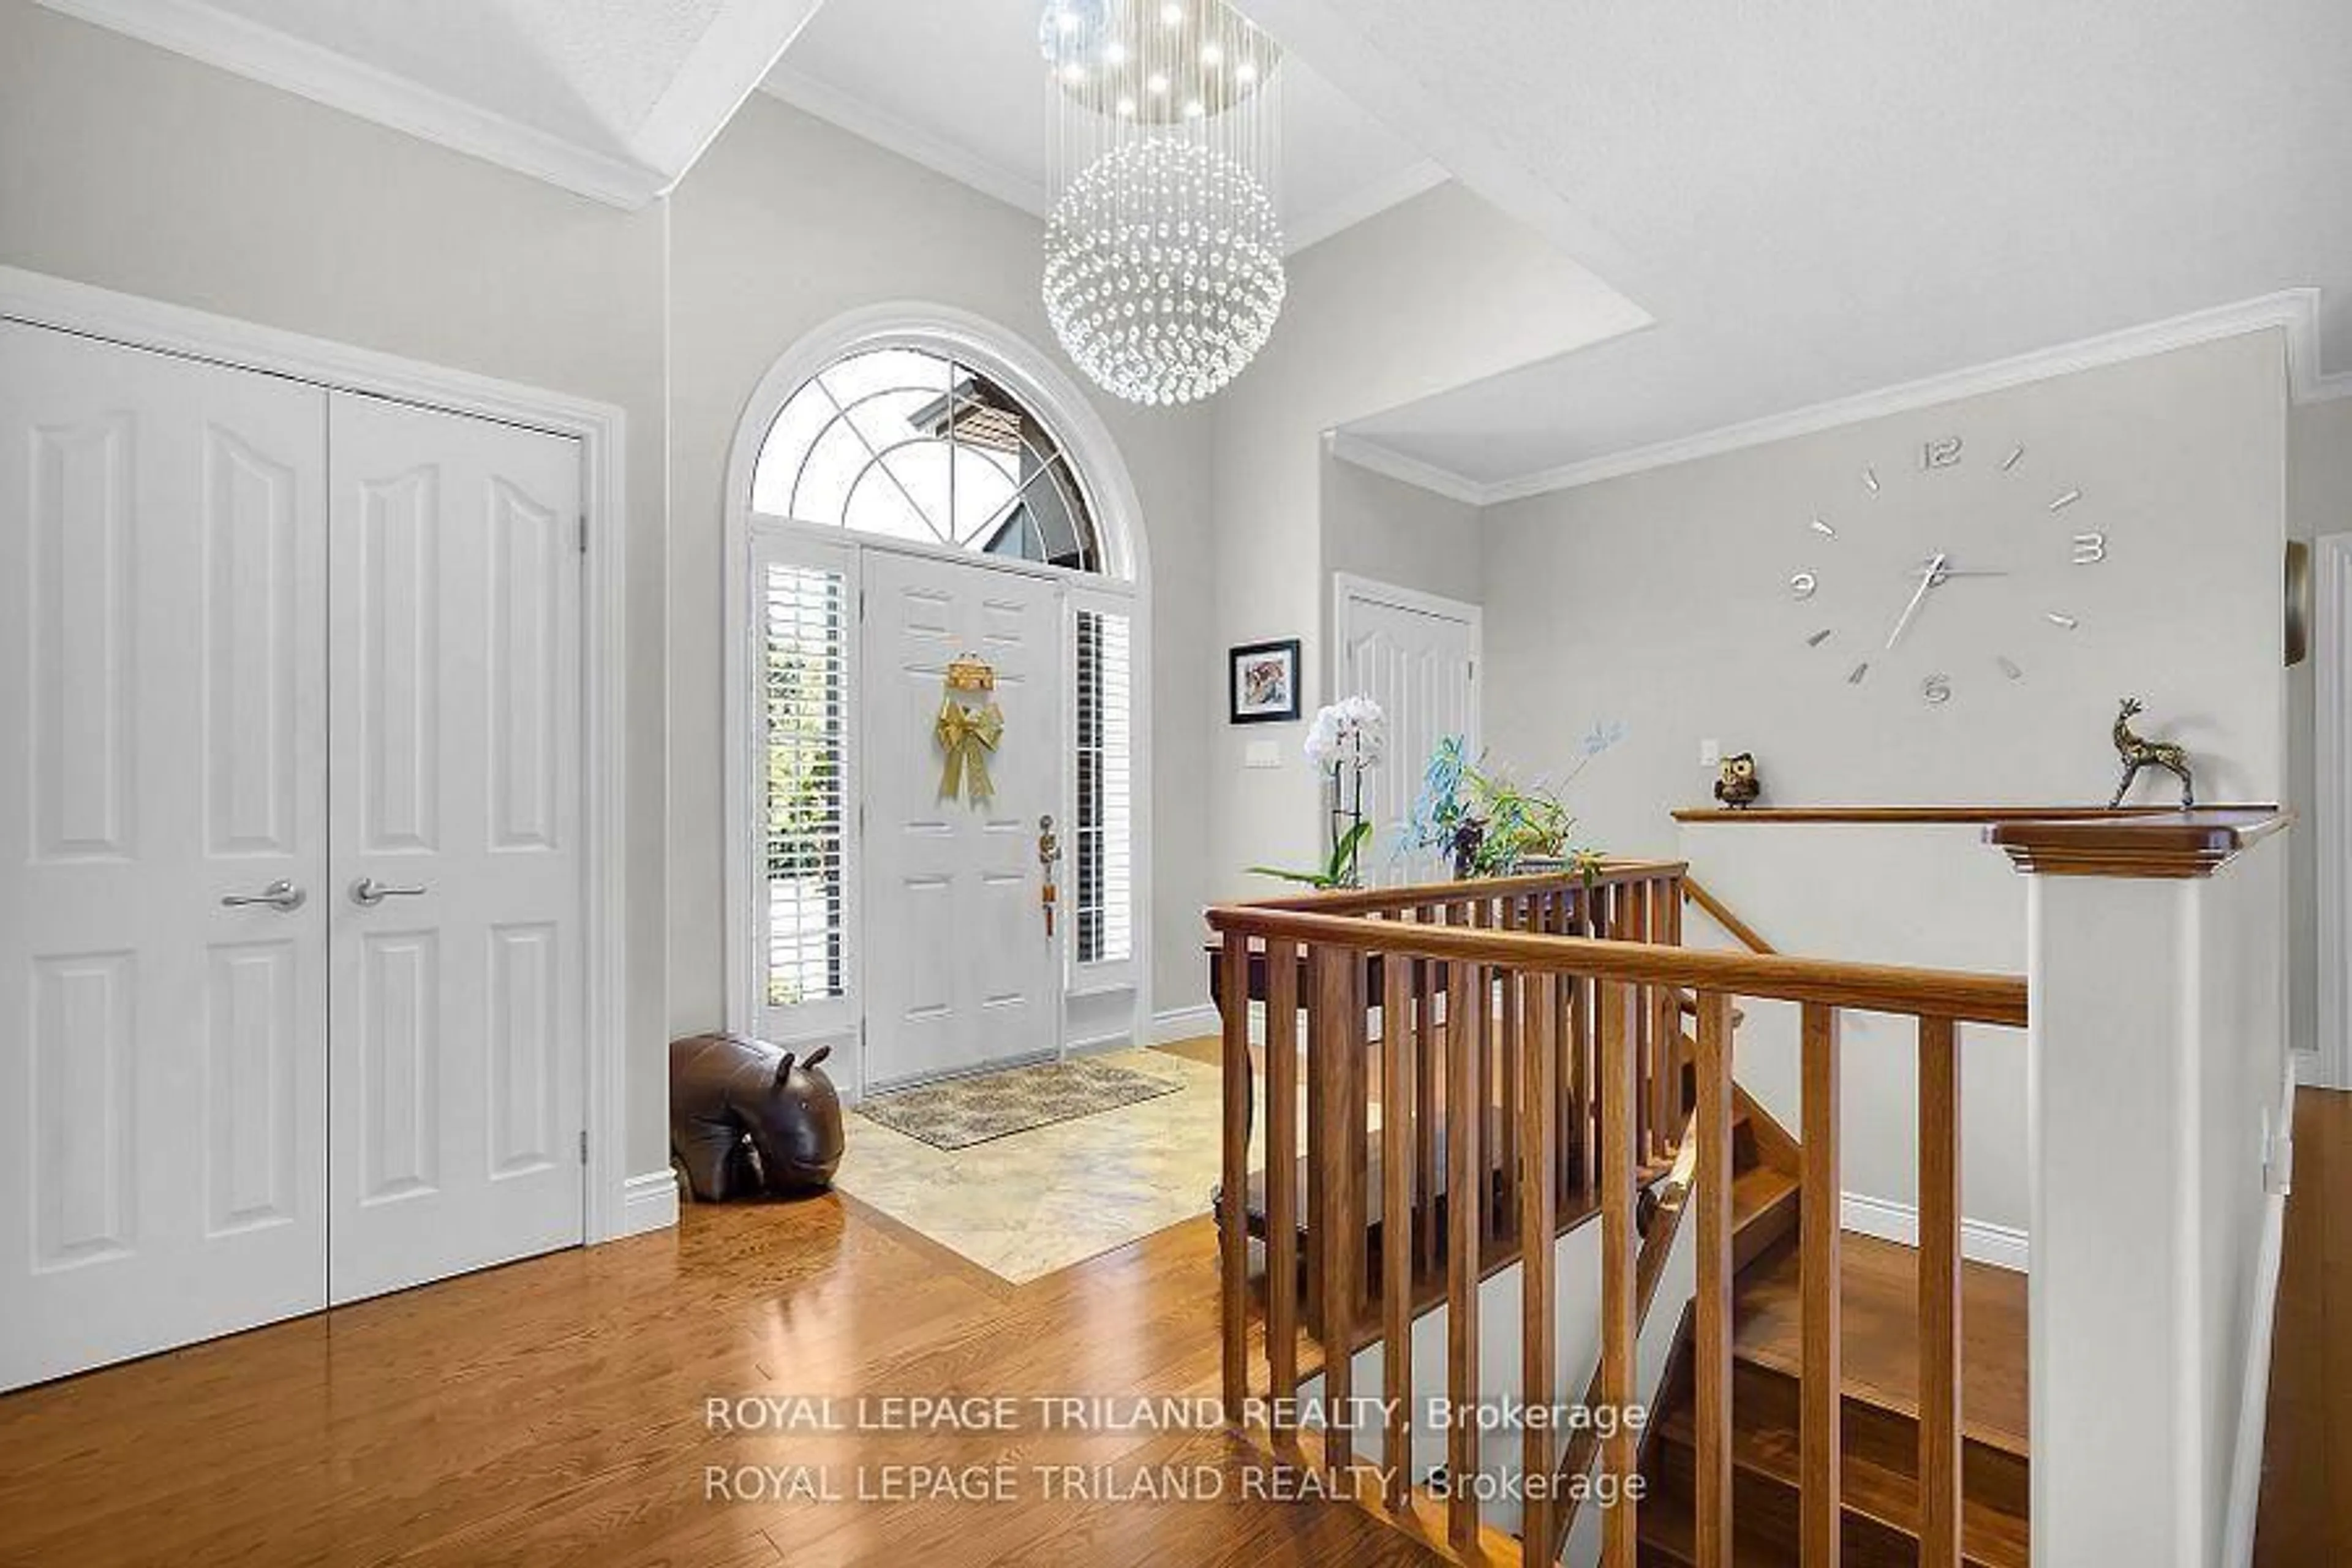
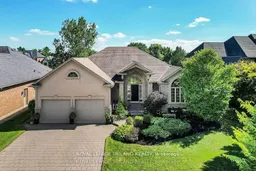
This executive custom built ranch located in a desirable South London neighbourhood comes with 5 bedrooms, 3 bathrooms. This home is spacious enough for most families and yet still retains that cozy feel. Located on a premium walk out lot backing on to a green belt, with mature trees which can be enjoyed from its patio. The open concept main floor along with a finished walk out lower level will provide ample living space. Primary Bedroom has an oversized customized walk in closet.


Property Details

StyleBungalow
View-
Age of property-
SqFt~2000-2500 SqFt
Lot Size7,764 SqFt(118.32 x 65.62)
Parking Spaces6
MLS ®NumberX12377825
Community NameTalbot
Data SourceTRREB
Listing byROYAL LEPAGE TRILAND REALTY

Features

Heating: Forced Air
Central Vacuum
Cooling: Central Air
Fireplace
Basement: Fin W/O, Sep Entrance

Main Floor

Kitchen

6.32 x 3.86

Dining

4.52 x 3.75

Primary

4.52 x 4.26

2nd Br

4.26 x 3.45


Features

Lot size: 7,764 SqFt

Parking

Garage spaces 2

Garage type Attached

Other parking spaces 4

Total parking spaces 6


Property History

Sep 3, 2025
ListedActive
$1,299,900
1 day on market
history photo preview50
Listing by trreb®

Market Data - Talbot

Geo Zone Map ThumbnailTalbot

Strong Buyer's Market

View Market Data

Detached house - for the past 30 days

Buyer's market Seller's market

Avg. Days on Market

Past 30 days

24 days

Compared to

2024

59 days

2023

9 days

2022

34 days

New Listings

Past 30 days

20 listings

Compared to

2024

22 listings

2023

22 listings

2022

18 listings

Units sold

Past 30 days

5 units

Compared to

2024

5 units

2023

2 units

2022

4 units

Median Sold Price

Past 30 days

$990,000

Compared to

2024

$895,000

2023

$1,074,665

2022

$770,000


Population and Demographics

Overview

Total population 4380
Average household income $166,024

Age (%)

0 to 19
28%
20 to 34
17%
35 to 49
22%
50 to 64
18%
65 and plus
15%

Household composition (%)

Single family
77%
Single person
20%
Multi person
2%
Multi family
1%

Mother tongue (%)

English
79%
Arabic
5%
Punjabi (Panjabi)
3%
Portuguese
2%
Polish
1%
Others
1%
Spanish
1%
French
1%
Italian
1%

House tenancy (%)

Owners
75%
Renters
25%

What’s nearby?Essentials within 5 km

Local Logic

Transportation Scores

Estimated Budget