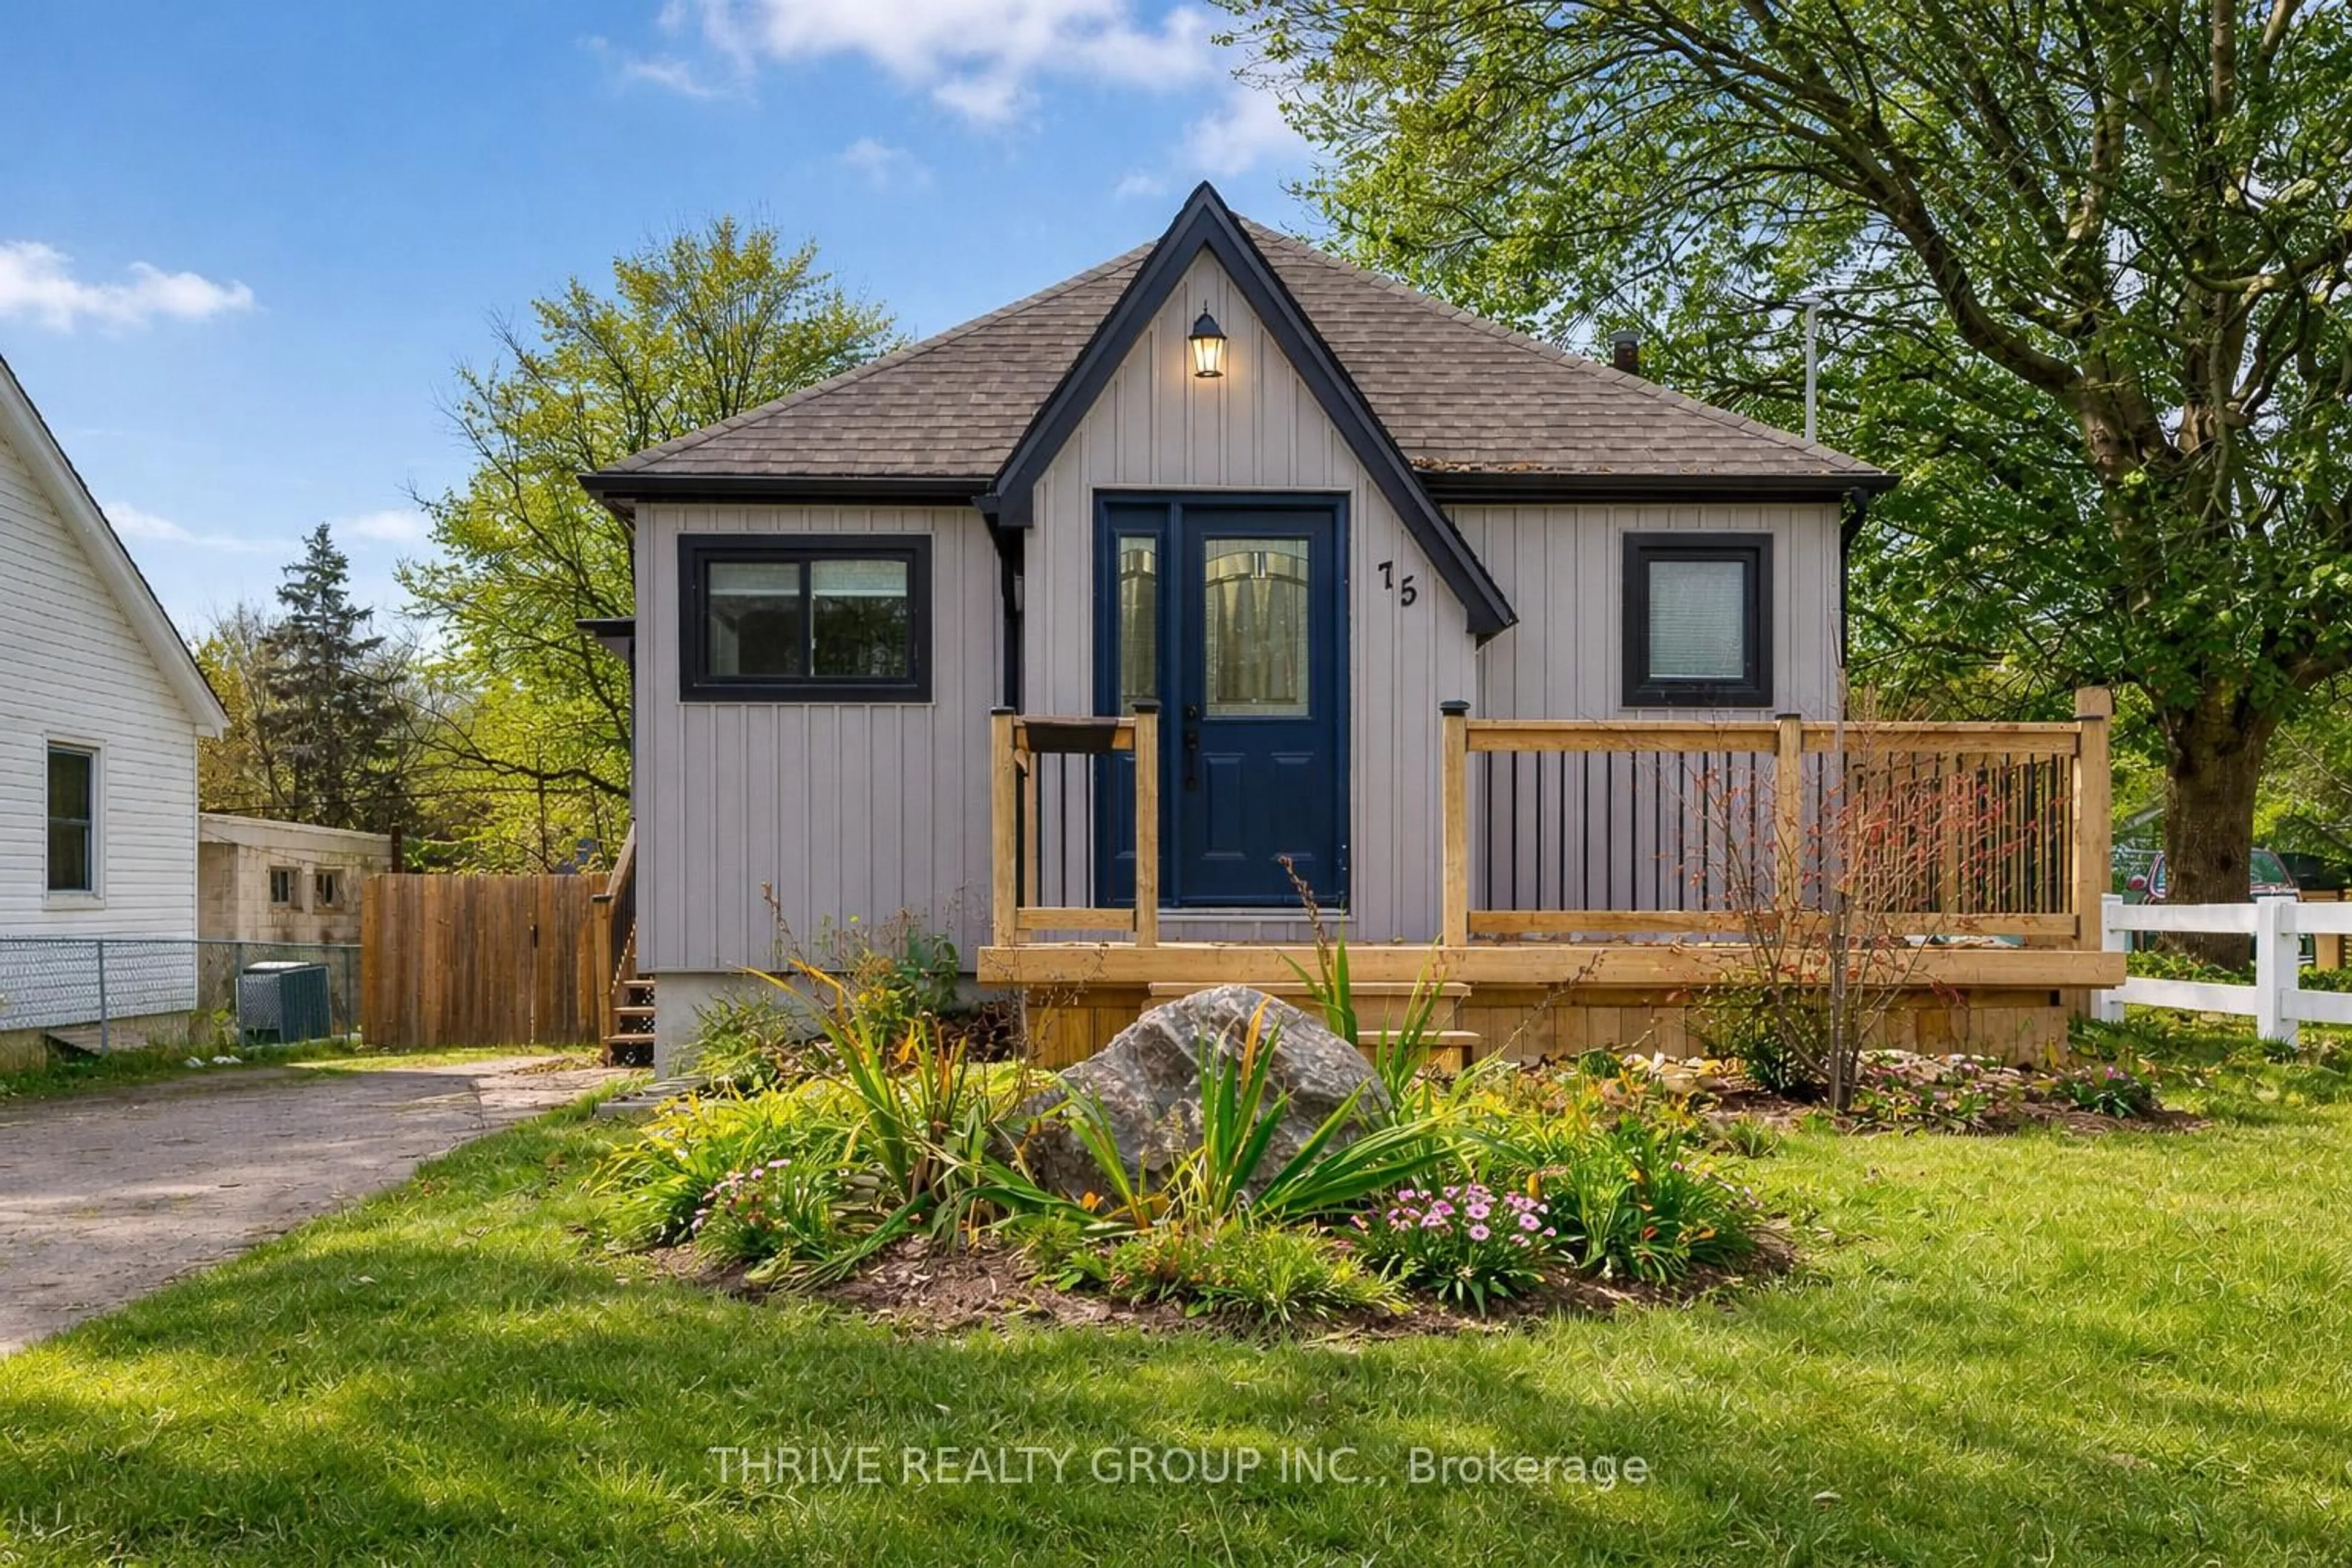
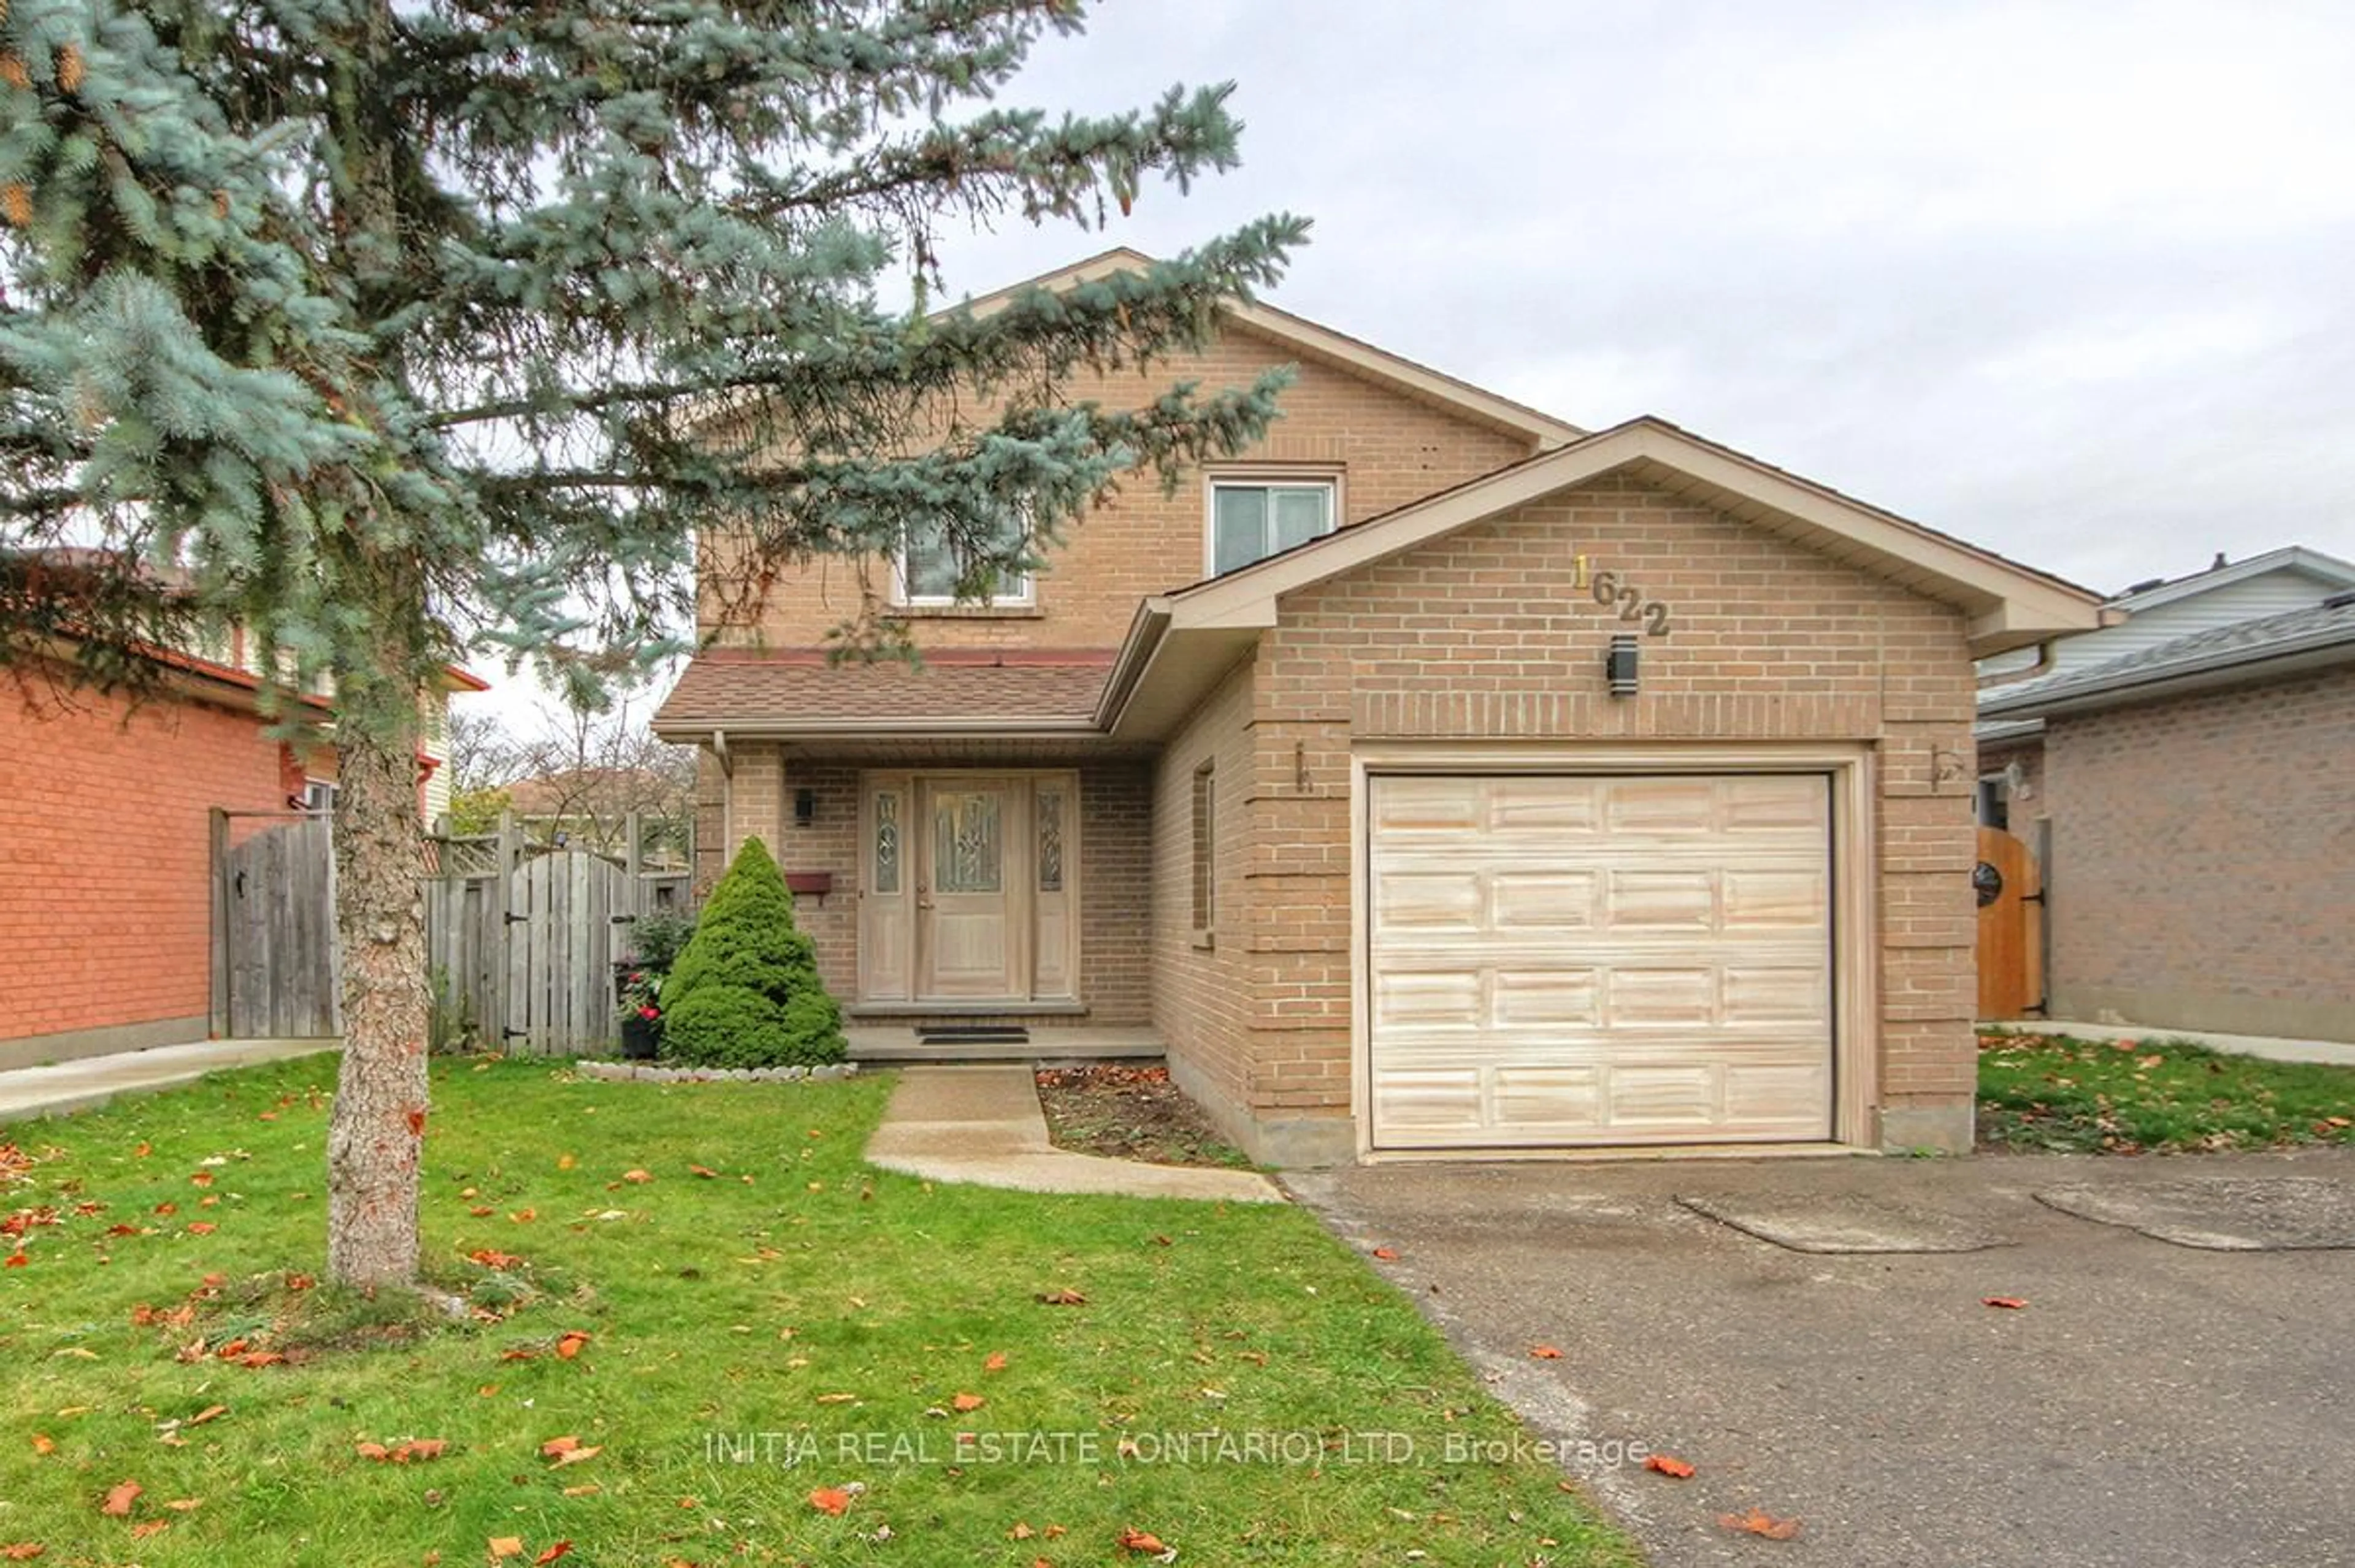
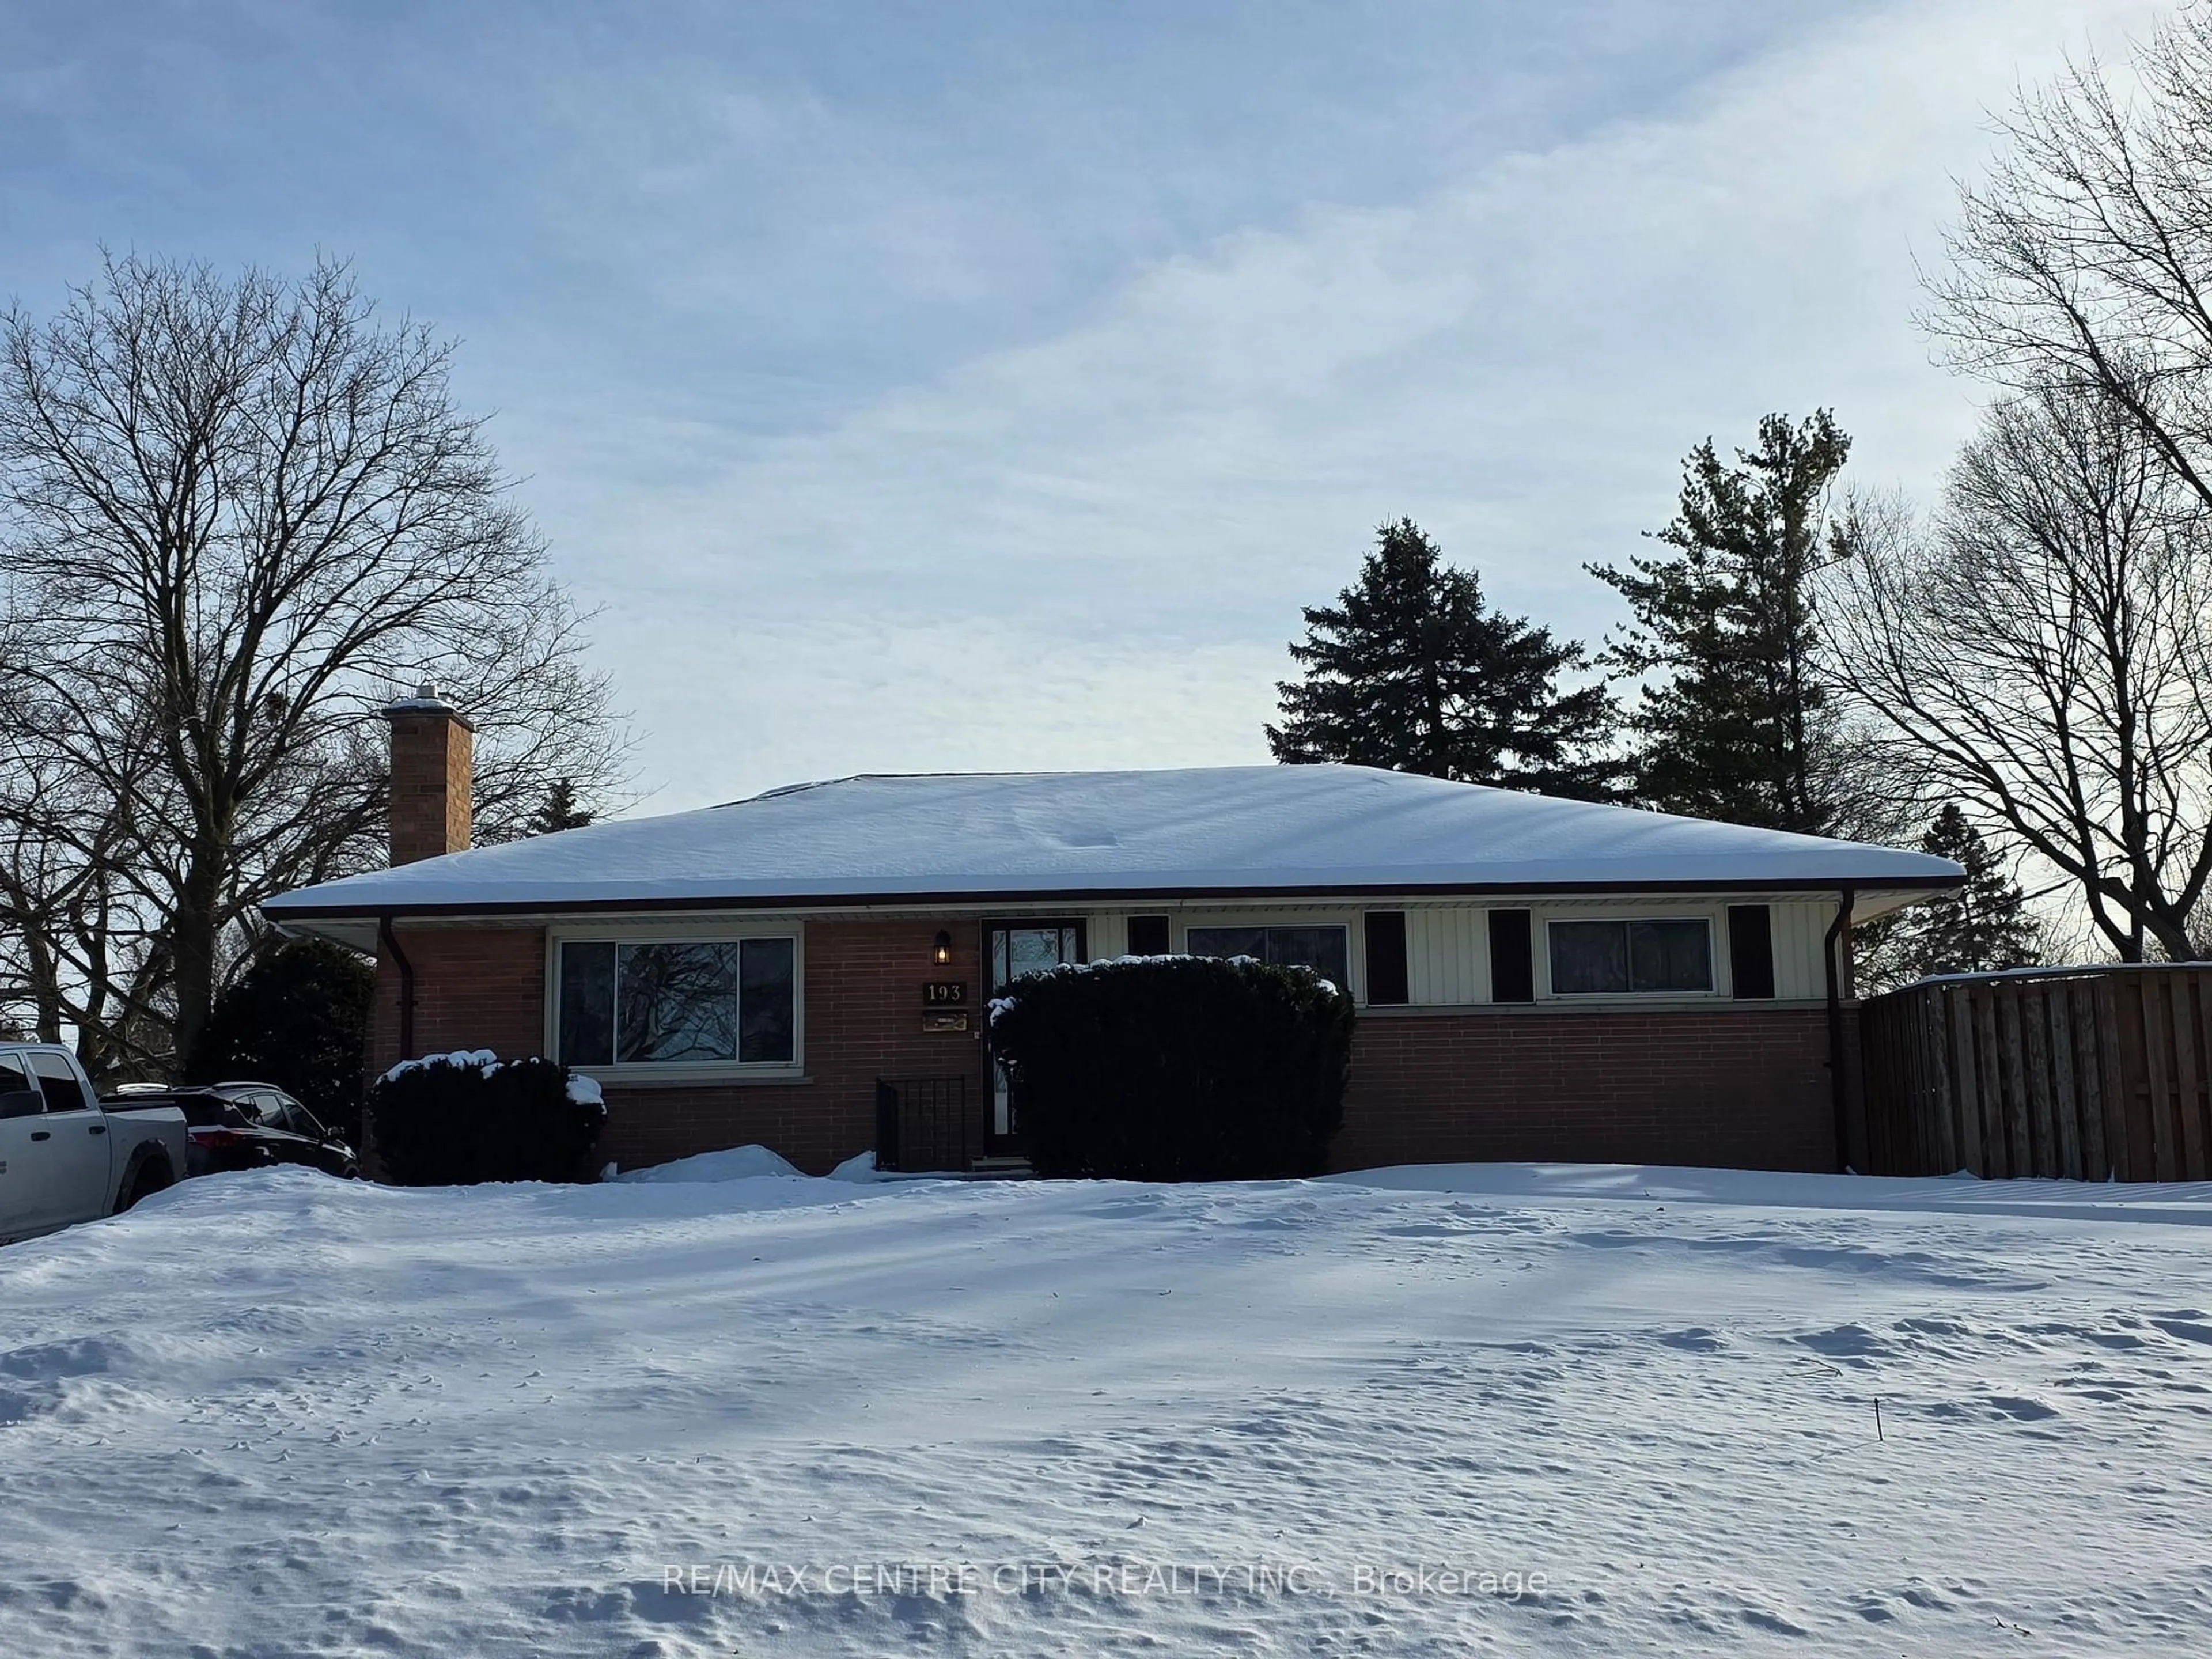
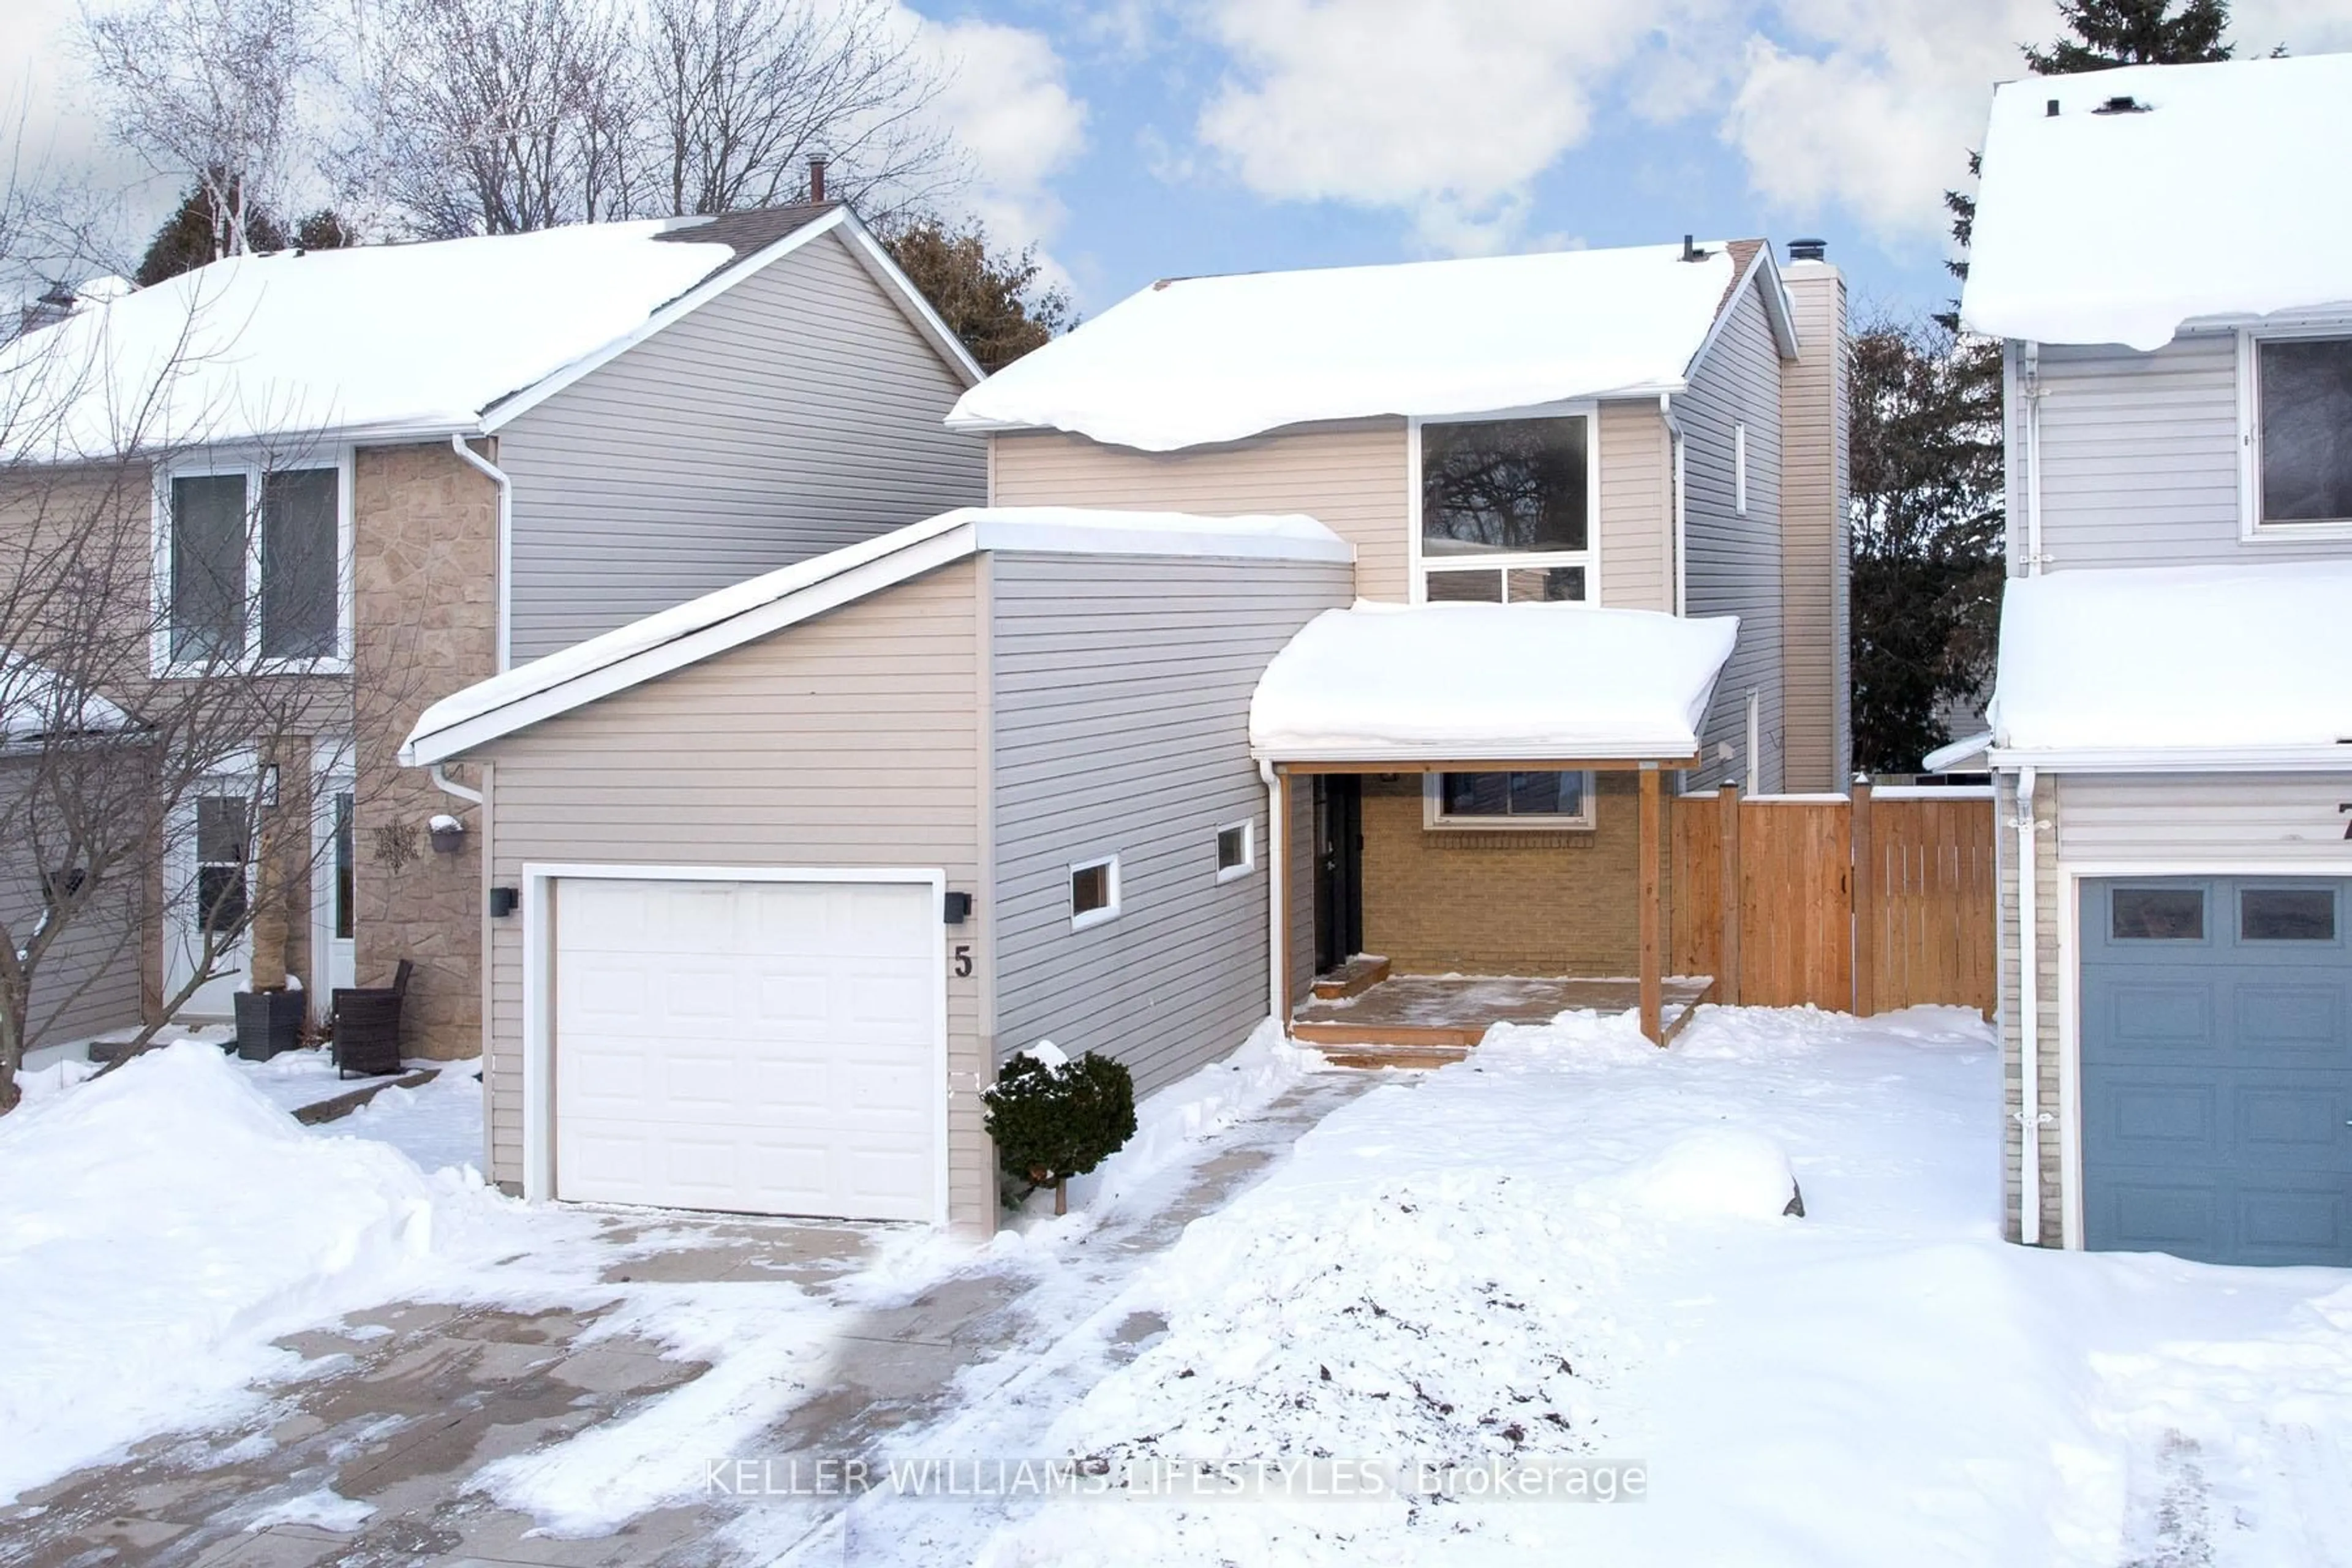
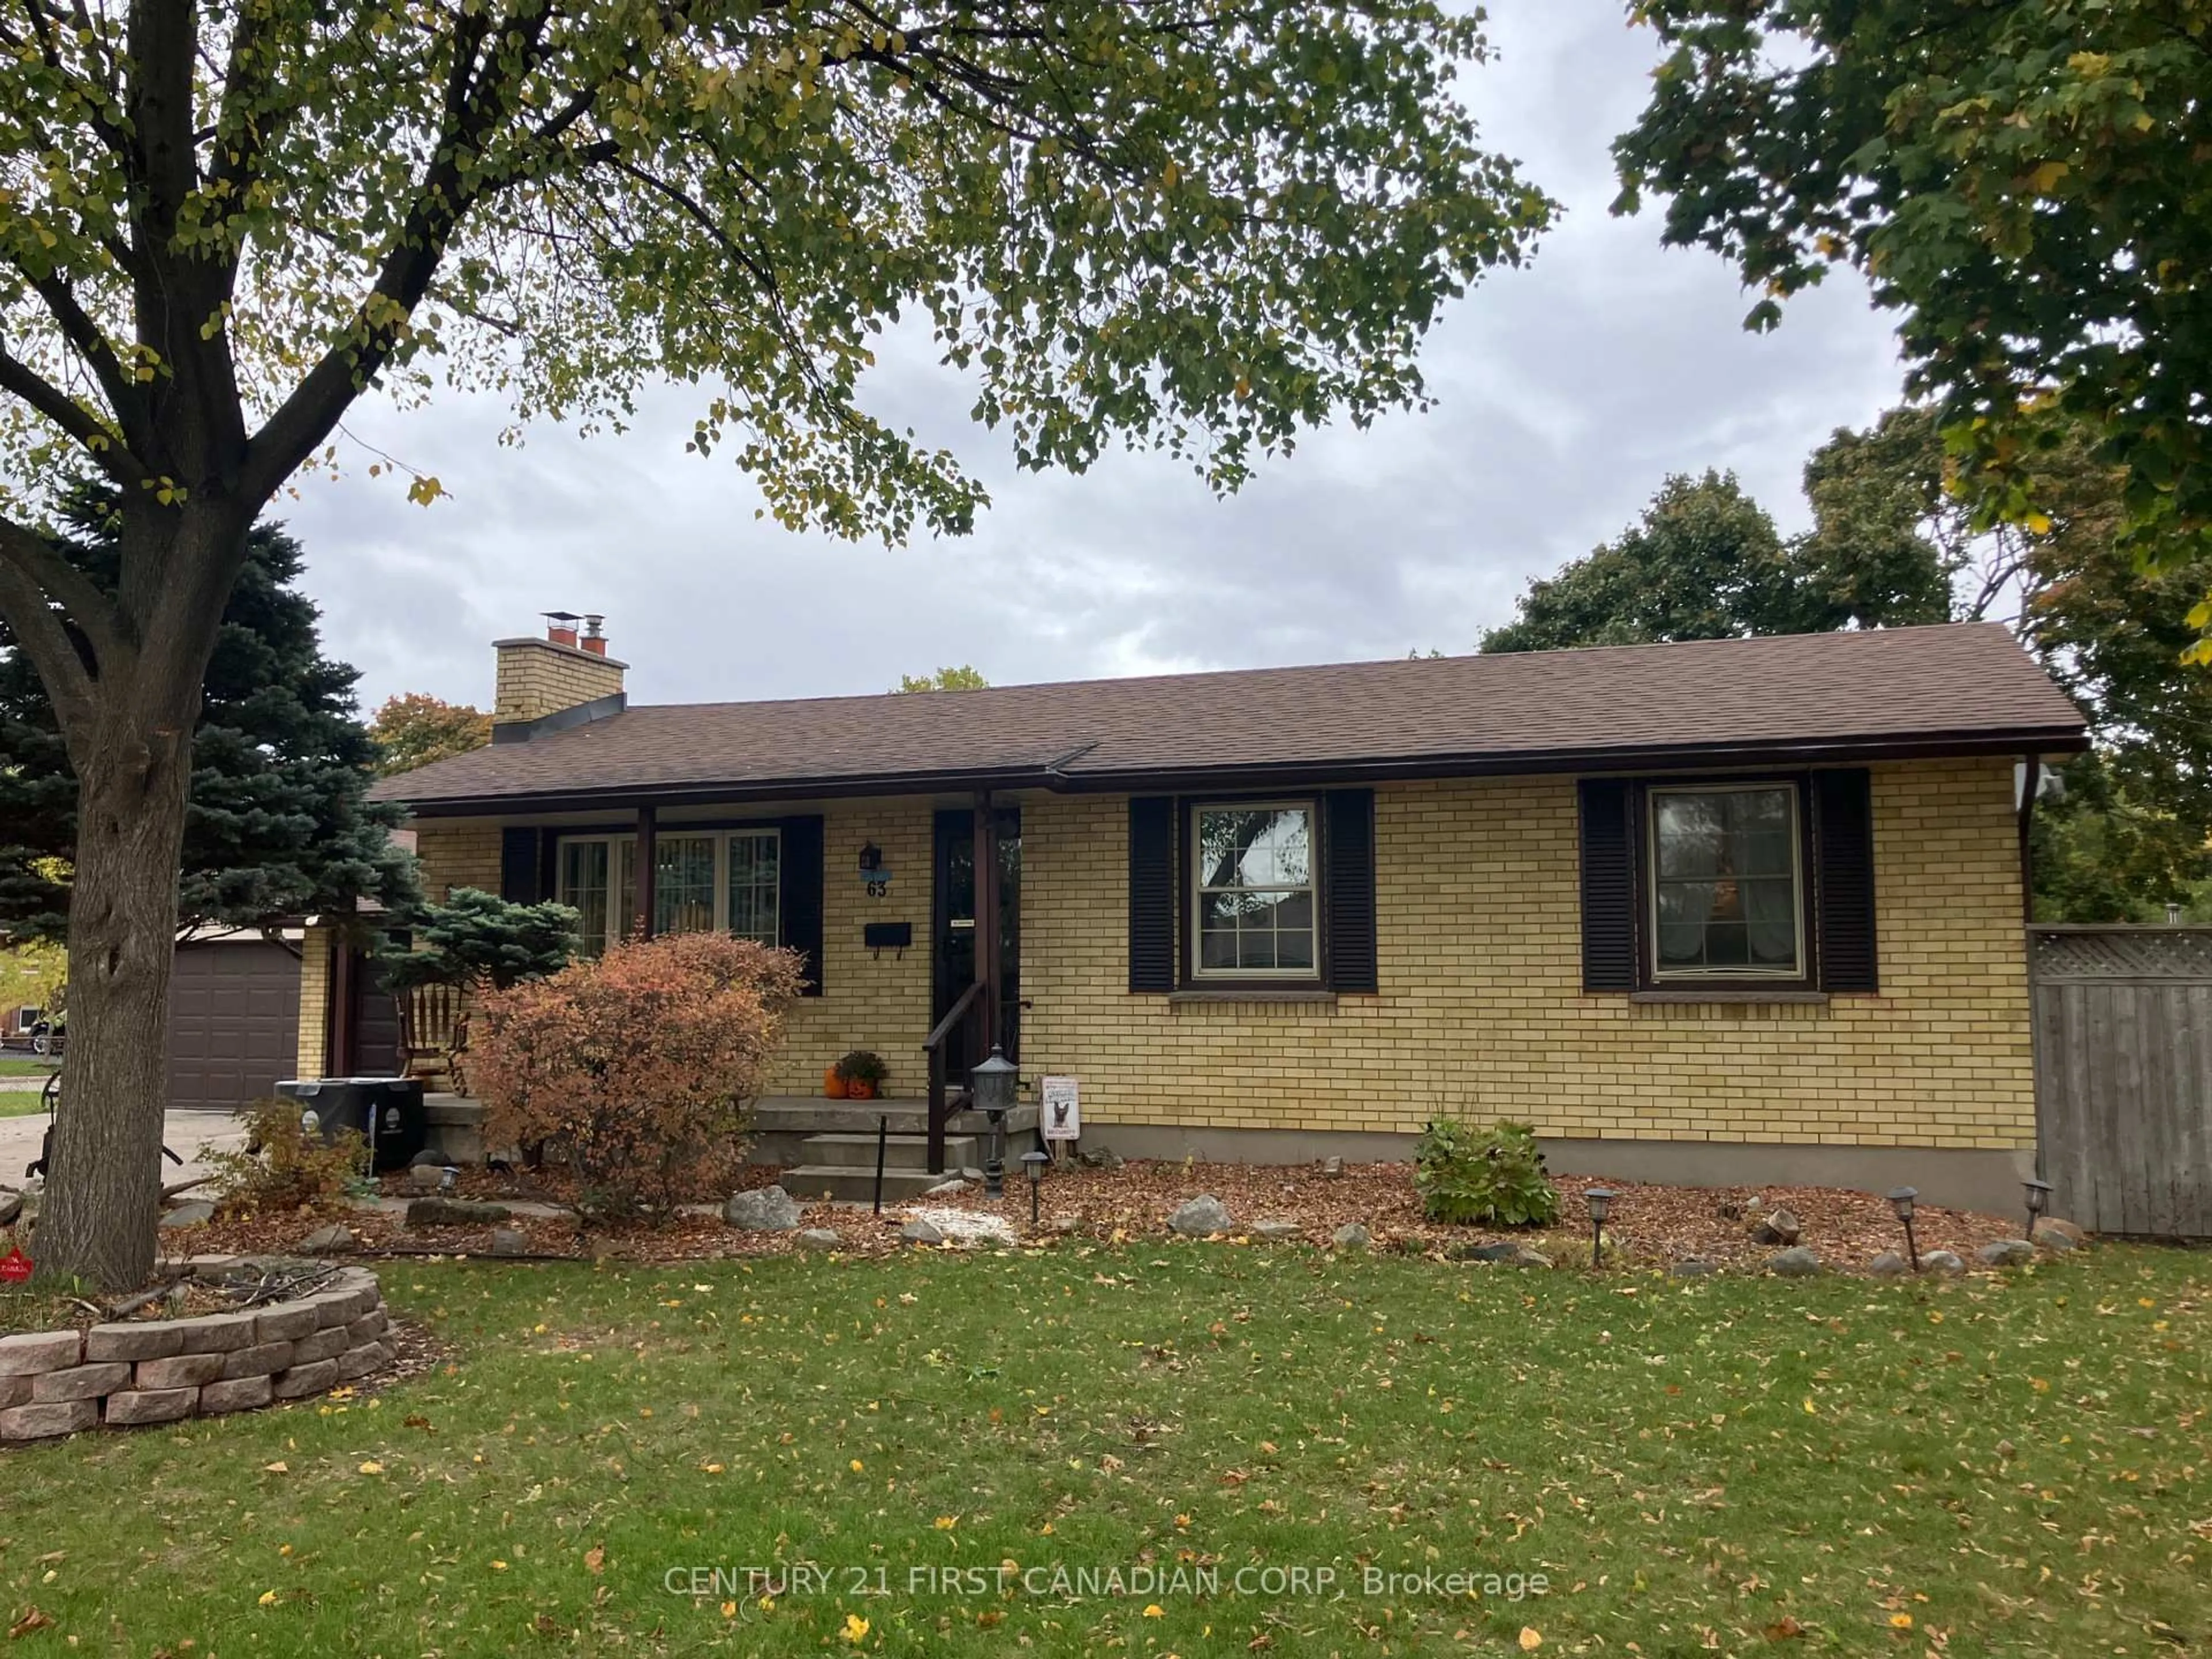
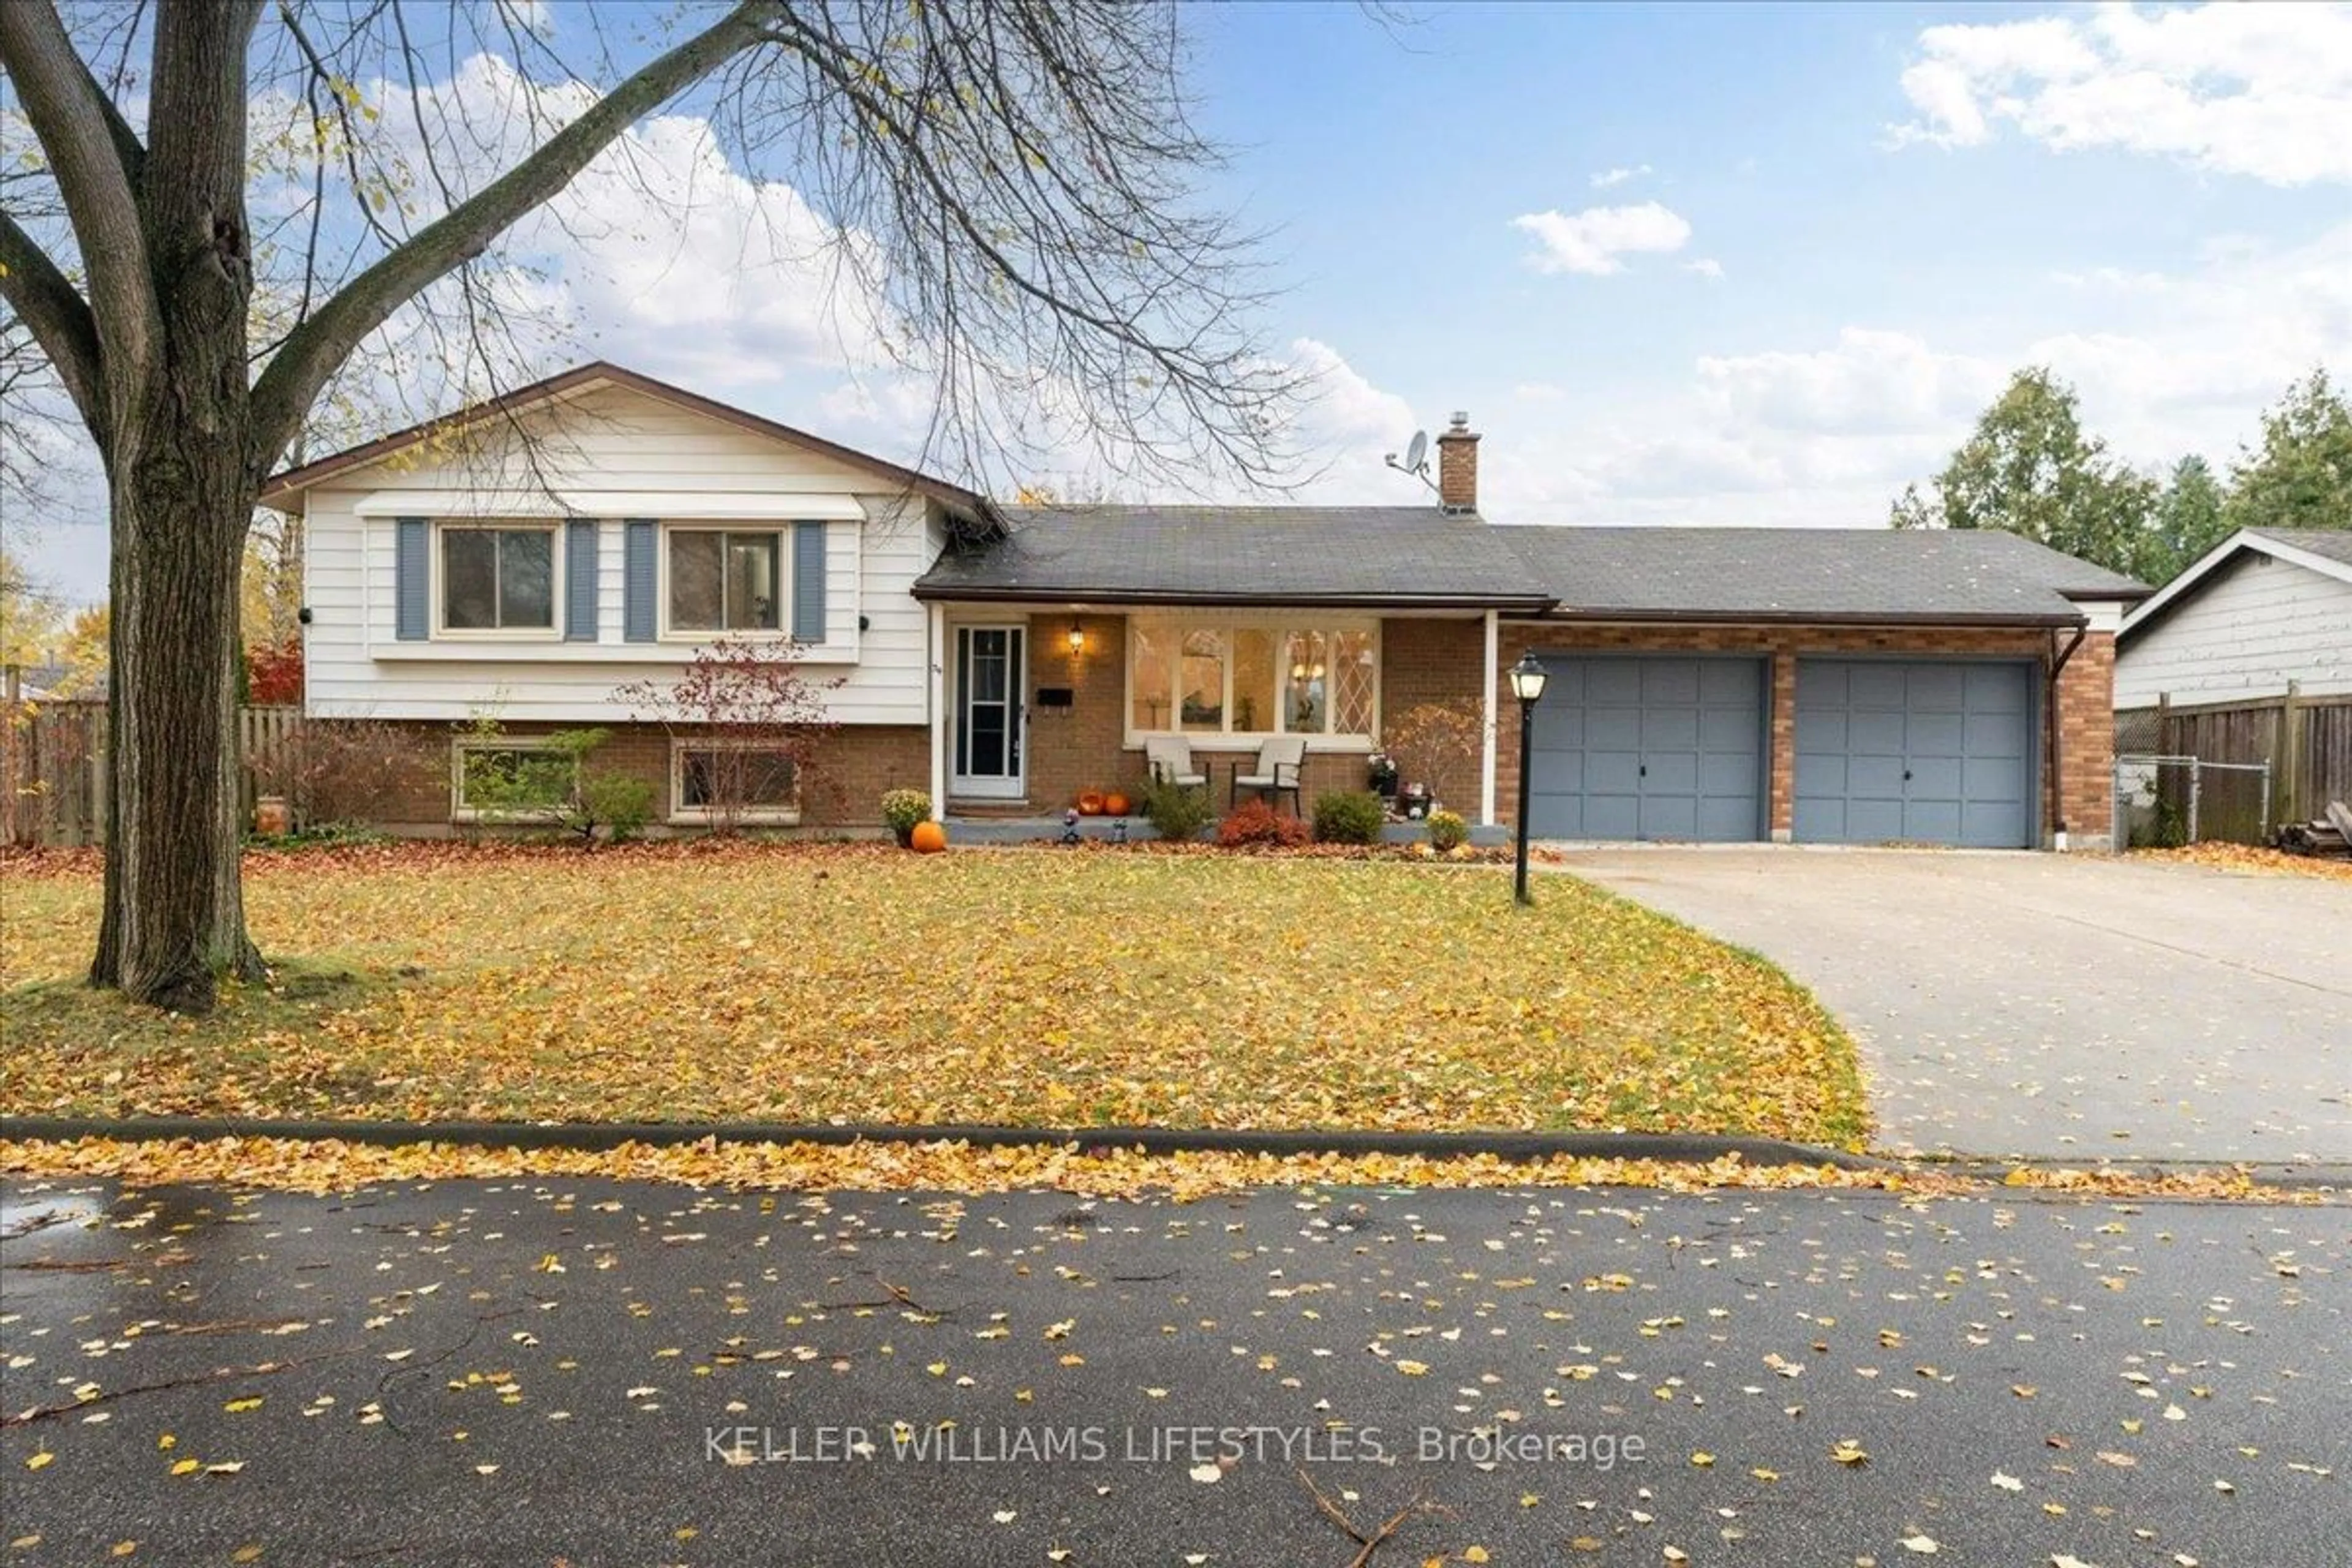
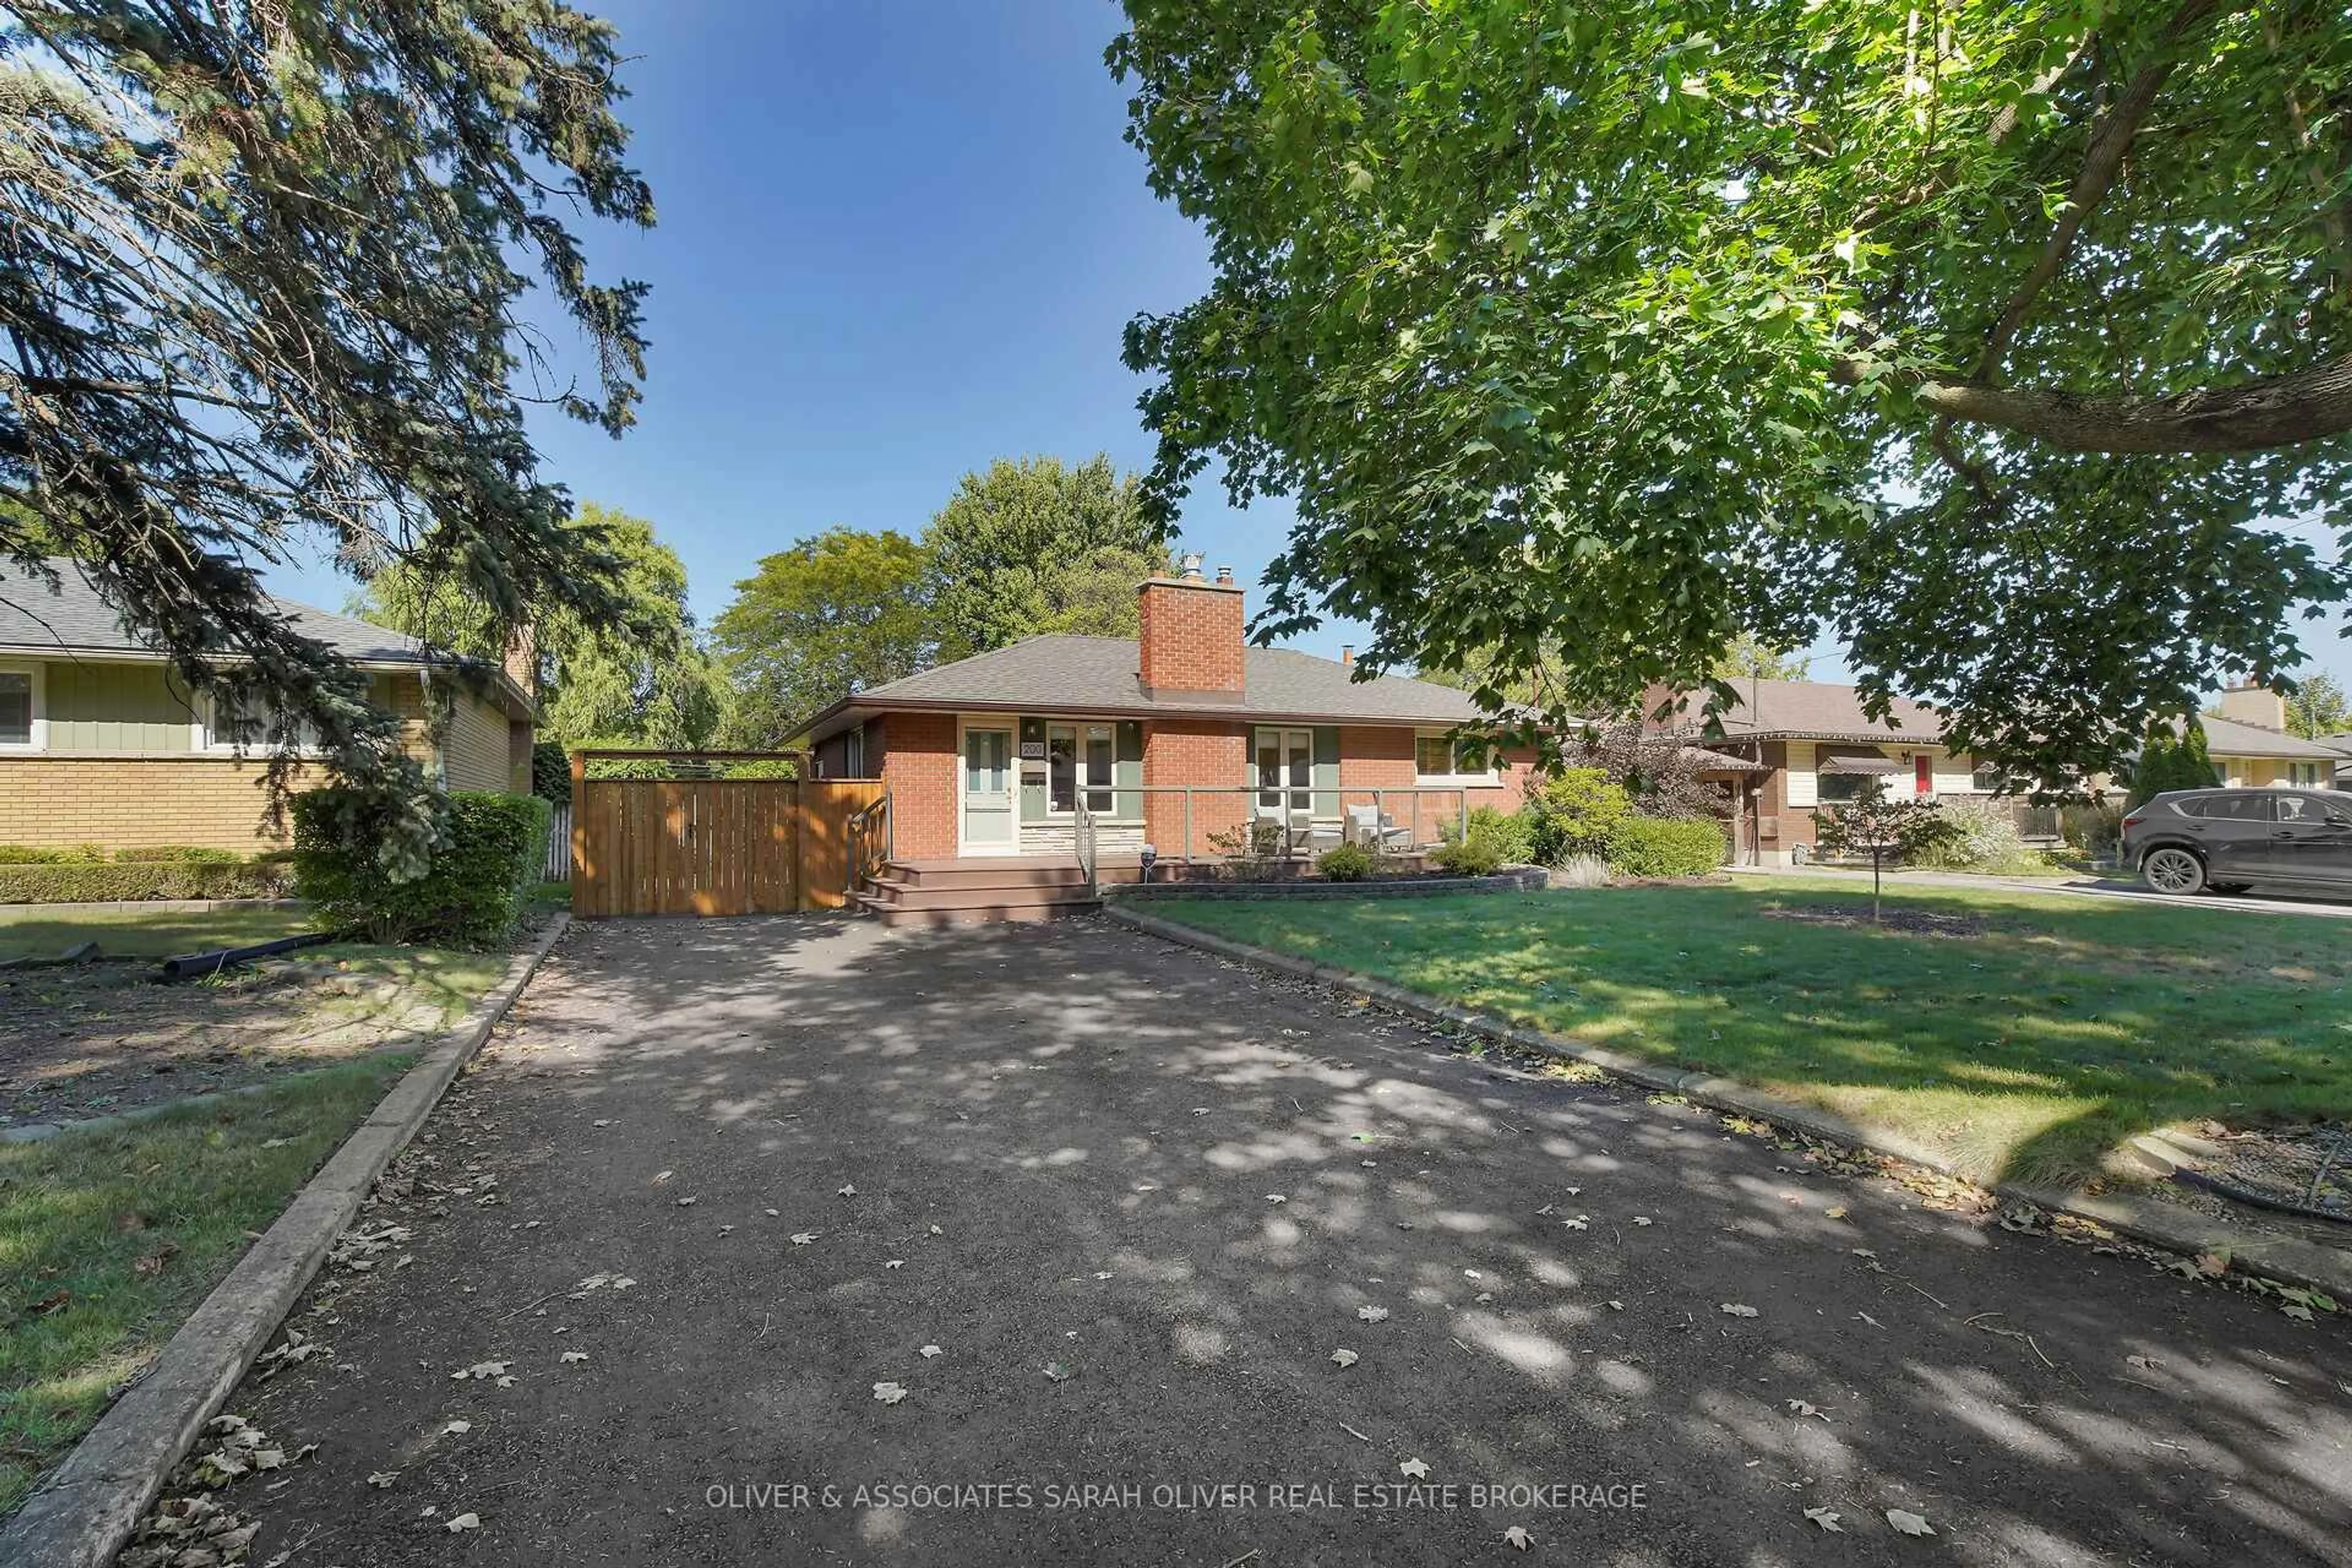
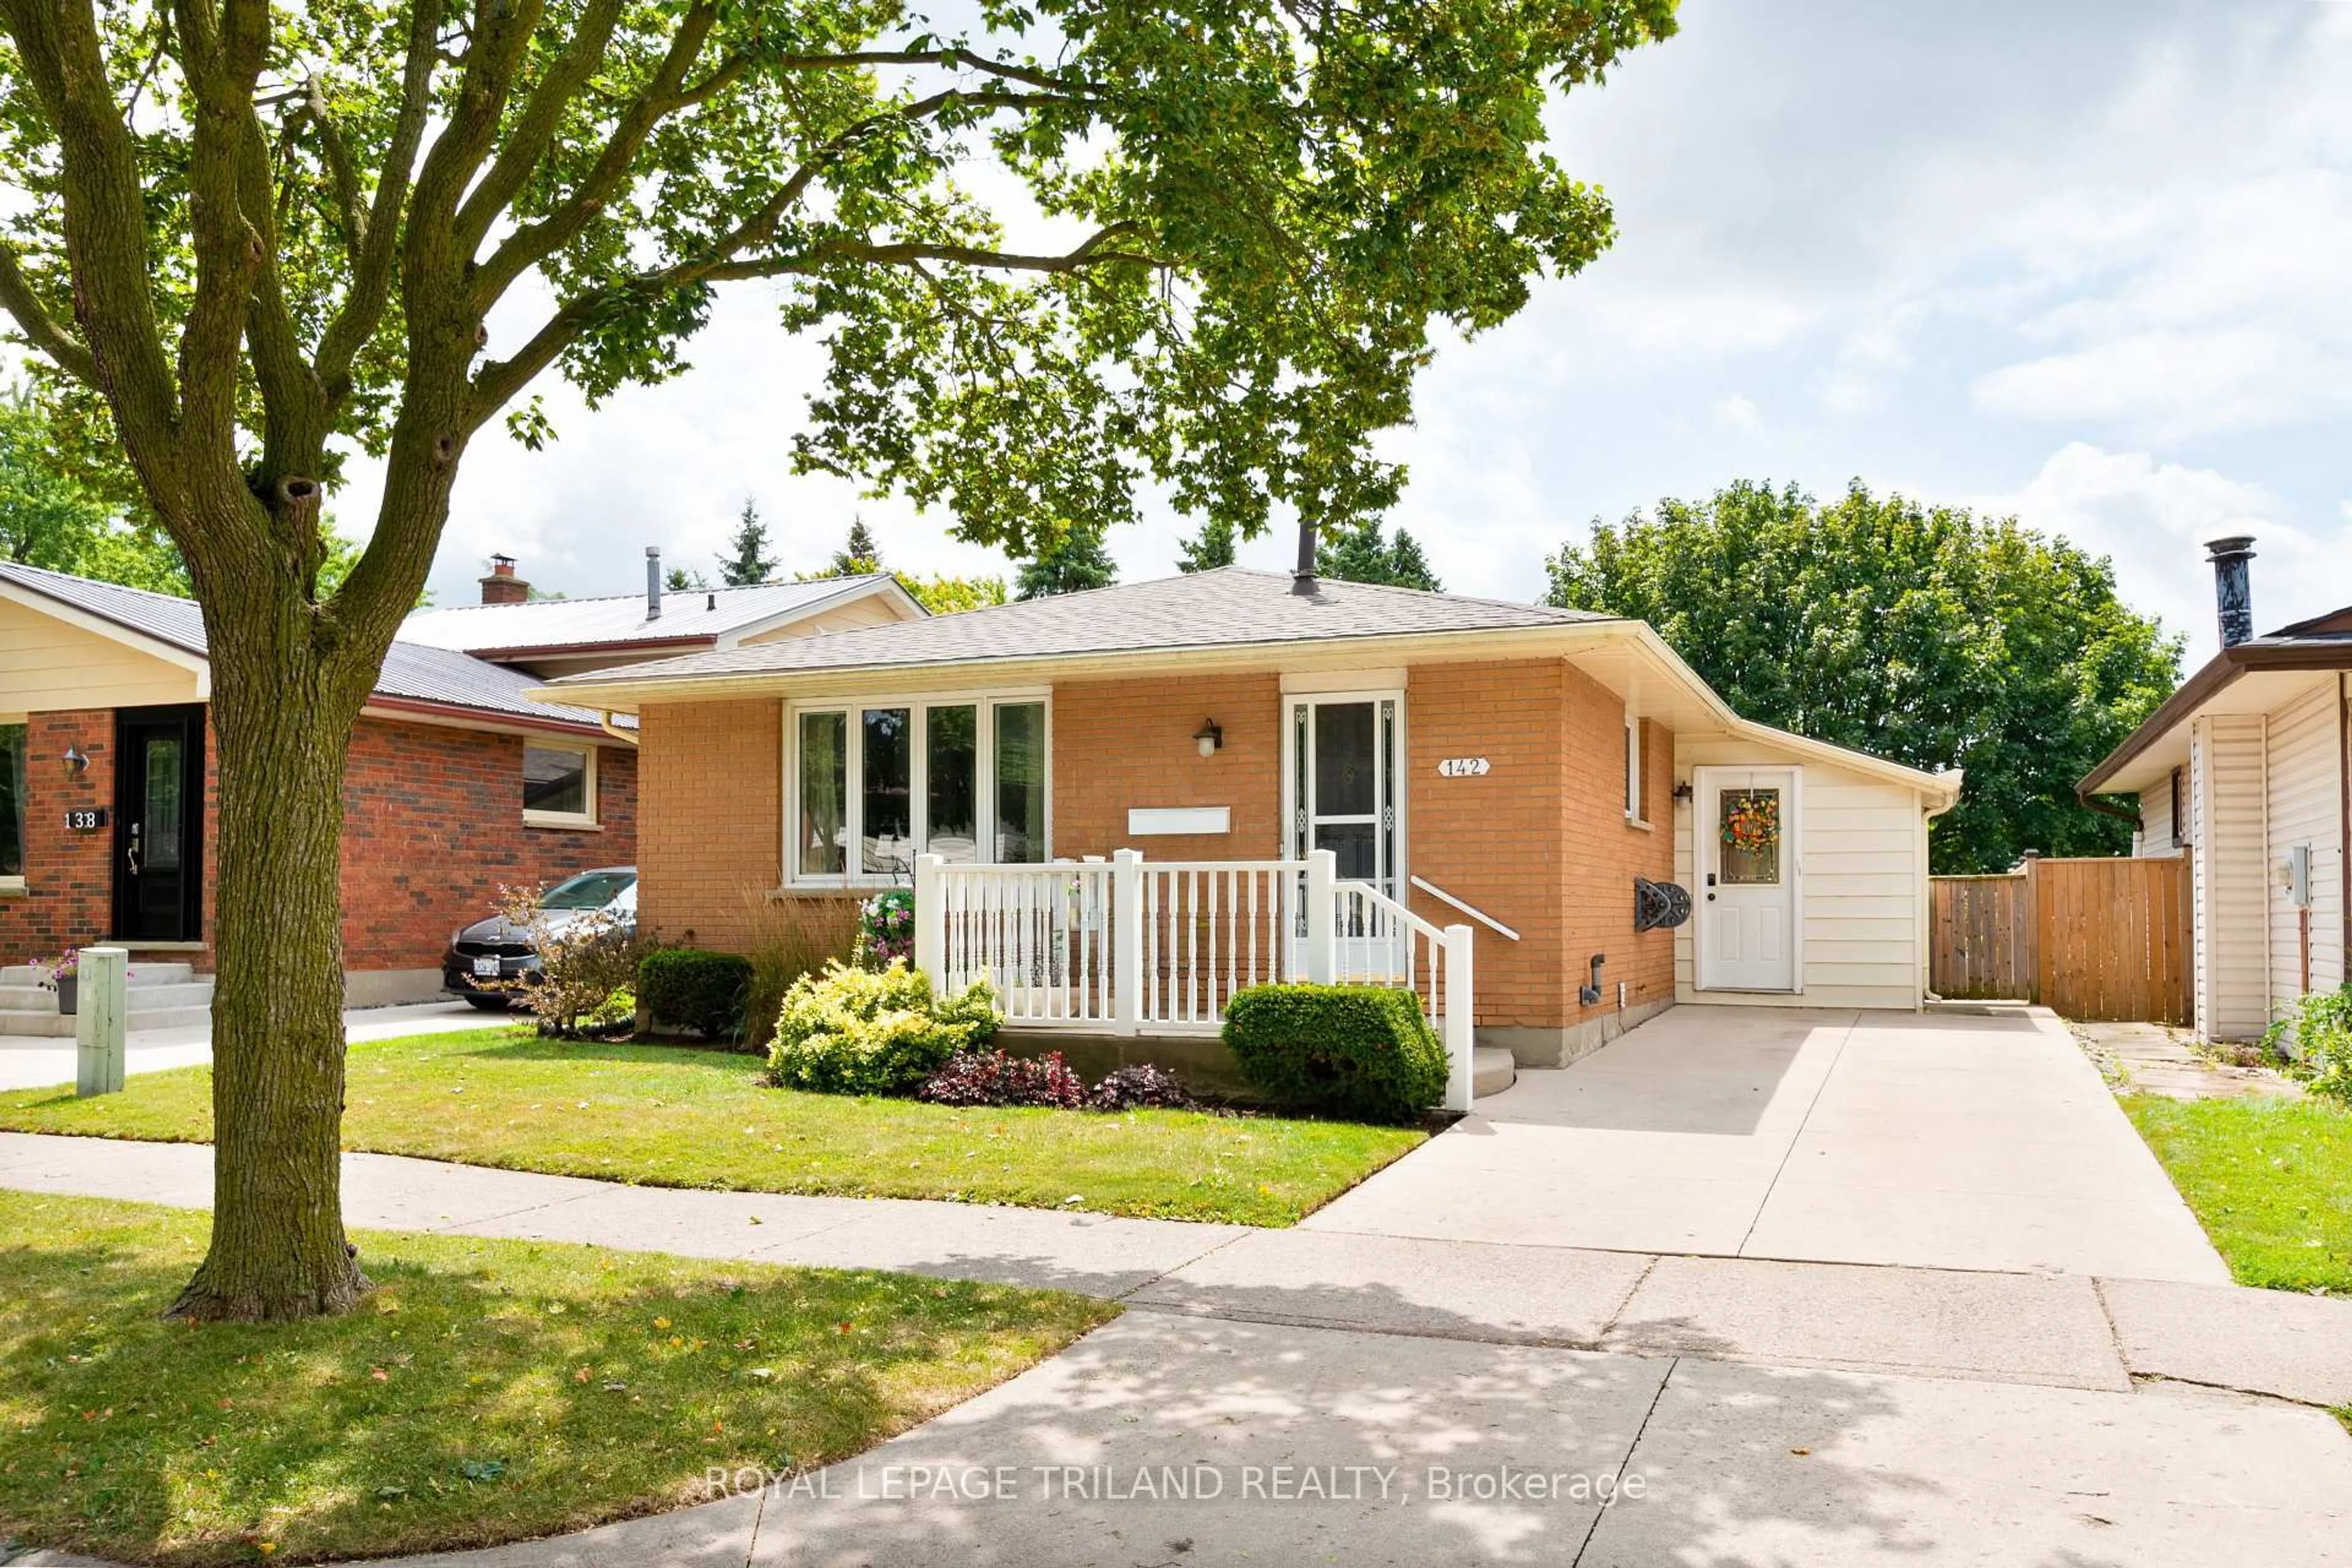
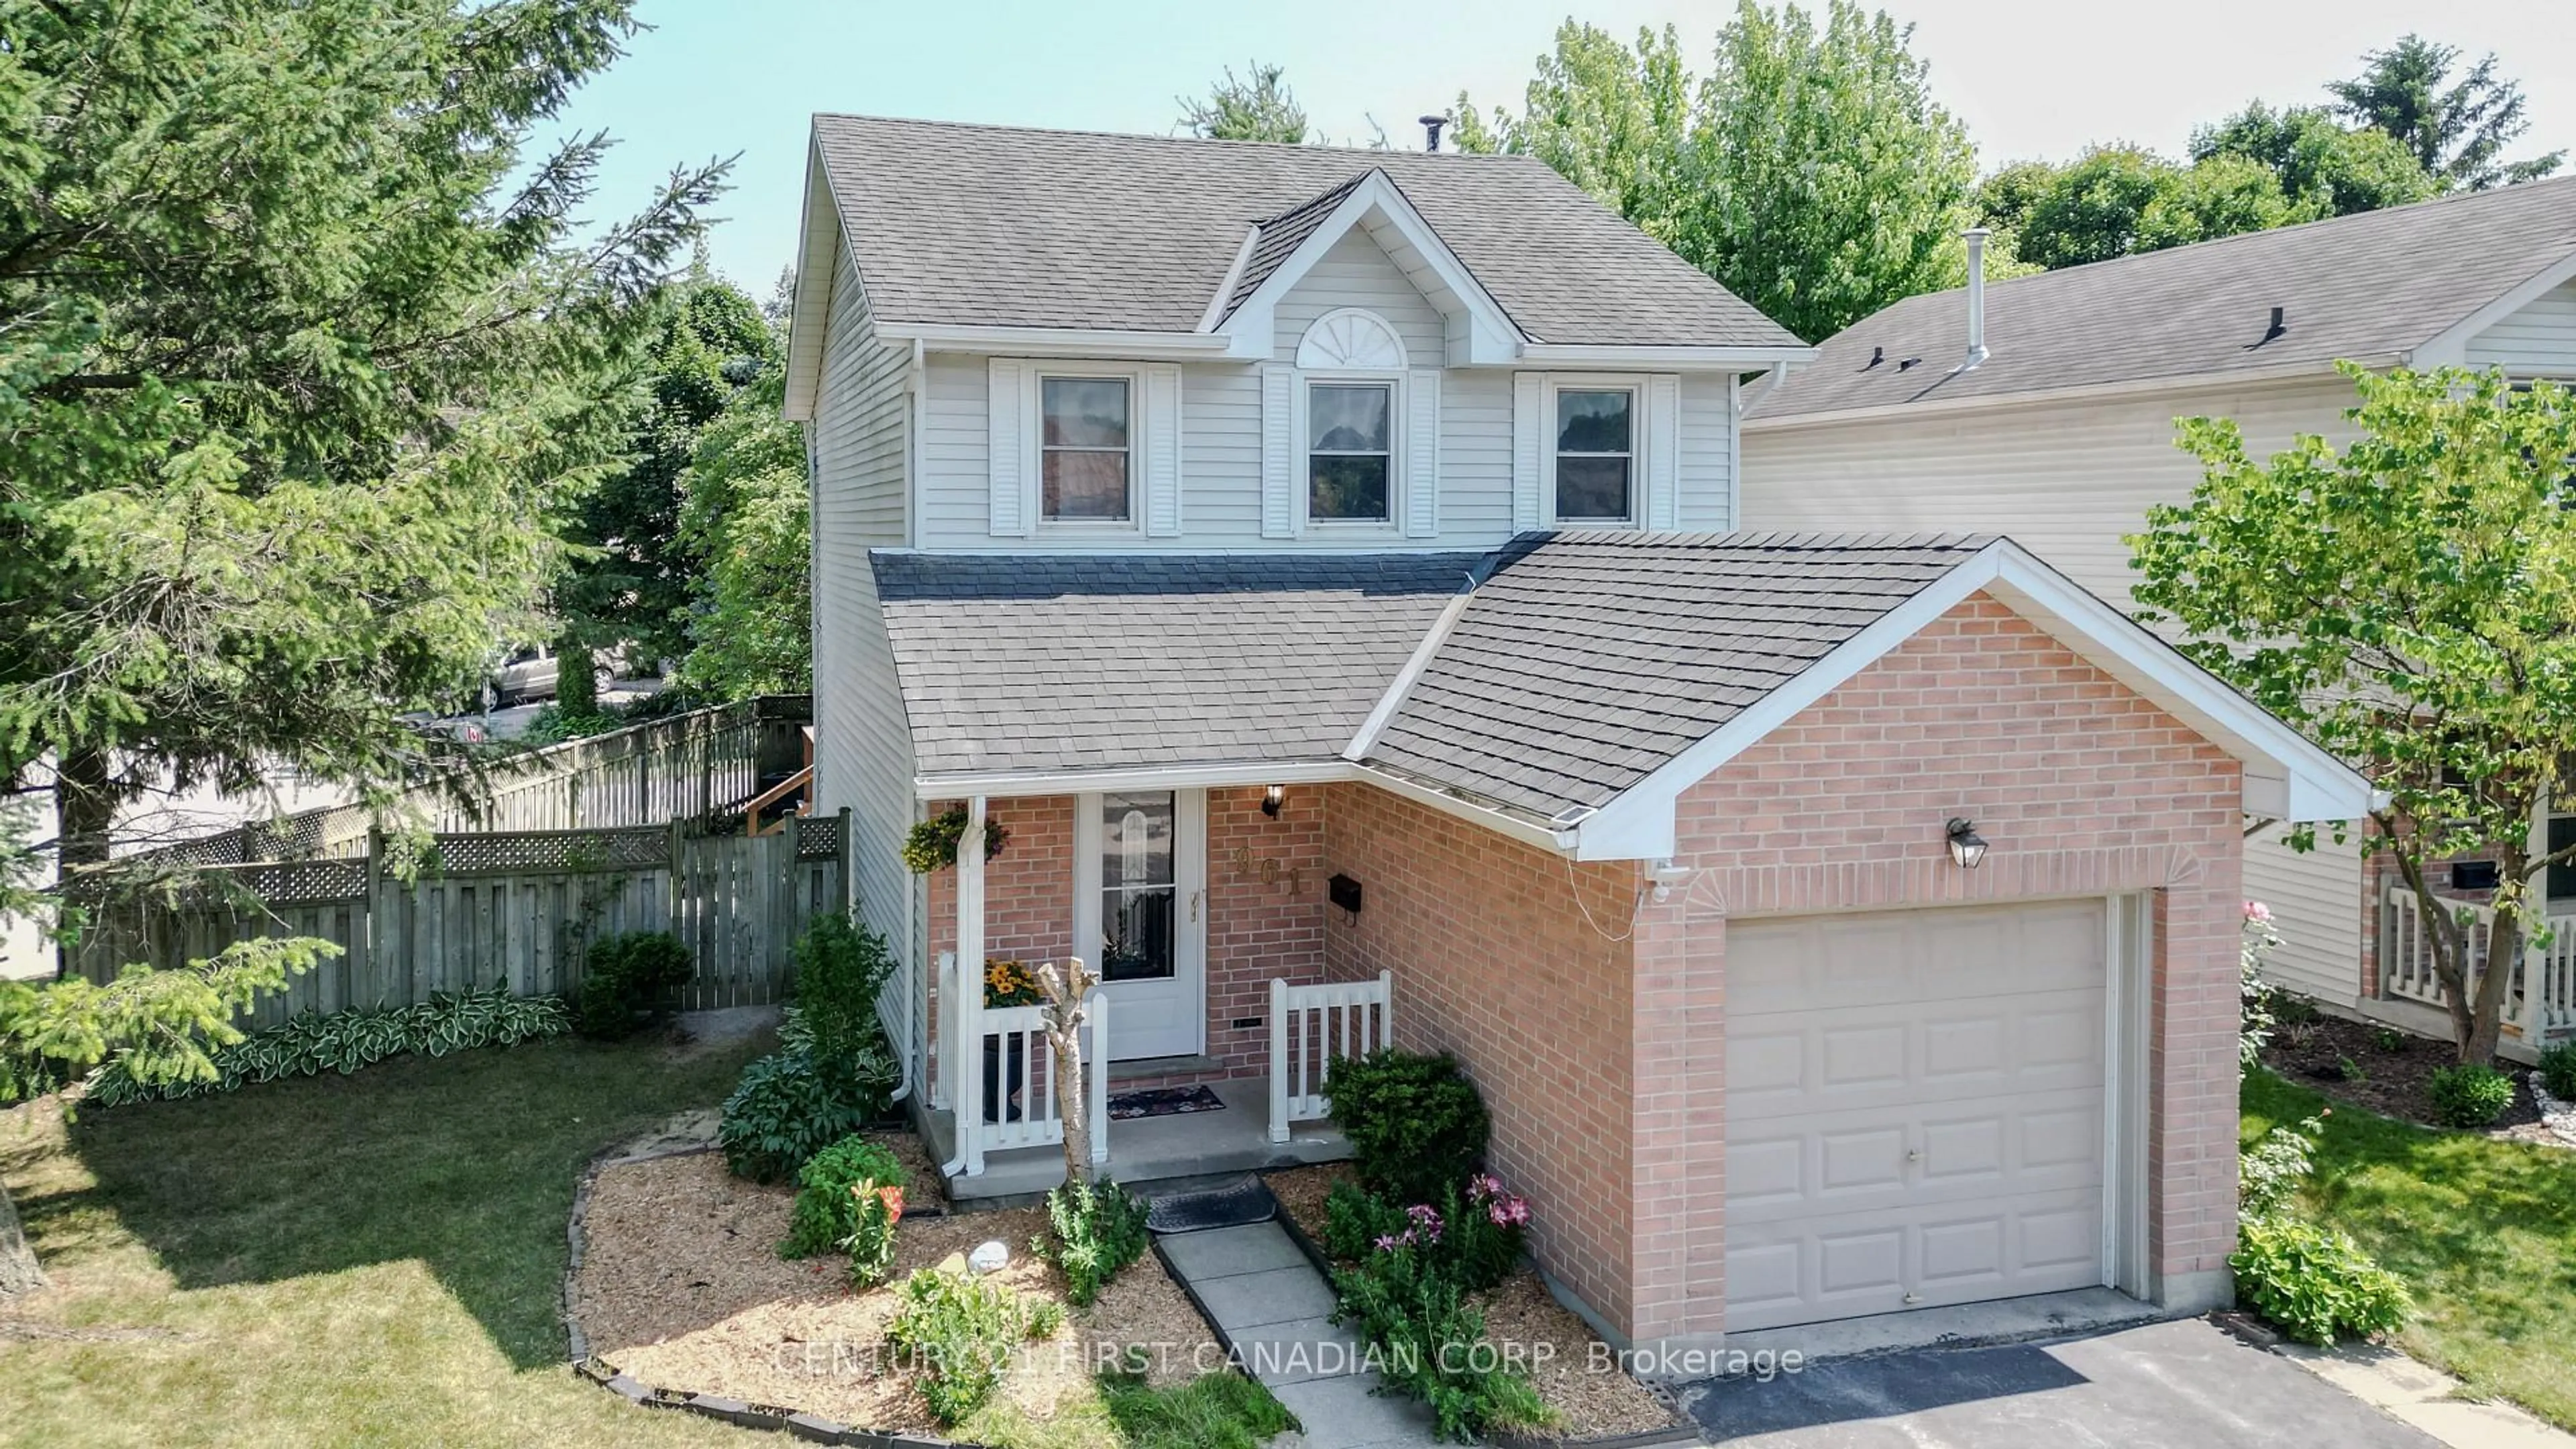
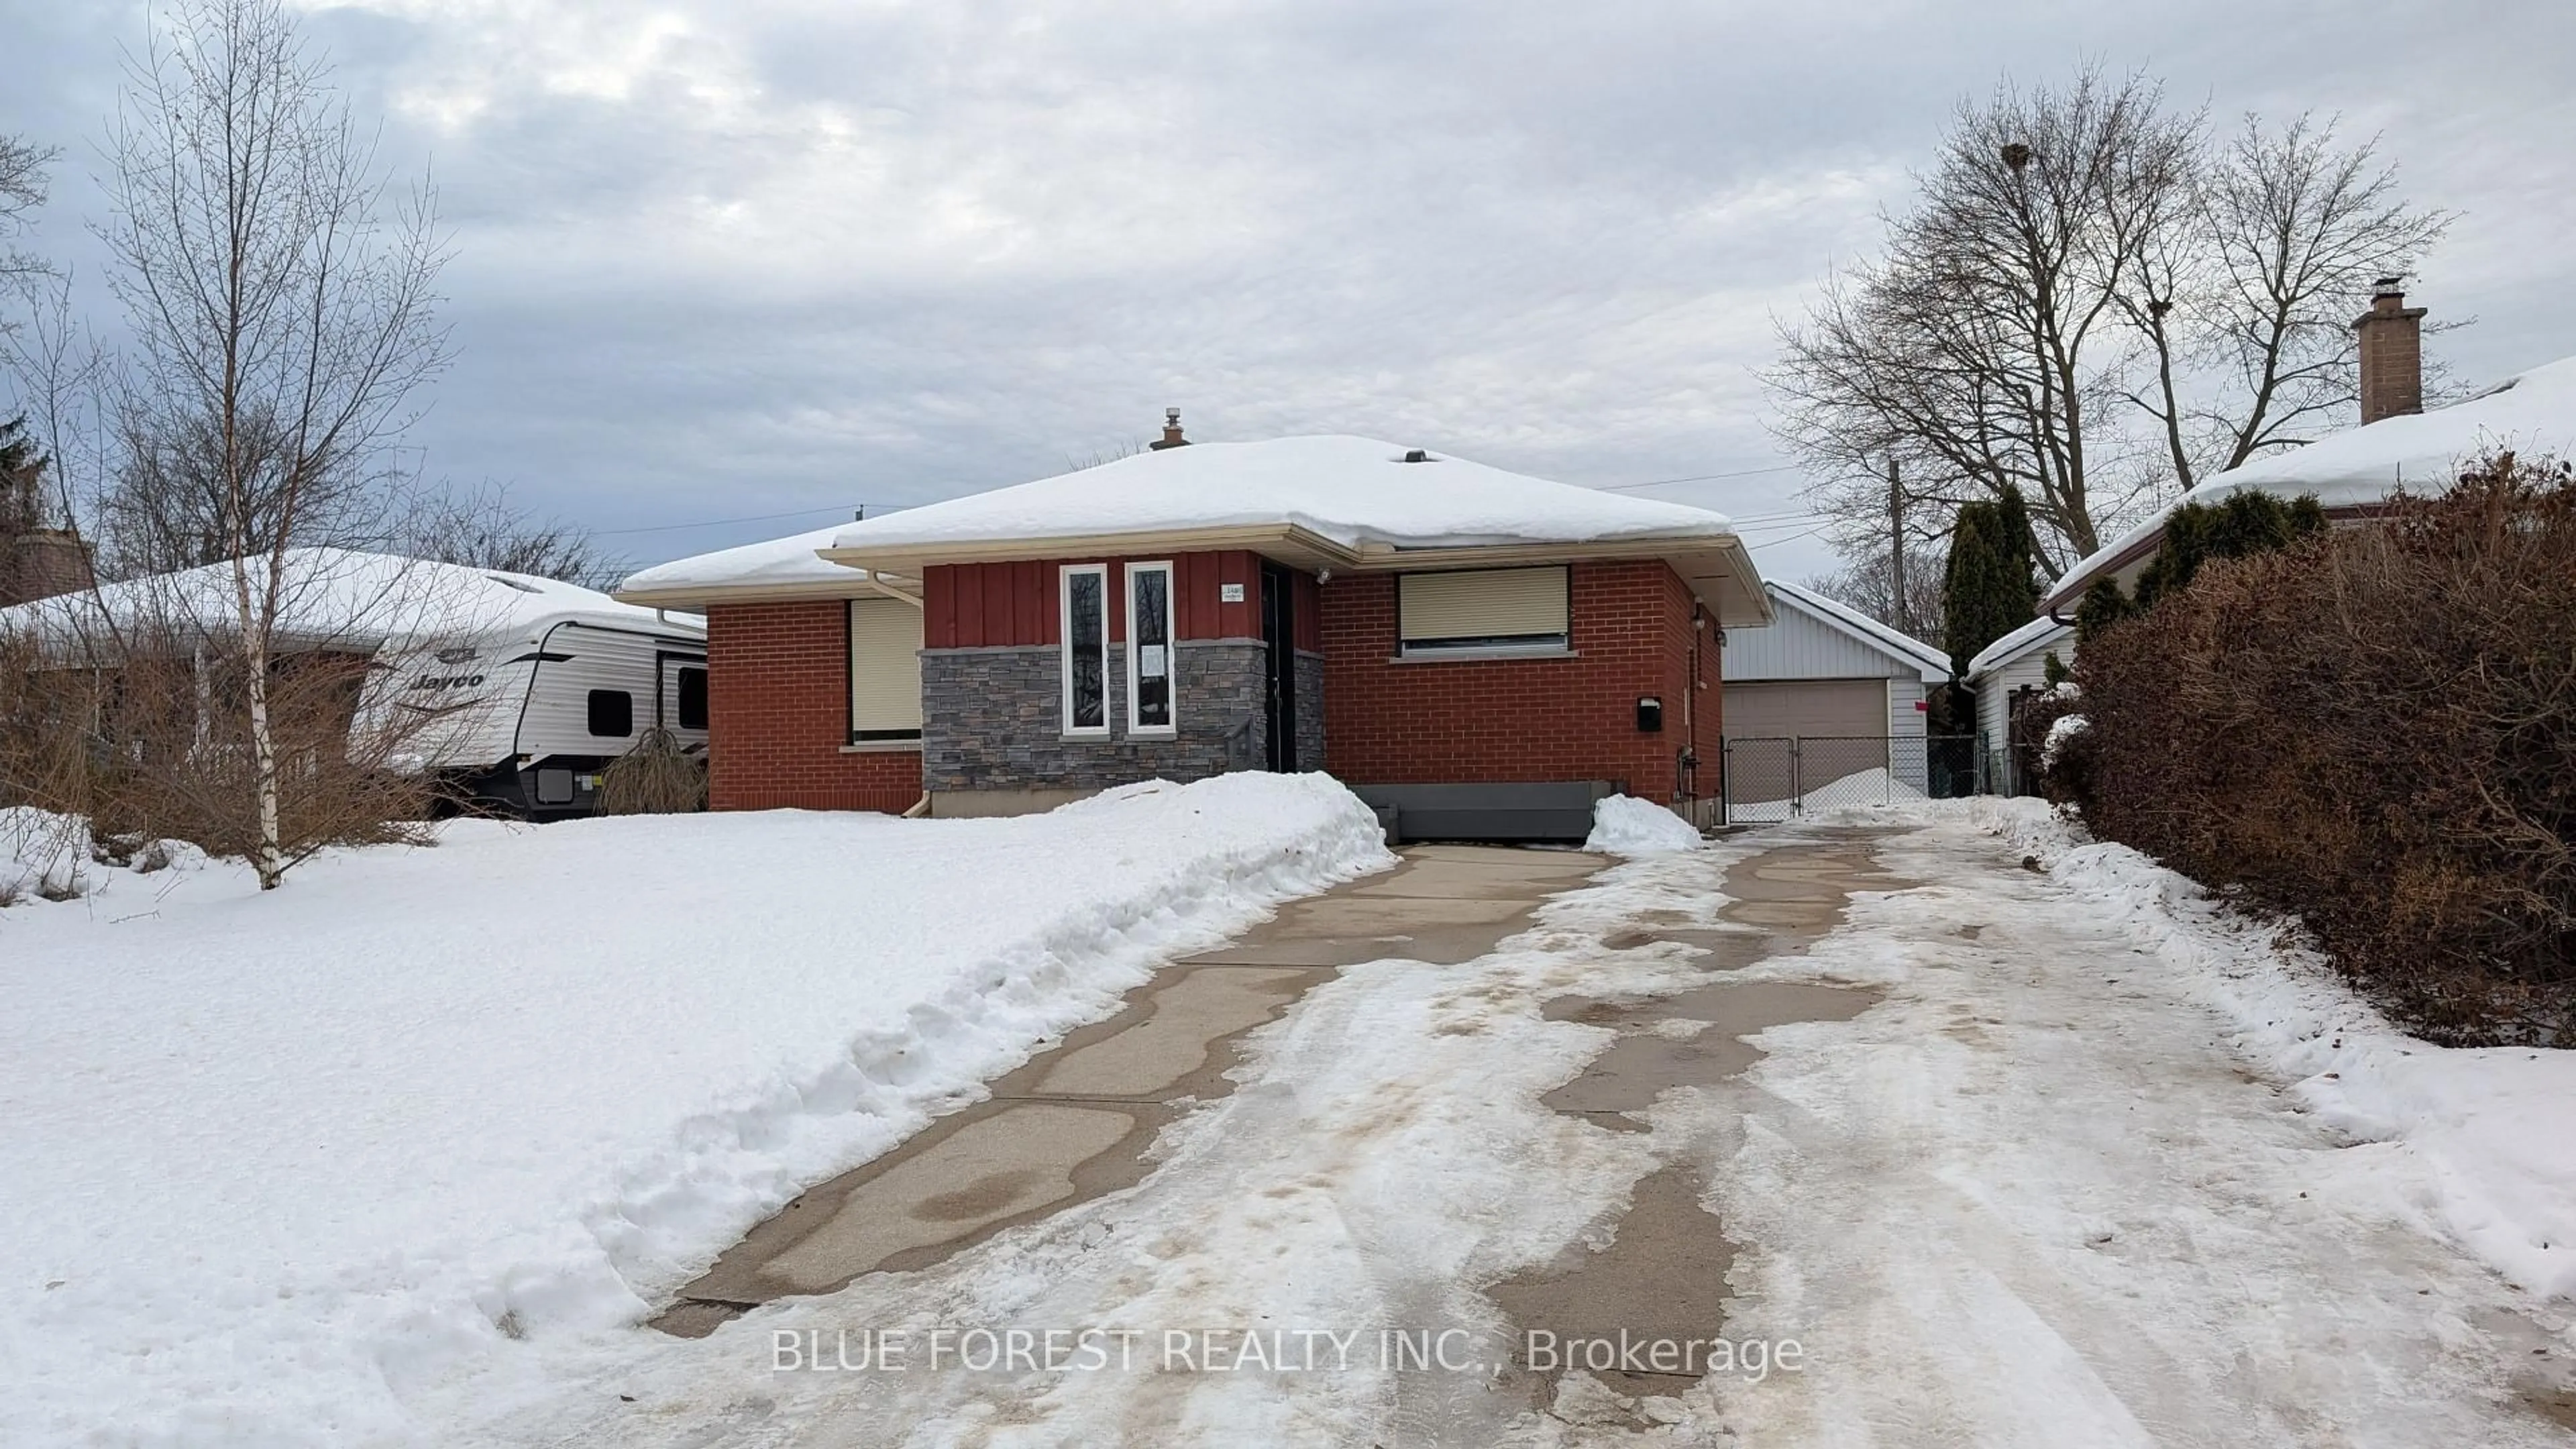
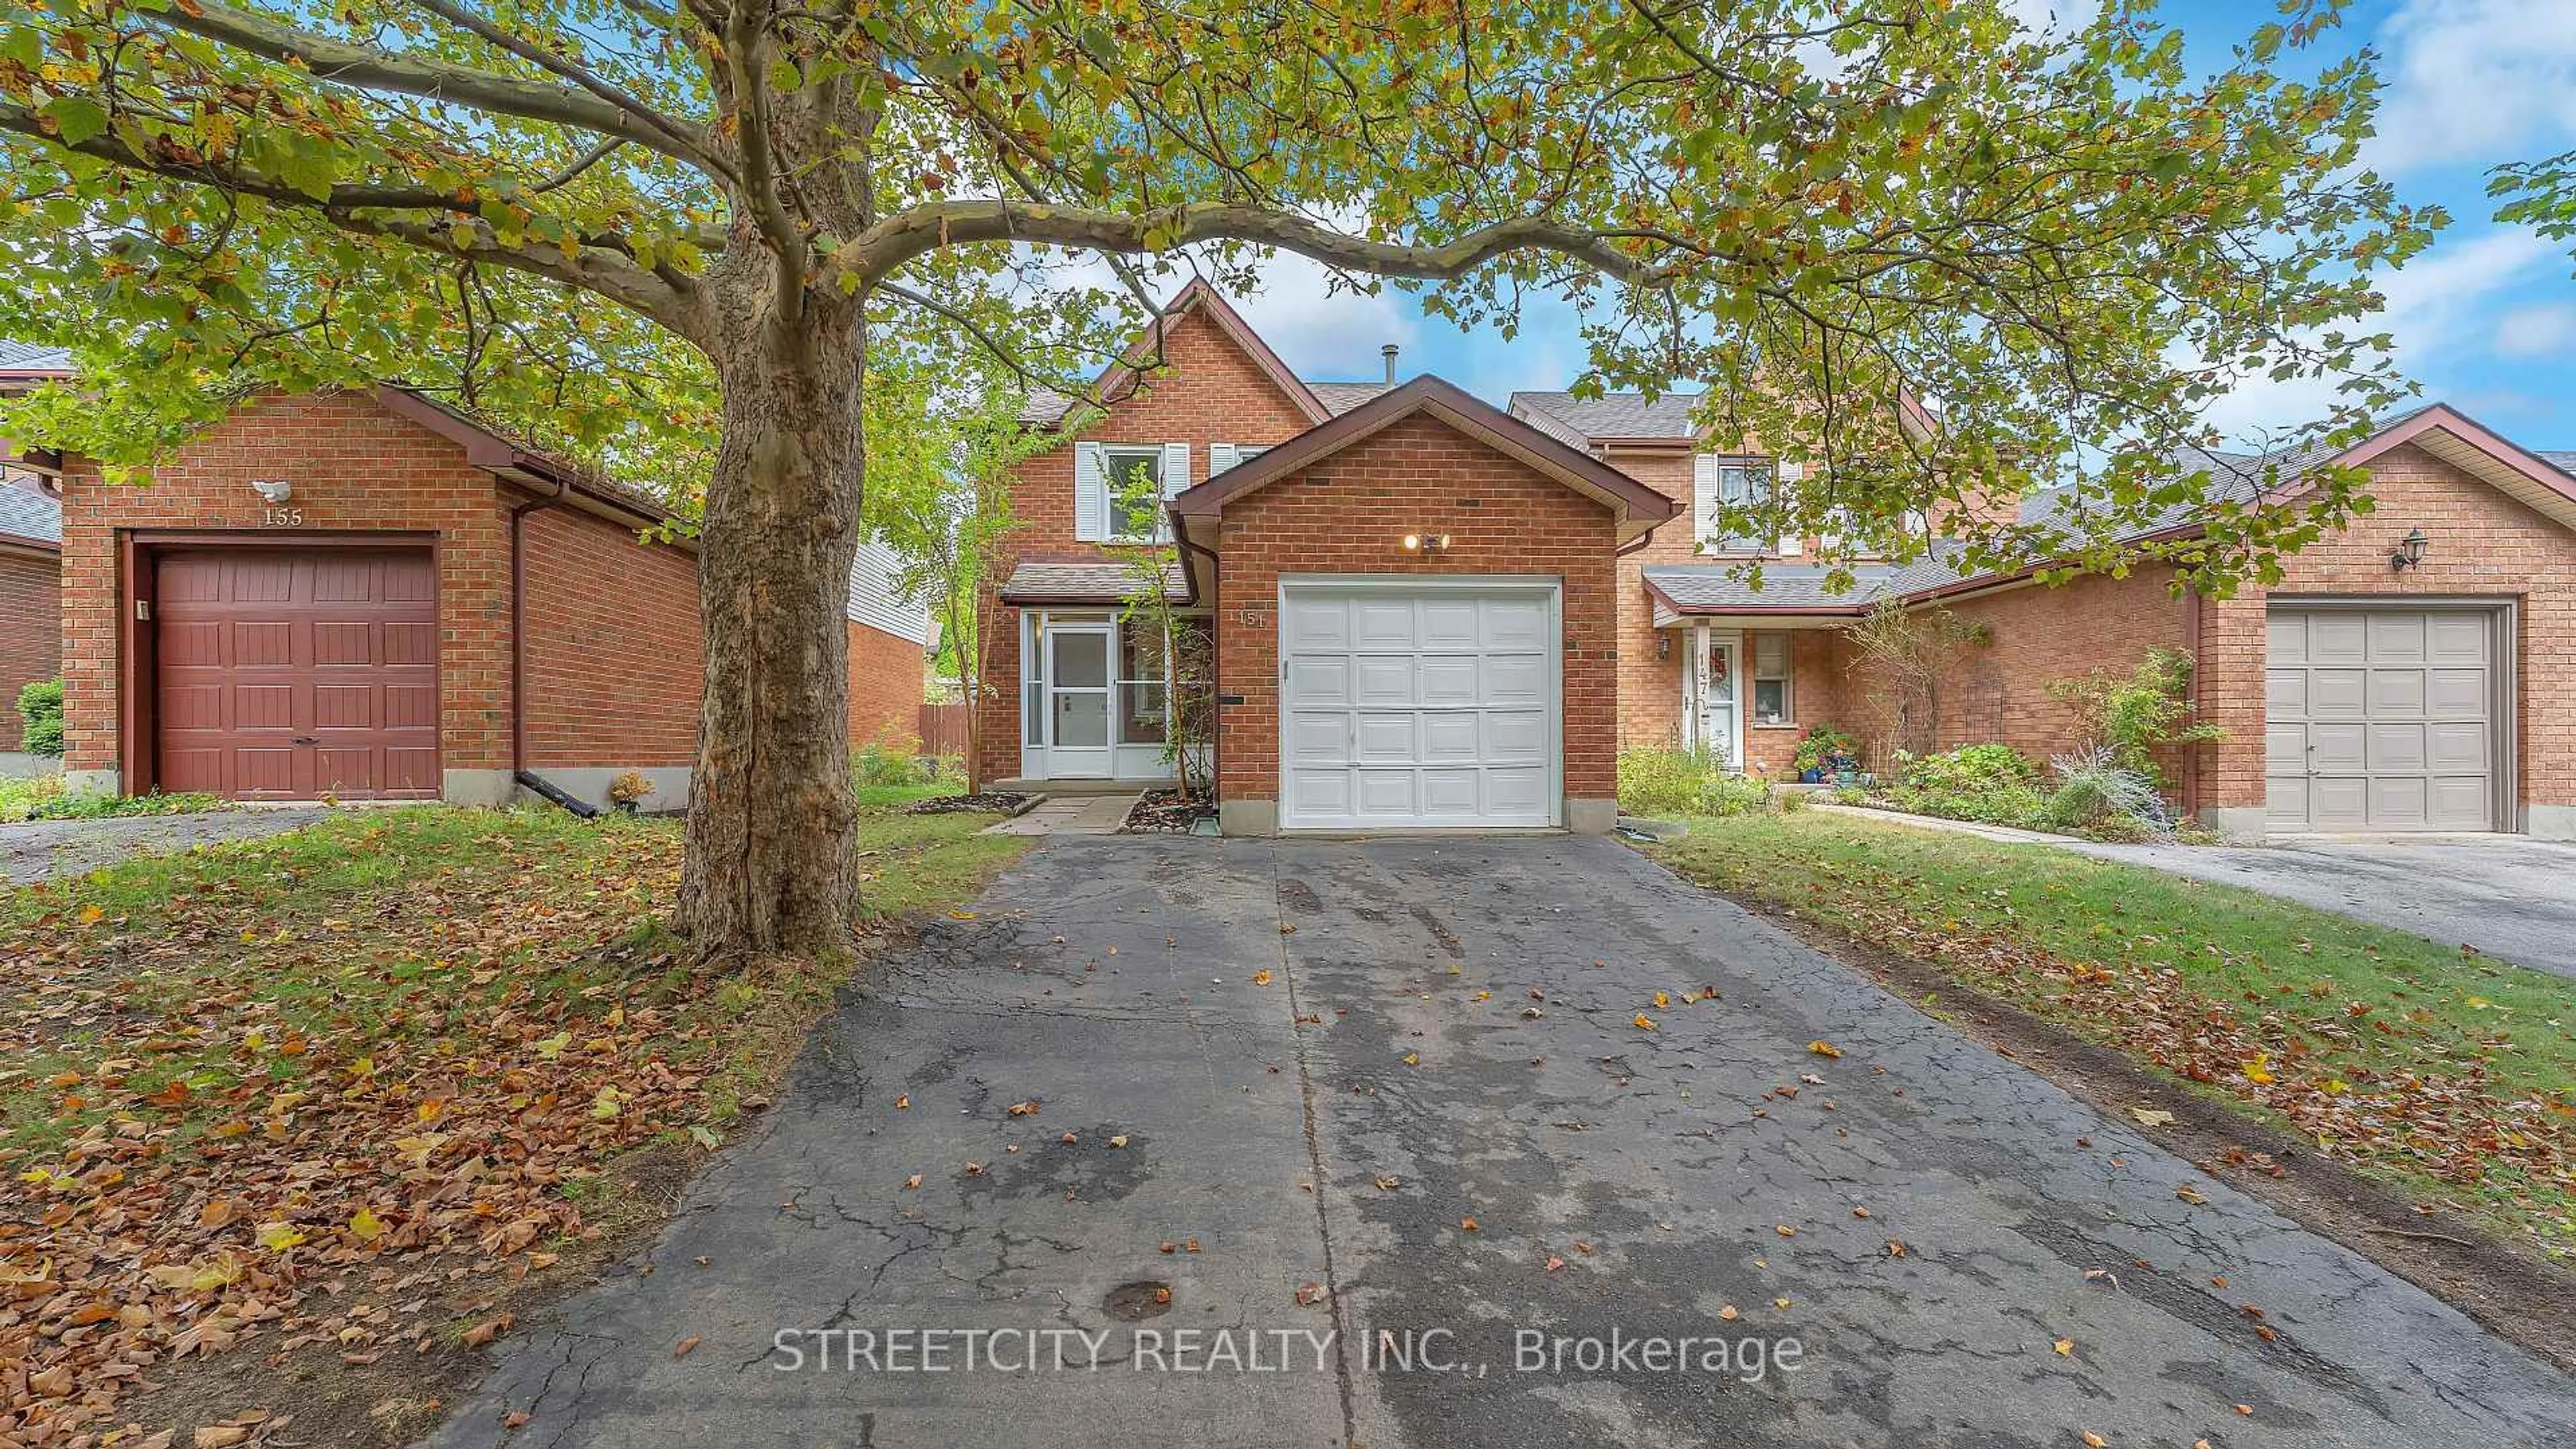
Unknown for 80 Empire St, London East Ontario N5Y 1G7
13 hours on Market

80 Empire St, London East, Ontario N5Y 1G7

Detached
4 + 2
3
~1100-1500 sqft
$649,900
Get pre-qualifiedPowered by nesto
Buy with Wahi to get
Up to
$3,250Cashback
Detached
4 + 2
3
~1100-1500 sqft

Contact us about this property

Call

Highlights

Property Estimate

Days on market13 hours

Estimated valueNot available

Price/Sqft$512/sqft

Monthly cost

Open Calculator

CMA Subject Property

Curious about what homes are selling for in this area?

Get a report on comparable homes with helpful insights and trends.

+13

Properties sold*

$498K

Median sold price*

*Based on last 30 days

Description

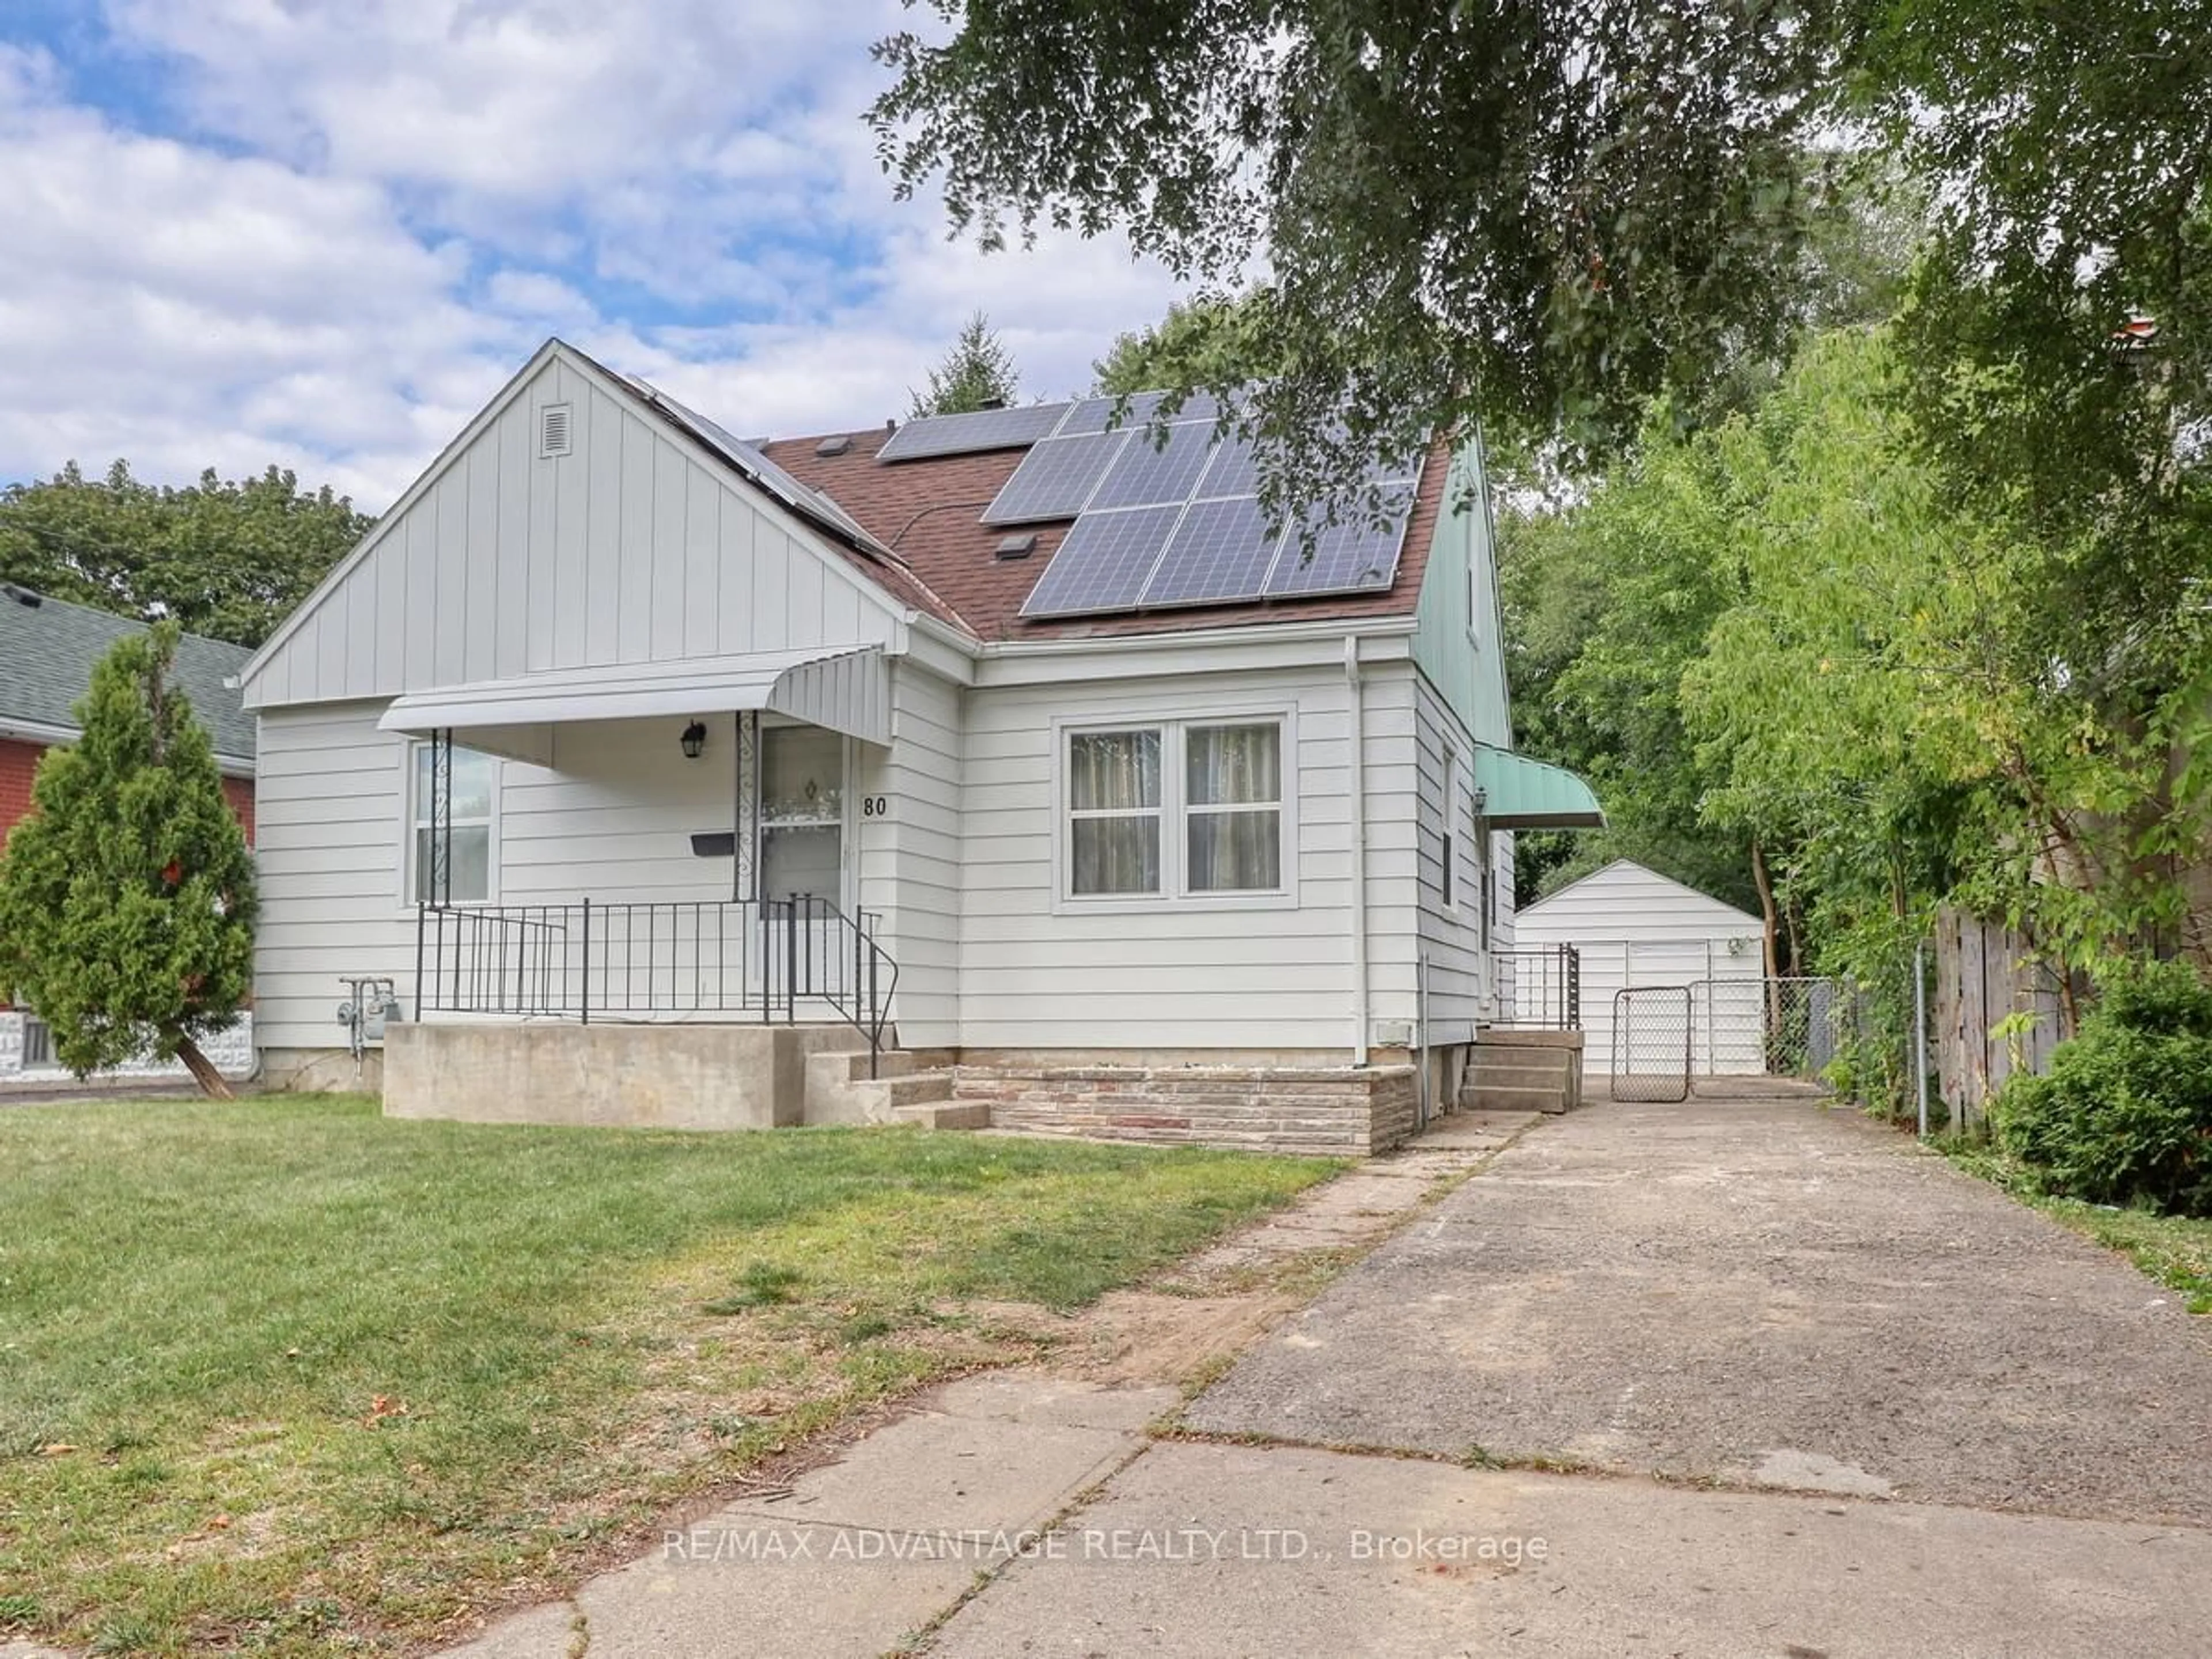
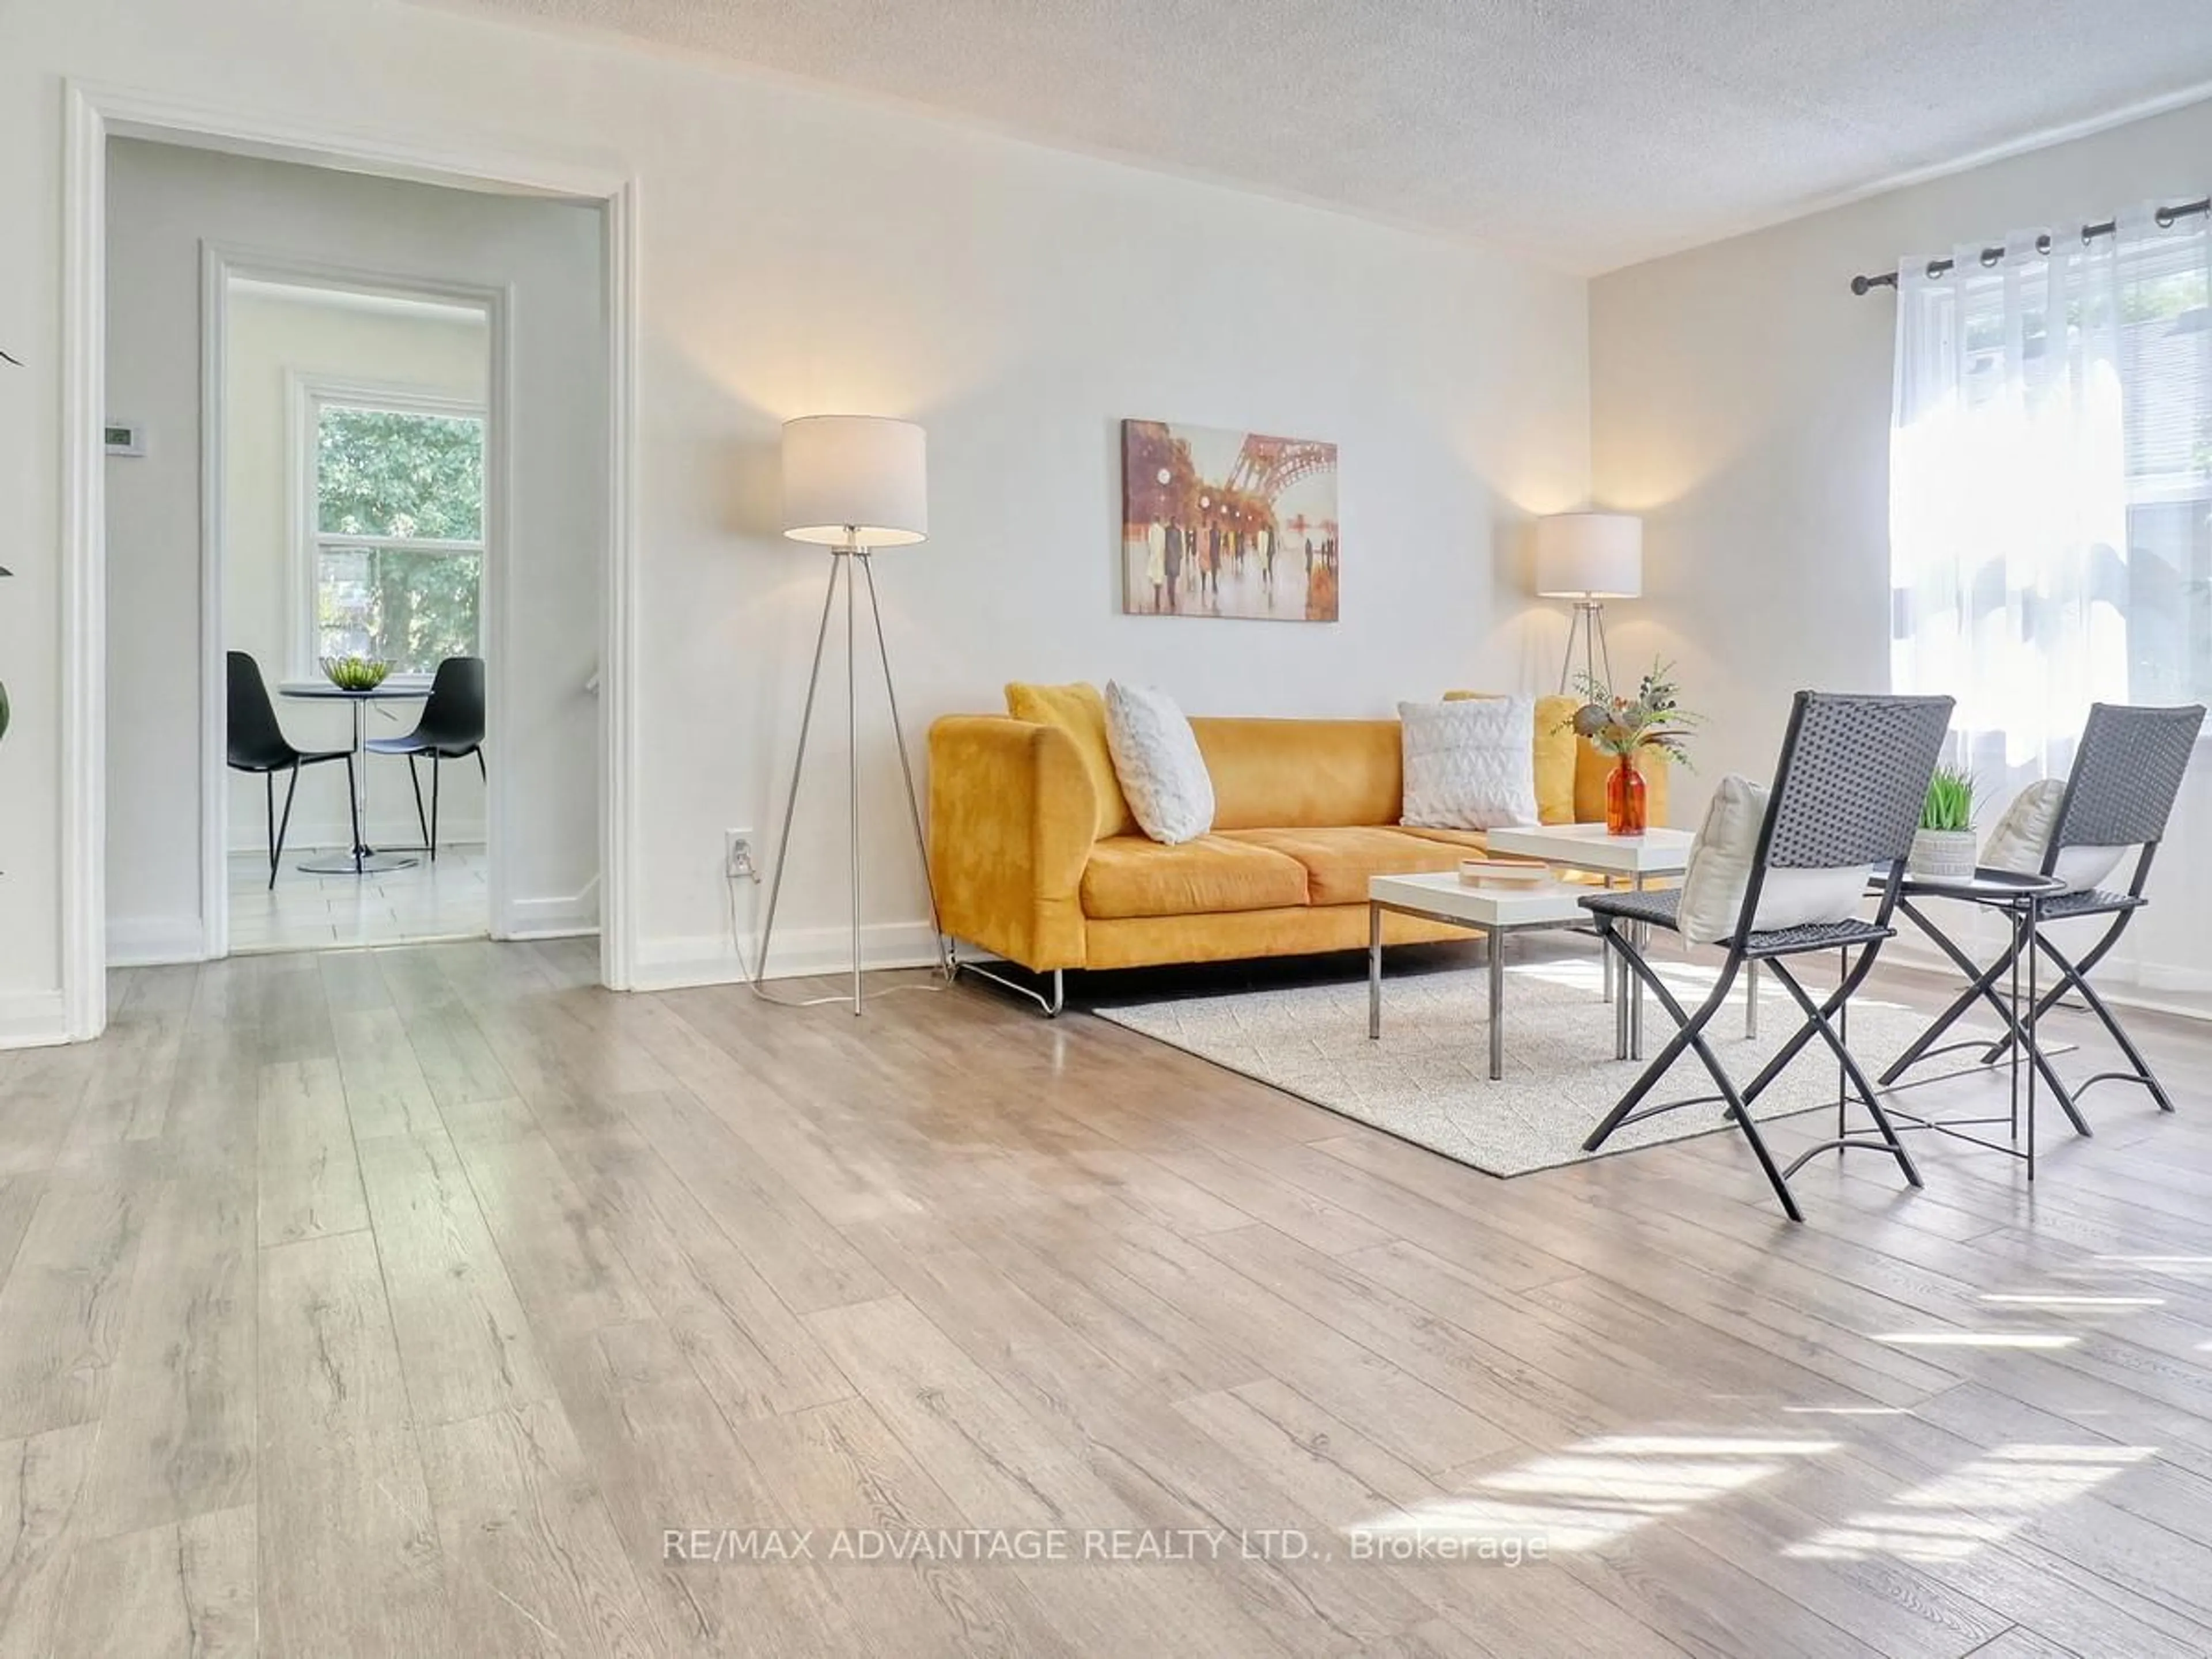
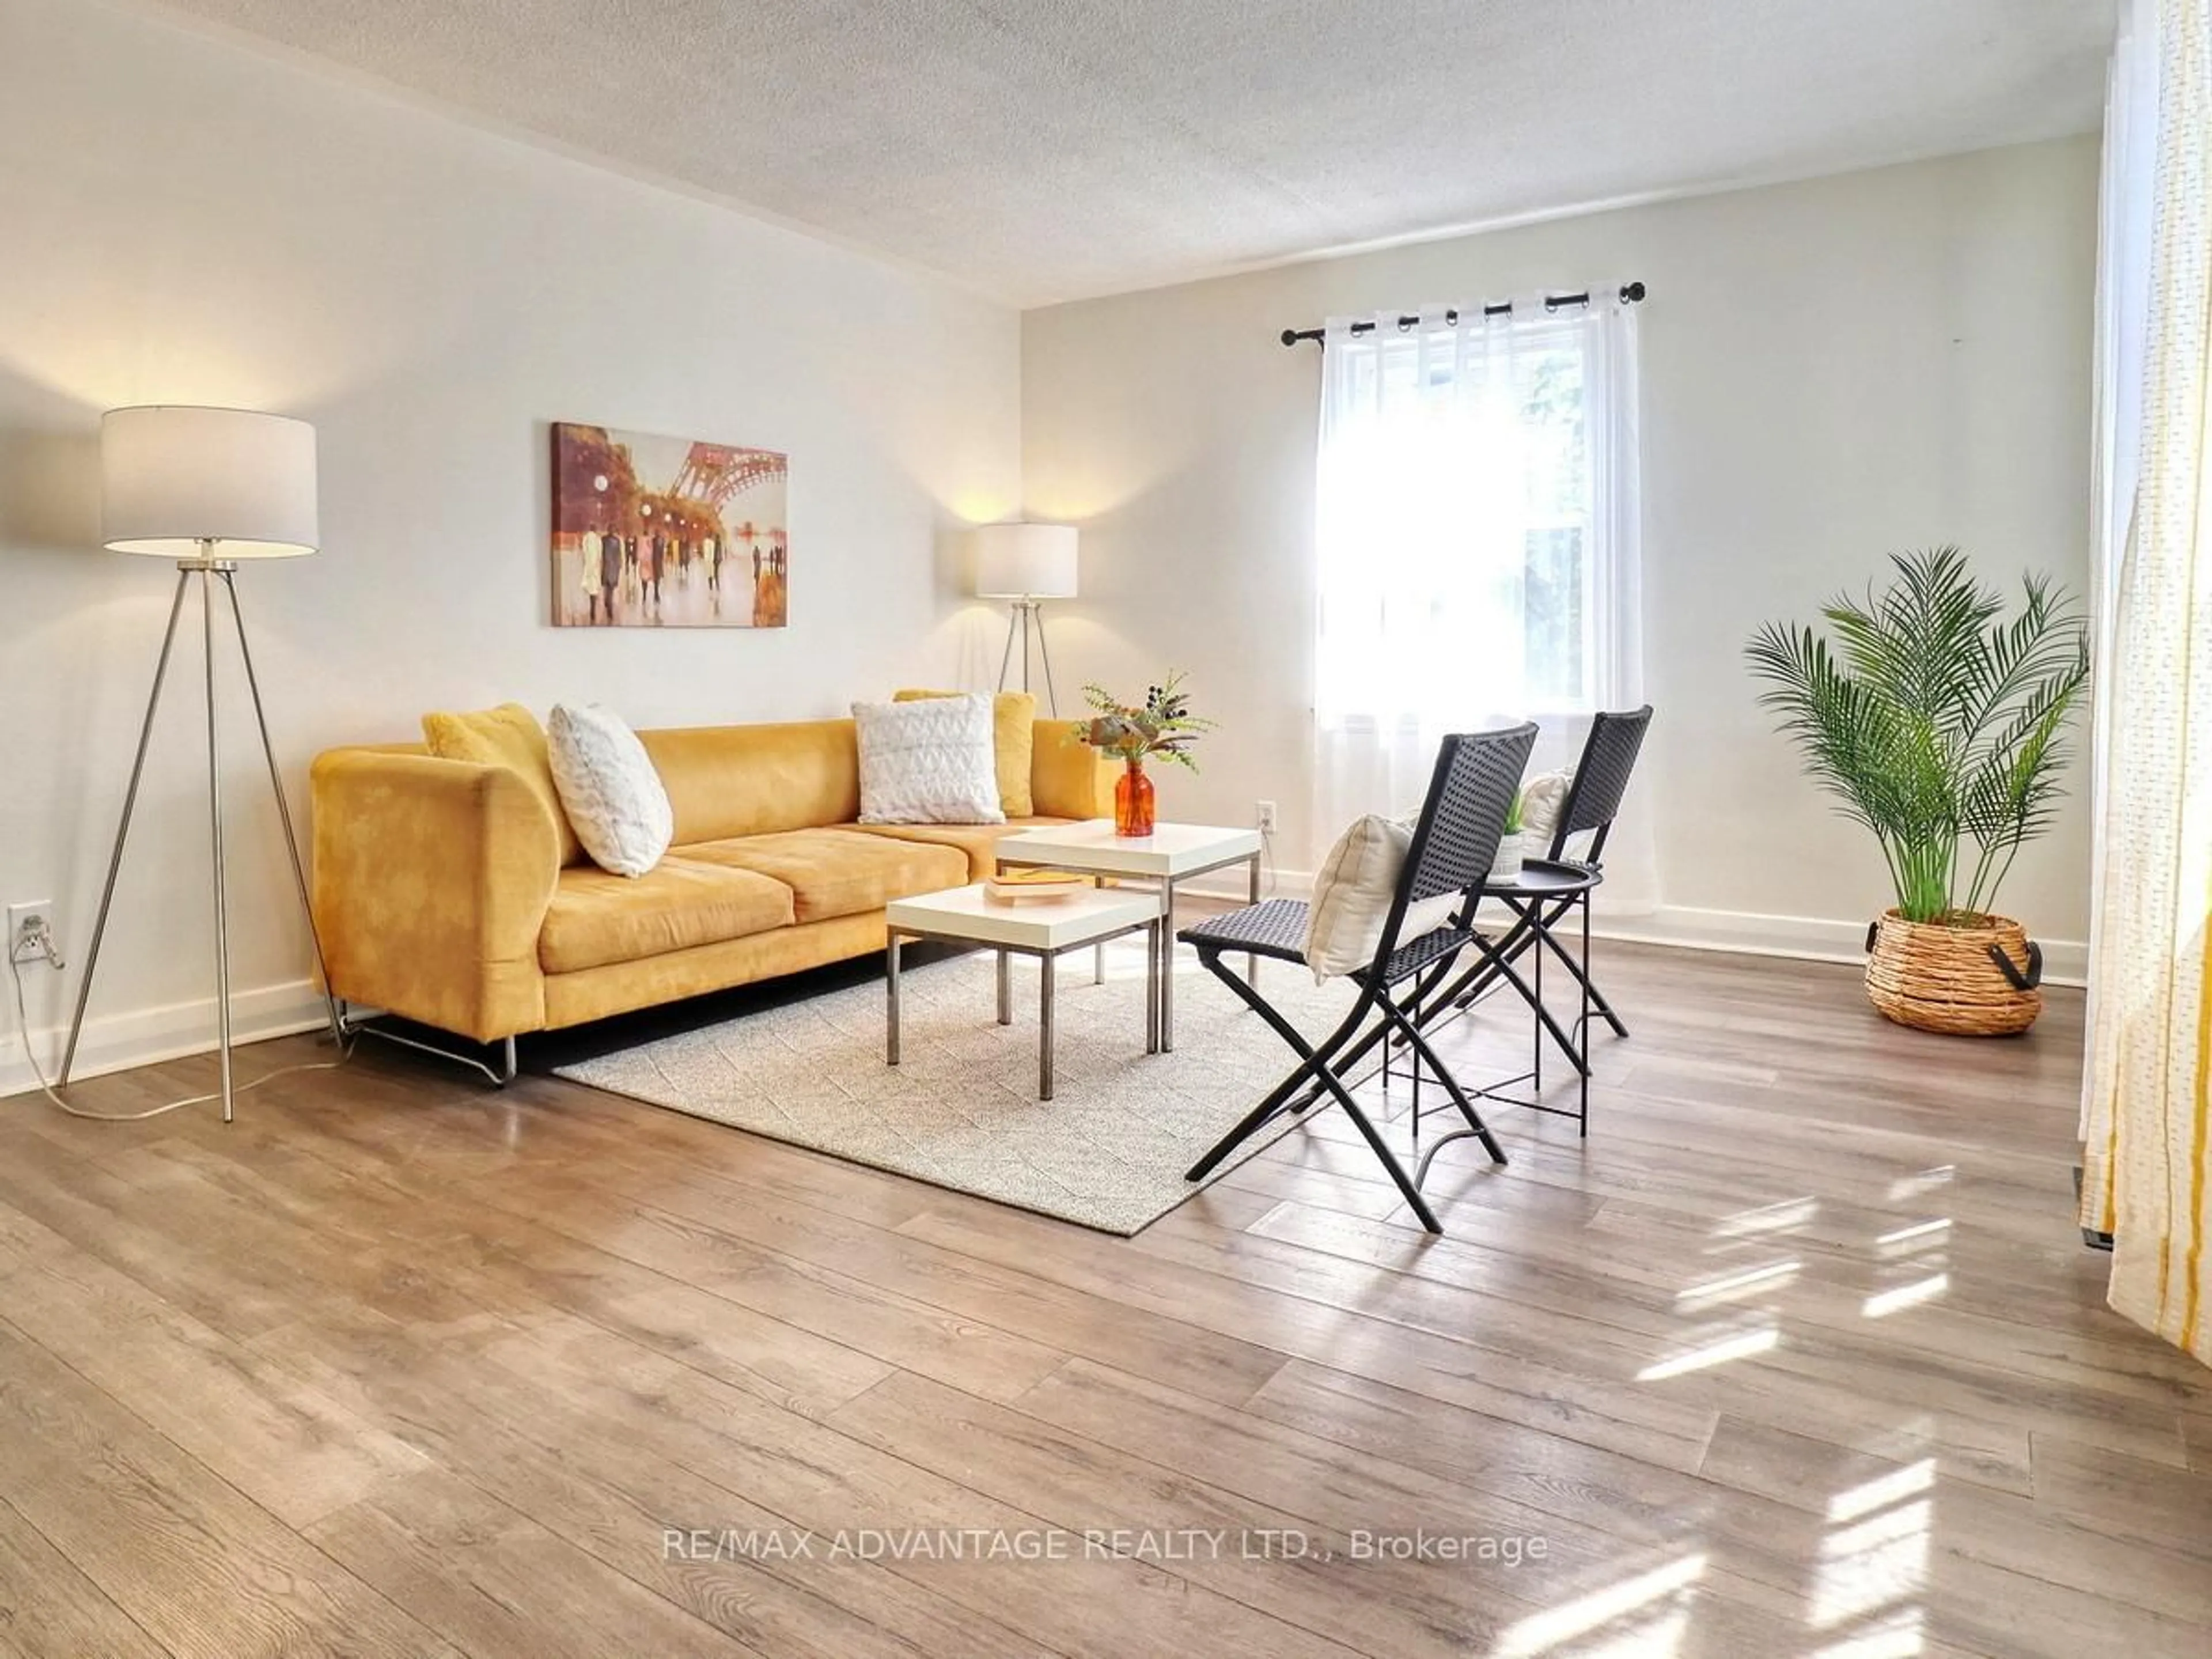
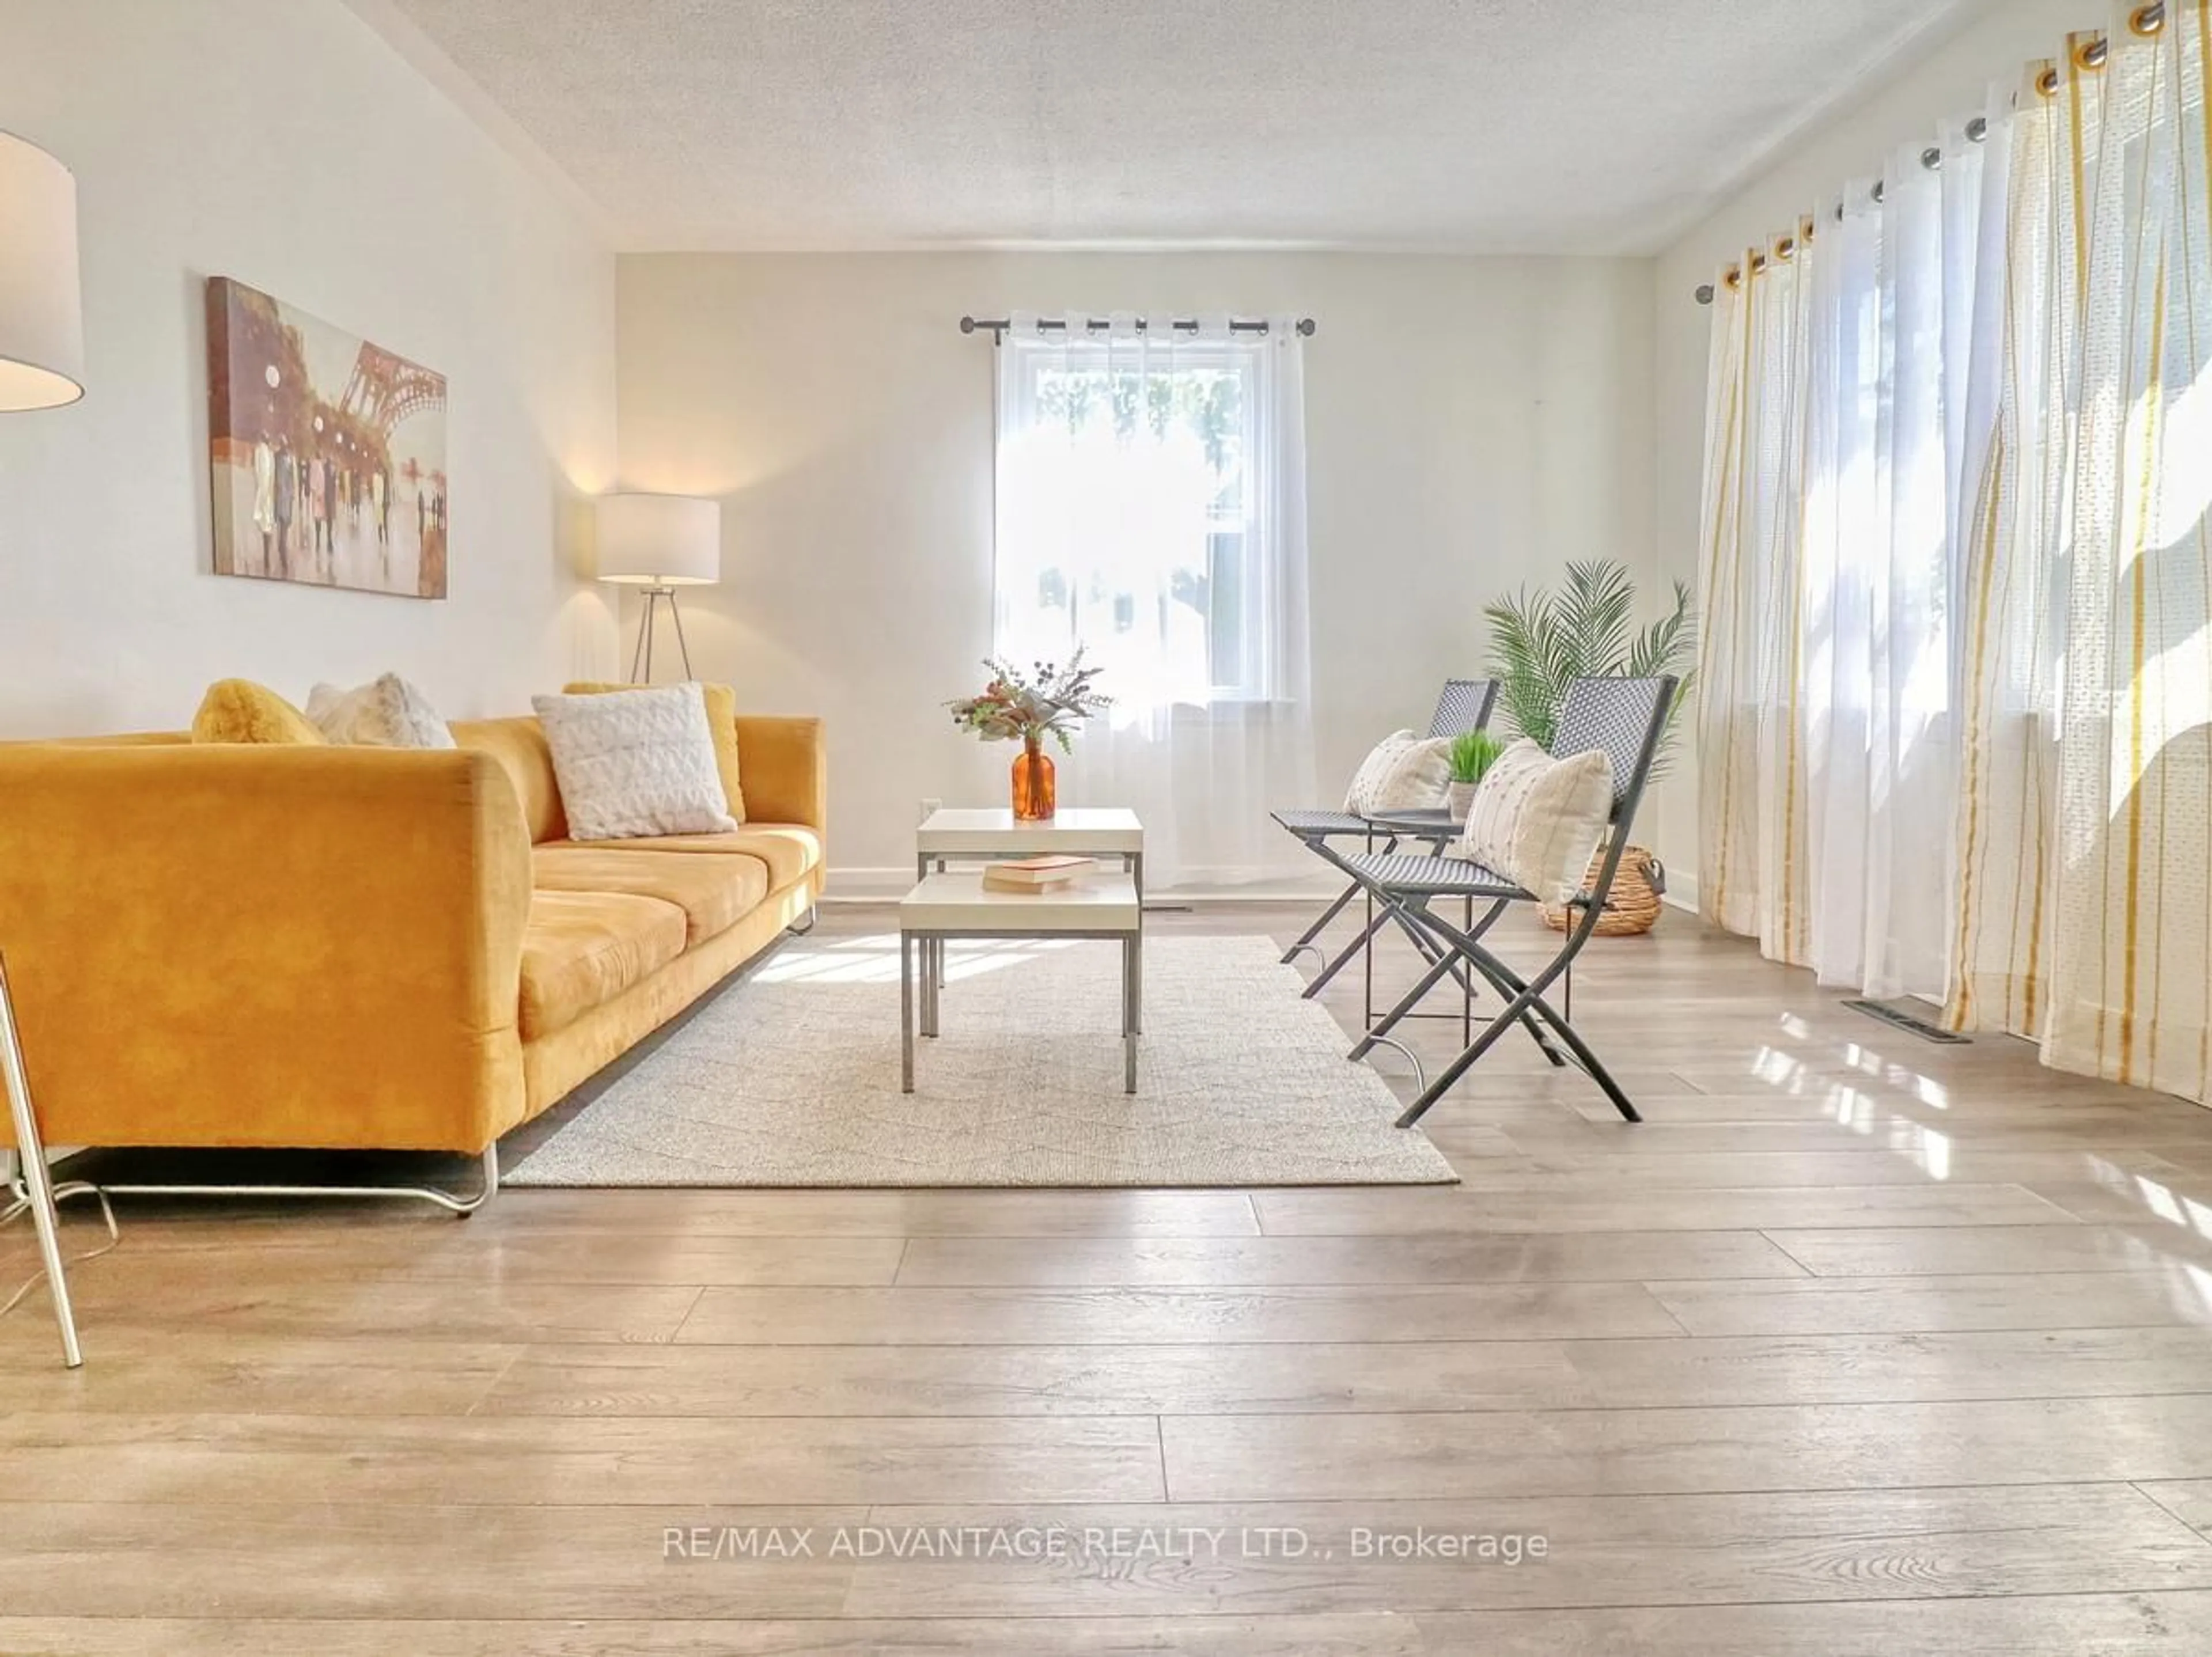
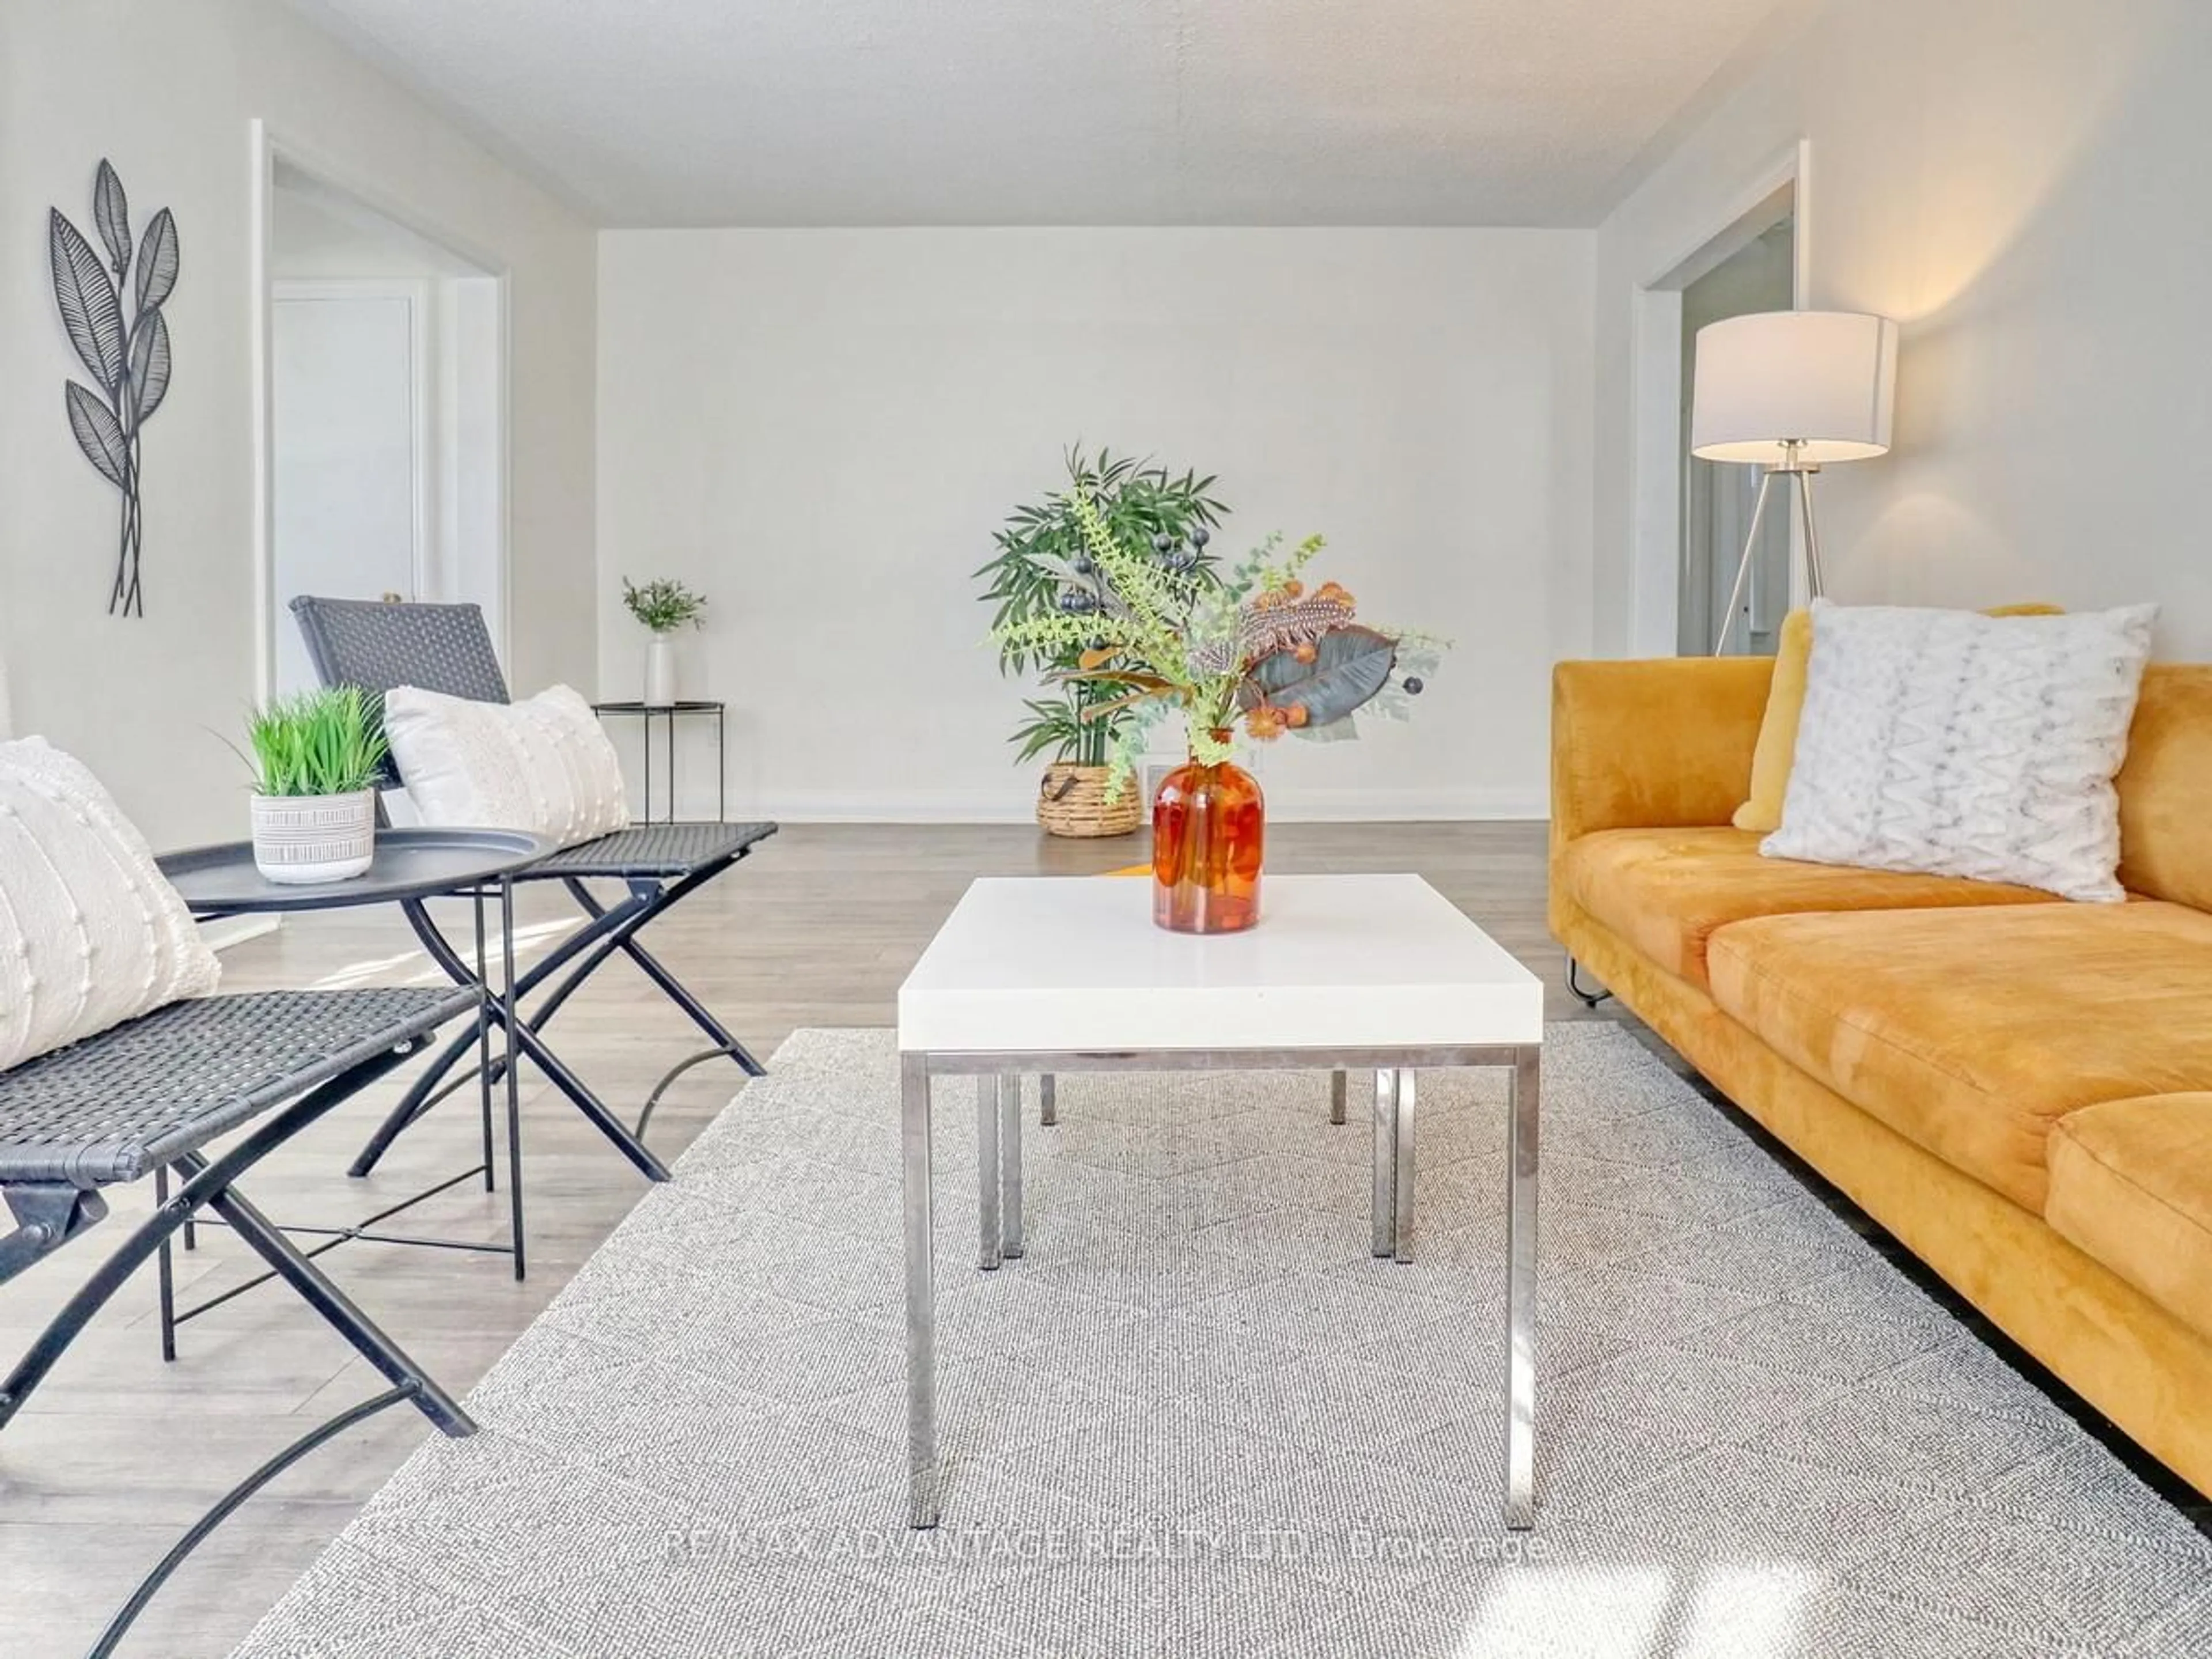
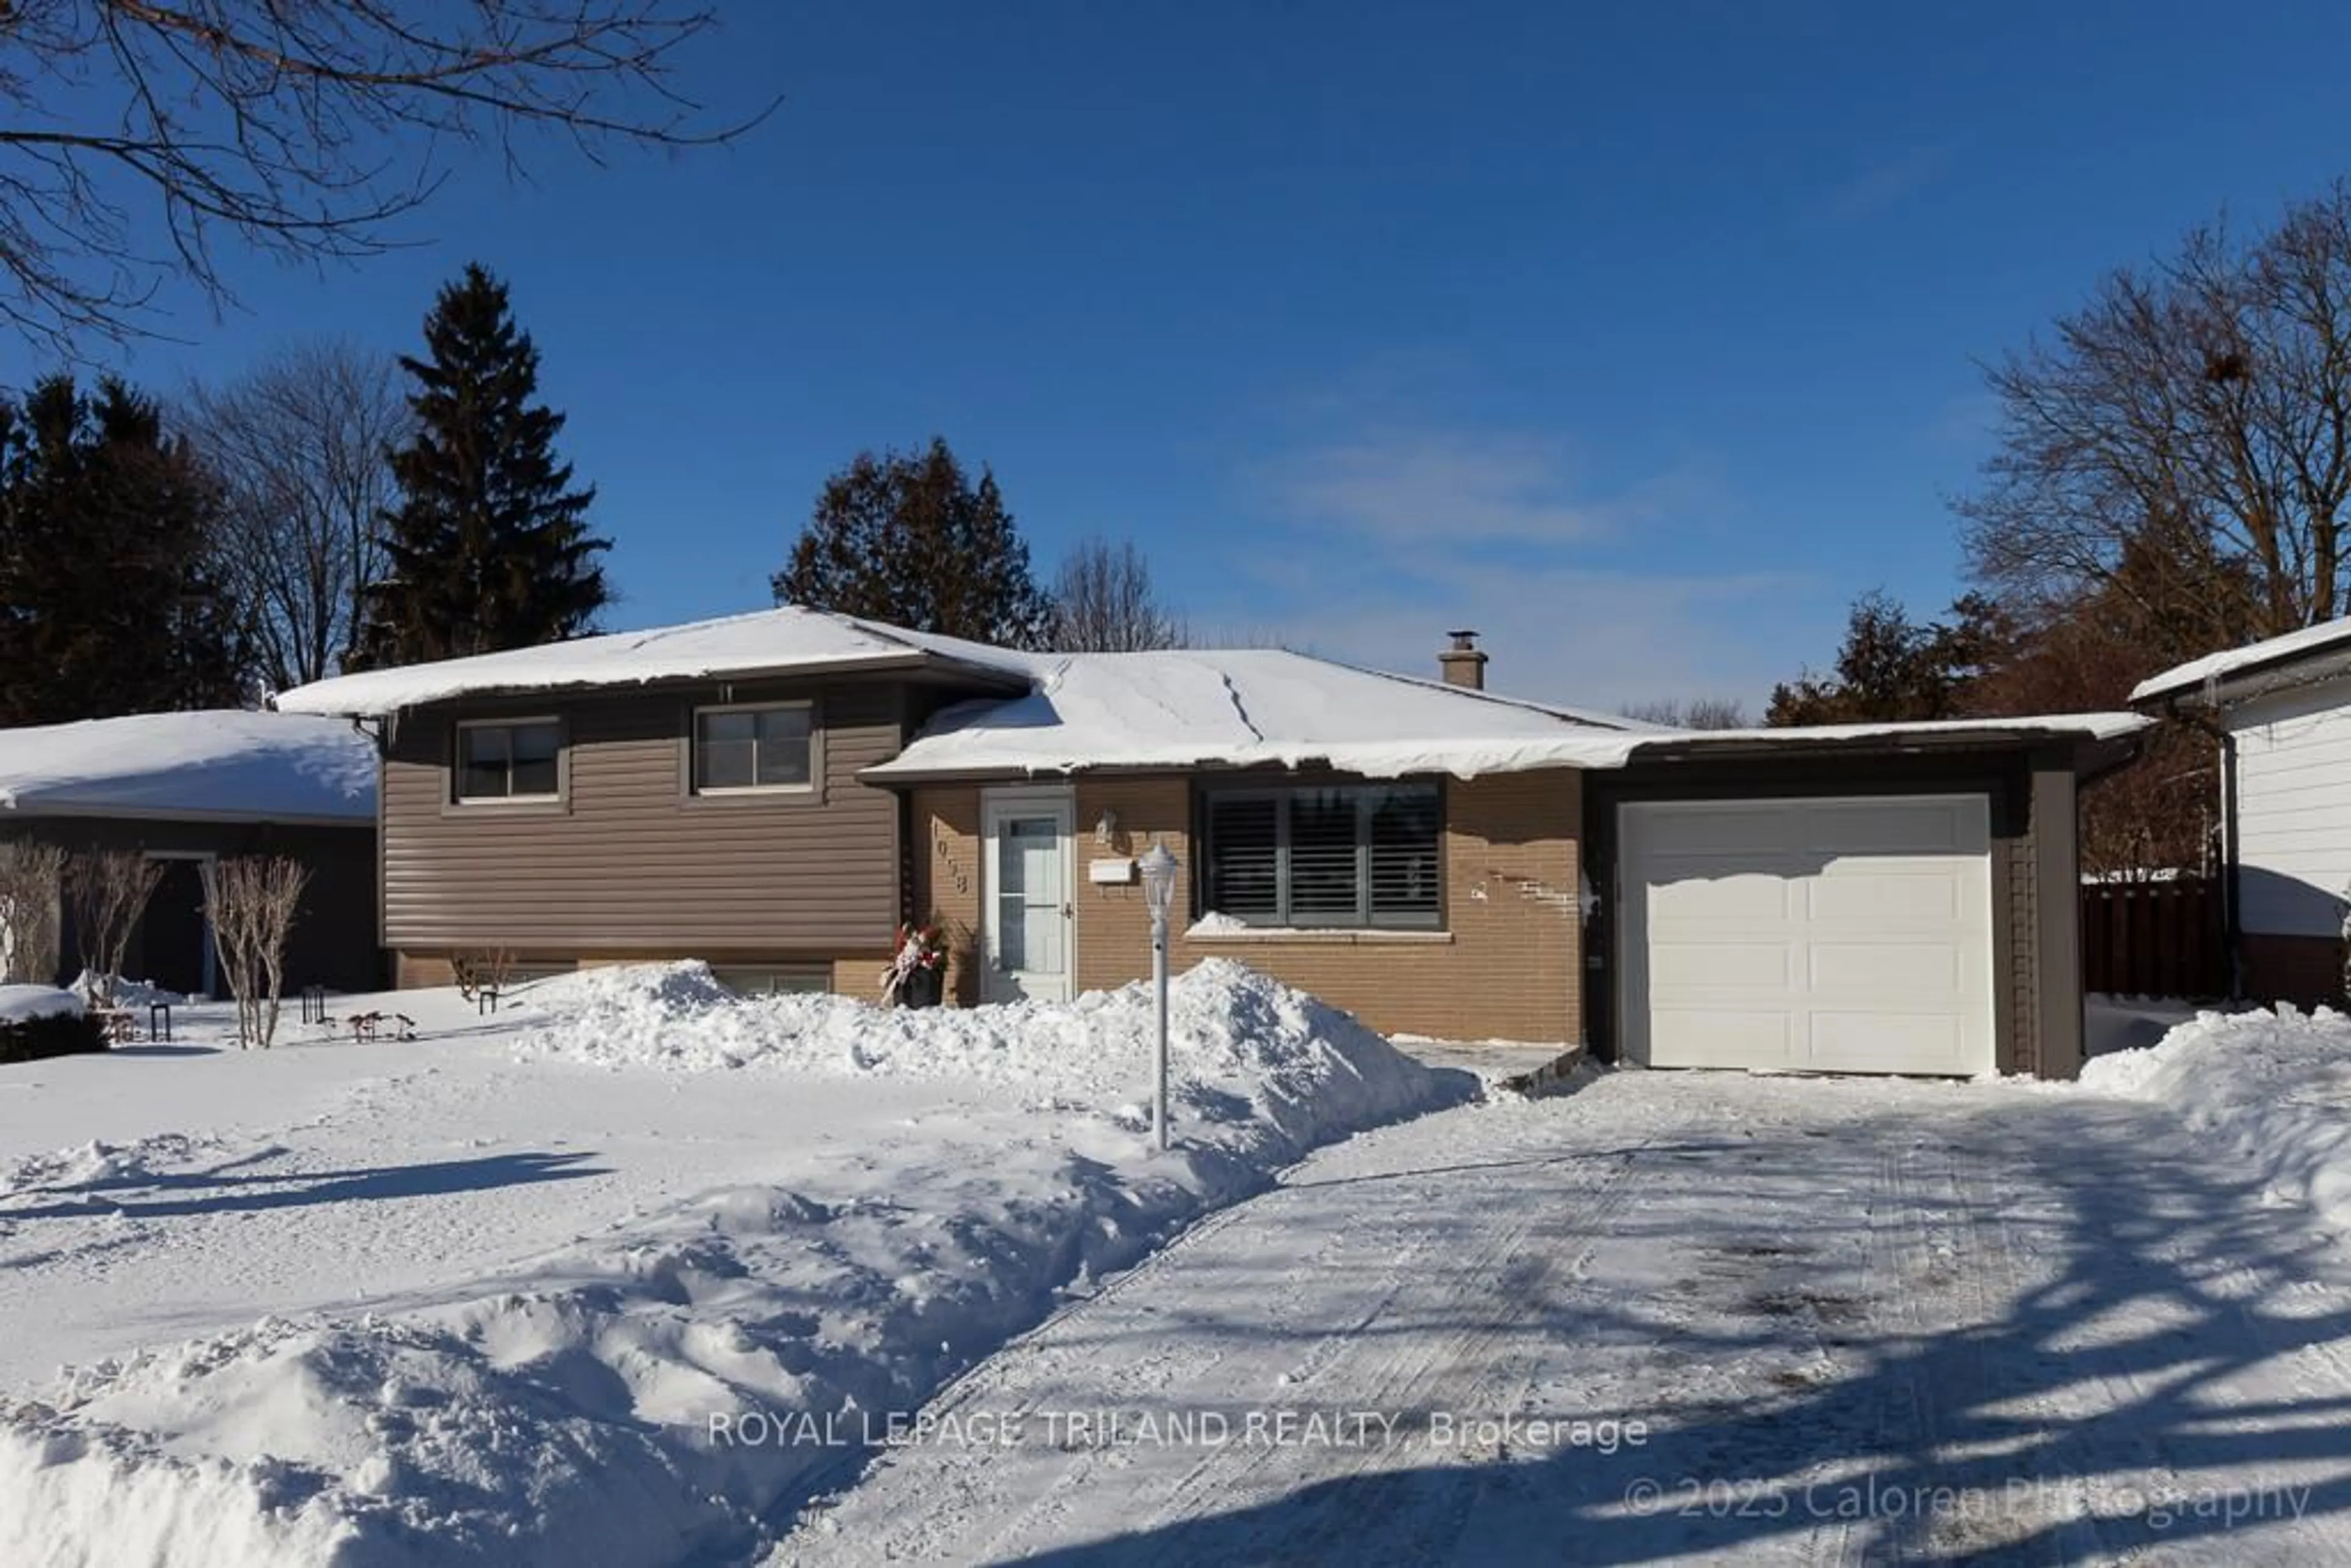
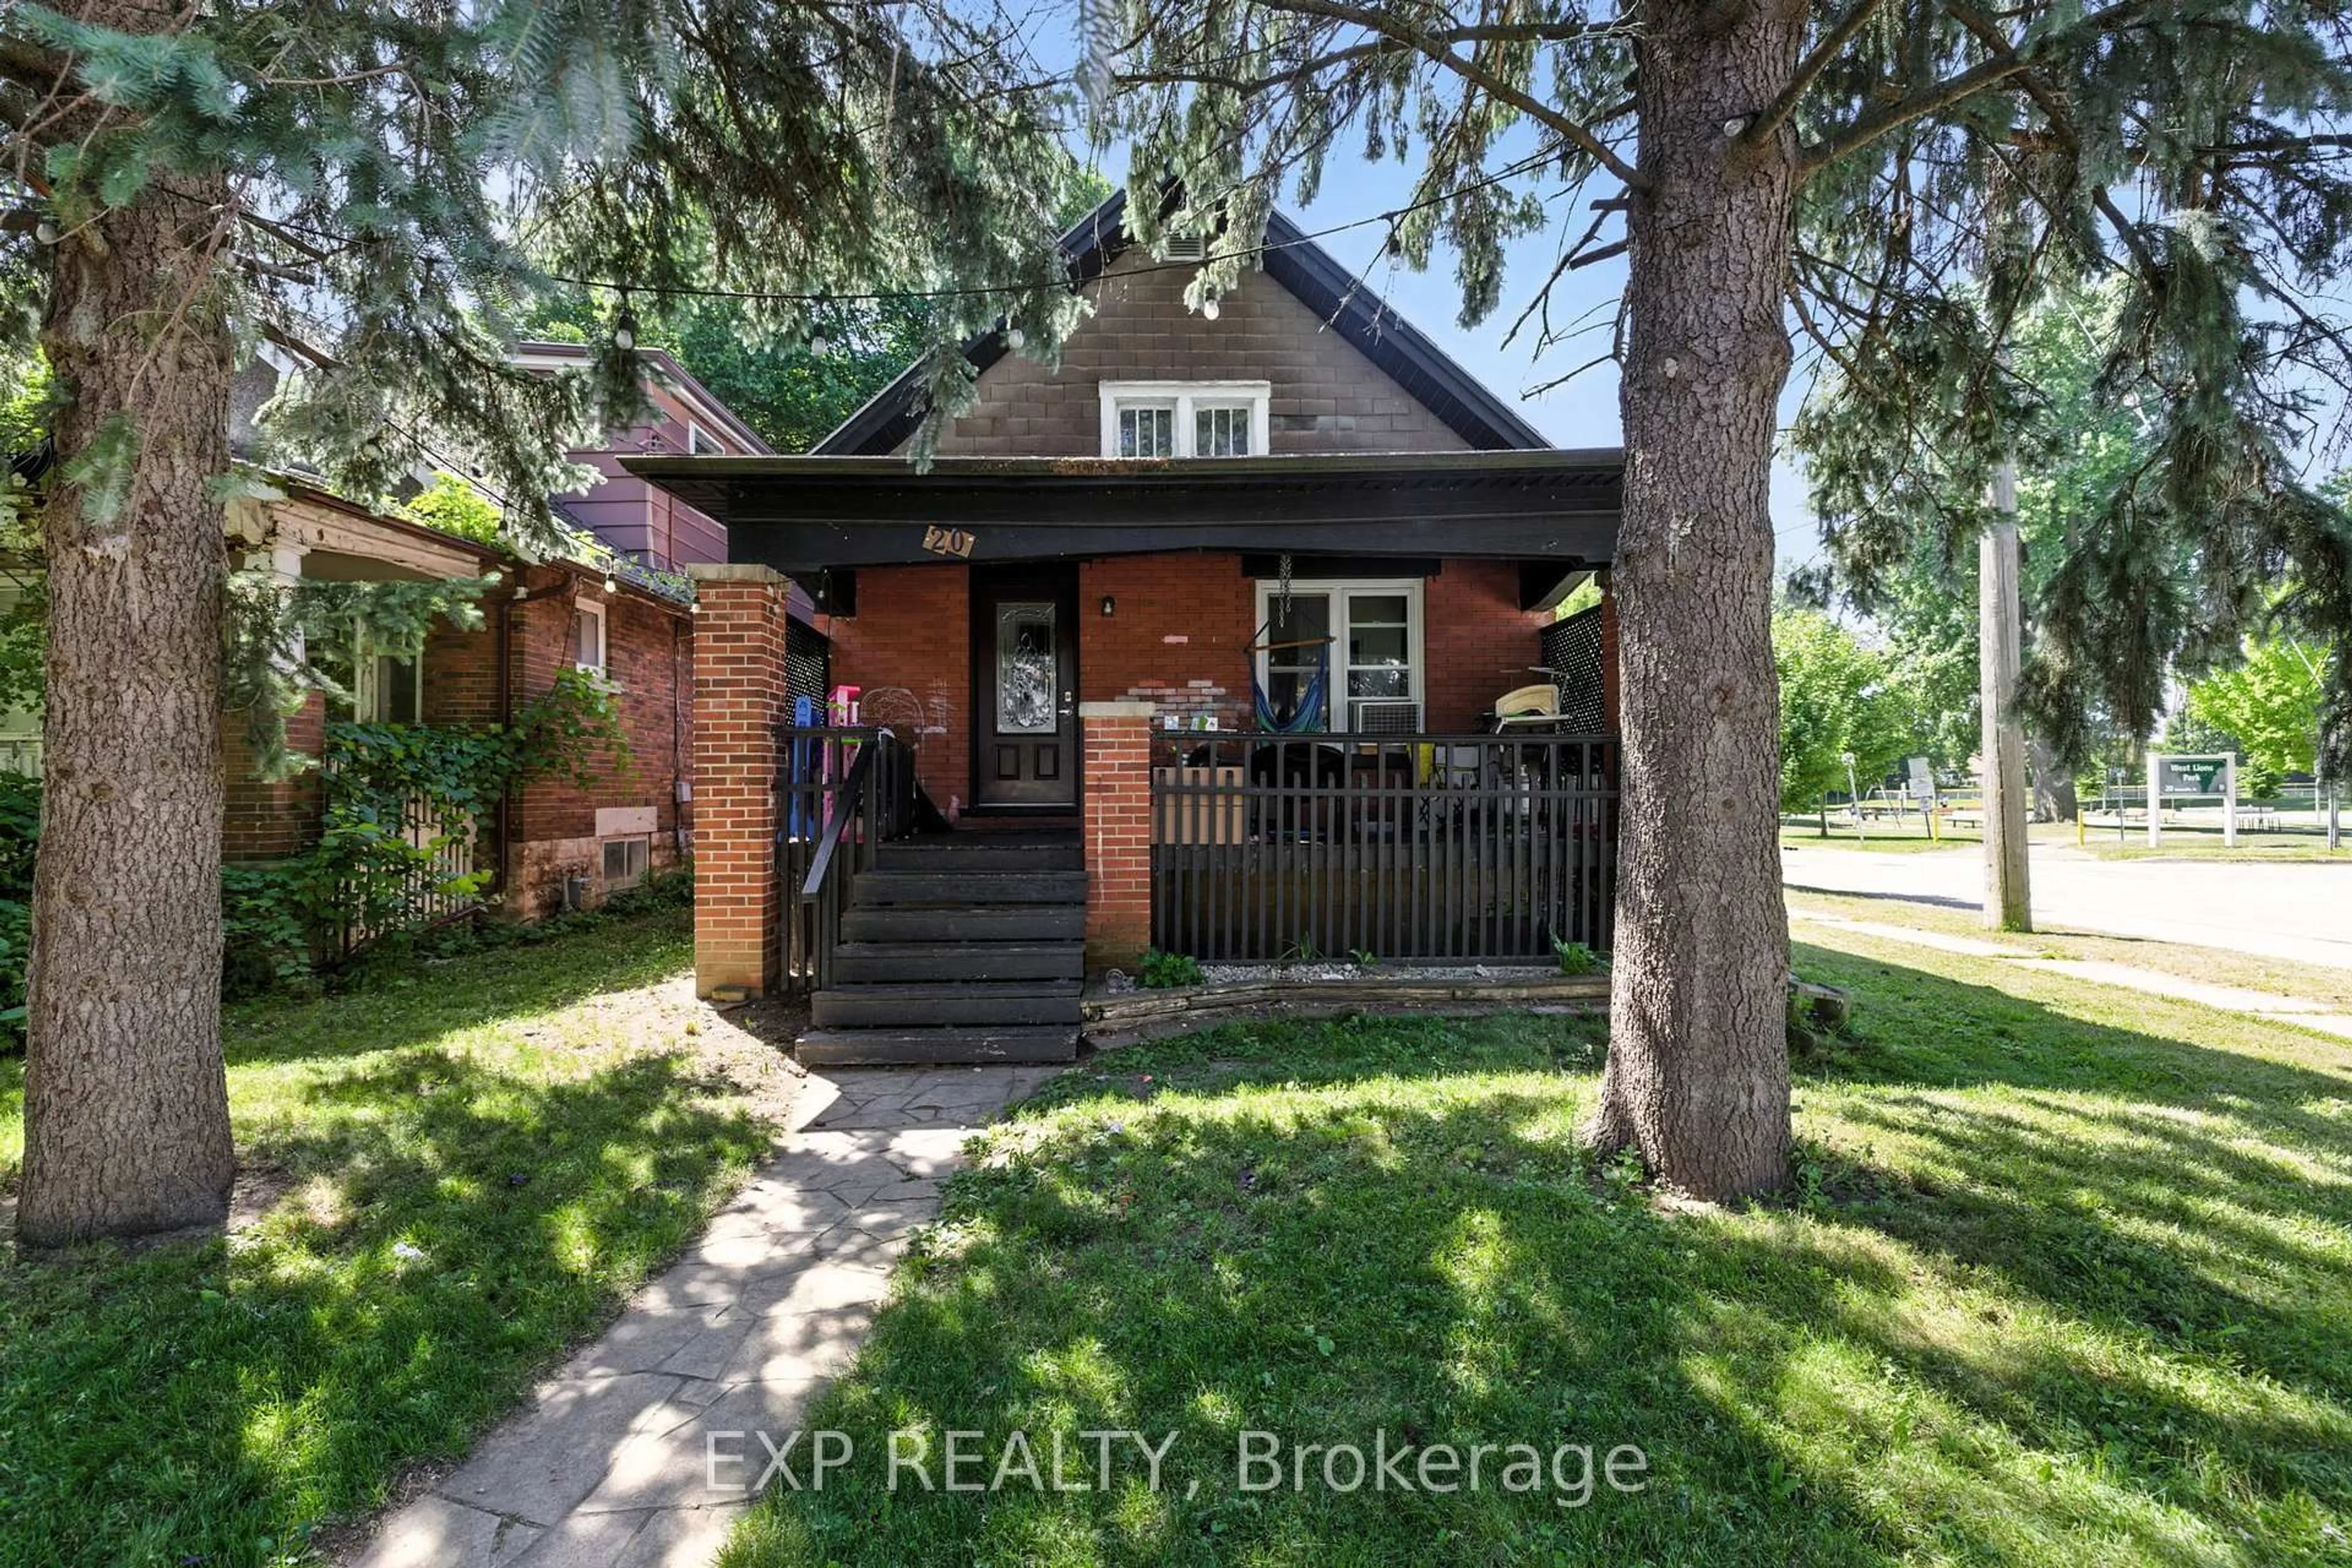
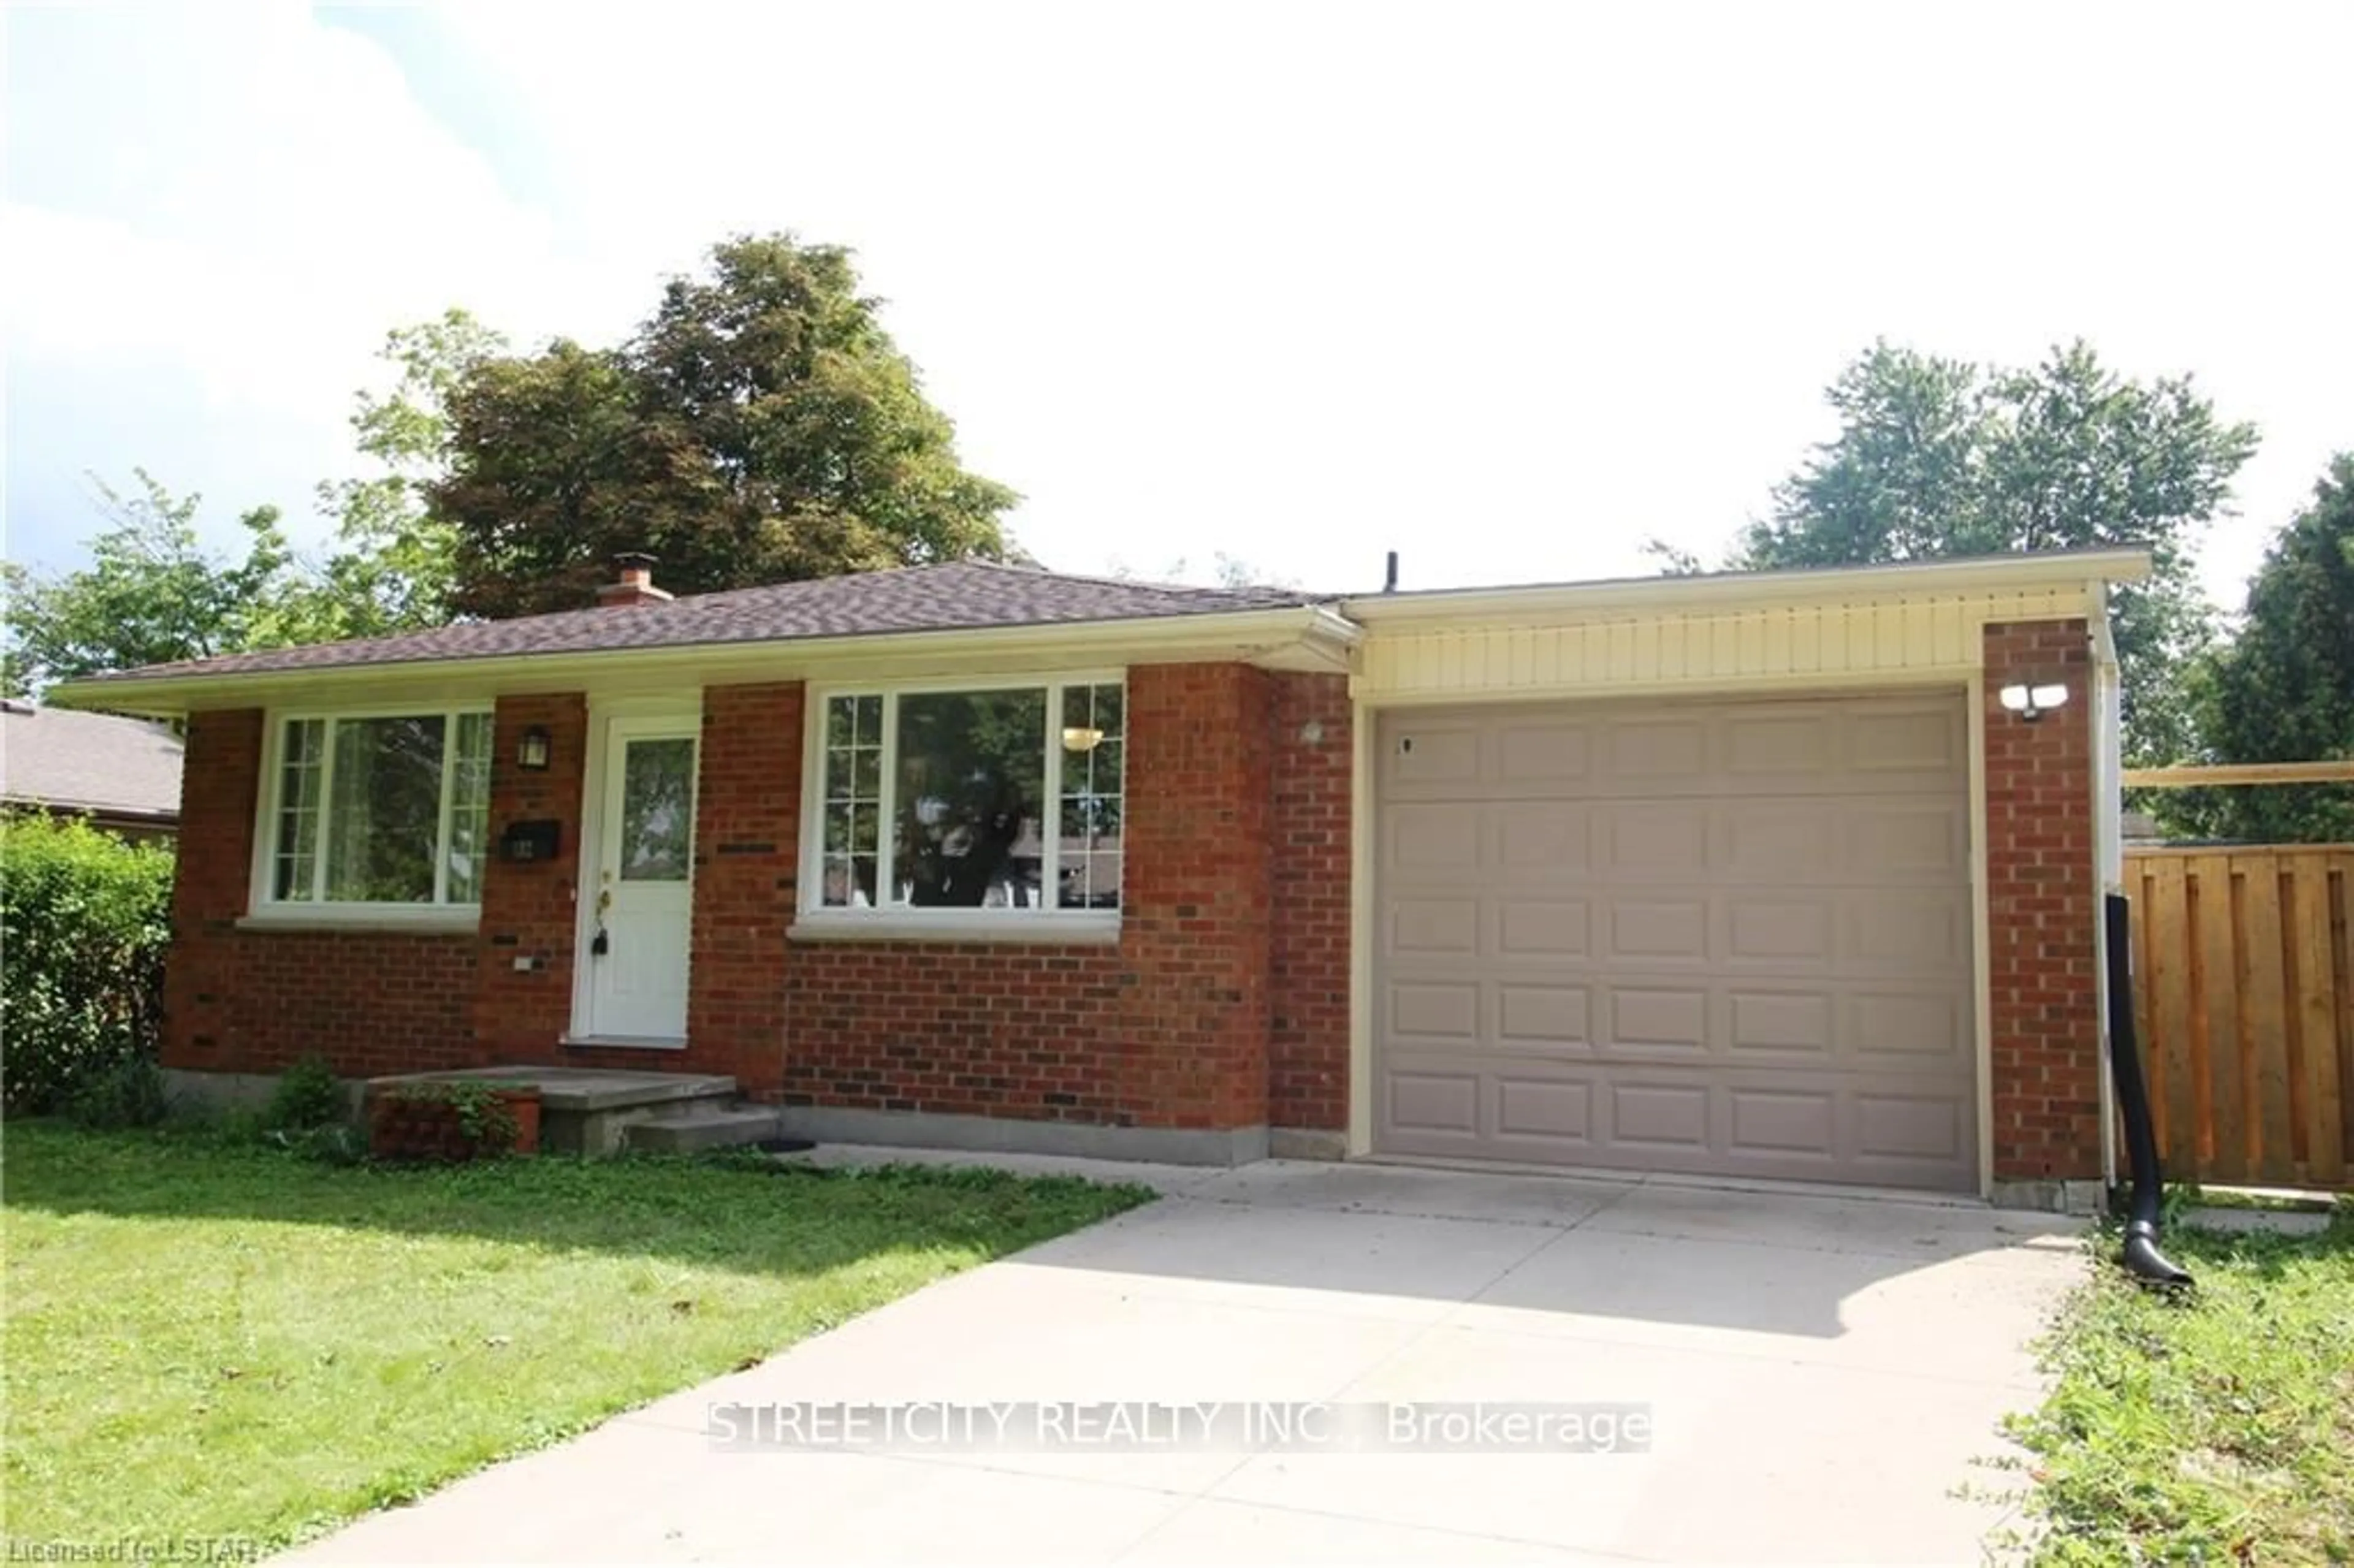
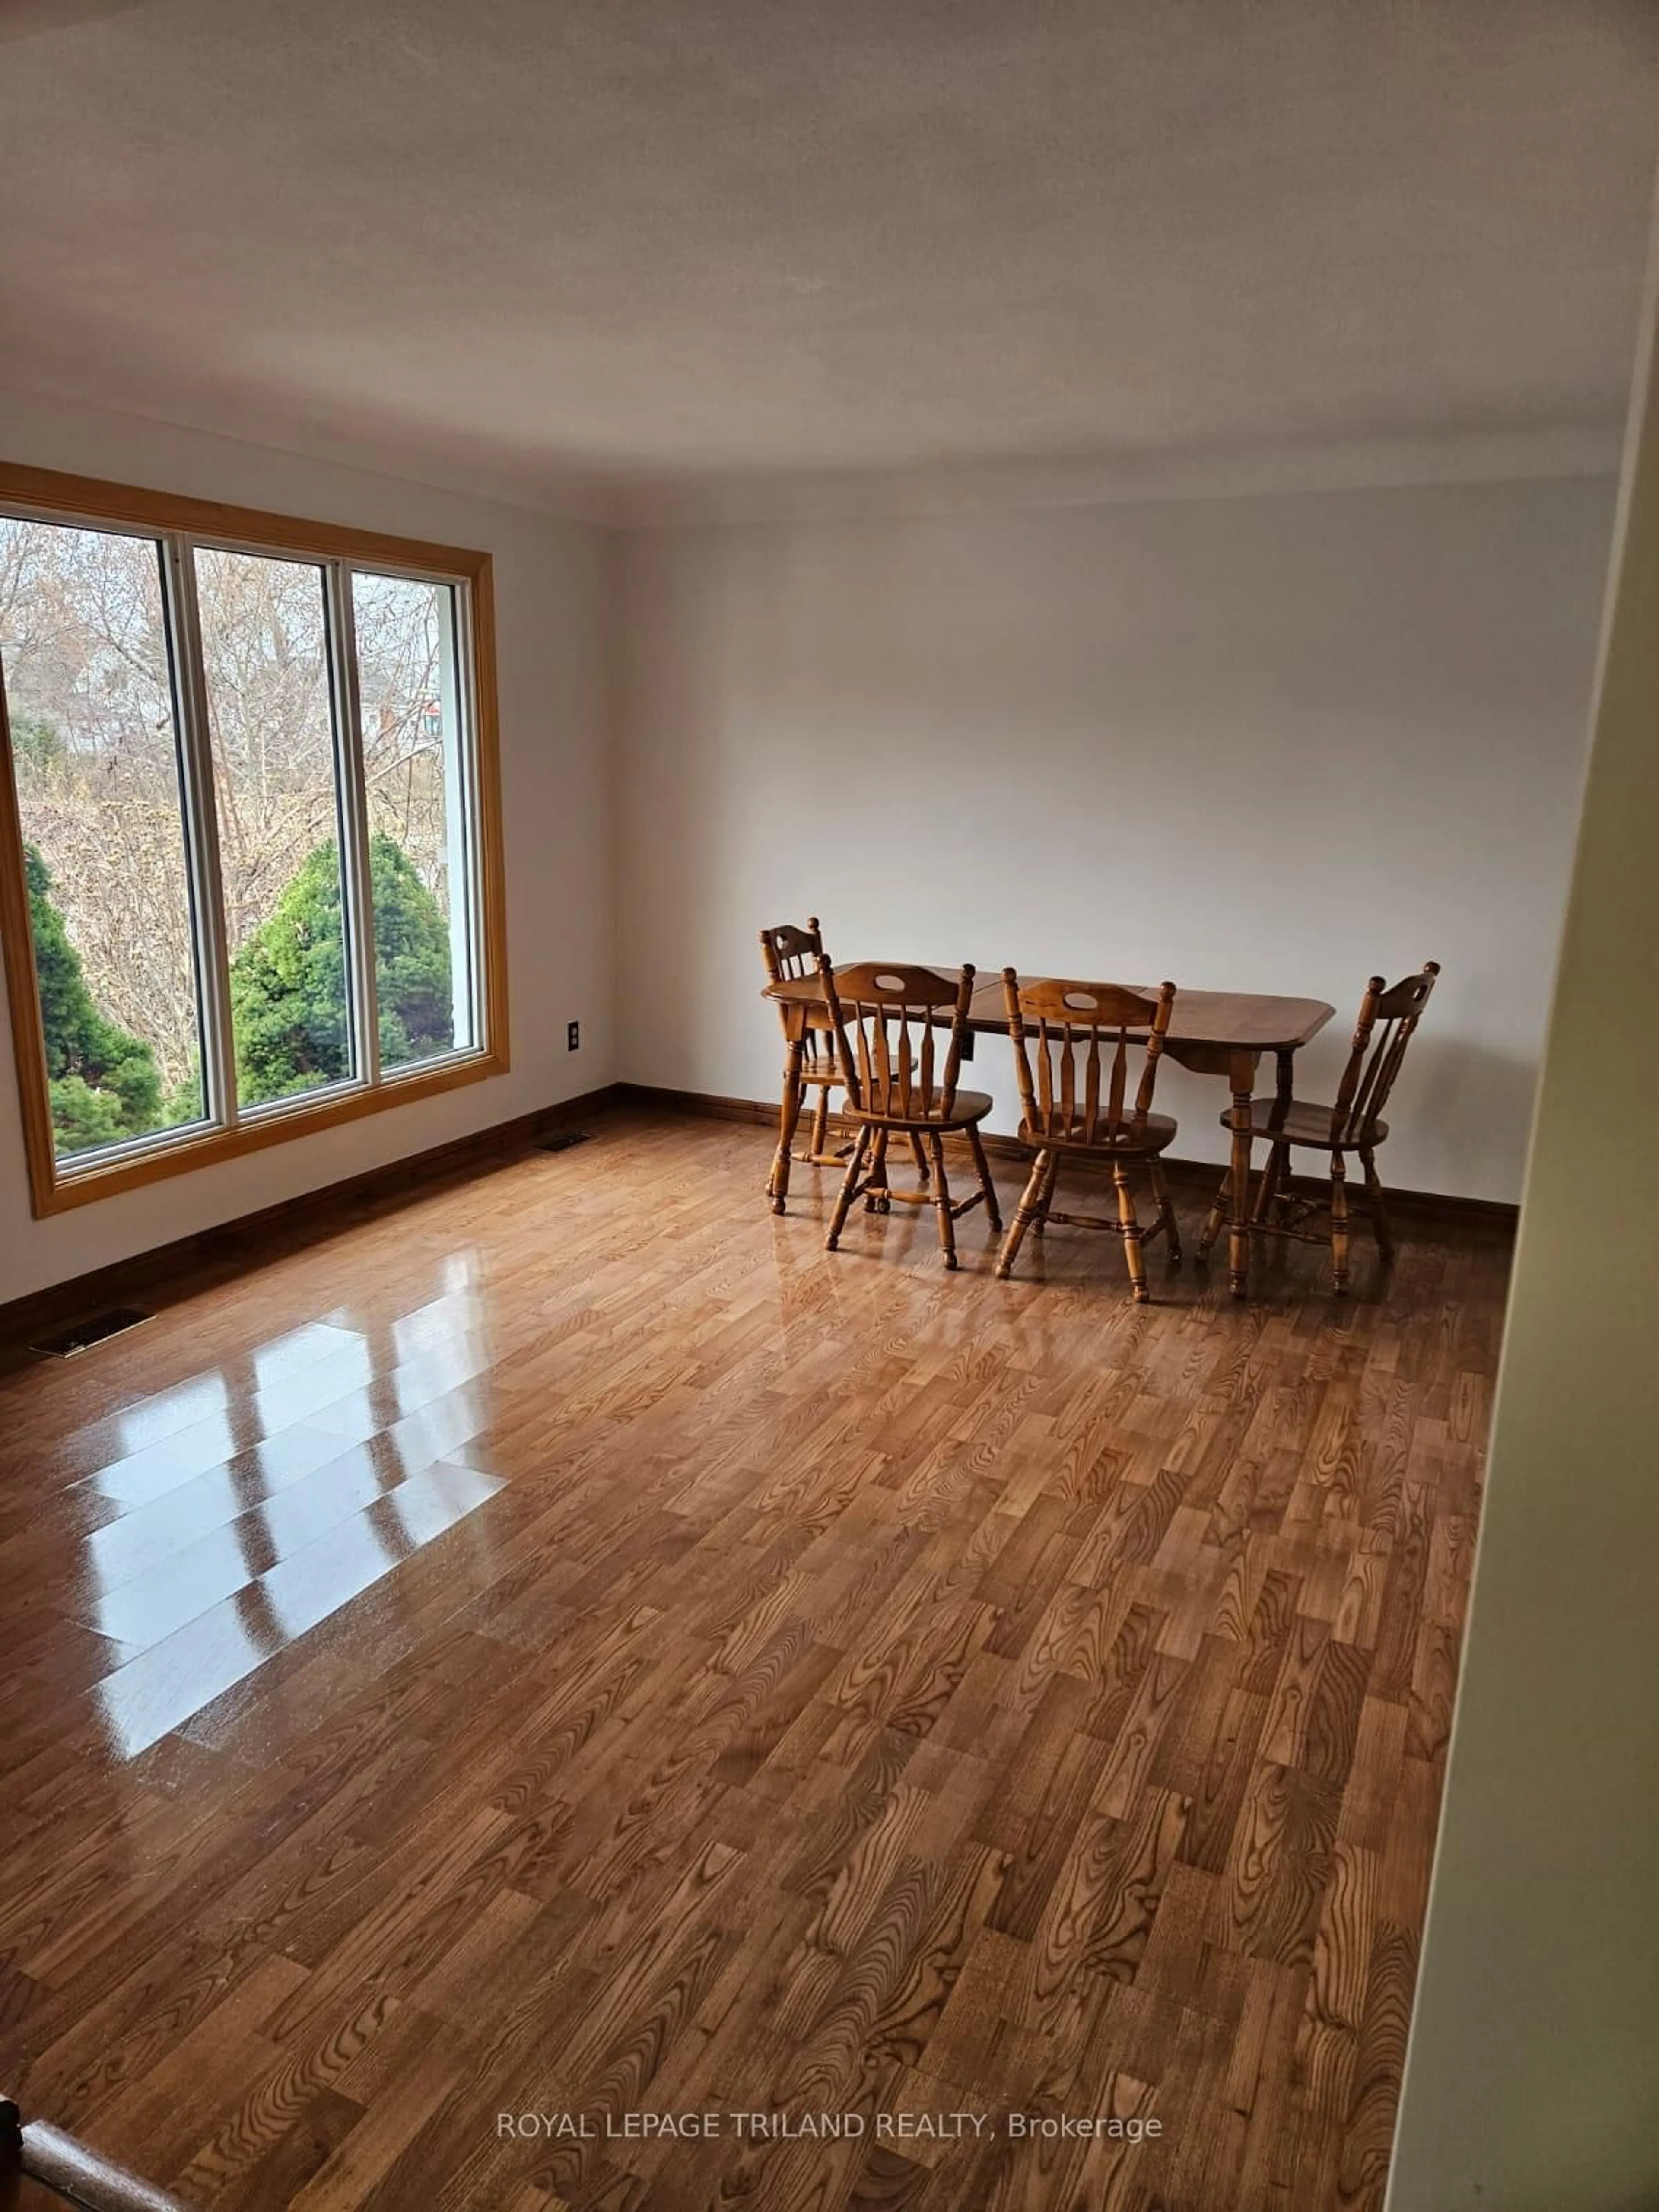
Spacious and bright! This 6 bedroom, 3 bathroom home is just a 15 minute walk to Fanshawe College and has a secondary dwelling unit in the lower level! Large yard and deck plus lots of parking! Newer windows and flooring. New kitchen on main level with hard surface counter and backsplash! New shingles to be completed before closing. Forced air gas heating and central air. Wired in smoke detectors. Owned on-demand water heater. This home is a terrific buy on a quiet cul-de-sac street close to many amenities and public transit. Showings by appointment only make yours today!


Property Details

Style1 1/2 Storey
View-
Age of property-
SqFt~1100-1500 SqFt
Lot Size6,125 SqFt(122.5 x 50)
Parking Spaces4
MLS ®NumberX12415288
Community NameCarling
Data SourceTRREB
Listing byRE/MAX ADVANTAGE REALTY LTD.

Features

Heating: Forced Air
Cooling: Central Air
Basement: Full

Main Floor

Living

5.69 x 3.76

Kitchen

5.13 x 2.67

Br

3.3 x 2.67

Br

3.05 x 3.51


Features

Lot size: 6,125 SqFt

Parking

Garage spaces 1

Garage type Detached

Other parking spaces 3

Total parking spaces 4


Property History
Sep 19, 2025
ListedActive
$649,900
13 hours on market
history photo preview33
Listing by trreb®

Market Data - Carling

Geo Zone Map ThumbnailCarling

Balanced Market

View Market Data

Detached house - for the past 30 days

Buyer's market Seller's market

Avg. Days on Market

Past 30 days

37 days

Compared to

2024

36 days

2023

15 days

2022

18 days

New Listings

Past 30 days

28 listings

Compared to

2024

19 listings

2023

26 listings

2022

18 listings

Units sold

Past 30 days

9 units

Compared to

2024

13 units

2023

17 units

2022

12 units

Median Sold Price

Past 30 days

$481,000

Compared to

2024

$497,500

2023

$495,000

2022

$525,000


Population and Demographics

Overview

Total population 18701
Average household income $82,796

Age (%)

0 to 19
21%
20 to 34
31%
35 to 49
19%
50 to 64
17%
65 and plus
12%

Household composition (%)

Single family
53%
Single person
36%
Multi person
10%
Multi family
0%

Mother tongue (%)

English
79%
Others
6%
Nepali
3%
Malayalam
3%
Spanish
2%
Arabic
2%
Tagalog (Pilipino, Filipino)
1%

House tenancy (%)

Renters
58%
Owners
42%

What’s nearby?Essentials within 5 km

Local Logic

Transportation Scores

Estimated Budget