Sold for $···,···
•
•
•
•
Contact us about this property
Highlights
Sold since
Login to viewEstimated valueThis is the price Wahi expects this property to sell for.
The calculation is powered by our Instant Home Value Estimate, which uses current market and property price trends to estimate your home’s value with a 90% accuracy rate.Login to view
Price/SqftLogin to view
Monthly cost
Open Calculator
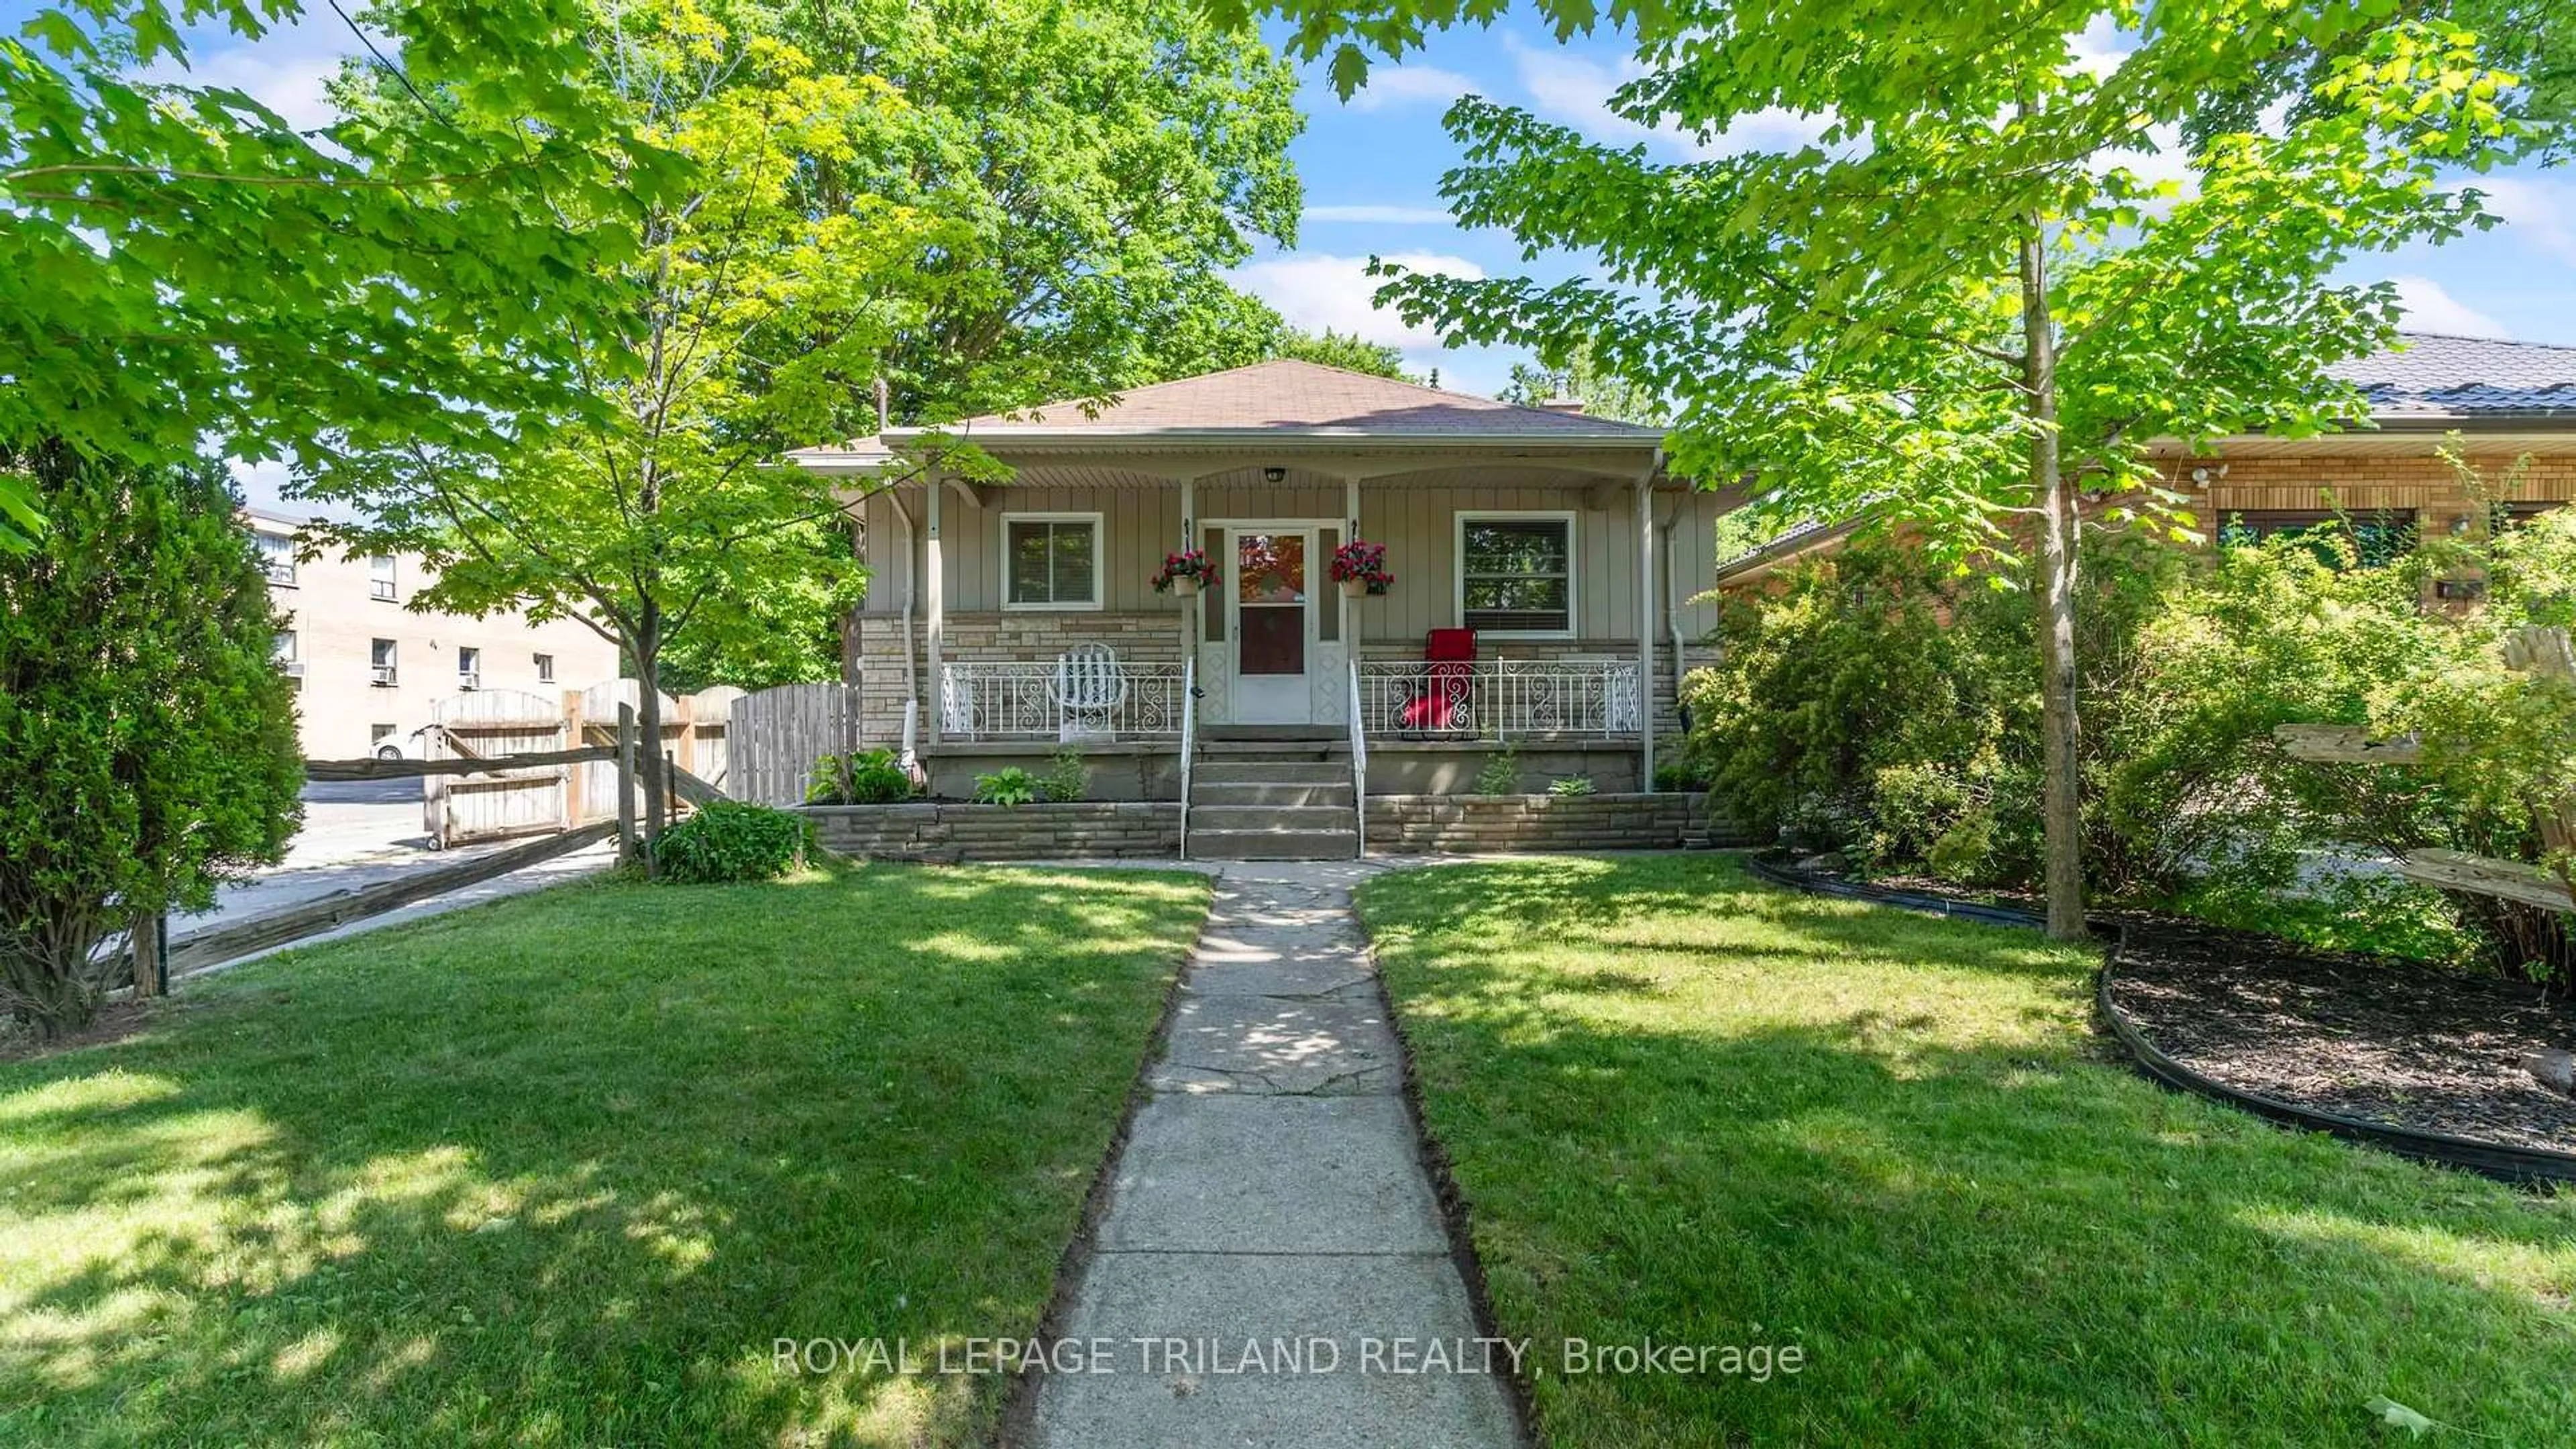
Description
Signup or login to view
Property Details
Signup or login to view
Interior
Signup or login to view
Features
Heating: Forced Air
Cooling: Central Air
Fireplace
Basement: Part Bsmt
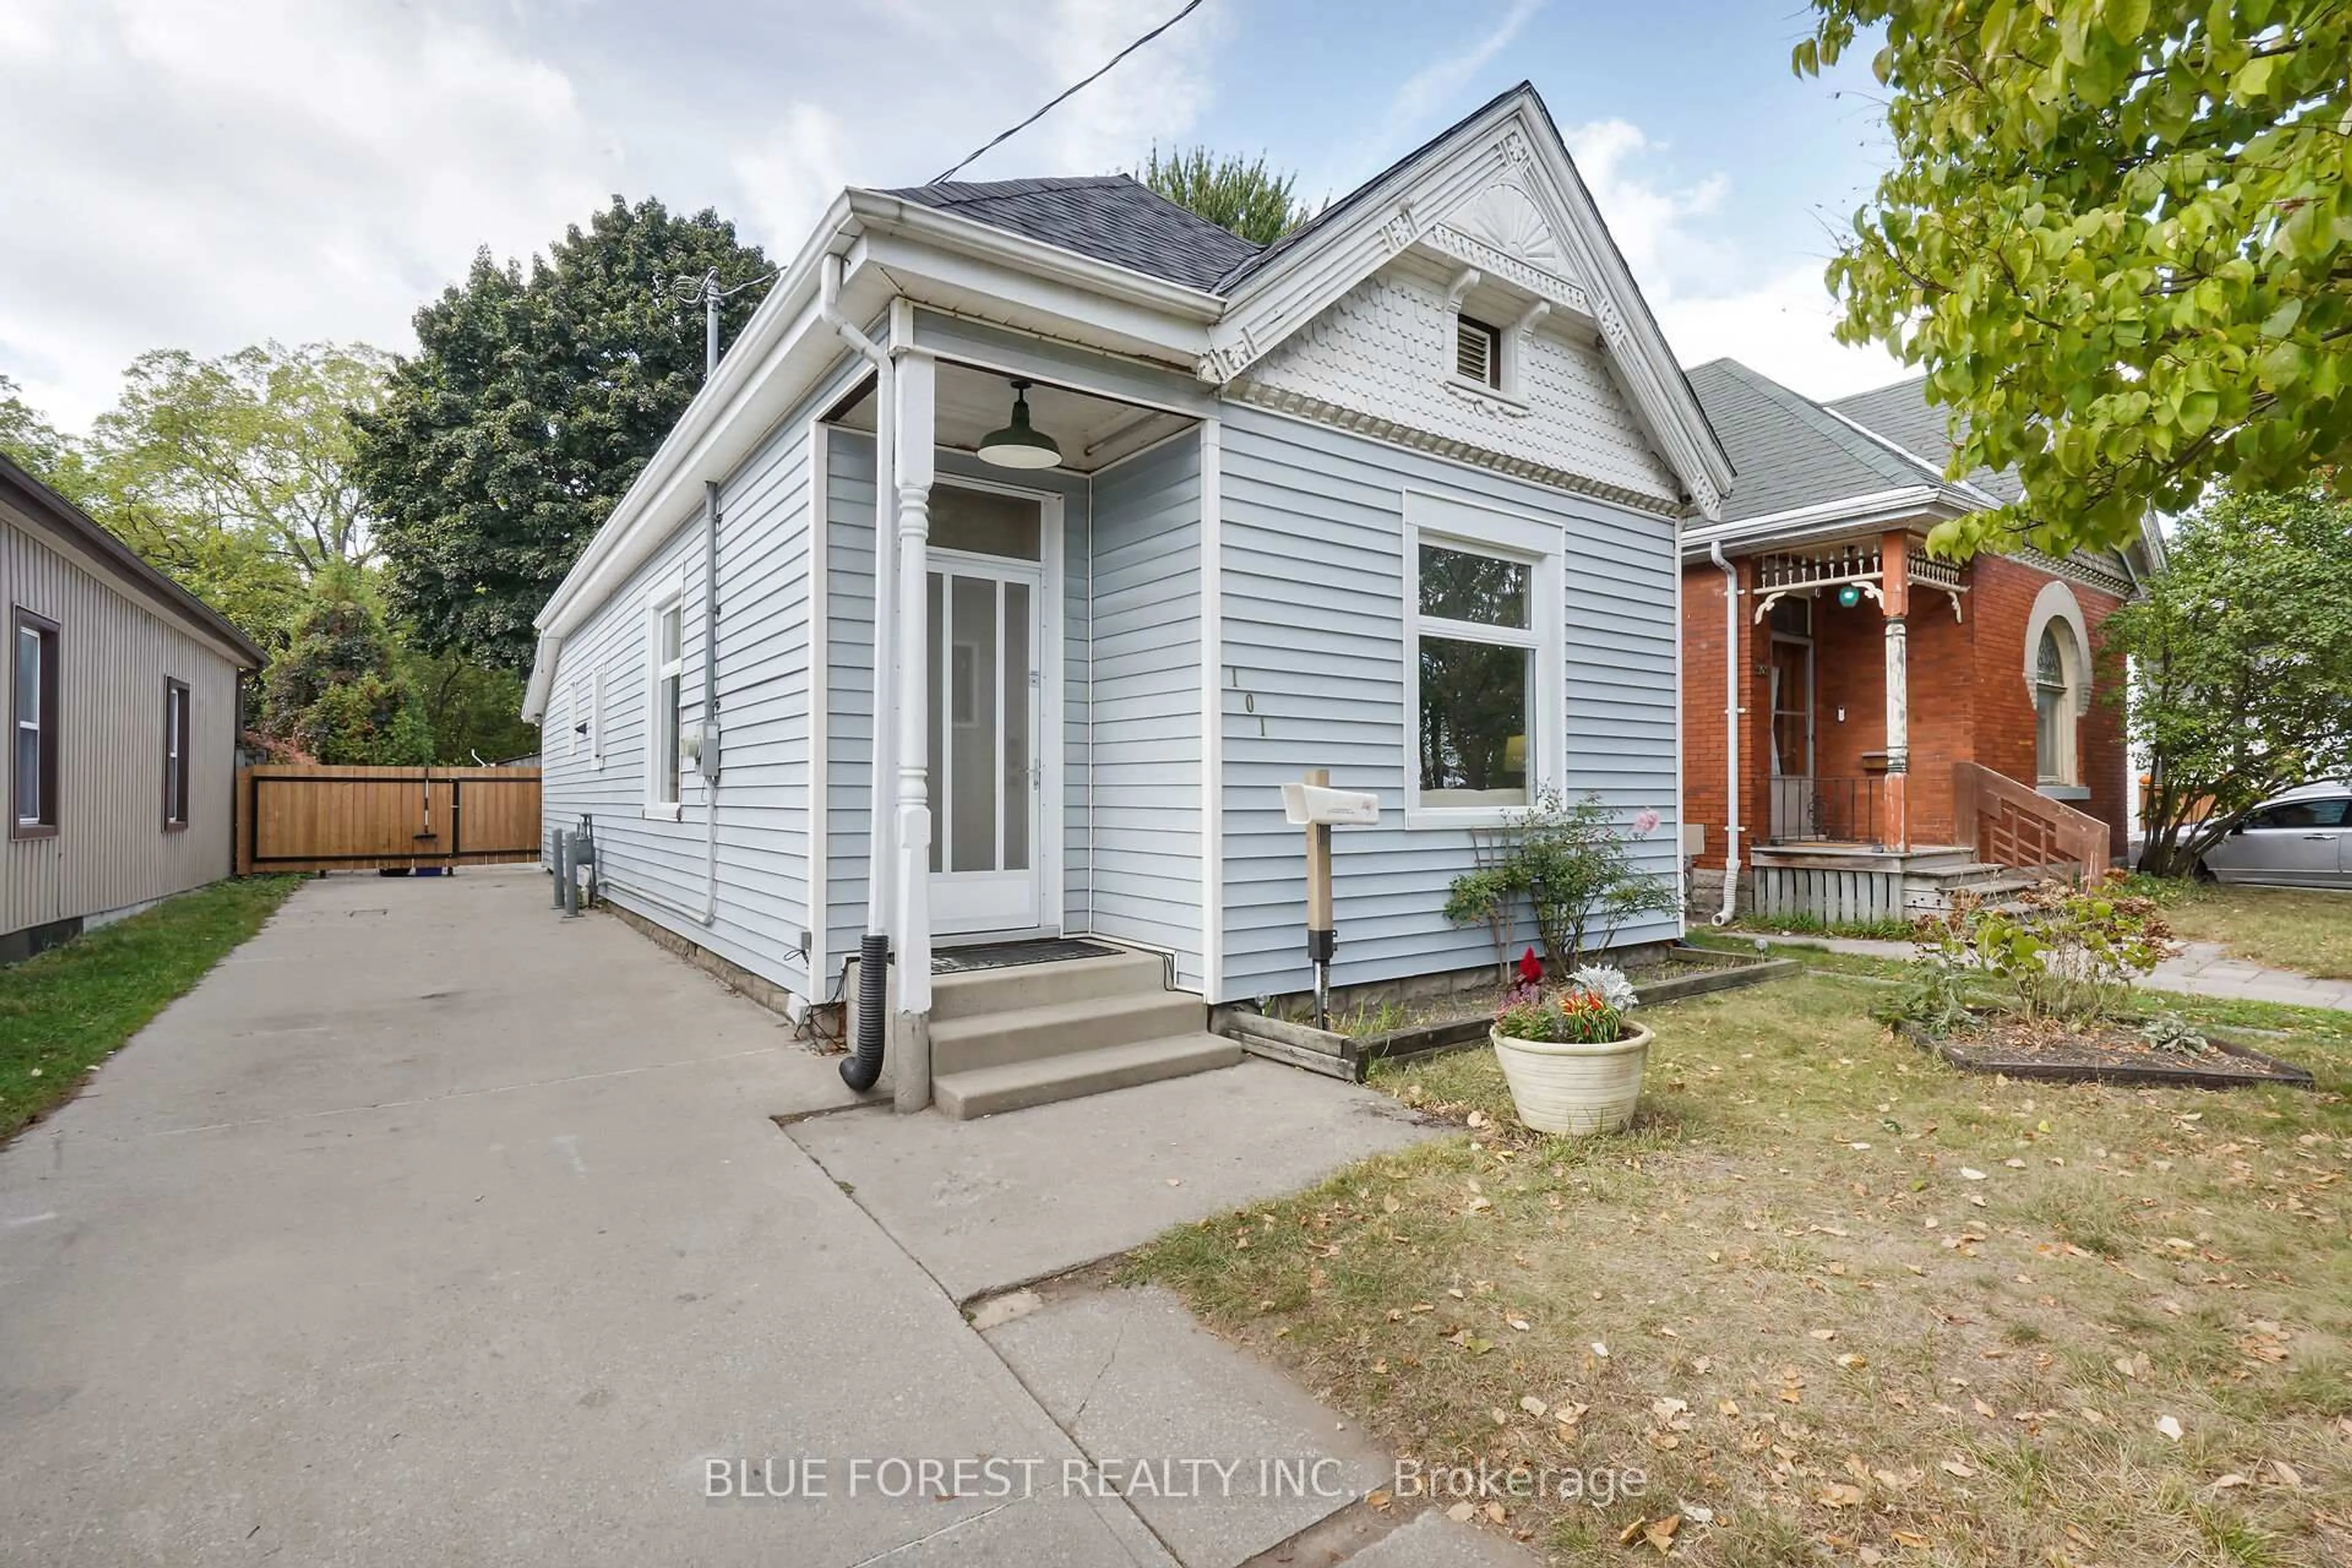
Exterior
Signup or login to view
Features
Lot size: 6,200 SqFt
Parking
Garage spaces -
Garage type -
Total parking spaces 4
Property History
Jun 17, 2025
Sold
$•••,•••
Stayed 34 days on market 30Listing by trreb®
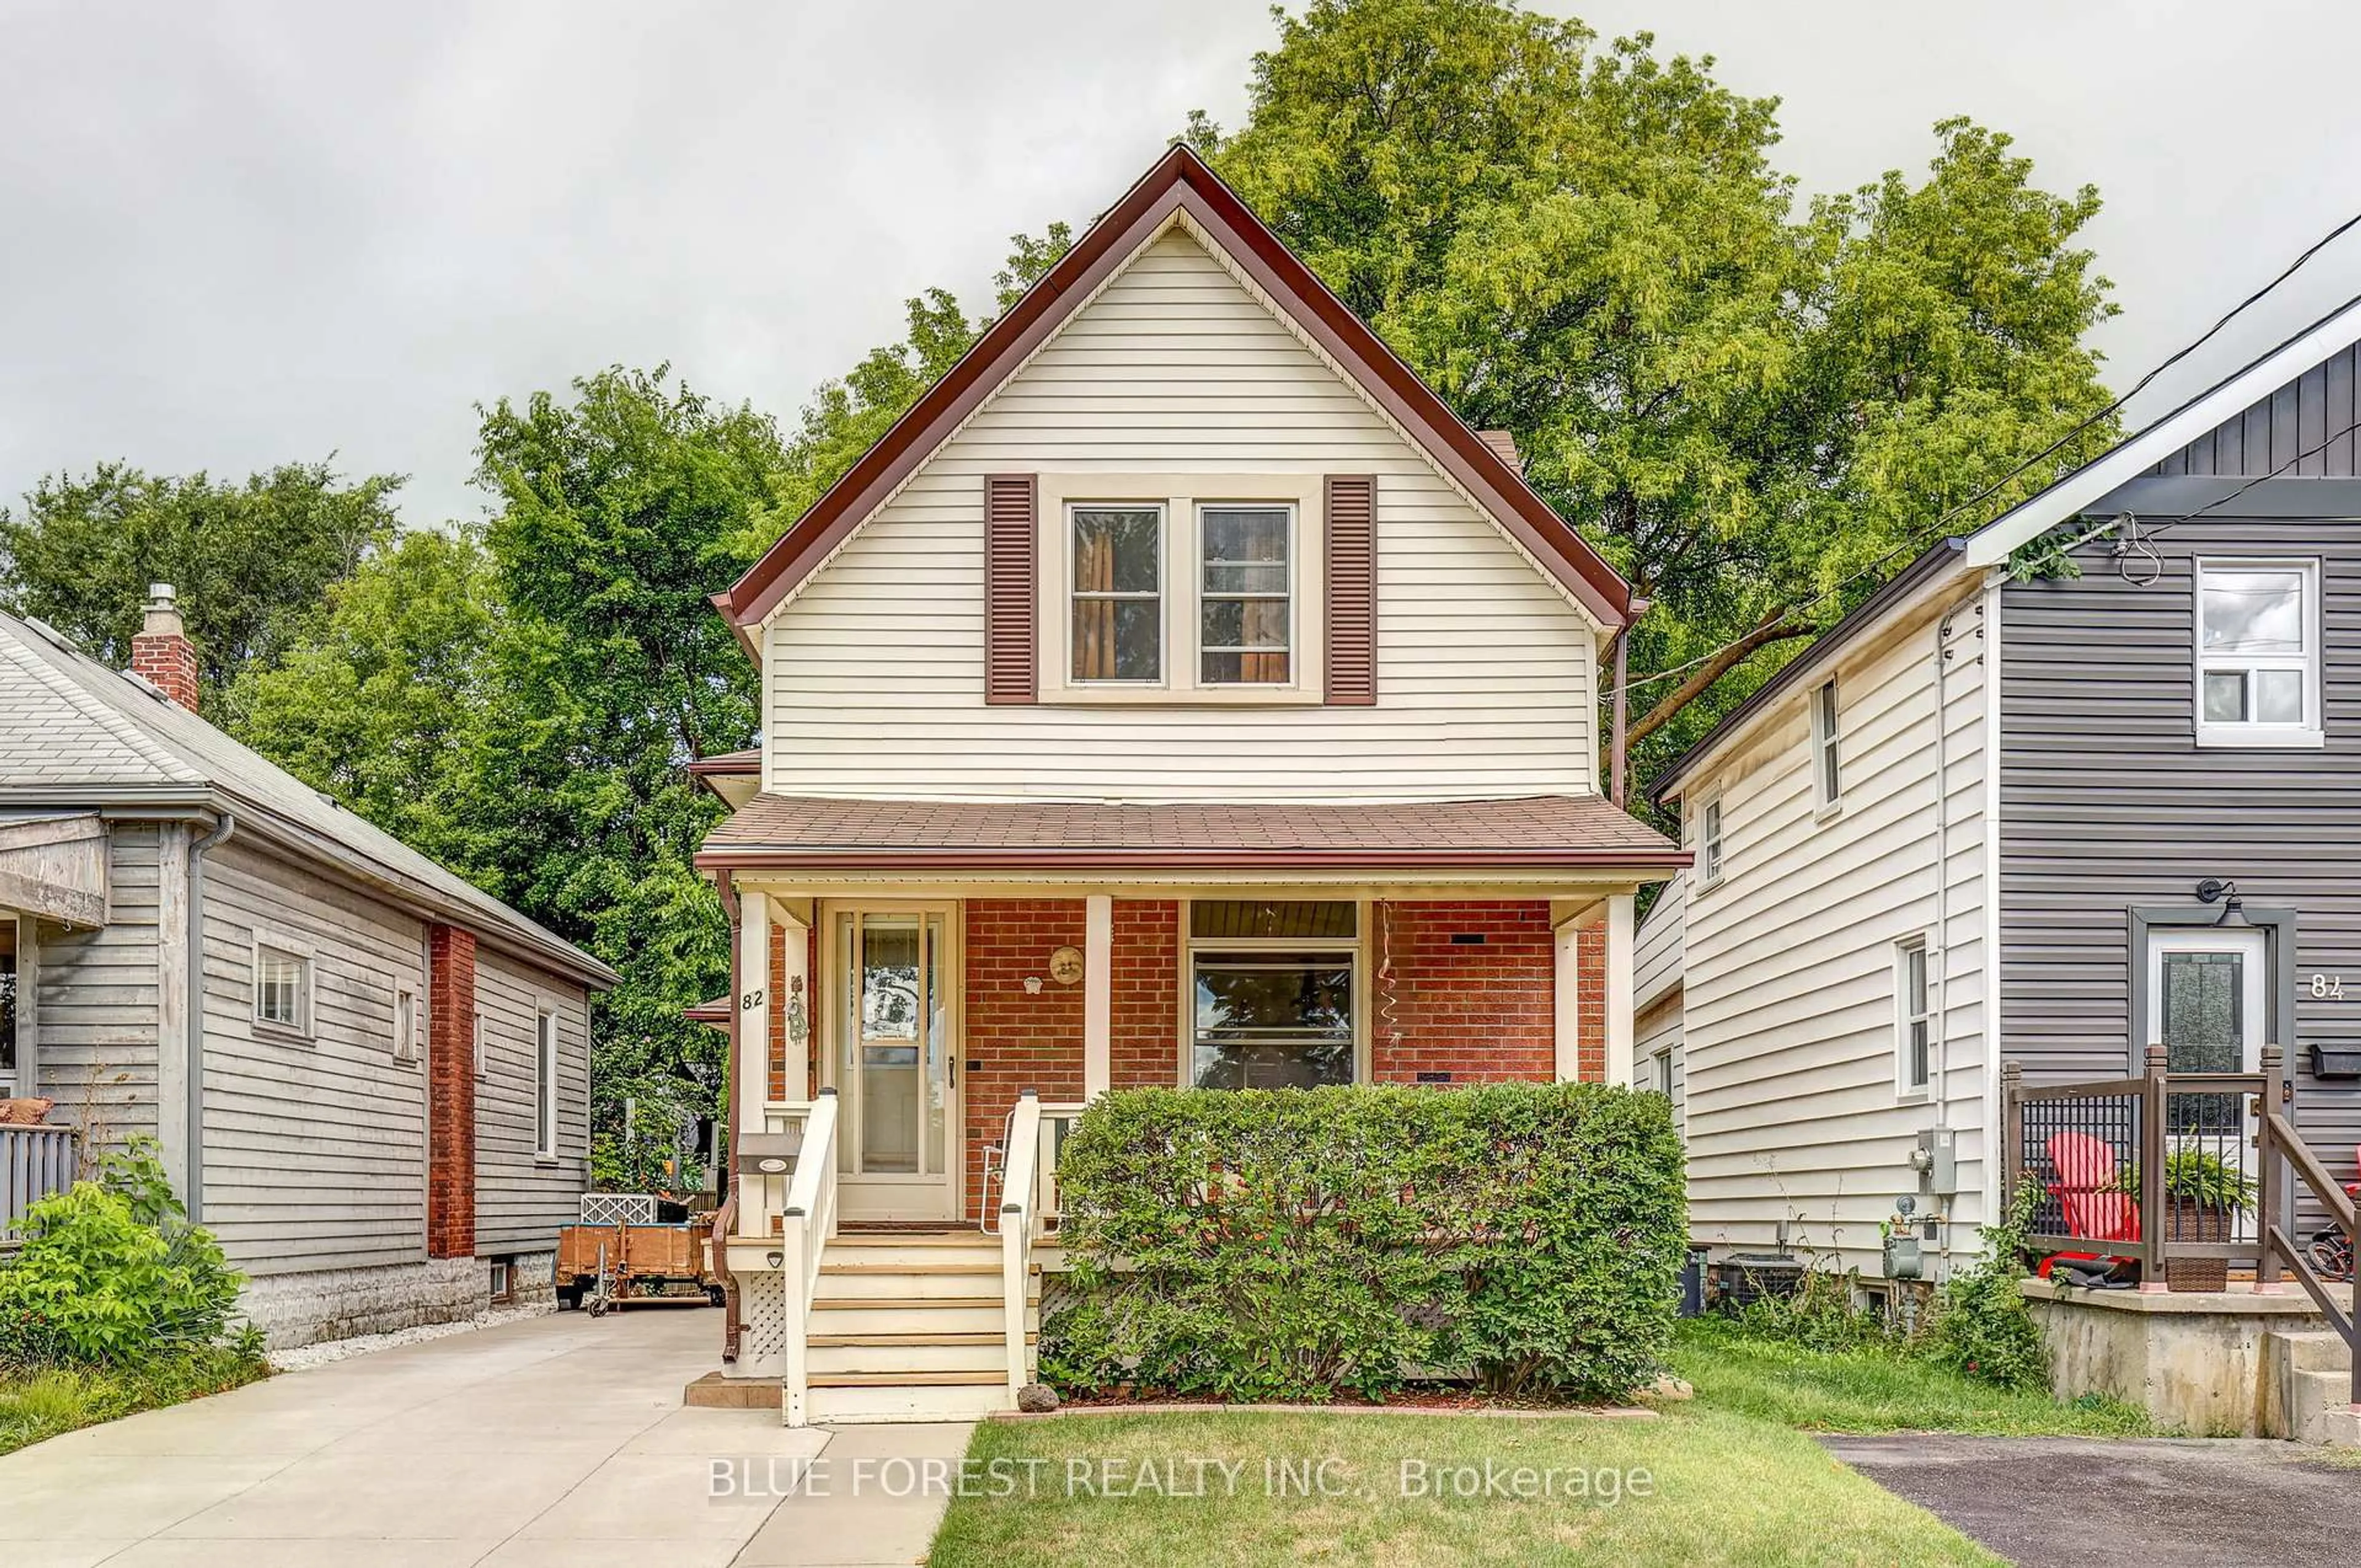
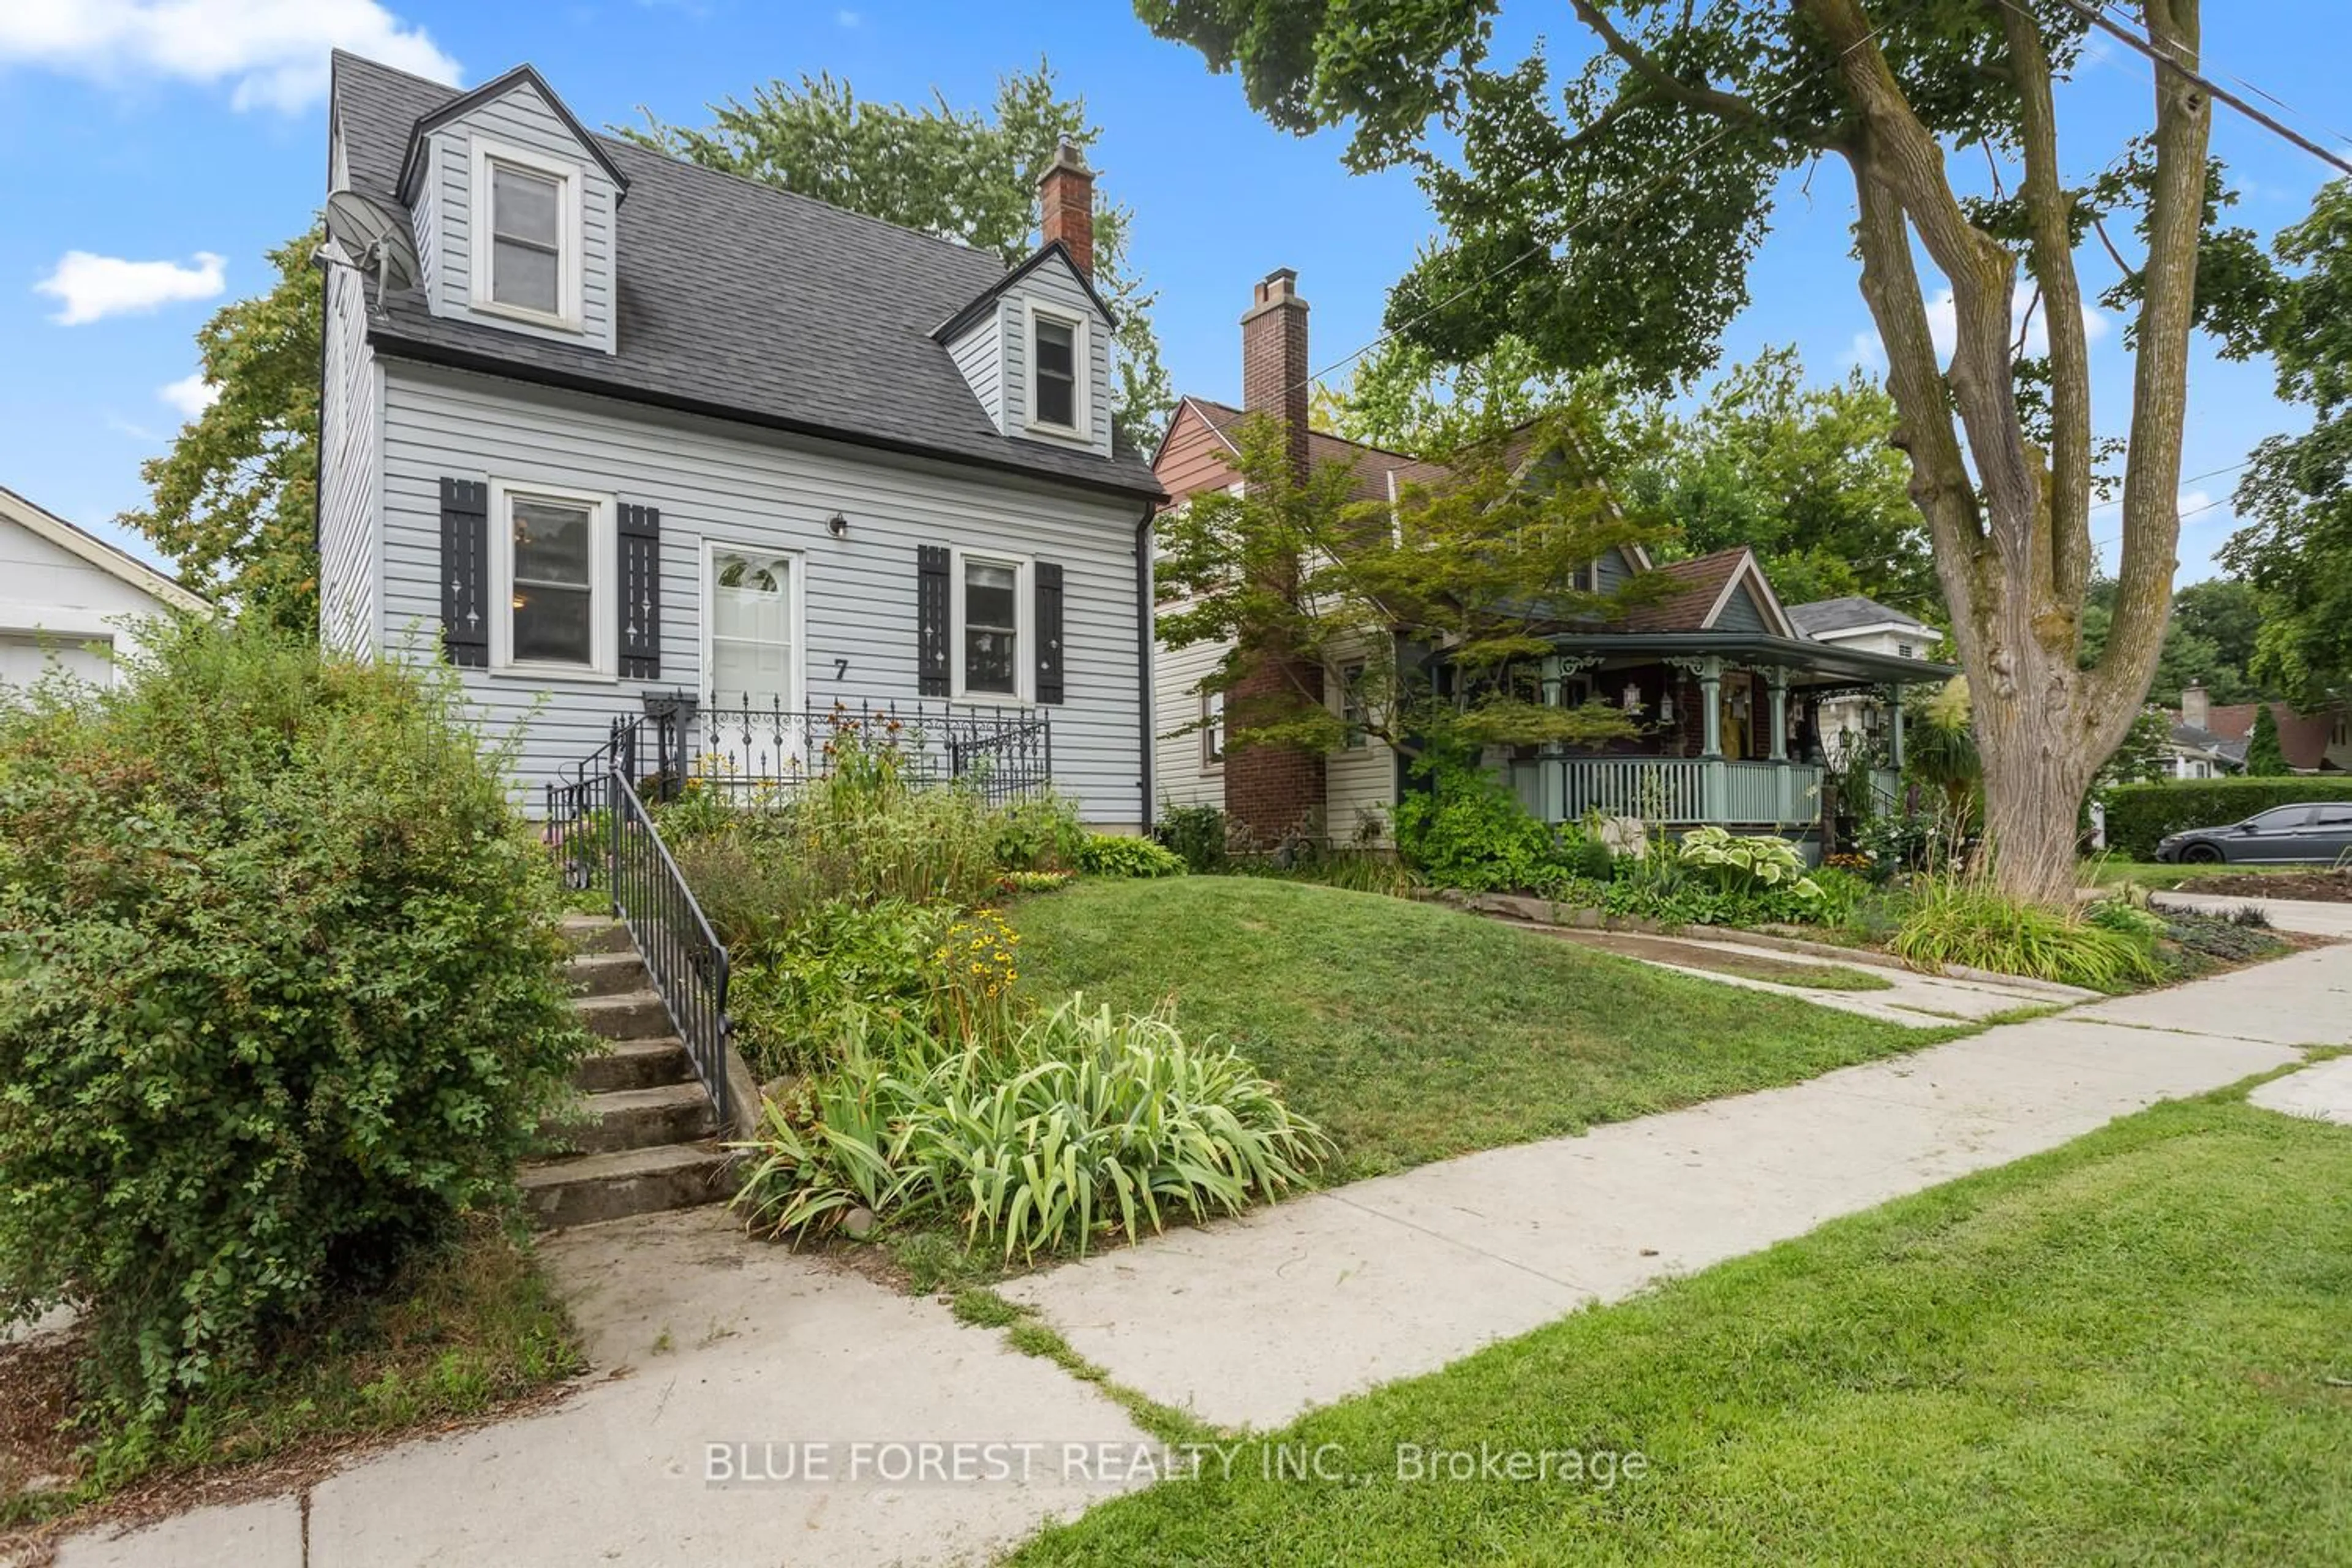
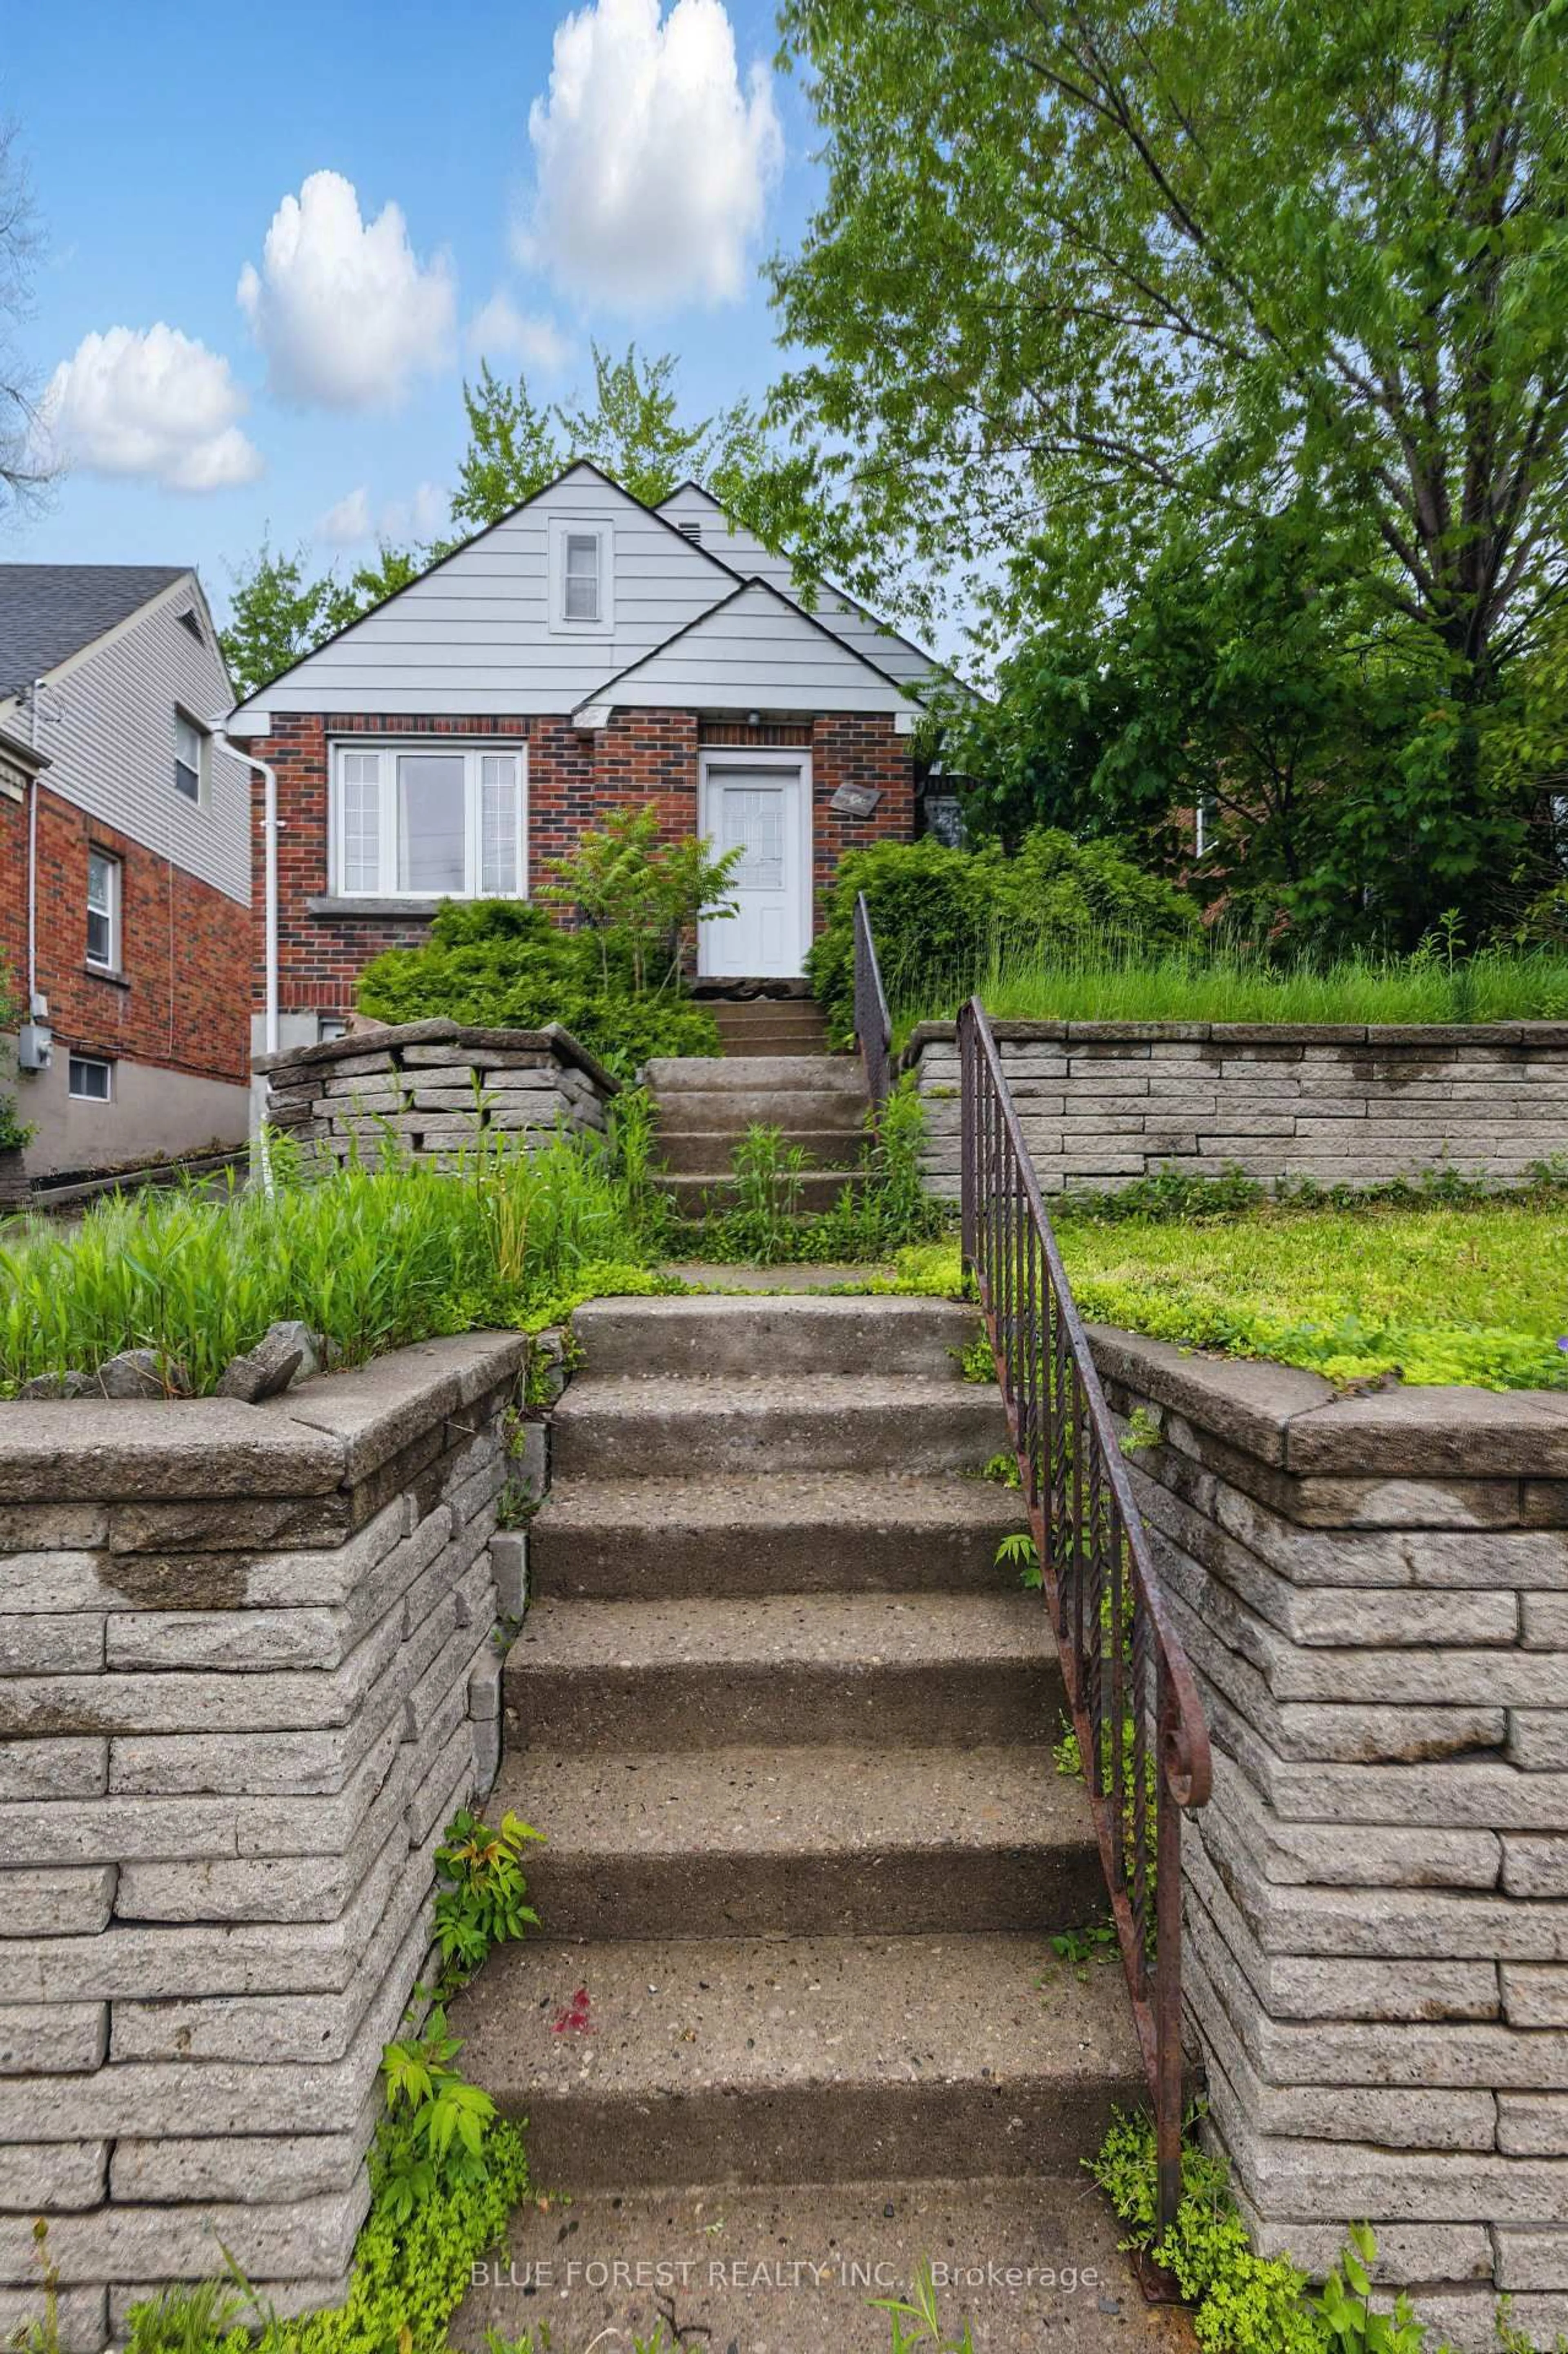
30Property listed by BLUE FOREST REALTY INC., Brokerage
Get up to 0.5% cashback when you buy your dream home with Wahi Cashback

A new way to buy a home that puts cash back in your pocket.
- Our in-house Realtors do more deals and bring that negotiating power into your corner
- We leverage technology to get you more insights, move faster and simplify the process
- Our digital business model means we pass the savings onto you, with up to 0.5% cashback on the purchase of your home