No images are available for this listing

Looks like no photos have been added to this listing just yet.

3 days on Market

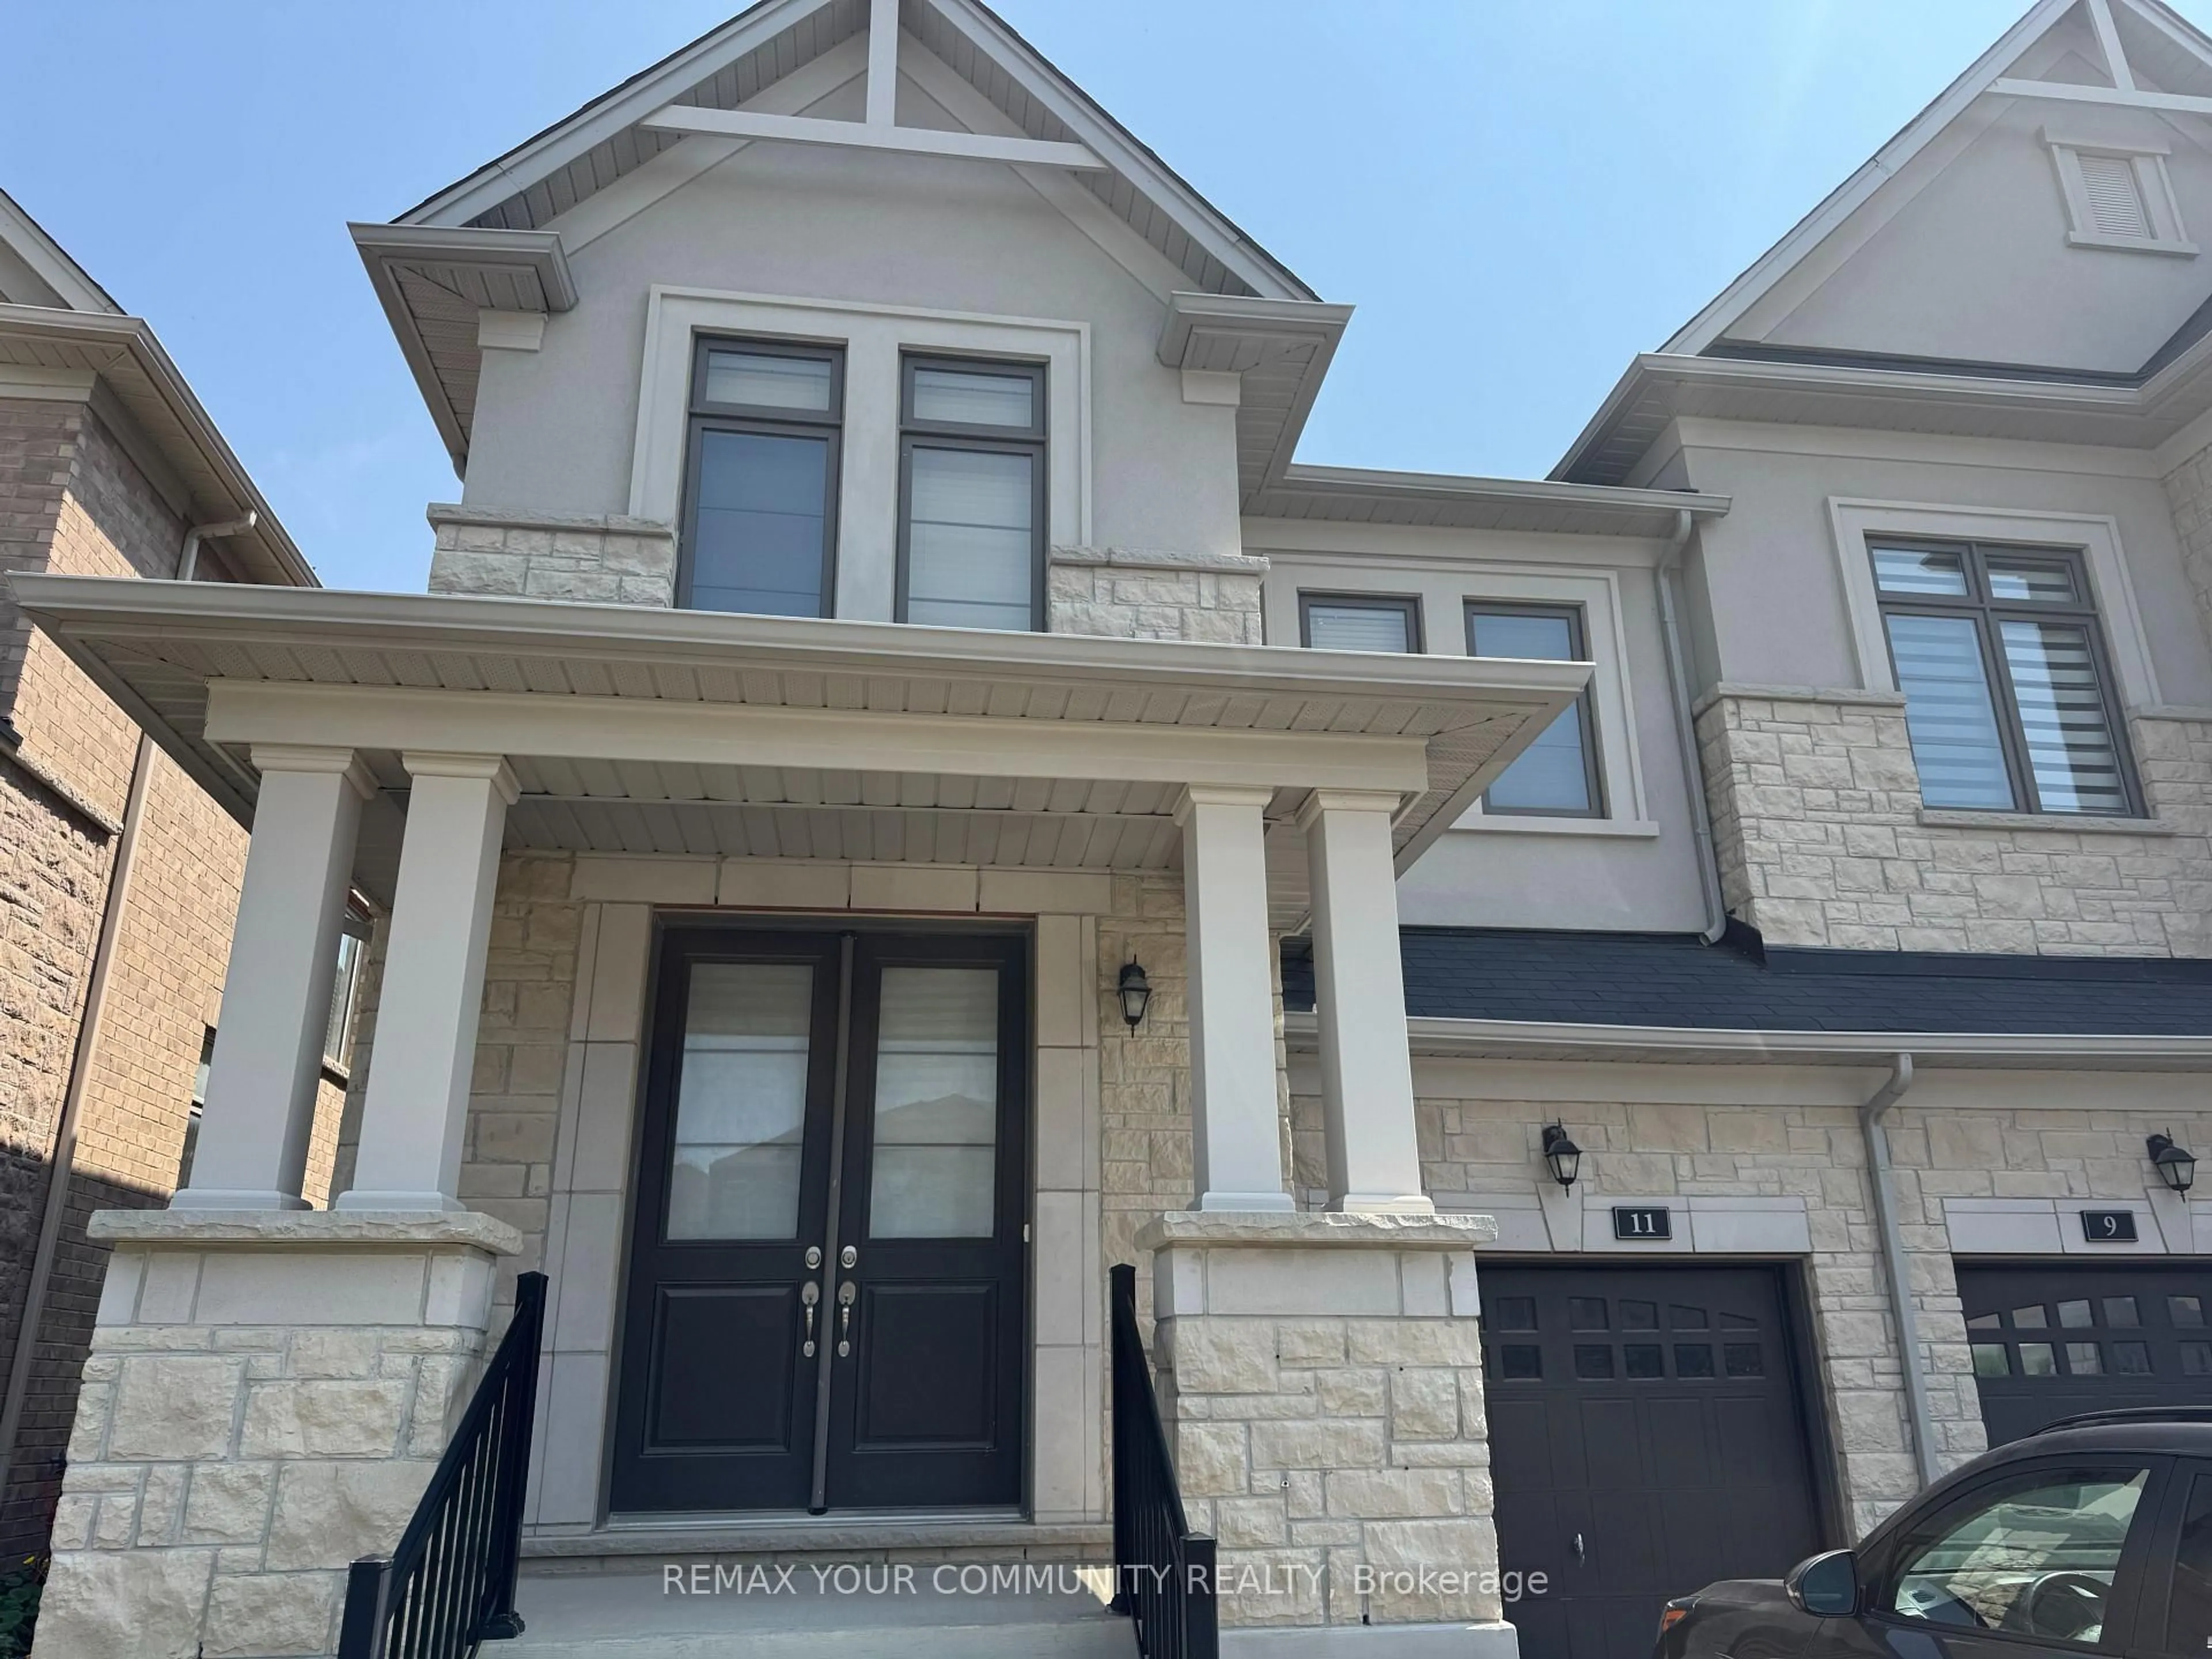
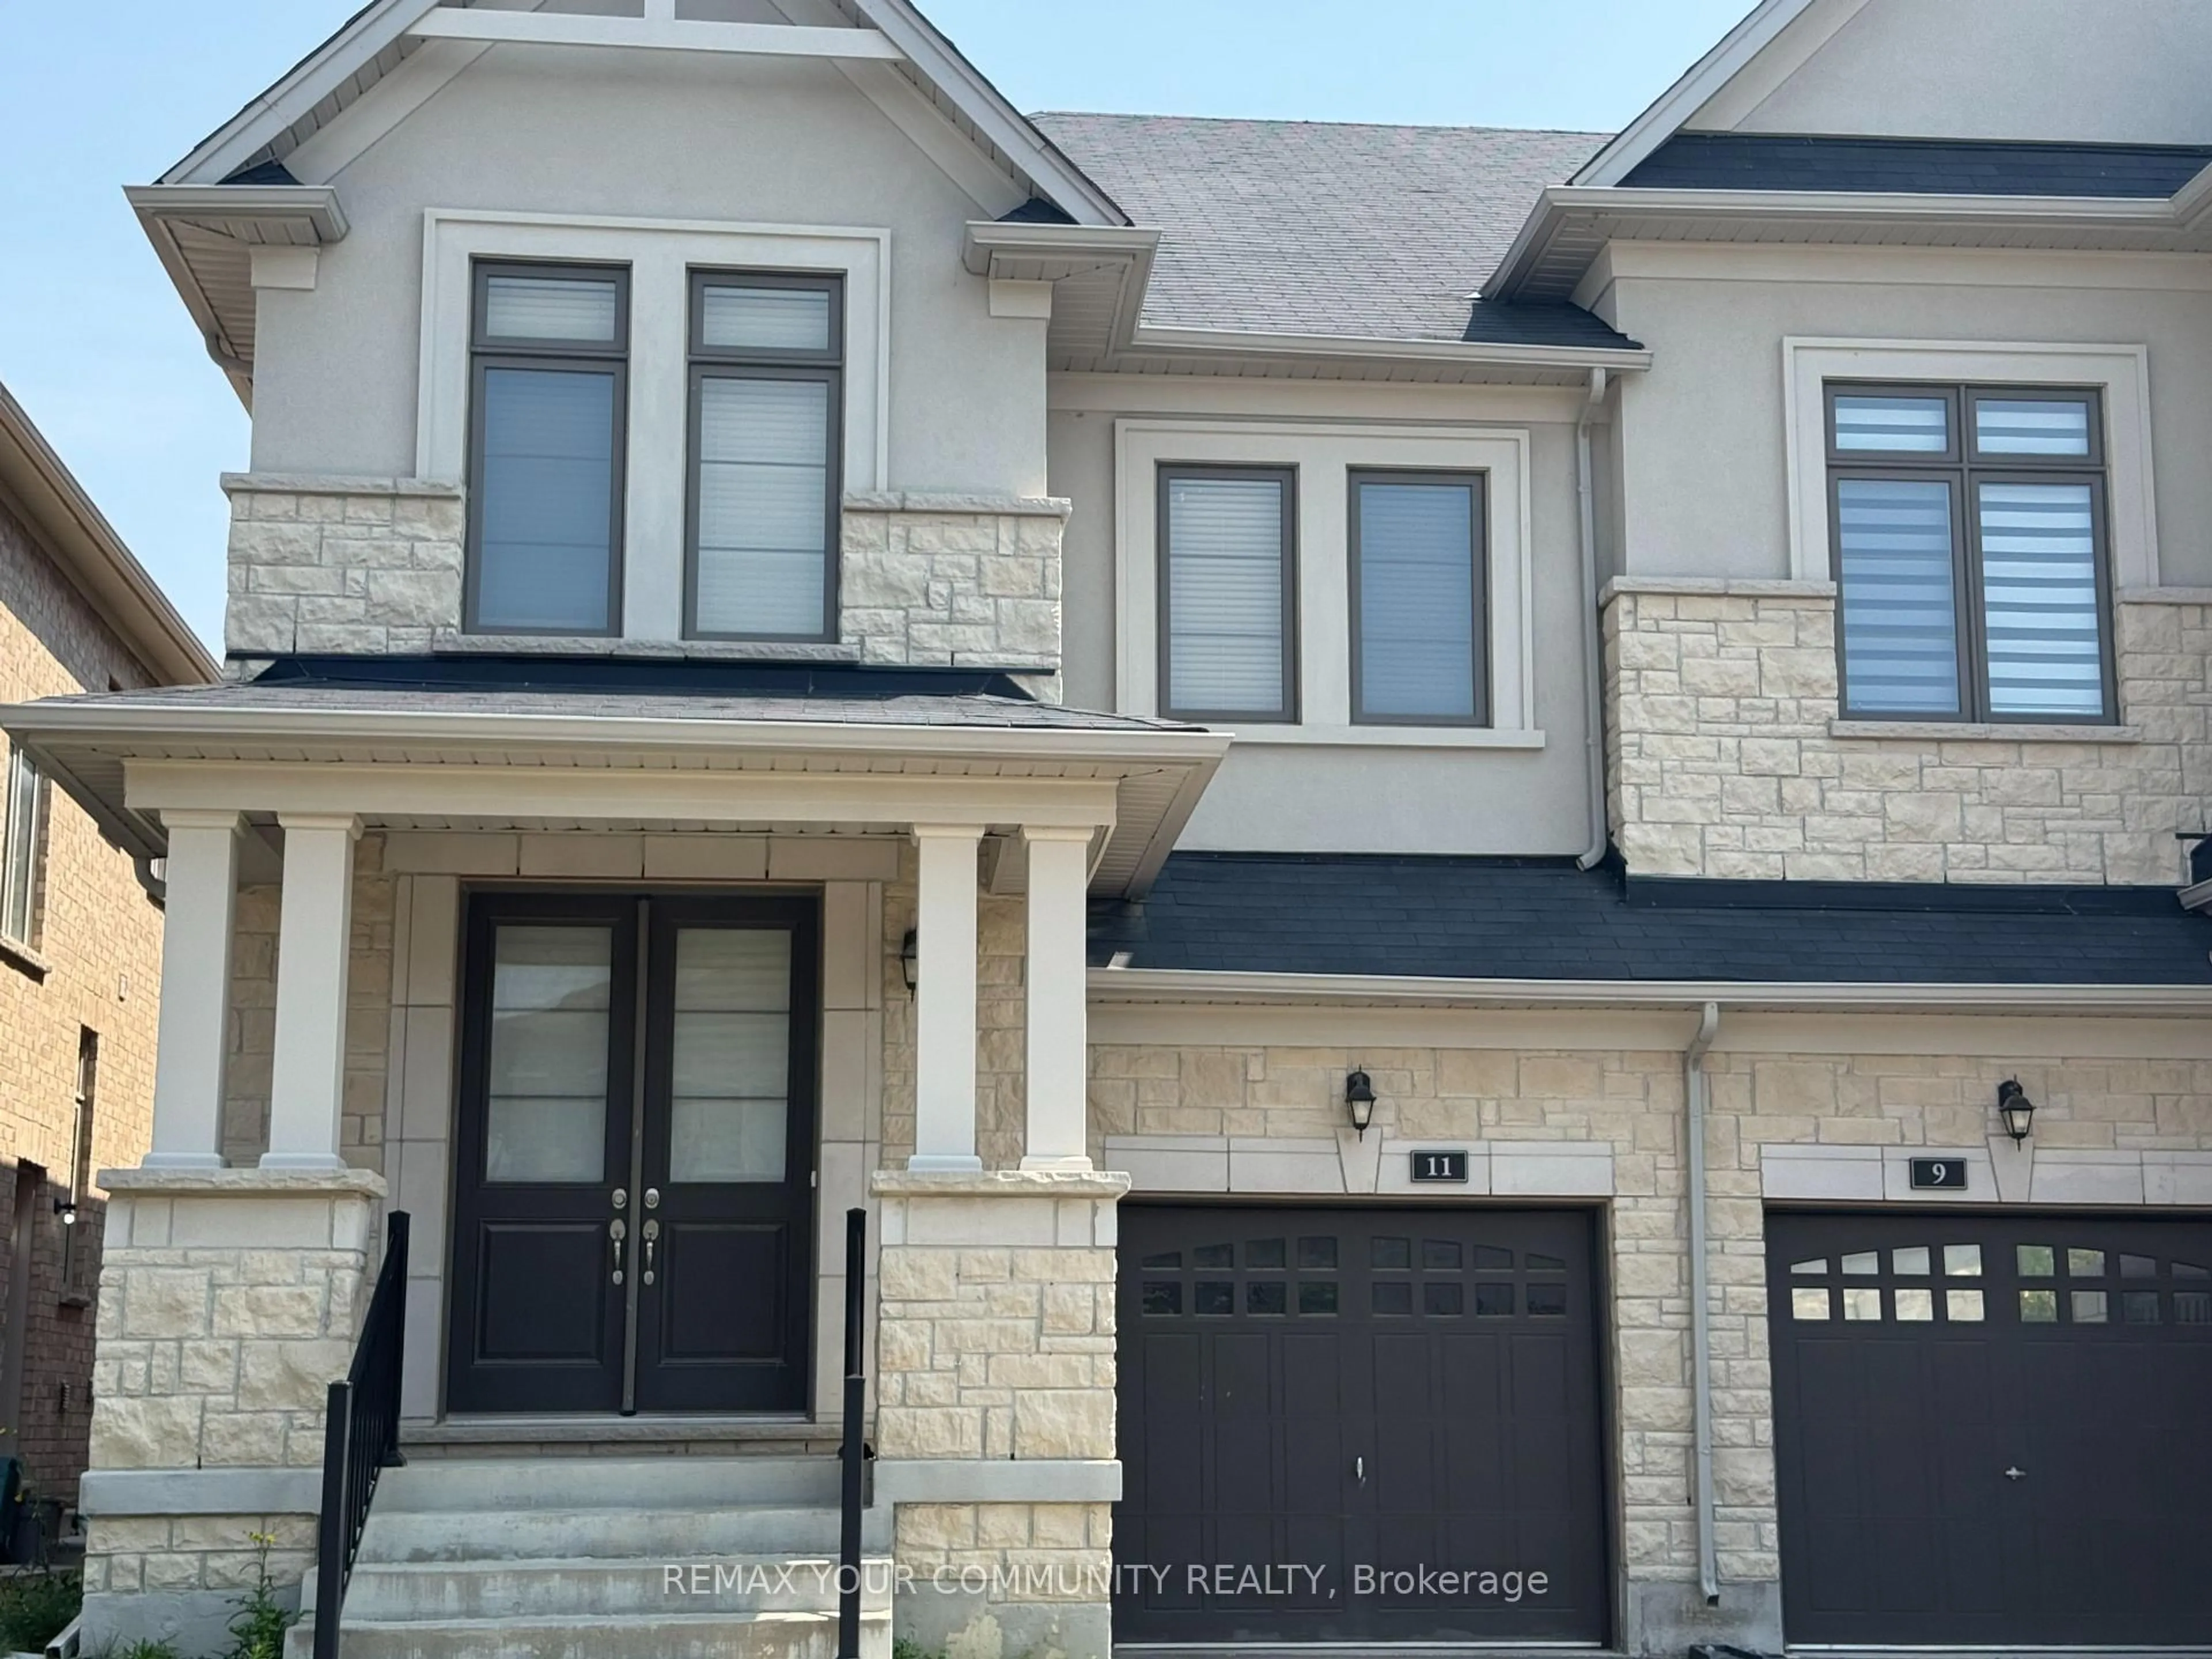
11 John Smith St, East Gwillimbury, Ontario L9N 0S7

Semi-Detached
4
4
~2000-2500 sqft
$1,000,000
Get pre-qualifiedPowered by nesto
Buy with Wahi to get
Up to
$10,000Cashback
Semi-Detached
4
4
~2000-2500 sqft

Contact us about this property

Call

Highlights

Property Estimate

Days on market3 days

Estimated valueNot available

Price/Sqft$450/sqft

Monthly cost

Open Calculator

CMA Subject Property

Curious about what homes are selling for in this area?

Get a report on comparable homes with helpful insights and trends.

+1

Properties sold*

$960K

Median sold price*

*Based on last 30 days

Description

A COZY AND BRIGHT SEMI IN THE DESIRABLE AREA OF HOLLAND LANDING. THE PROPERTY FACES EAST WEST WHICH MAKES IT BRIGHT THROUGHOUT THE WHOLE DAY. WALK-OUT LUMINOUS BASEMENT. NICE OPEN CONCEPT LAYOUT AND DECENT ROOM SIZES. MASTER AND 2ND ROOM HAVE THEIR ENSUITE WASHROOMS AND 3RD AND 4TH SHARE A SEPARATE WASHROOM. BACKYARD ALMOST FULLY FENCED.


Property Details

Style2-Storey
View-
Age of property-
SqFt~2000-2500 SqFt
Lot Size287 SqM(34.42 x 8.34)
Parking Spaces2
MLS ®NumberN12339083
Community NameNeighborhood of East Gwillimbury
Data SourceTRREB
Listing byROYAL LEPAGE YOUR COMMUNITY REALTY

Features

Heating: Forced Air
Central Vacuum
Cooling: Central Air
Fireplace
Basement: Full, W/O

Features

Lot size: 287 SqM

Parking

Garage spaces 1

Garage type Built-In

Other parking spaces 1

Total parking spaces 2


Property History

Aug 12, 2025
ListedActive
$1,000,000
3 days on market
Listing by trreb®

Market Data - Neighborhood of East Gwillimbury

Geo Zone Map ThumbnailNeighborhood of East Gwillimbury

Strong Buyer's Market

View Market Data

Semi-Detached house - for the past 30 days

Buyer's market Seller's market

Avg. Days on Market

Past 30 days

34 days

Compared to

2024

16 days

2023

28 days

2022

0 day

New Listings

Past 30 days

4 listings

Compared to

2024

7 listings

2023

7 listings

2022

1 listing

Units sold

Past 30 days

1 unit

Compared to

2024

1 unit

2023

3 units

2022

0 unit

Median Sold Price

Past 30 days

$872,500

Compared to

2024

$960,000

2023

$1,215,000


Population and Demographics

Overview

Total population 35690
Average household income $149,416

Age (%)

0 to 19
25%
20 to 34
18%
35 to 49
22%
50 to 64
22%
65 and plus
14%

Household composition (%)

Single family
81%
Single person
15%
Multi person
2%
Multi family
1%

Mother tongue (%)

English
76%
Mandarin
5%
Yue (Cantonese)
4%
Others
3%
Russian
3%
Iranian Persian
2%
Spanish
1%
Italian
1%
Tamil
1%

House tenancy (%)

Owners
84%
Renters
16%

What’s nearby?Essentials within 5 km

Local Logic

Transportation Scores

Estimated Budget