Unknown for 168 Simcoe St #303, Toronto Ontario M5H 4C9

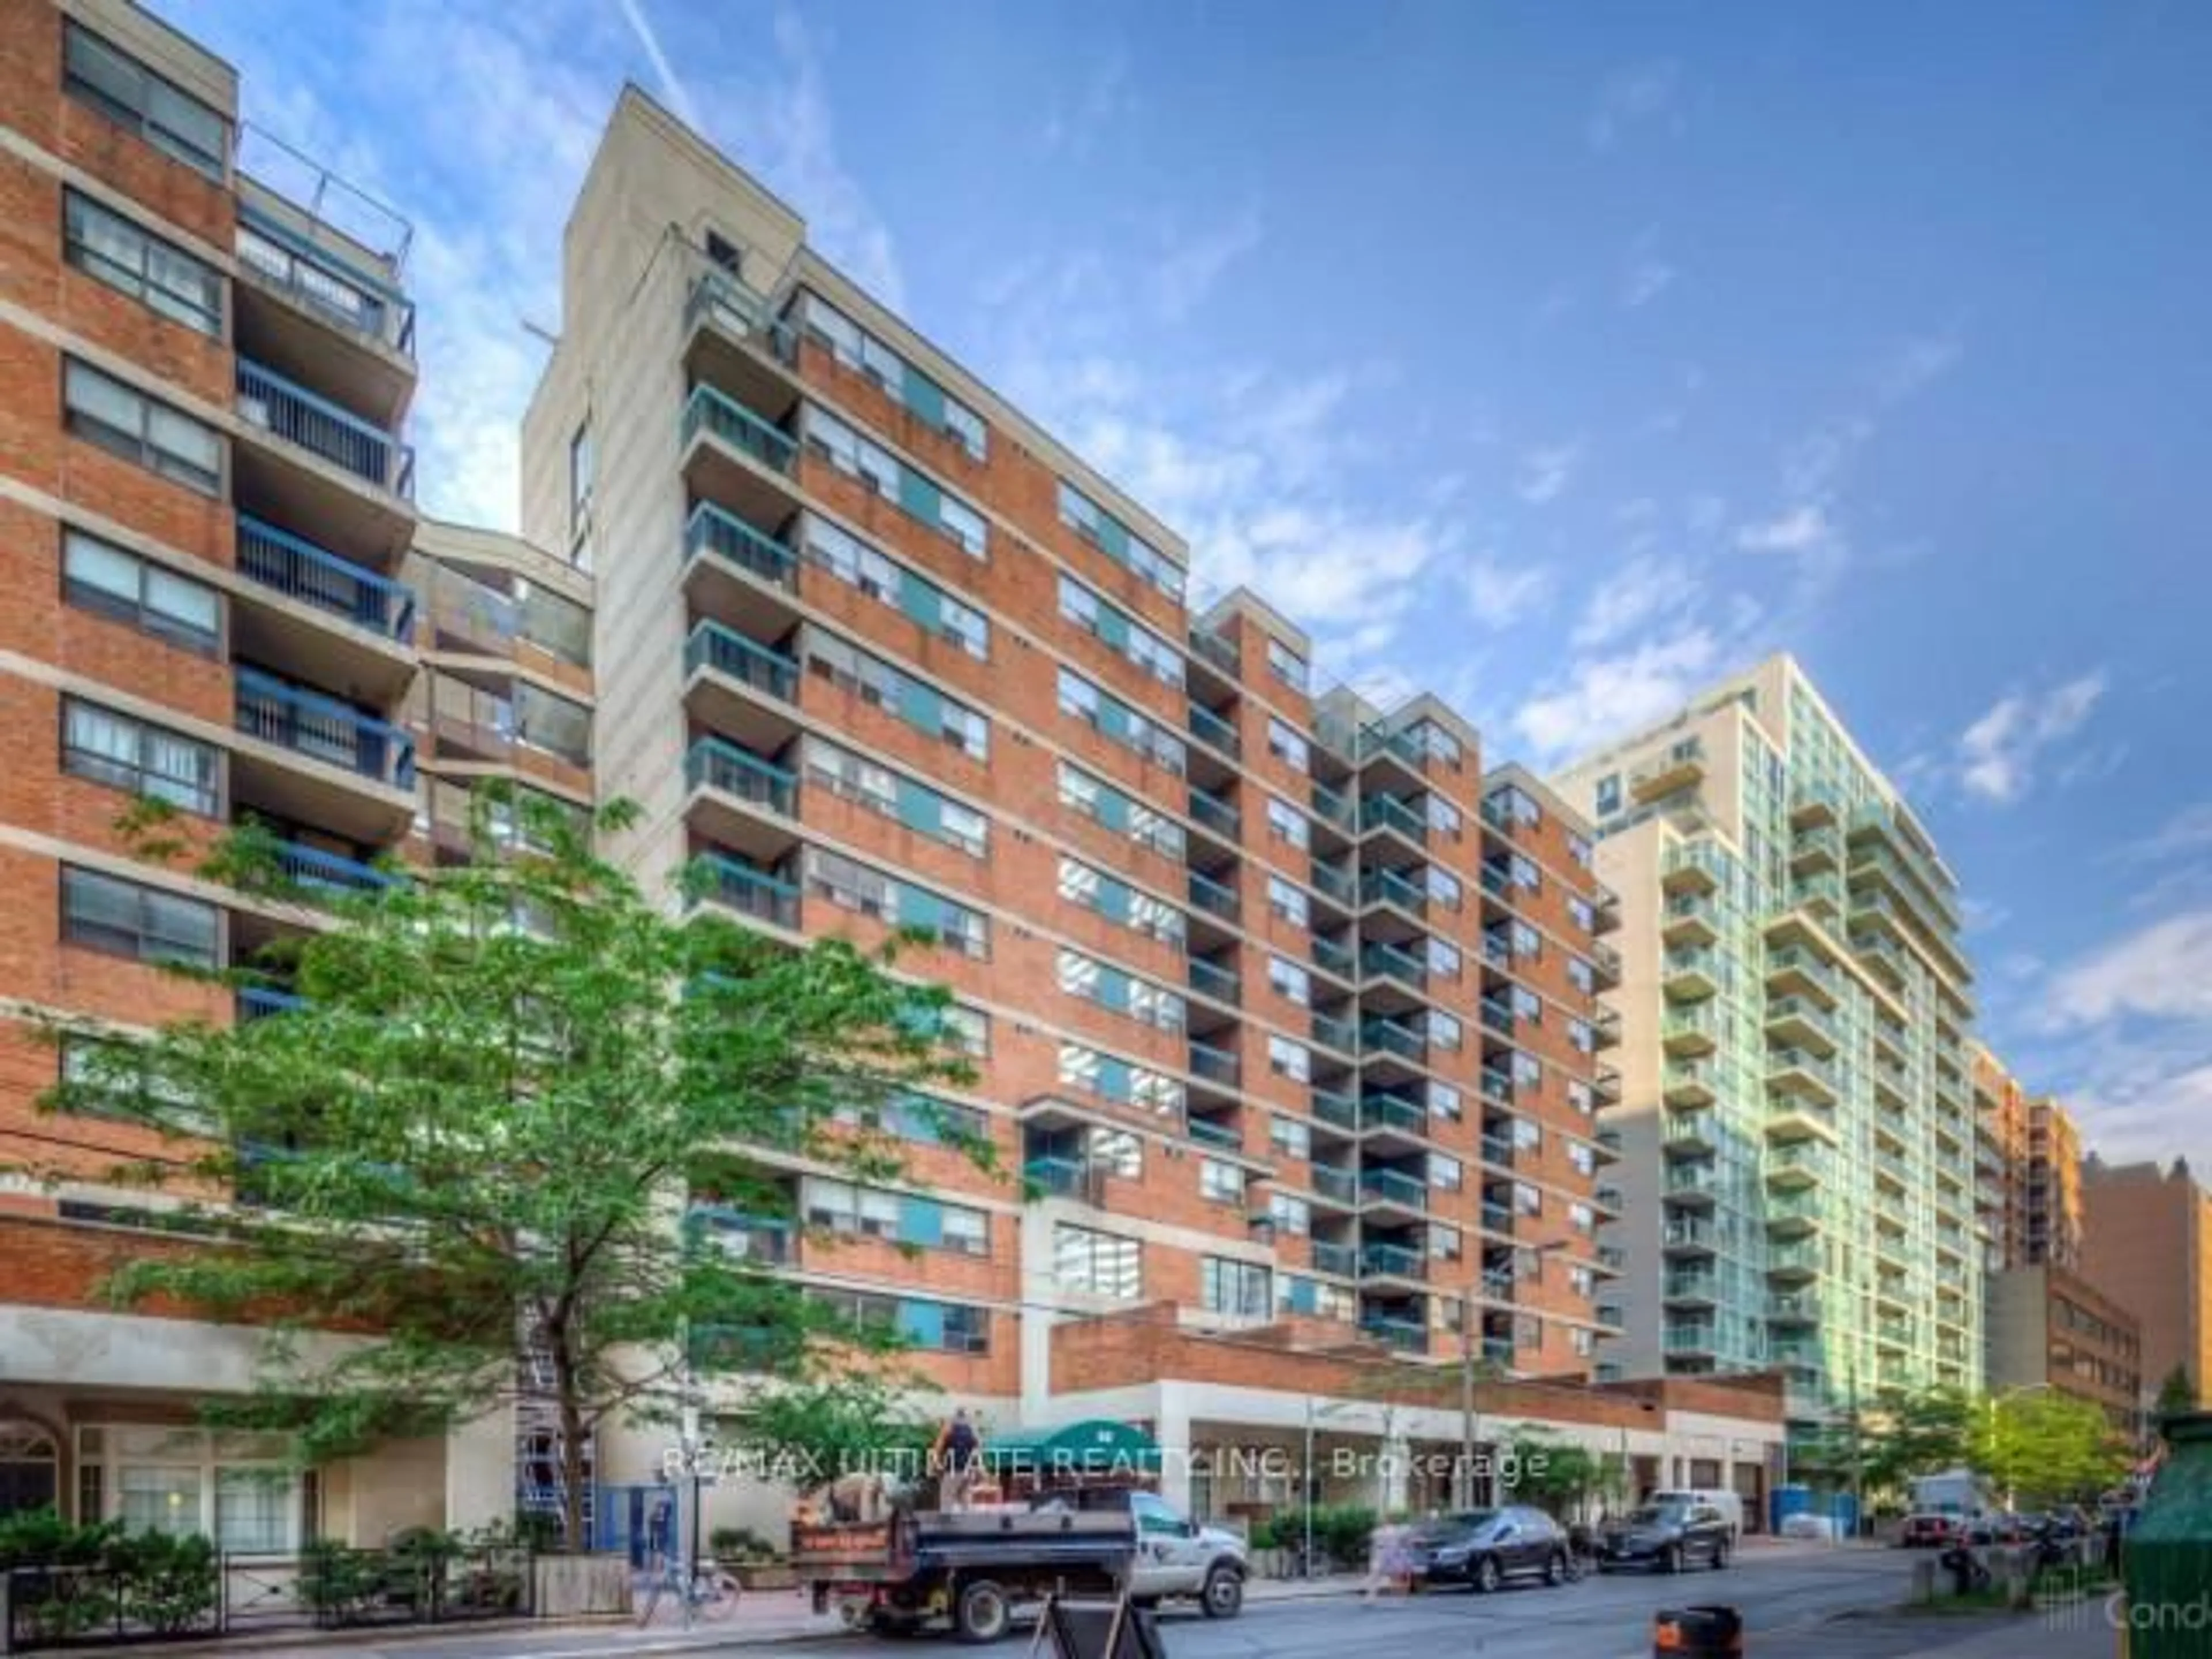
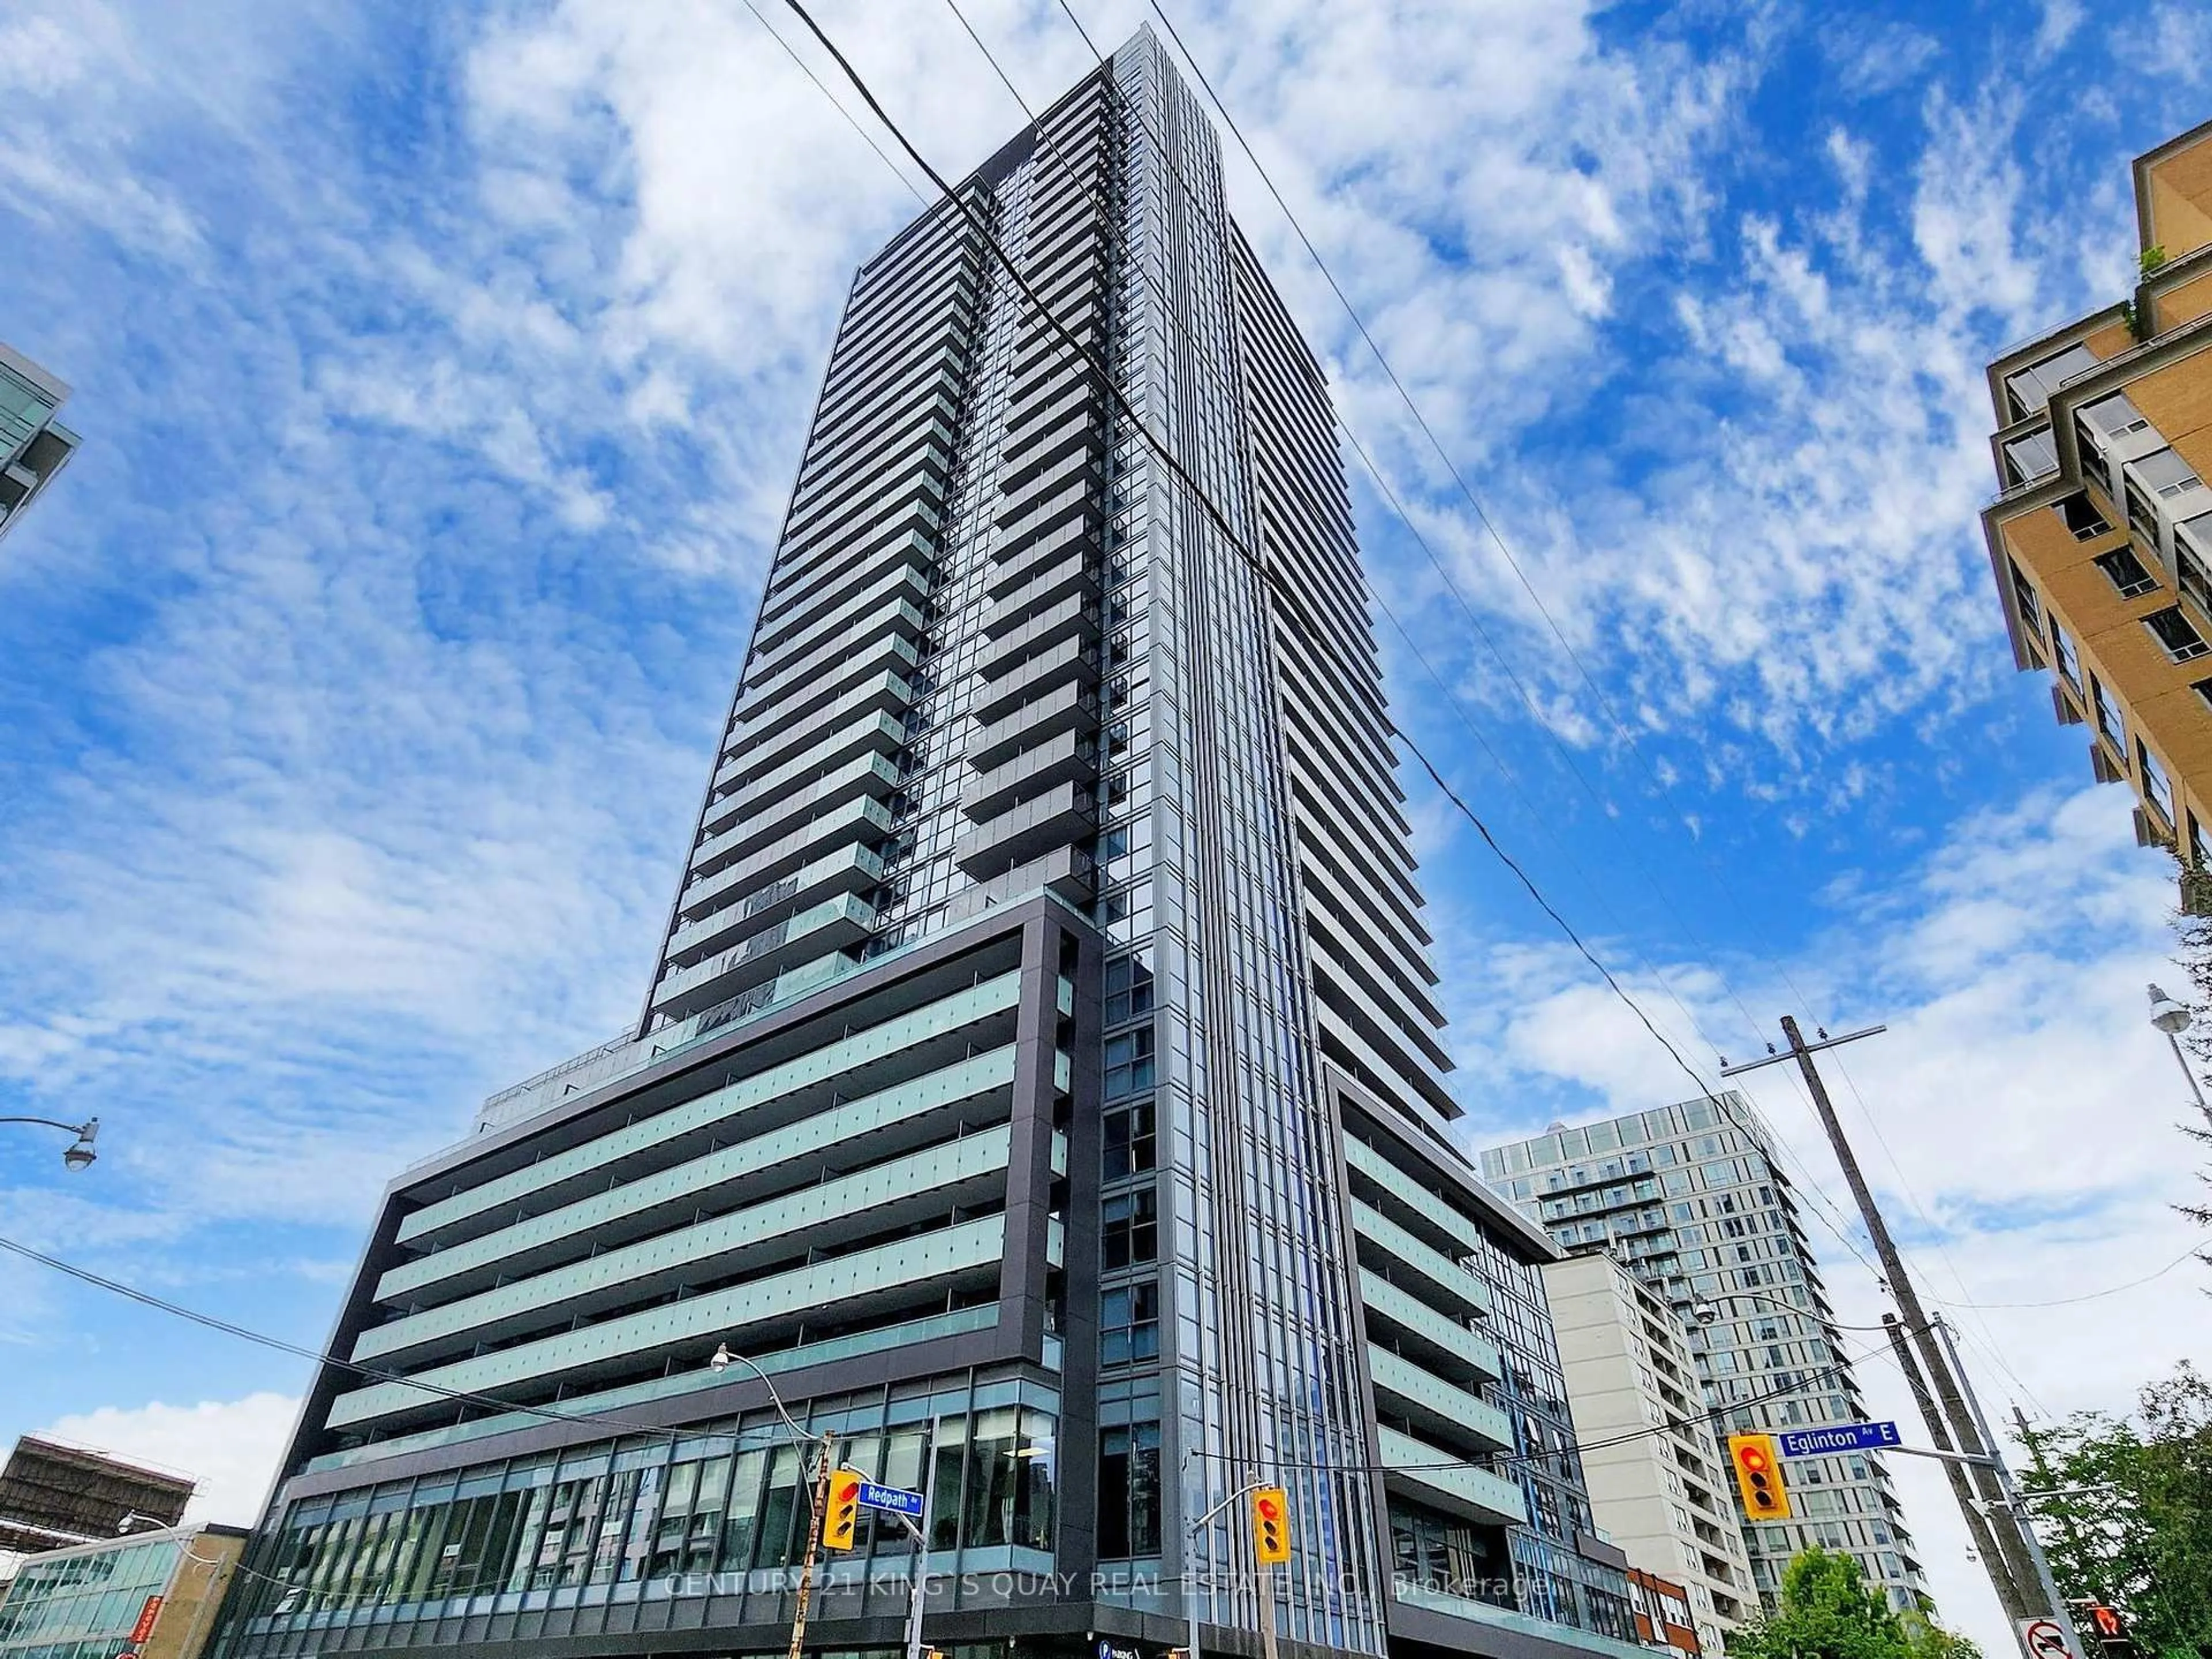
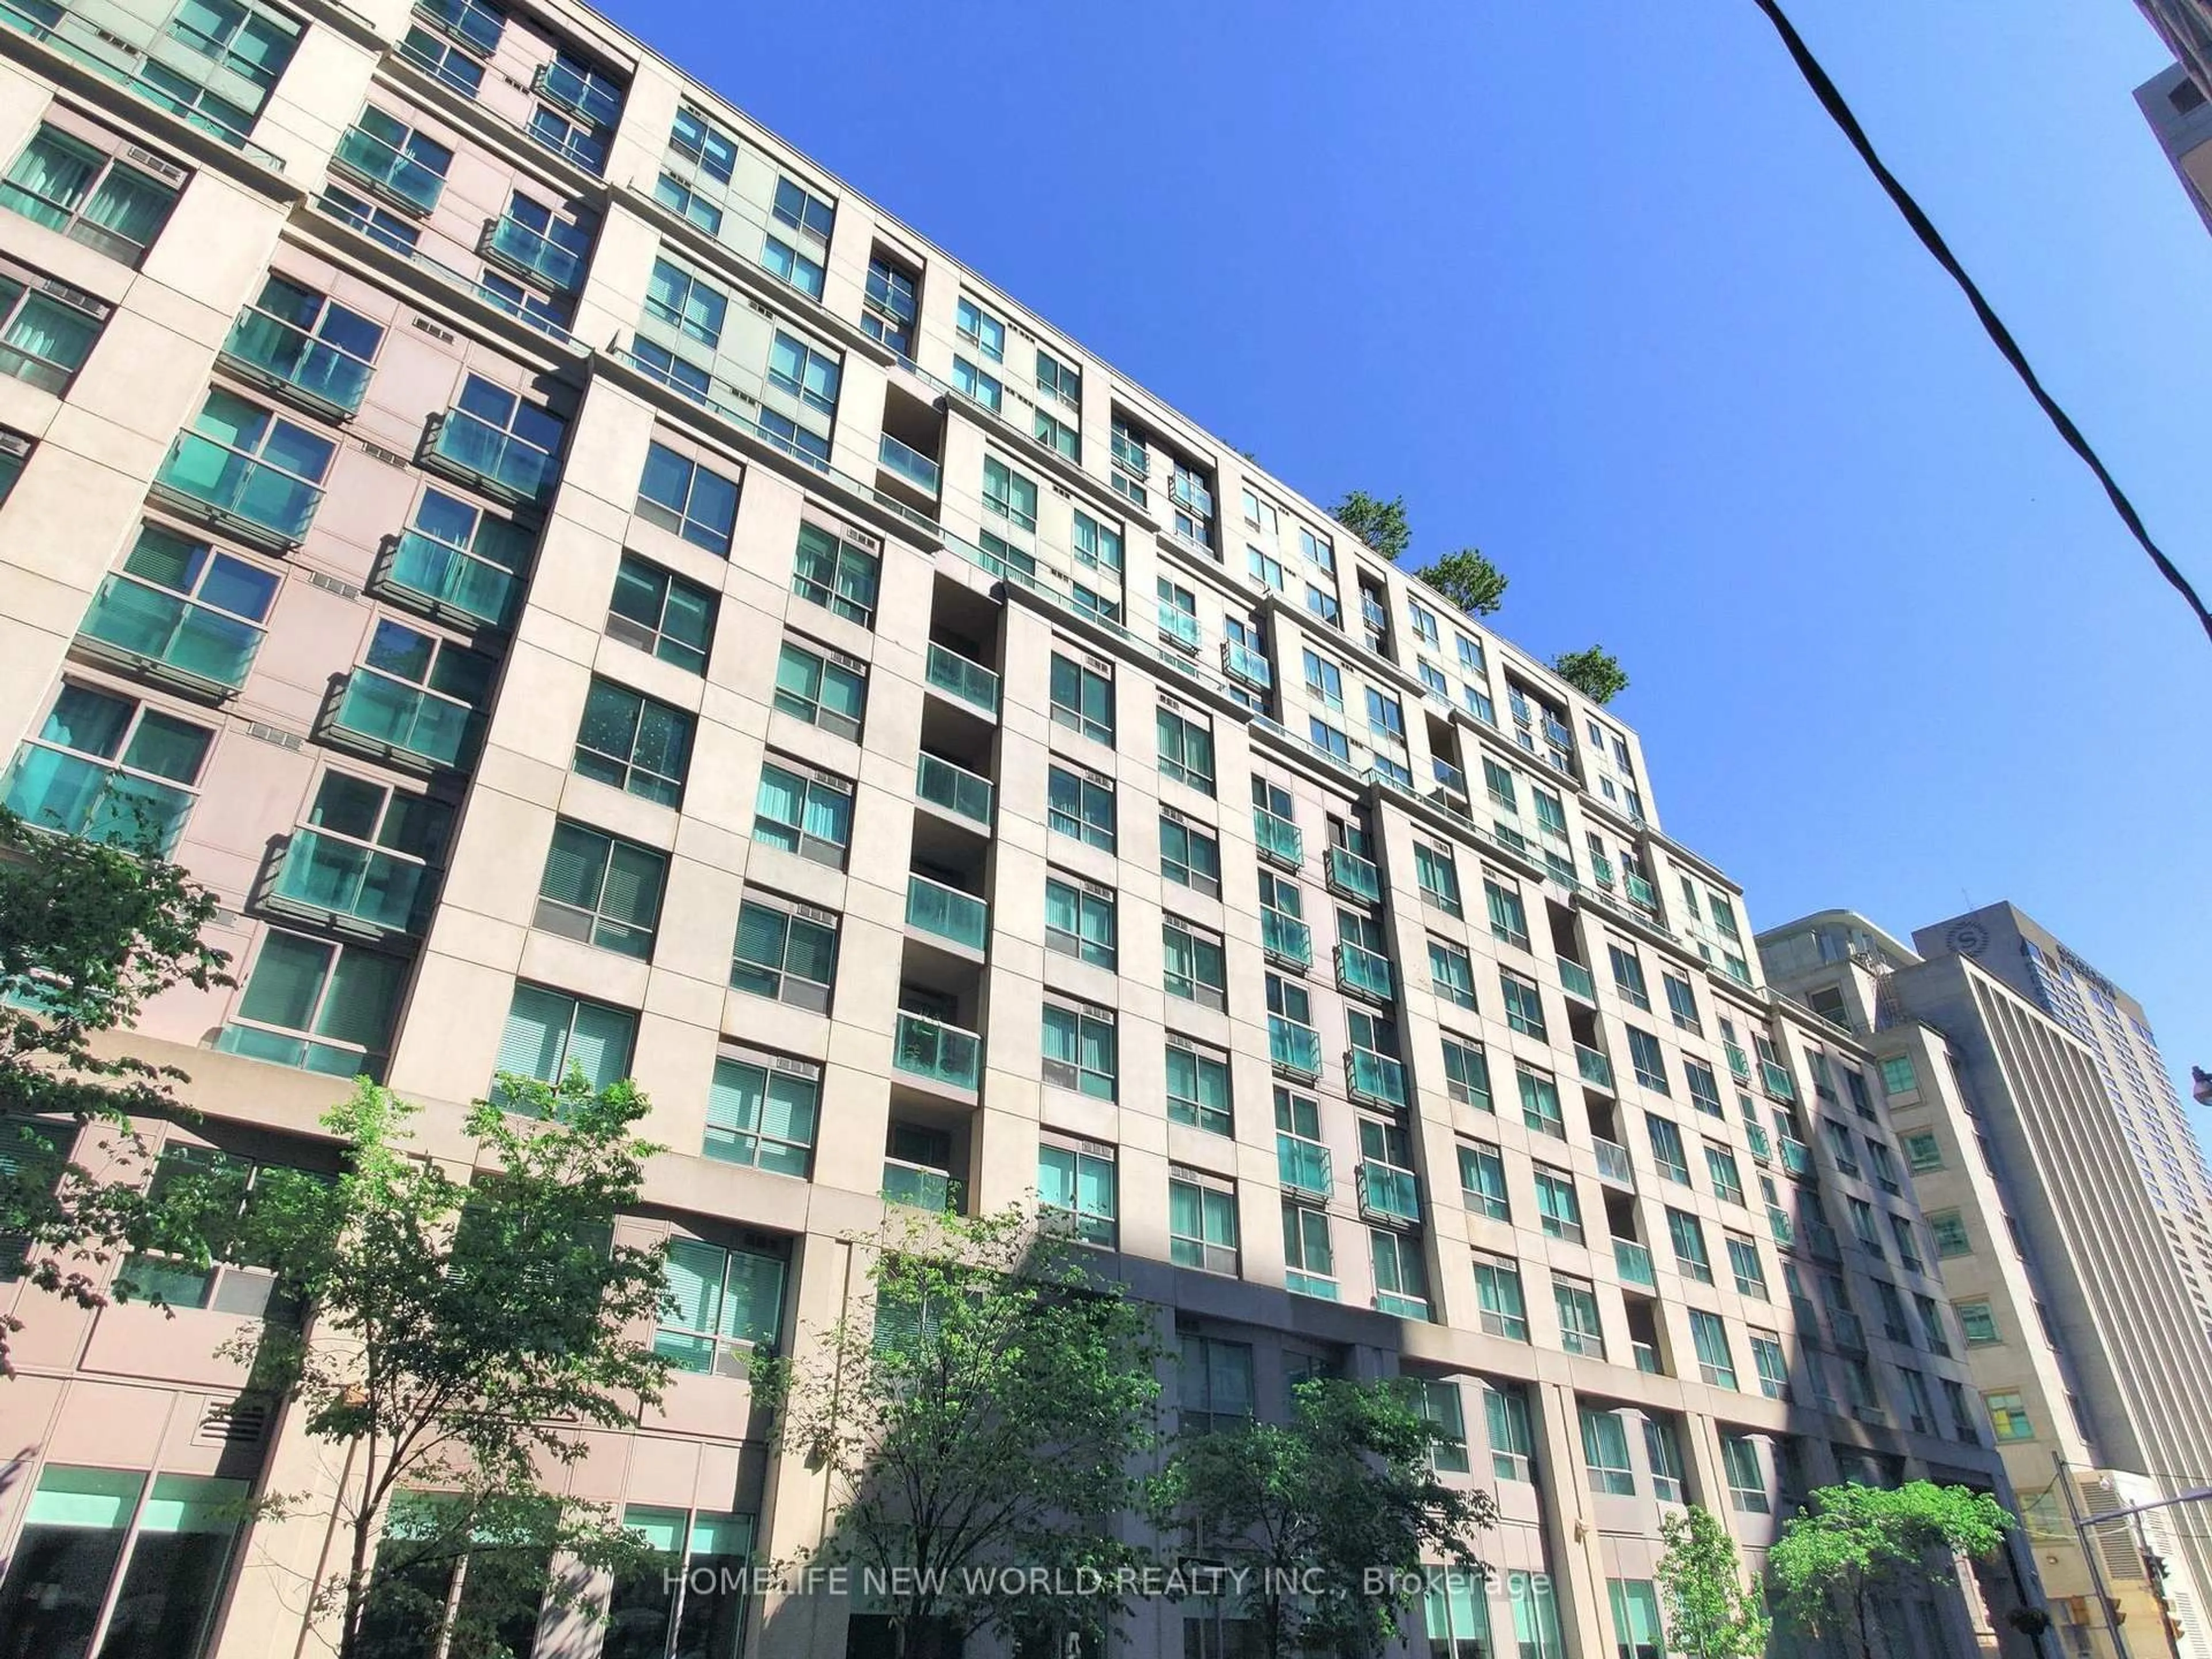
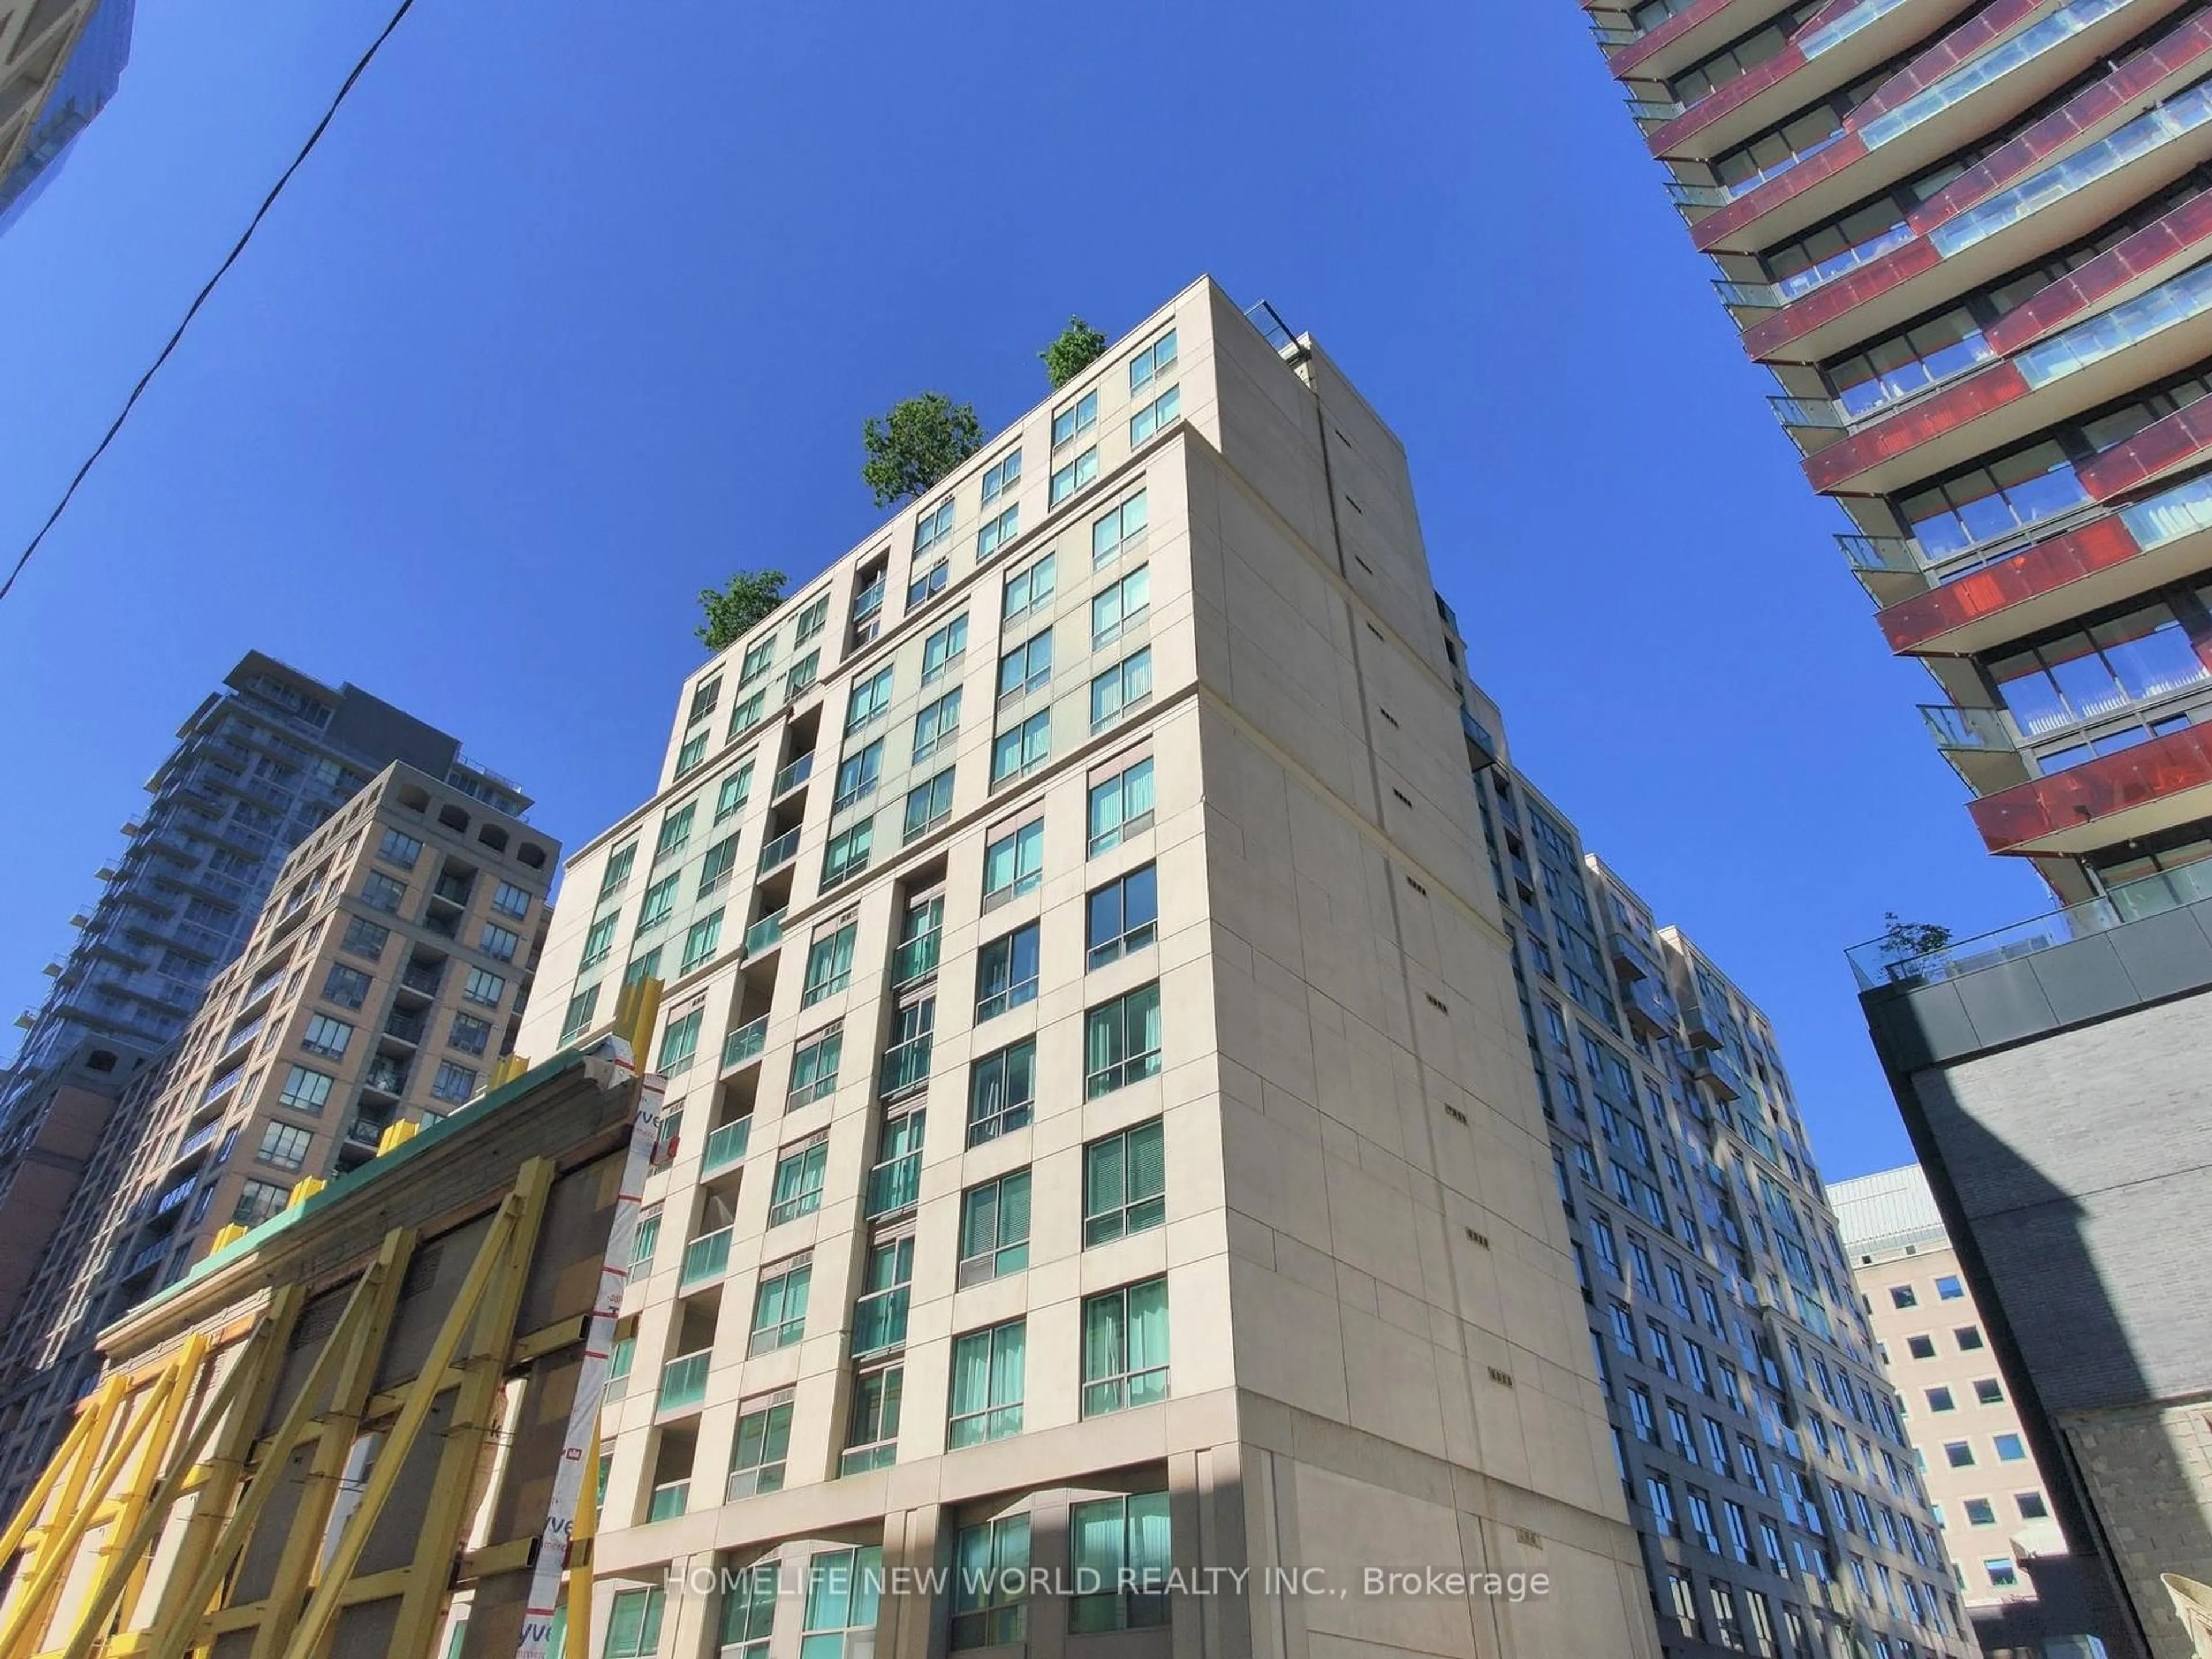
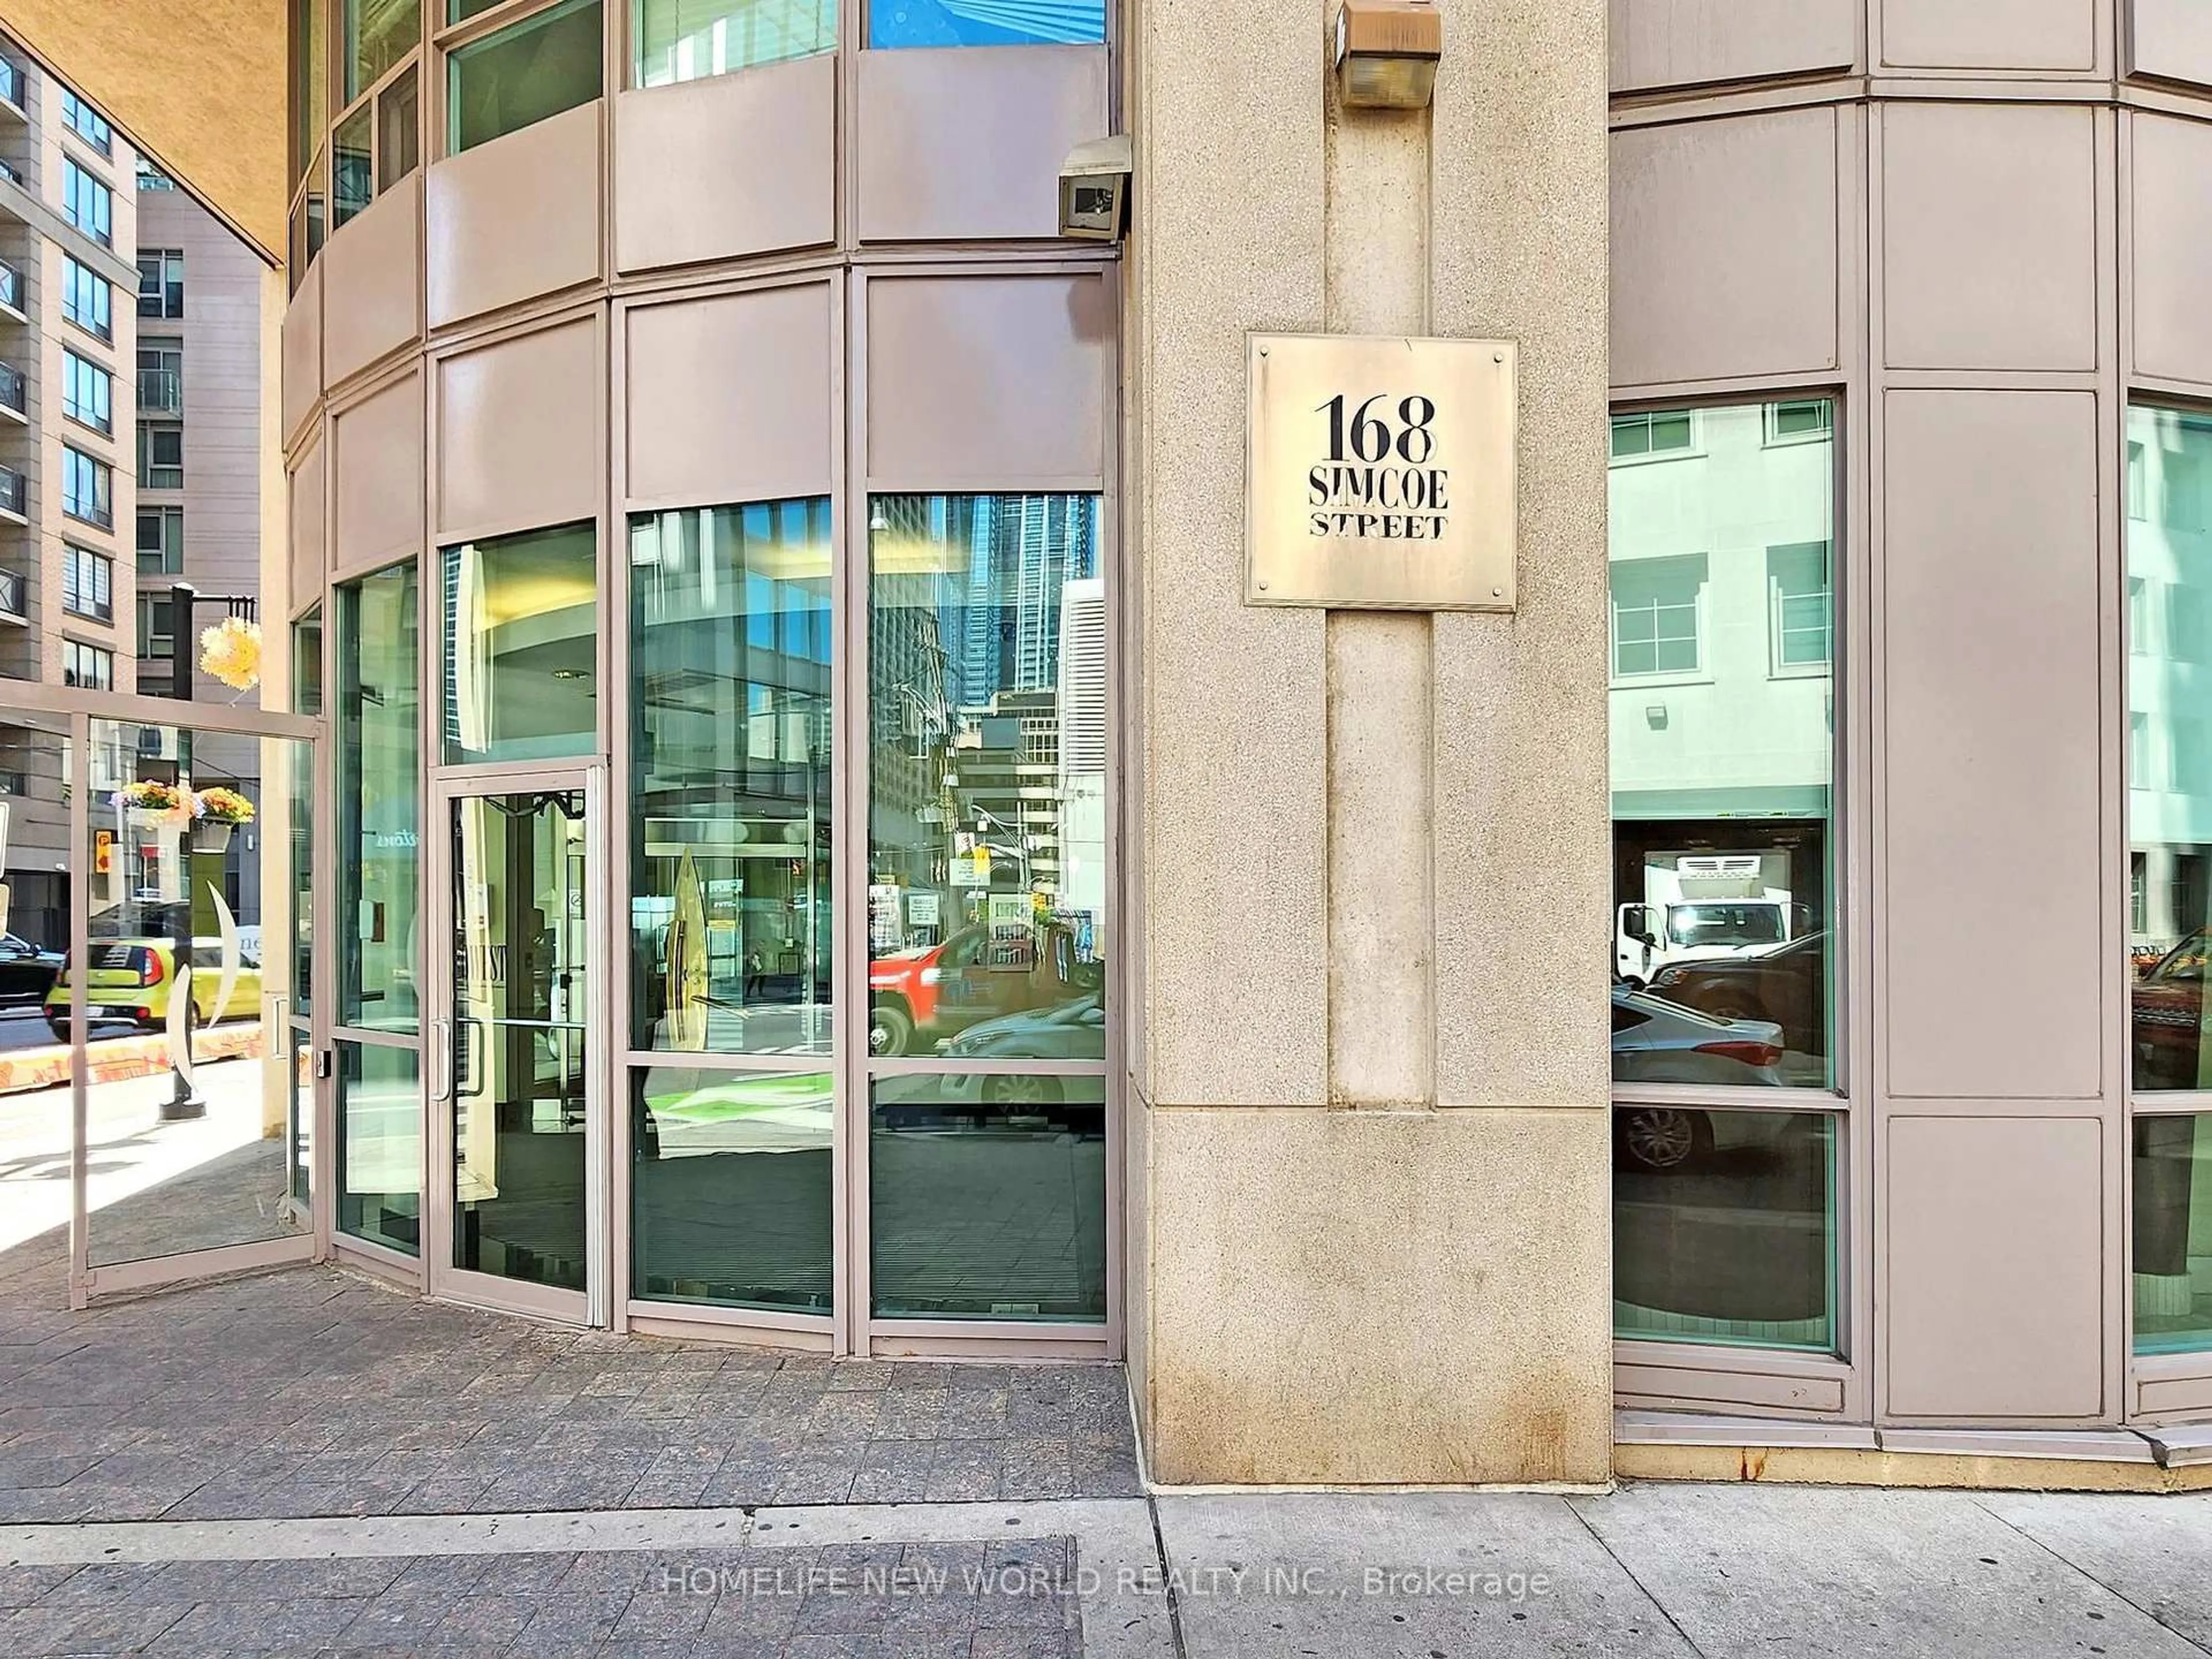
168 Simcoe St #303, Toronto, Ontario M5H 4C9

In the same building:
-
Condo
1
1
~600-699 sqft
$583,000
Get pre-qualifiedPowered by nesto
Buy with Wahi to get
Up to
$5,830Cashback
Condo
1
1
~600-699 sqft

Contact us about this property

Call

Highlights

Property Estimate

Estimated valueNot available

Price/Sqft$903/sqft

Monthly cost

Open Calculator

CMA Subject Property

Curious about what homes are selling for in this area?

Get a report on comparable homes with helpful insights and trends.

+63

Properties sold*

$690K

Median sold price*

*Based on last 30 days

Description

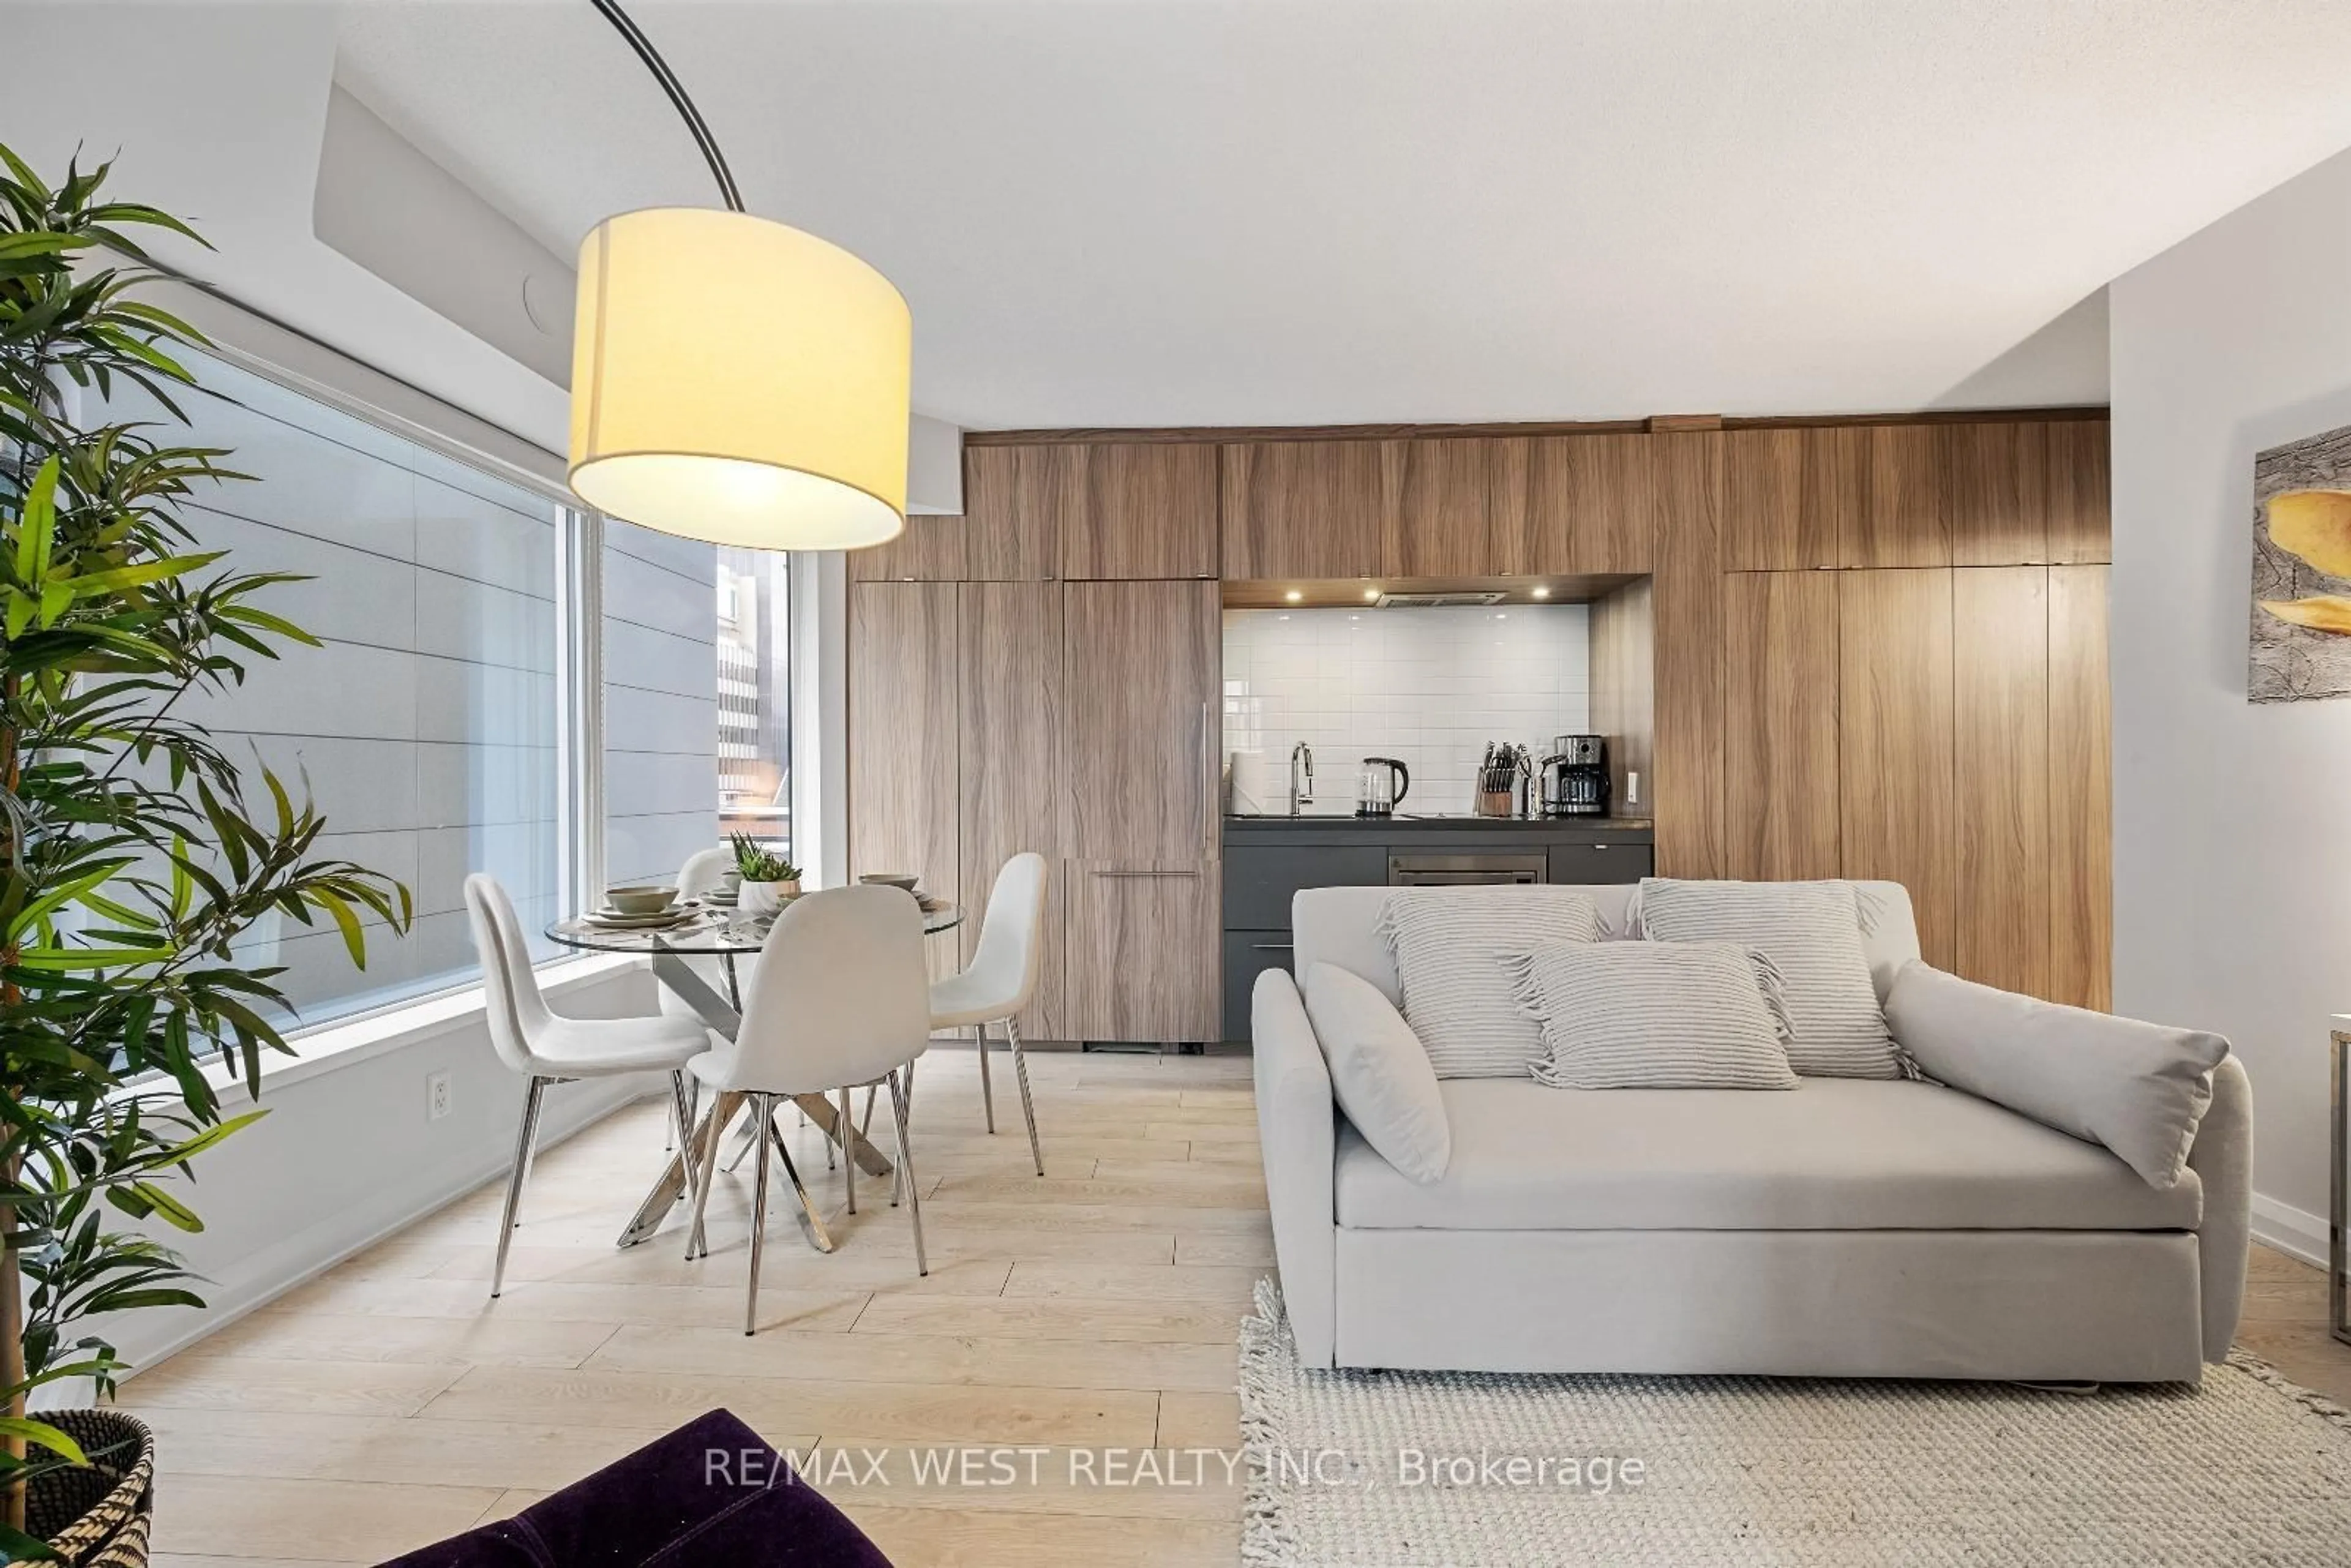
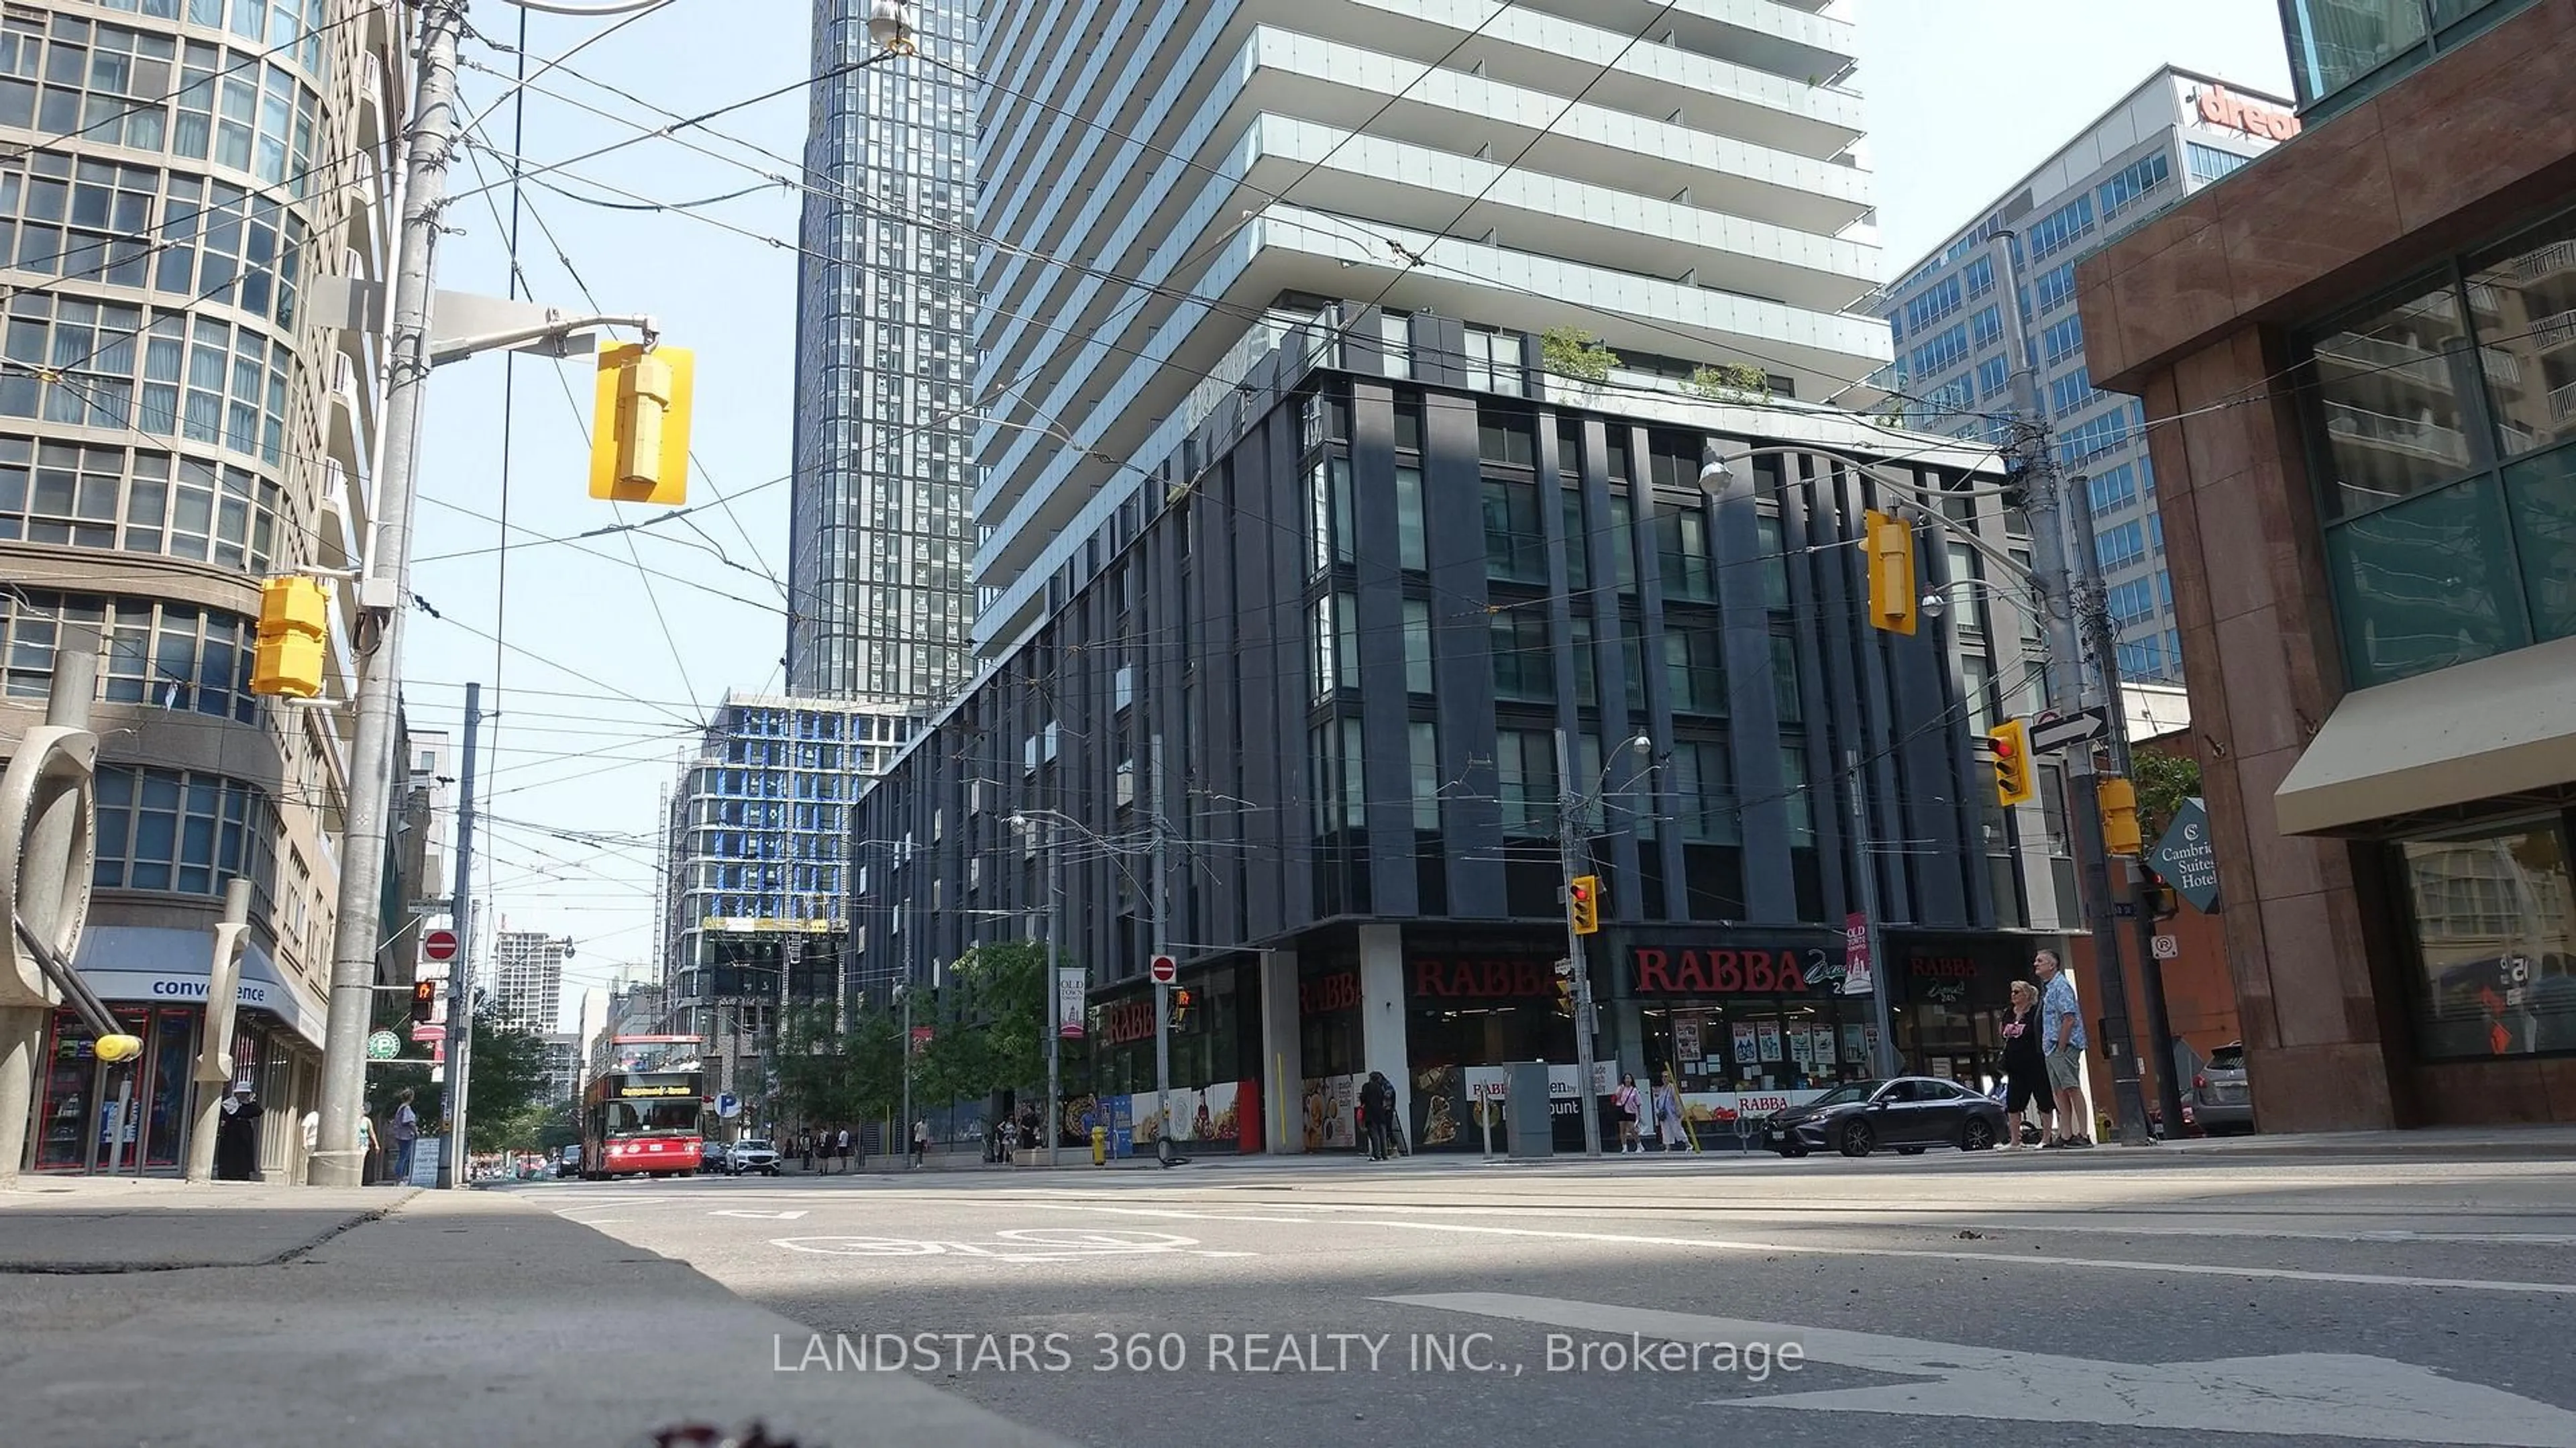
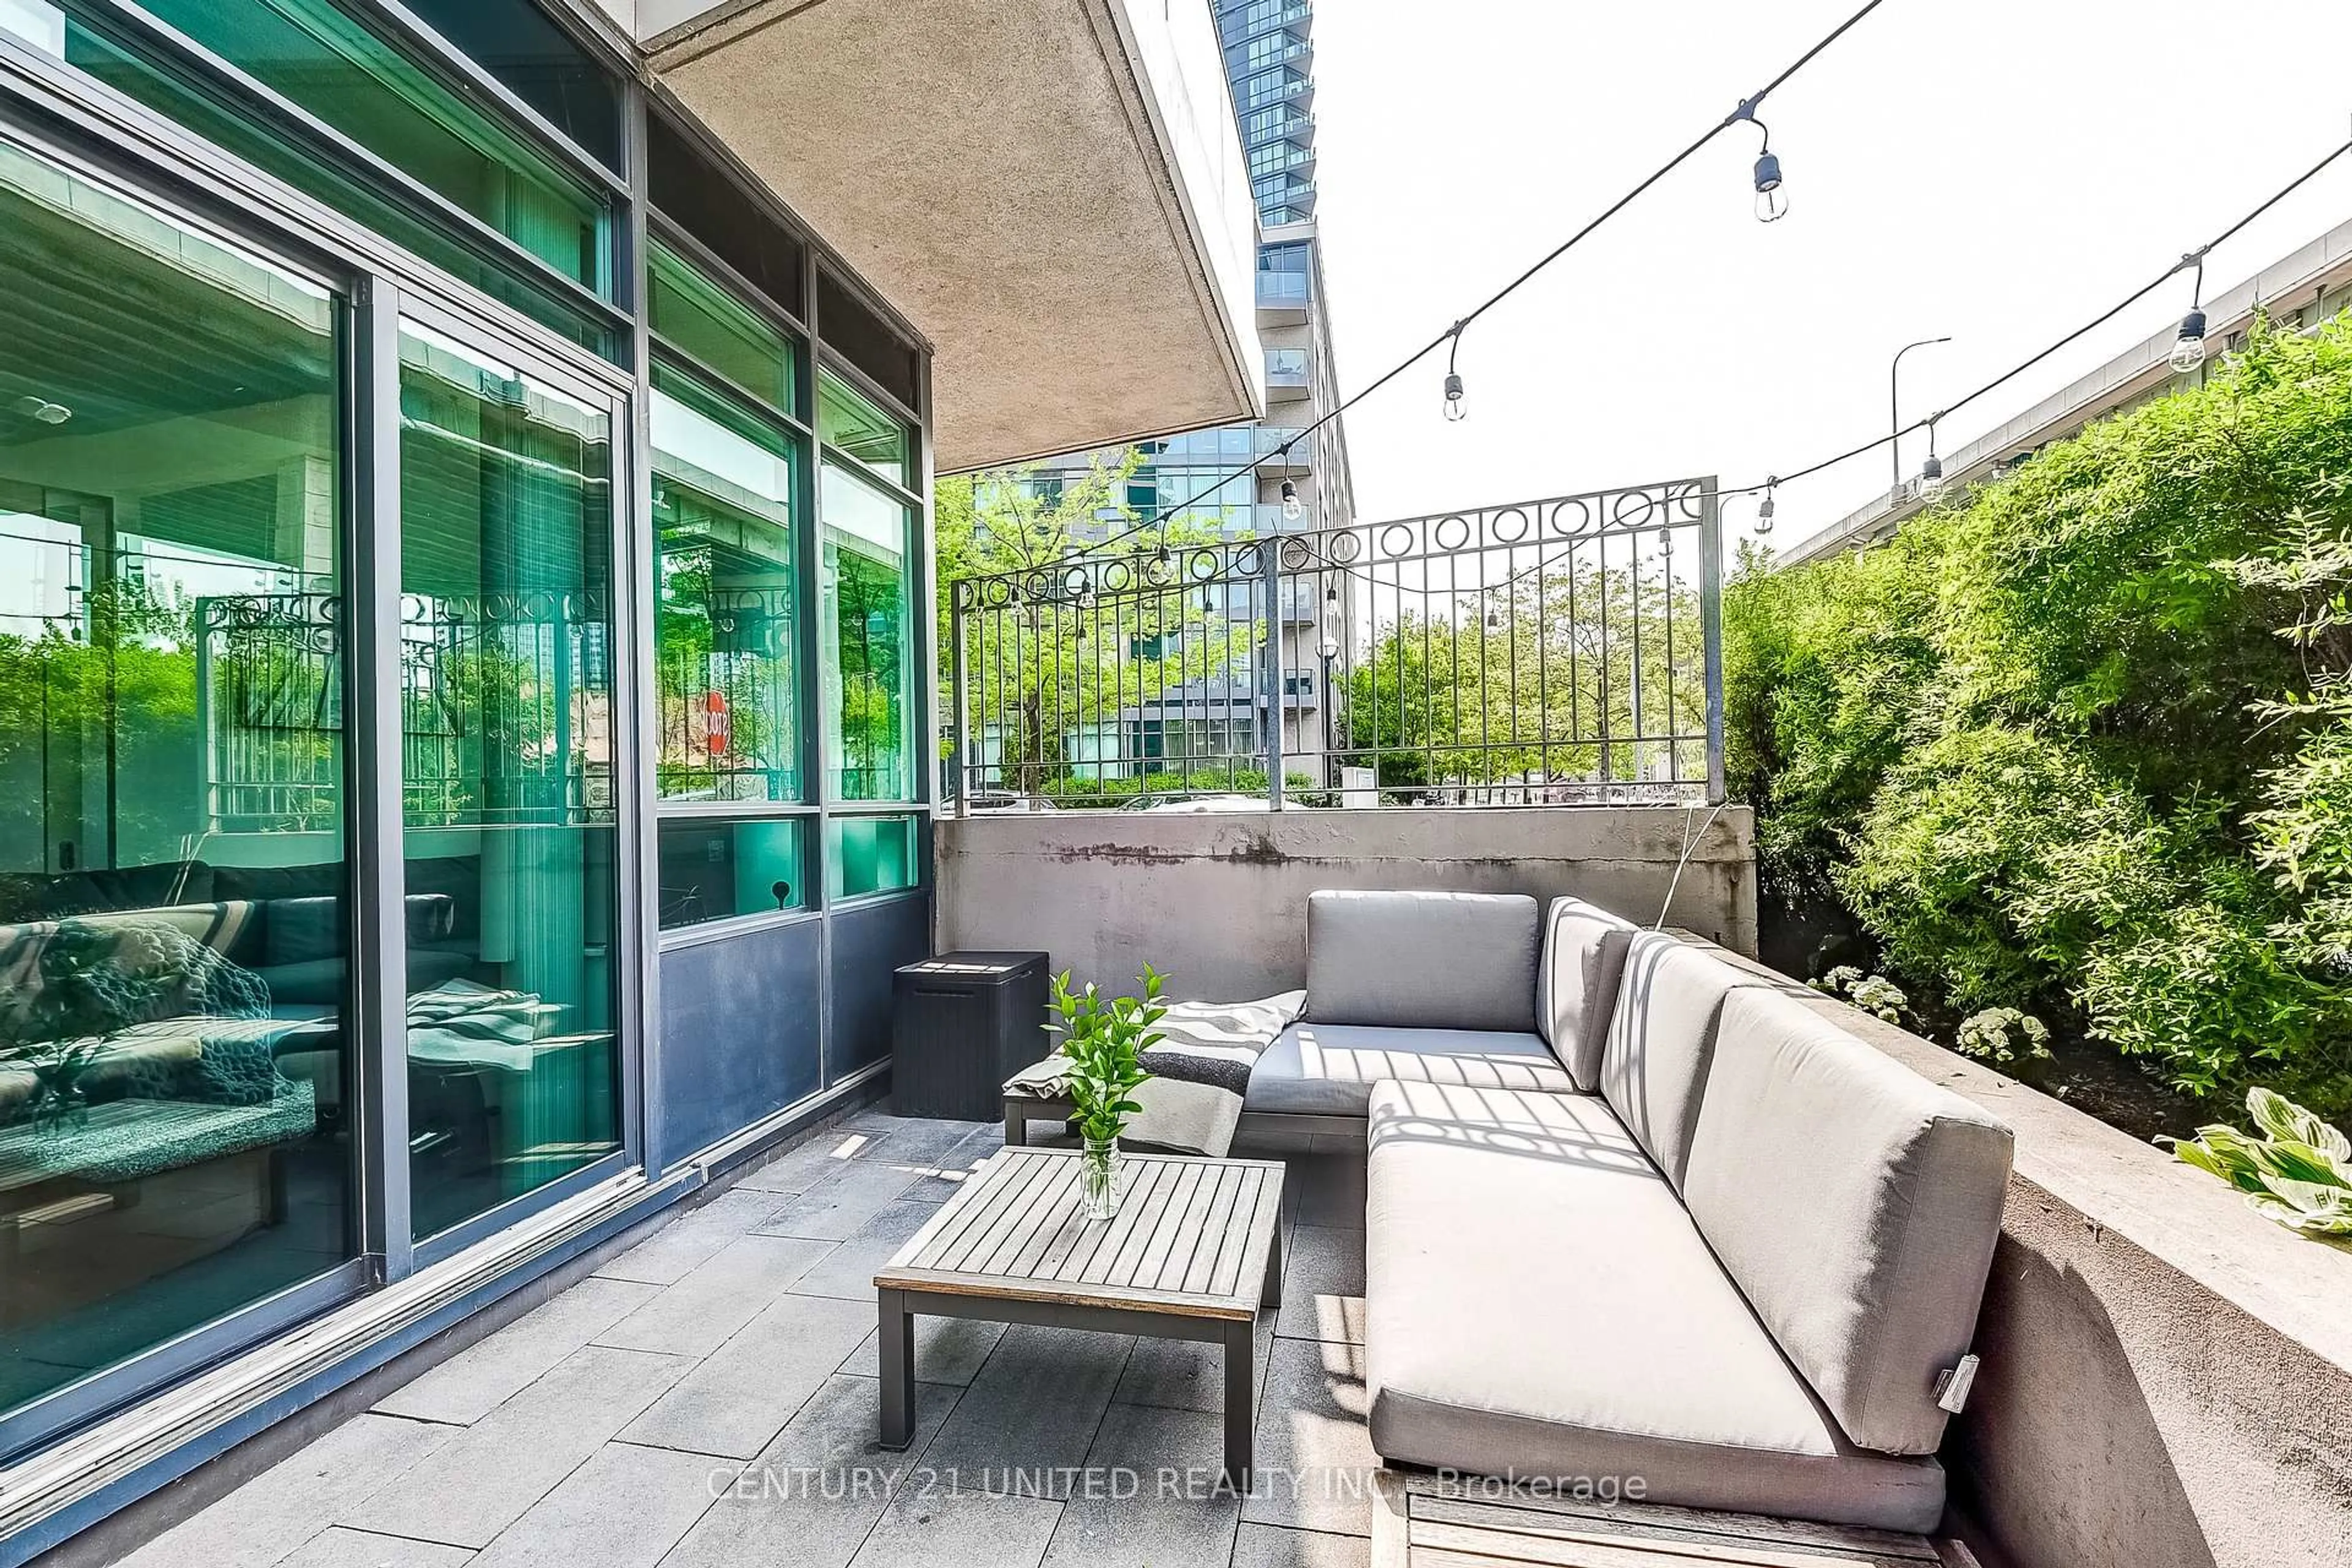
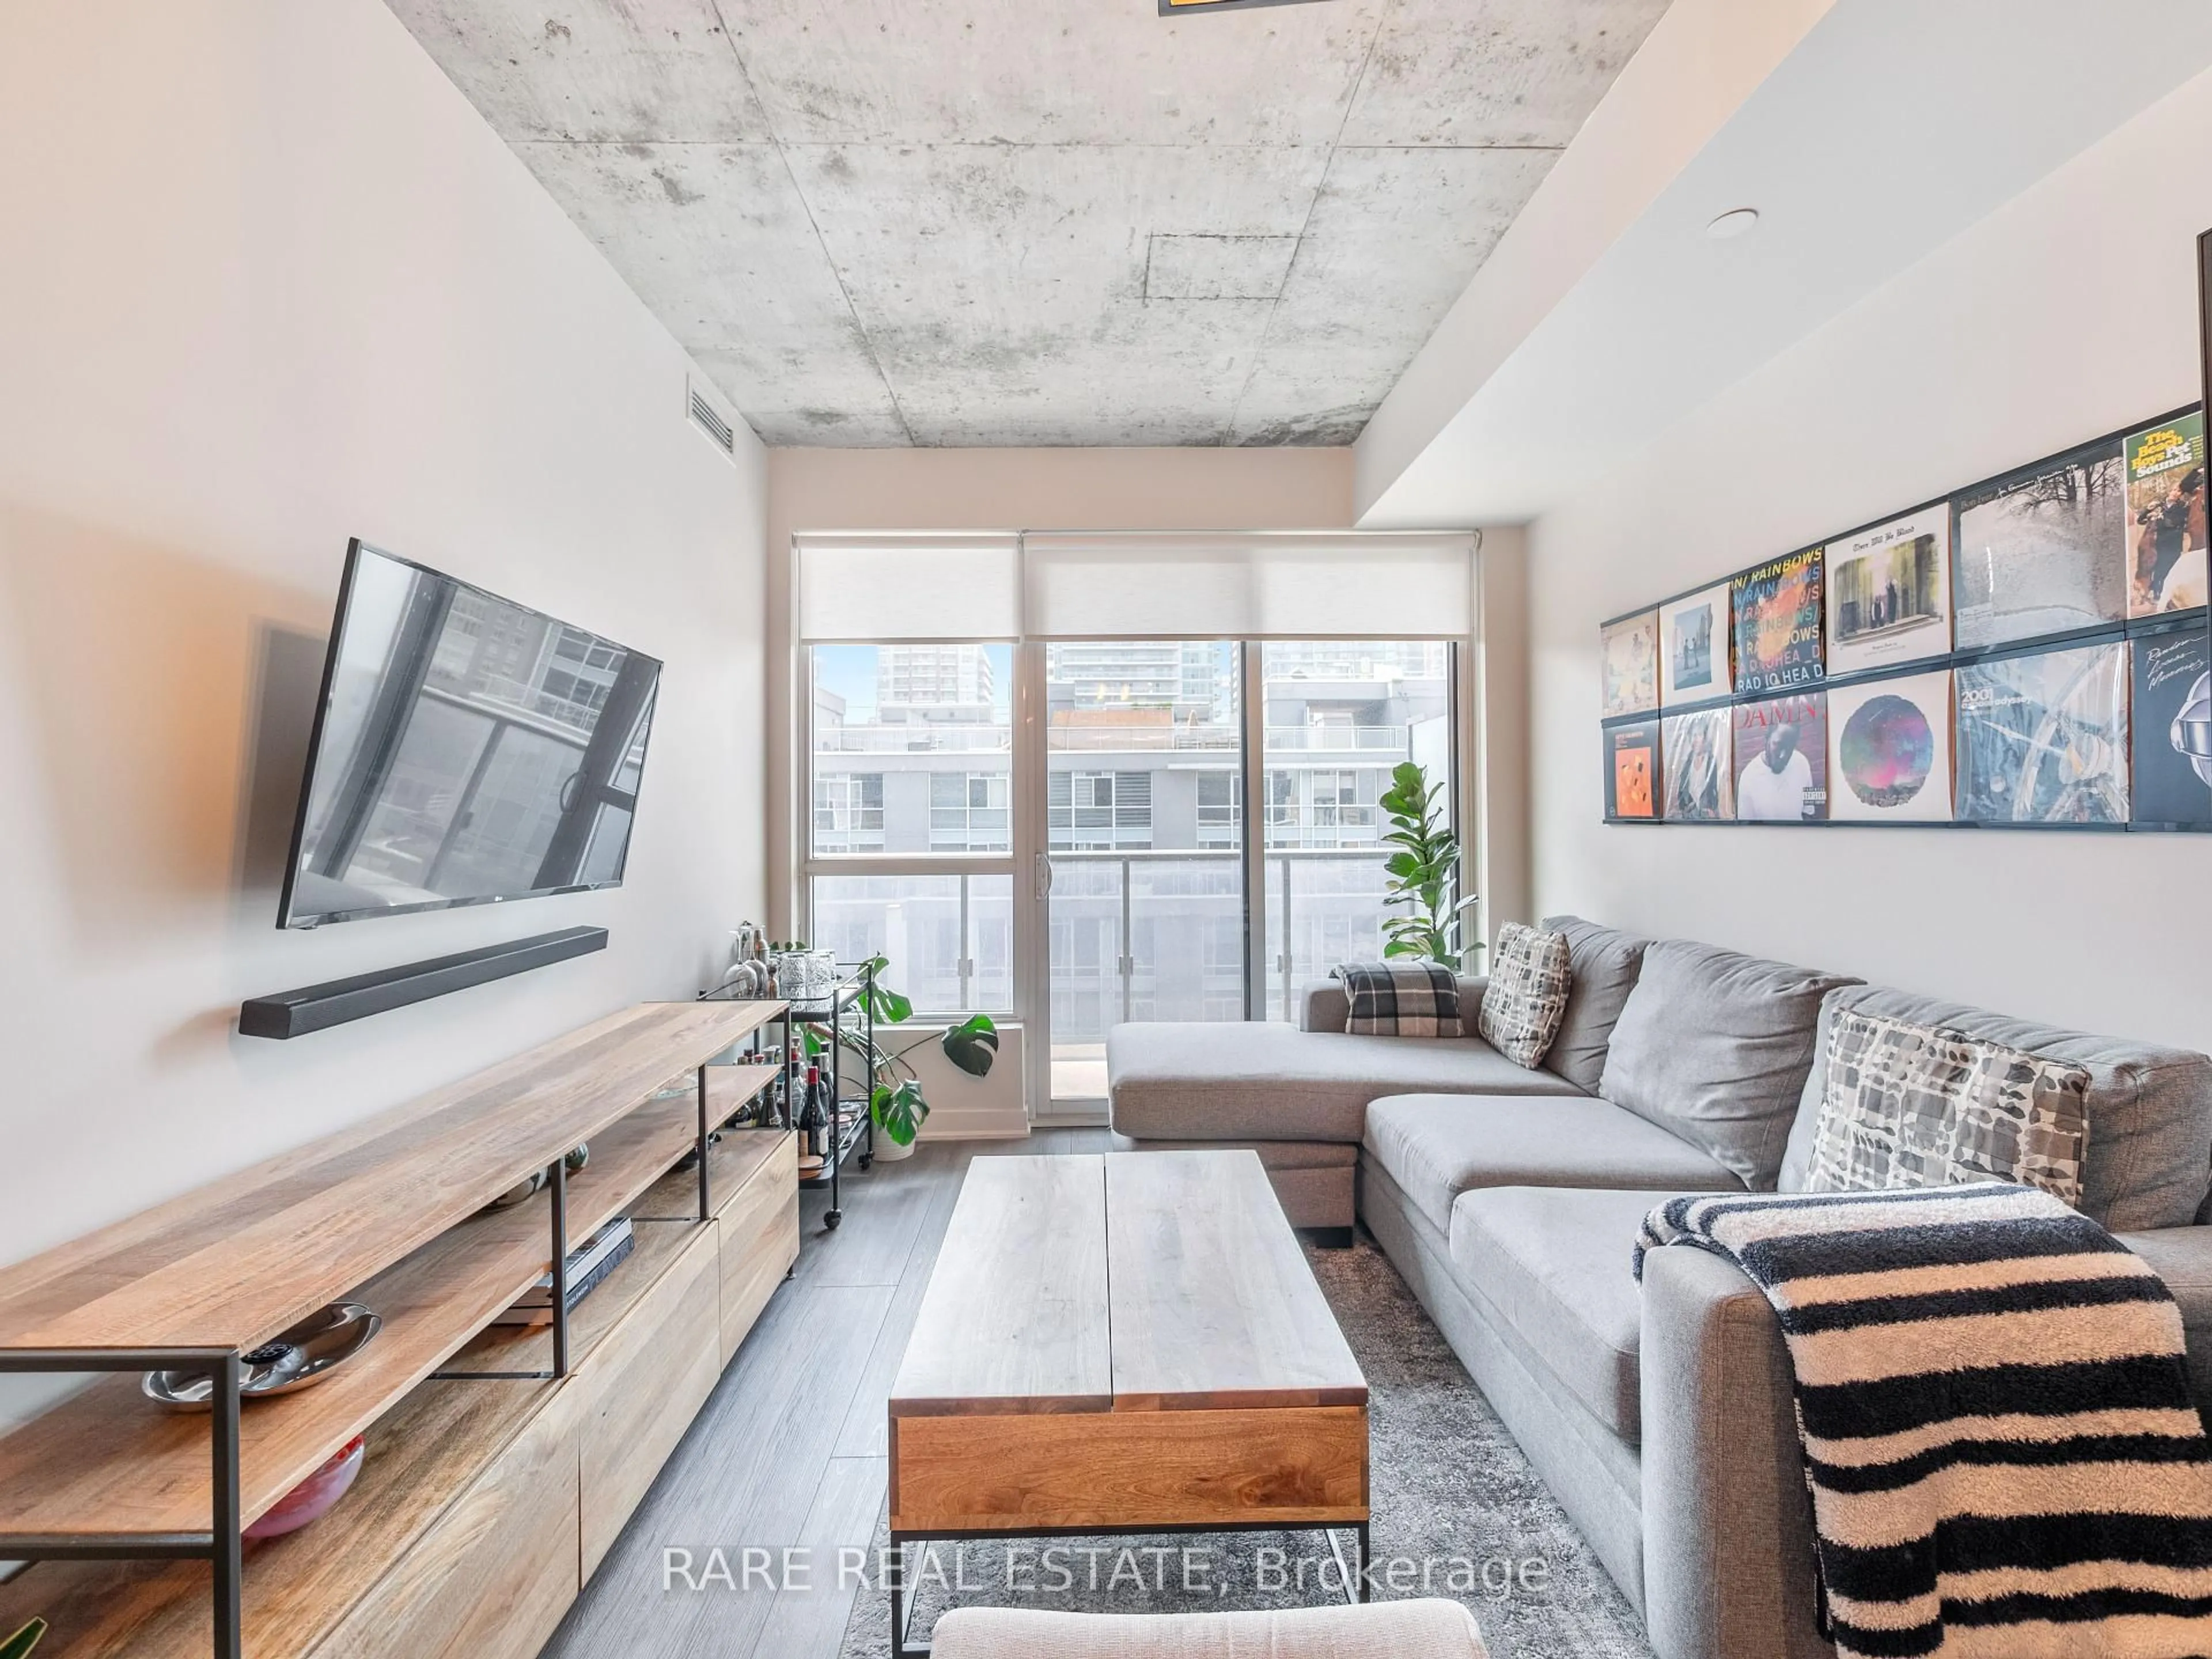
Quality Tridel Built 'Qwest' Condo Located In University & Richmond Downtown Core Area; Functional, Spacious Layout, Updated Appliances, Paint All Throughout (2023); Immaculate Lobby W/24Hr. Concierge, Excellent Transit Options. Roof Top Terrace W/Bbq, Party Rm. East Facing-Very Quiet. Dining Room Can Be Used As Den Or Office; Easy Access To Subway, Shopping, Dining, Theatre, Music, Financial District, Universities, Expressway...


Property Details

StyleApartment
View-
Age of property-
SqFt~600-699 SqFt
Lot Size-
Parking Spaces-
MLS ®NumberC12348186
Community NameEntertainment District
Data SourceTRREB
Listing byHOMELIFE NEW WORLD REALTY INC.

Features

Heating: Forced Air
Cooling: Central Air

Flat Floor

Living

5.64 x 3.05

Laminate / Combined W/Dining / W/O To Balcony

Dining

3.34 x 3.84

Laminate / Combined W/Living

Kitchen

2.44 x 2.29

Ceramic Floor / Stainless Steel Appl / Modern Kitchen

Br

3.96 x 2.74

Laminate / Closet / Window


Features

Patio: Open
Balcony: Open

3Story
Amenities

Concierge, Gym, Party/Meeting Room, Recreation Room, Rooftop Deck/Garden

Inclusions
Hydro
Water
Parking
Cable
Heat

Property History

Date unavailable
ListedActive
$583,000
< 1h on market
history photo preview46
Listing by trreb®

Market Data - Entertainment District

Geo Zone Map ThumbnailEntertainment District

Strong Buyer's Market

View Market Data

Condo - for the past 30 days

Buyer's market Seller's market

Avg. Days on Market

Past 30 days

50 days

Compared to

2024

33 days

2023

22 days

2022

26 days

New Listings

Past 30 days

217 listings

Compared to

2024

276 listings

2023

197 listings

2022

166 listings

Units sold

Past 30 days

51 units

Compared to

2024

63 units

2023

74 units

2022

73 units

Median Sold Price

Past 30 days

$685,000

Compared to

2024

$690,000

2023

$790,000

2022

$750,000


Population and Demographics

Overview

Total population 32132
Average household income $172,021

Age (%)

0 to 19
7%
20 to 34
57%
35 to 49
22%
50 to 64
9%
65 and plus
5%

Household composition (%)

Single person
57%
Single family
32%
Multi person
11%
Multi family
0%

Mother tongue (%)

English
63%
Mandarin
10%
Yue (Cantonese)
4%
Spanish
3%
French
3%
Russian
2%
Arabic
2%
Hindi
2%
Korean
1%
Iranian Persian
1%
Others
1%

House tenancy (%)

Renters
61%
Owners
39%

What’s nearby?Essentials within 5 km

Local Logic

Transportation Scores

Estimated Budget