6 days on Market

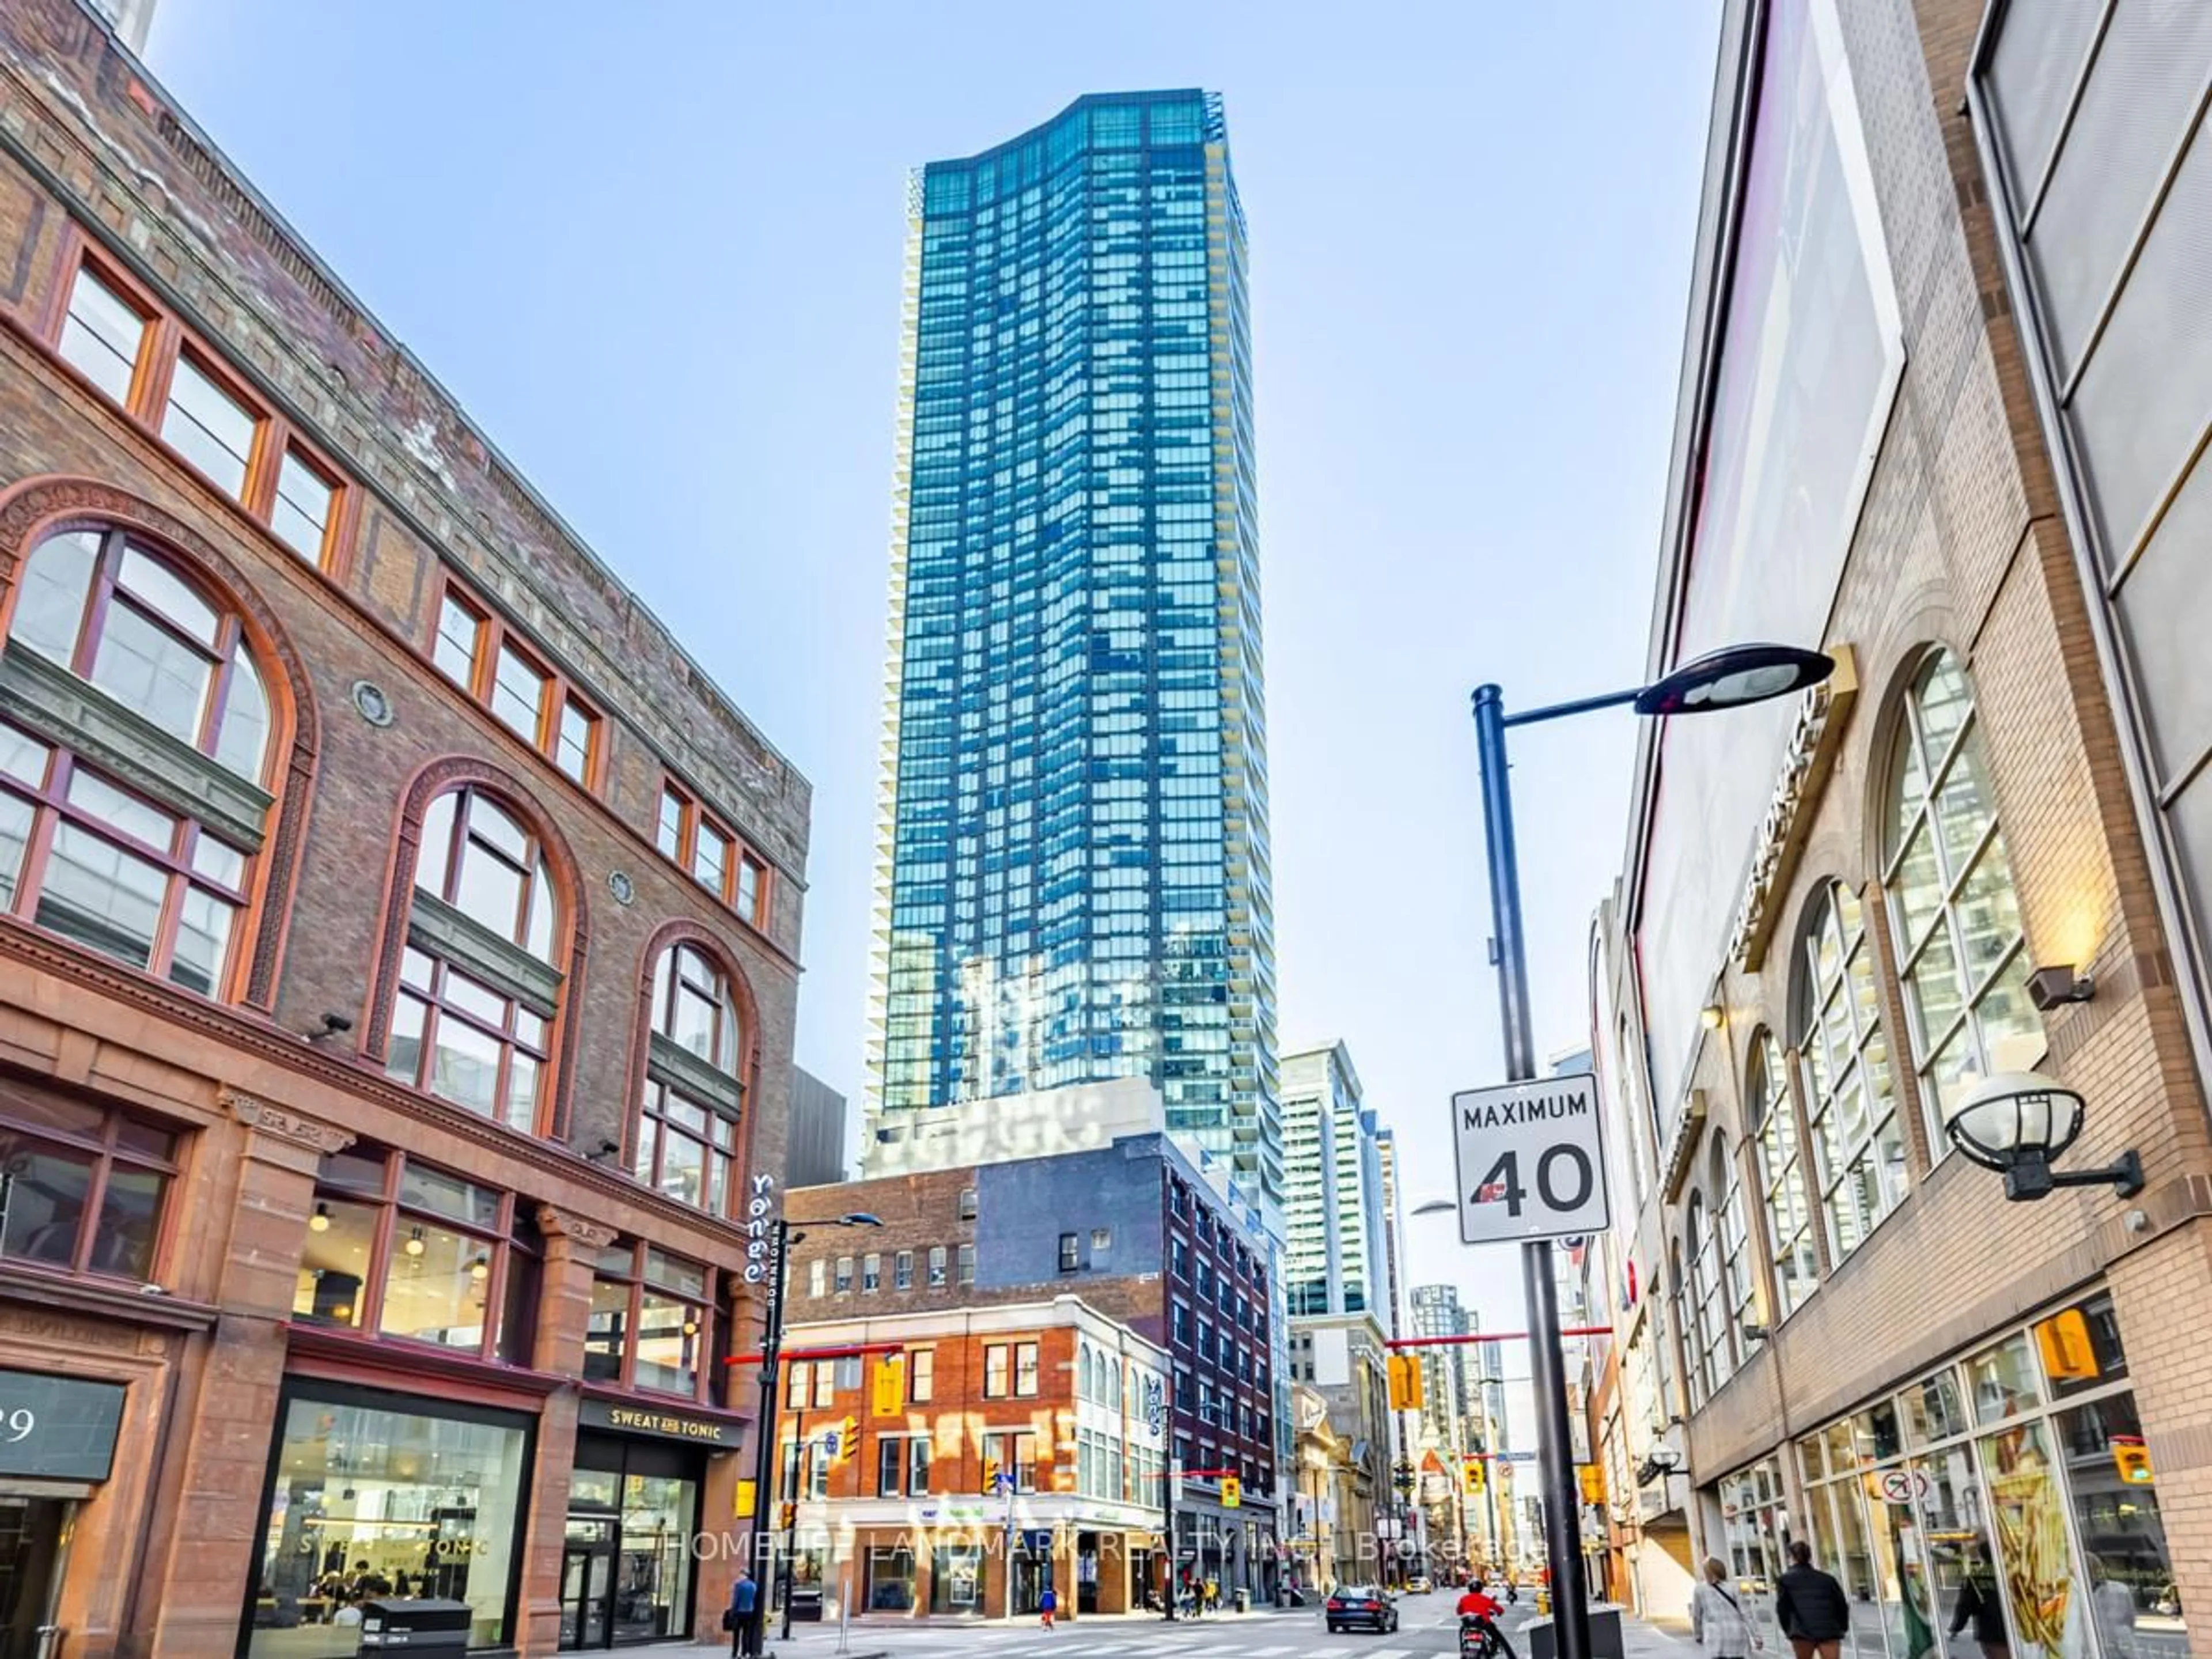
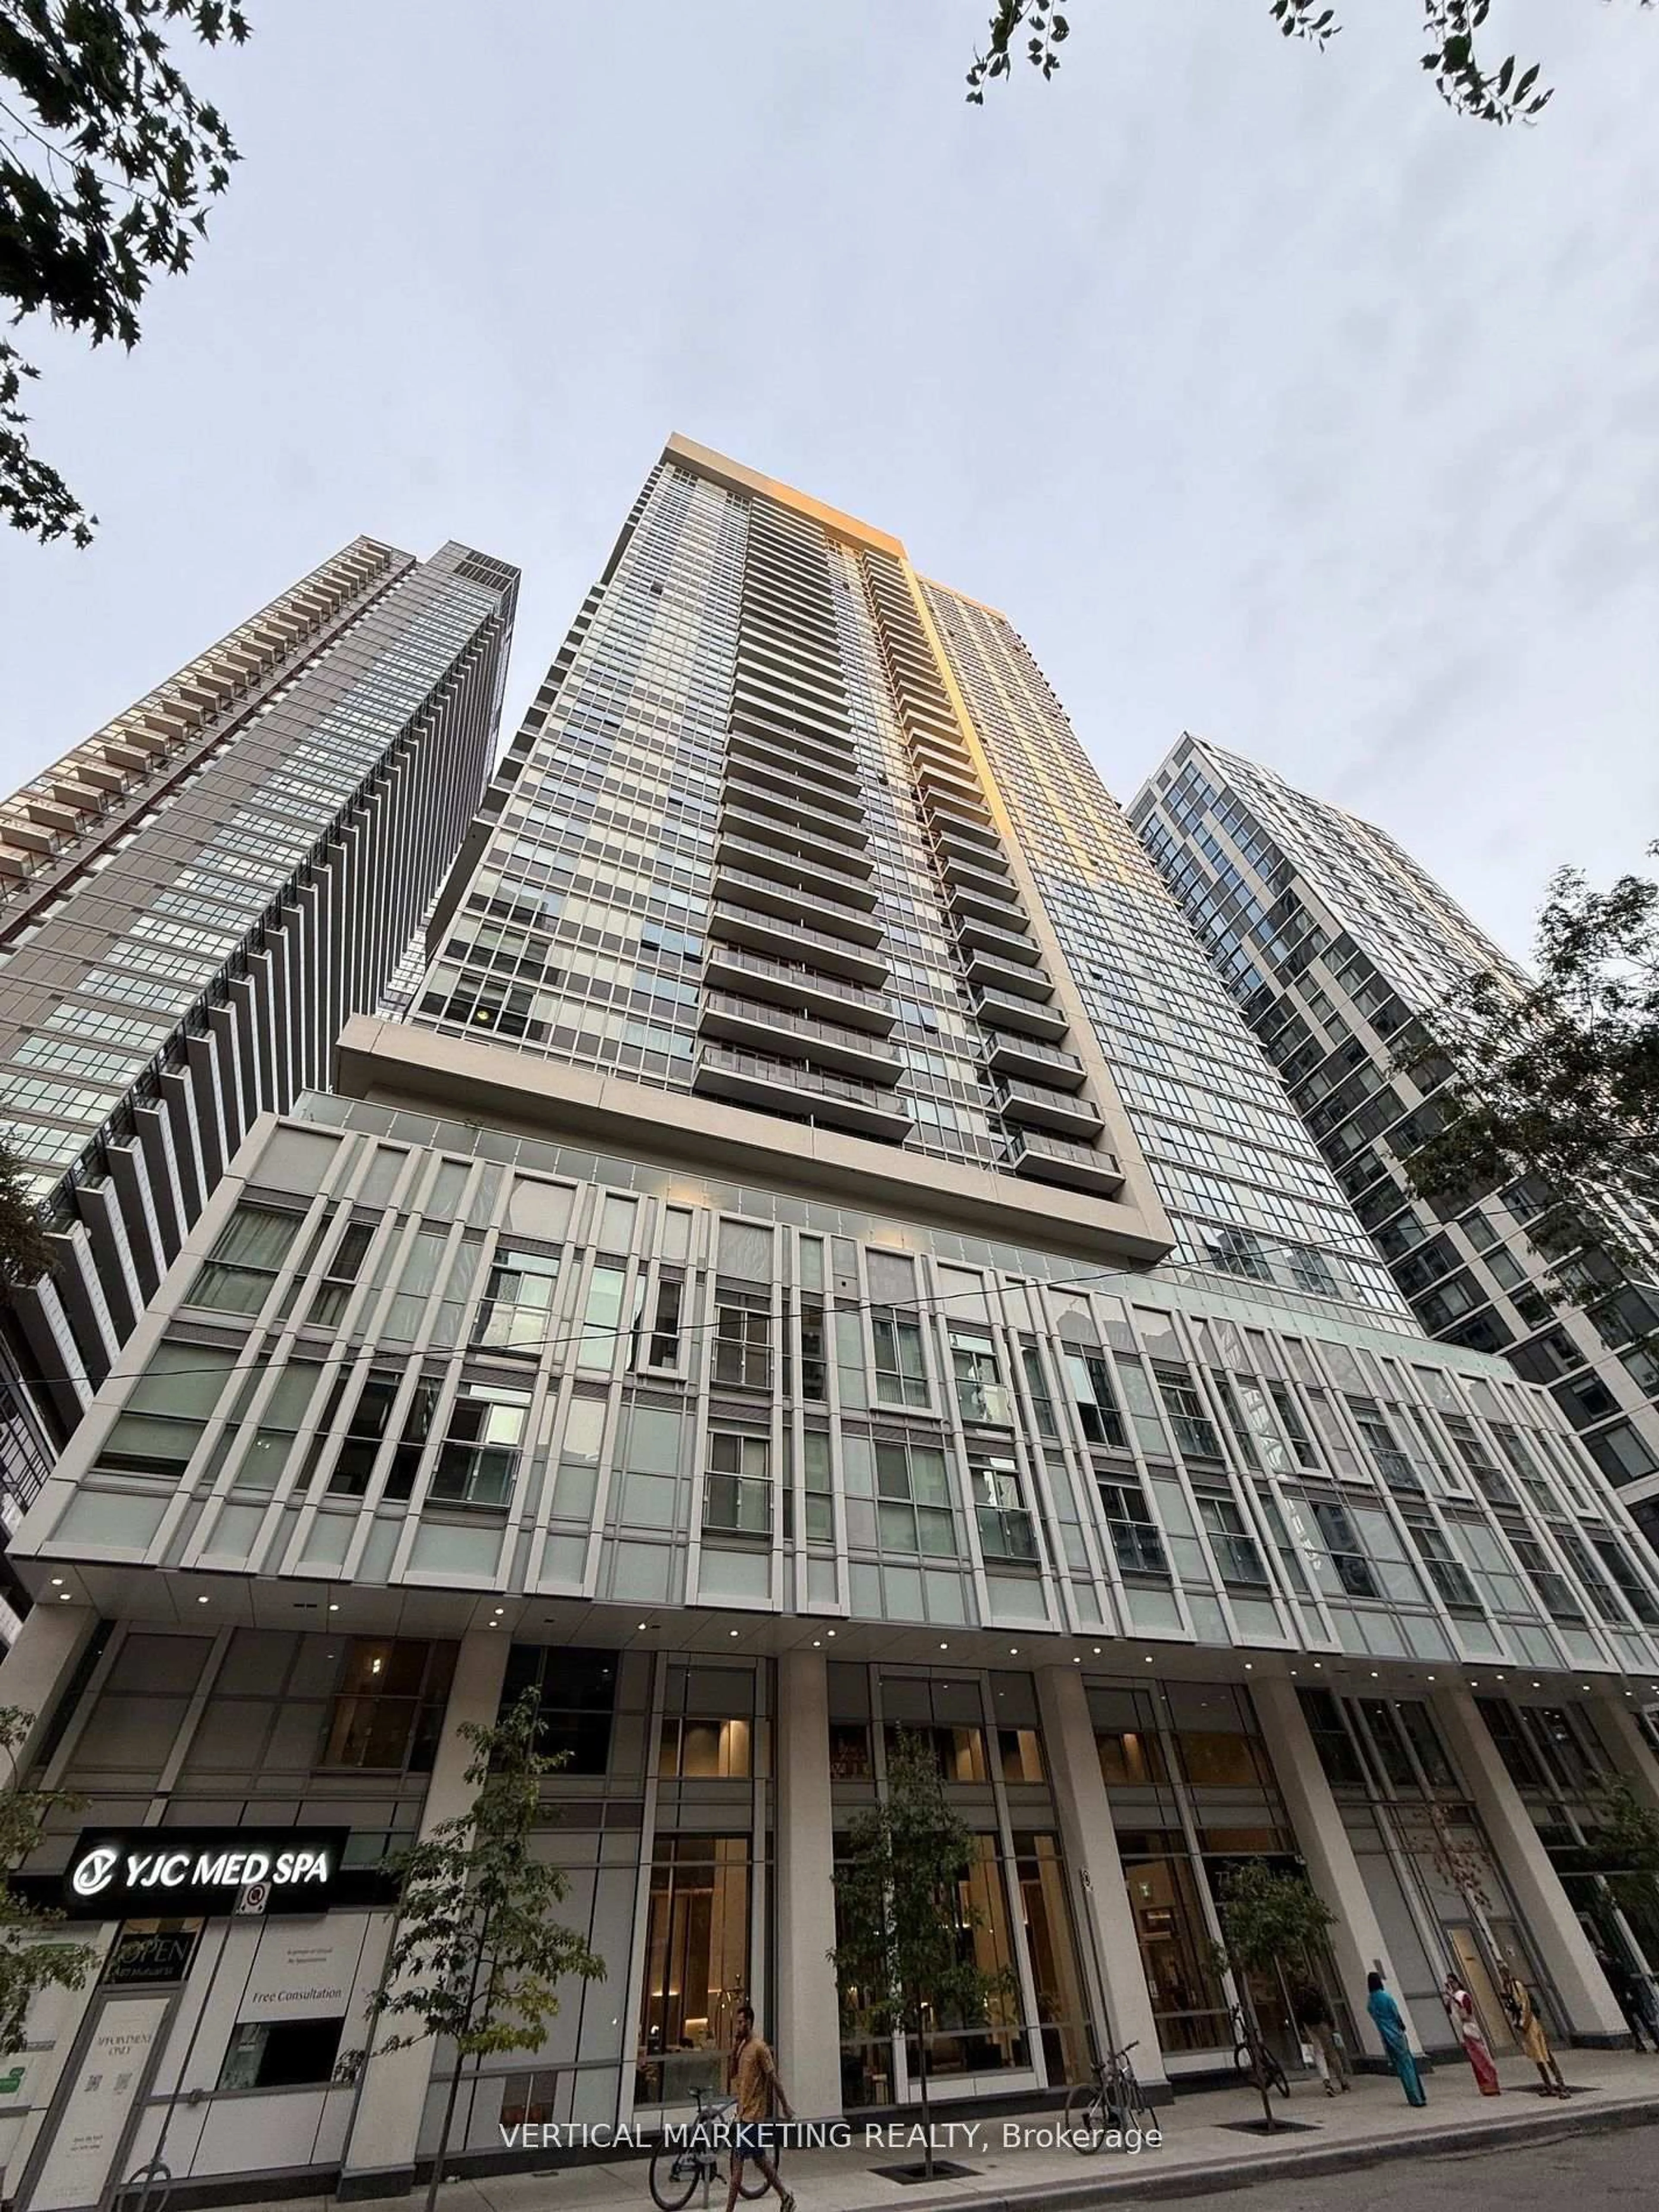
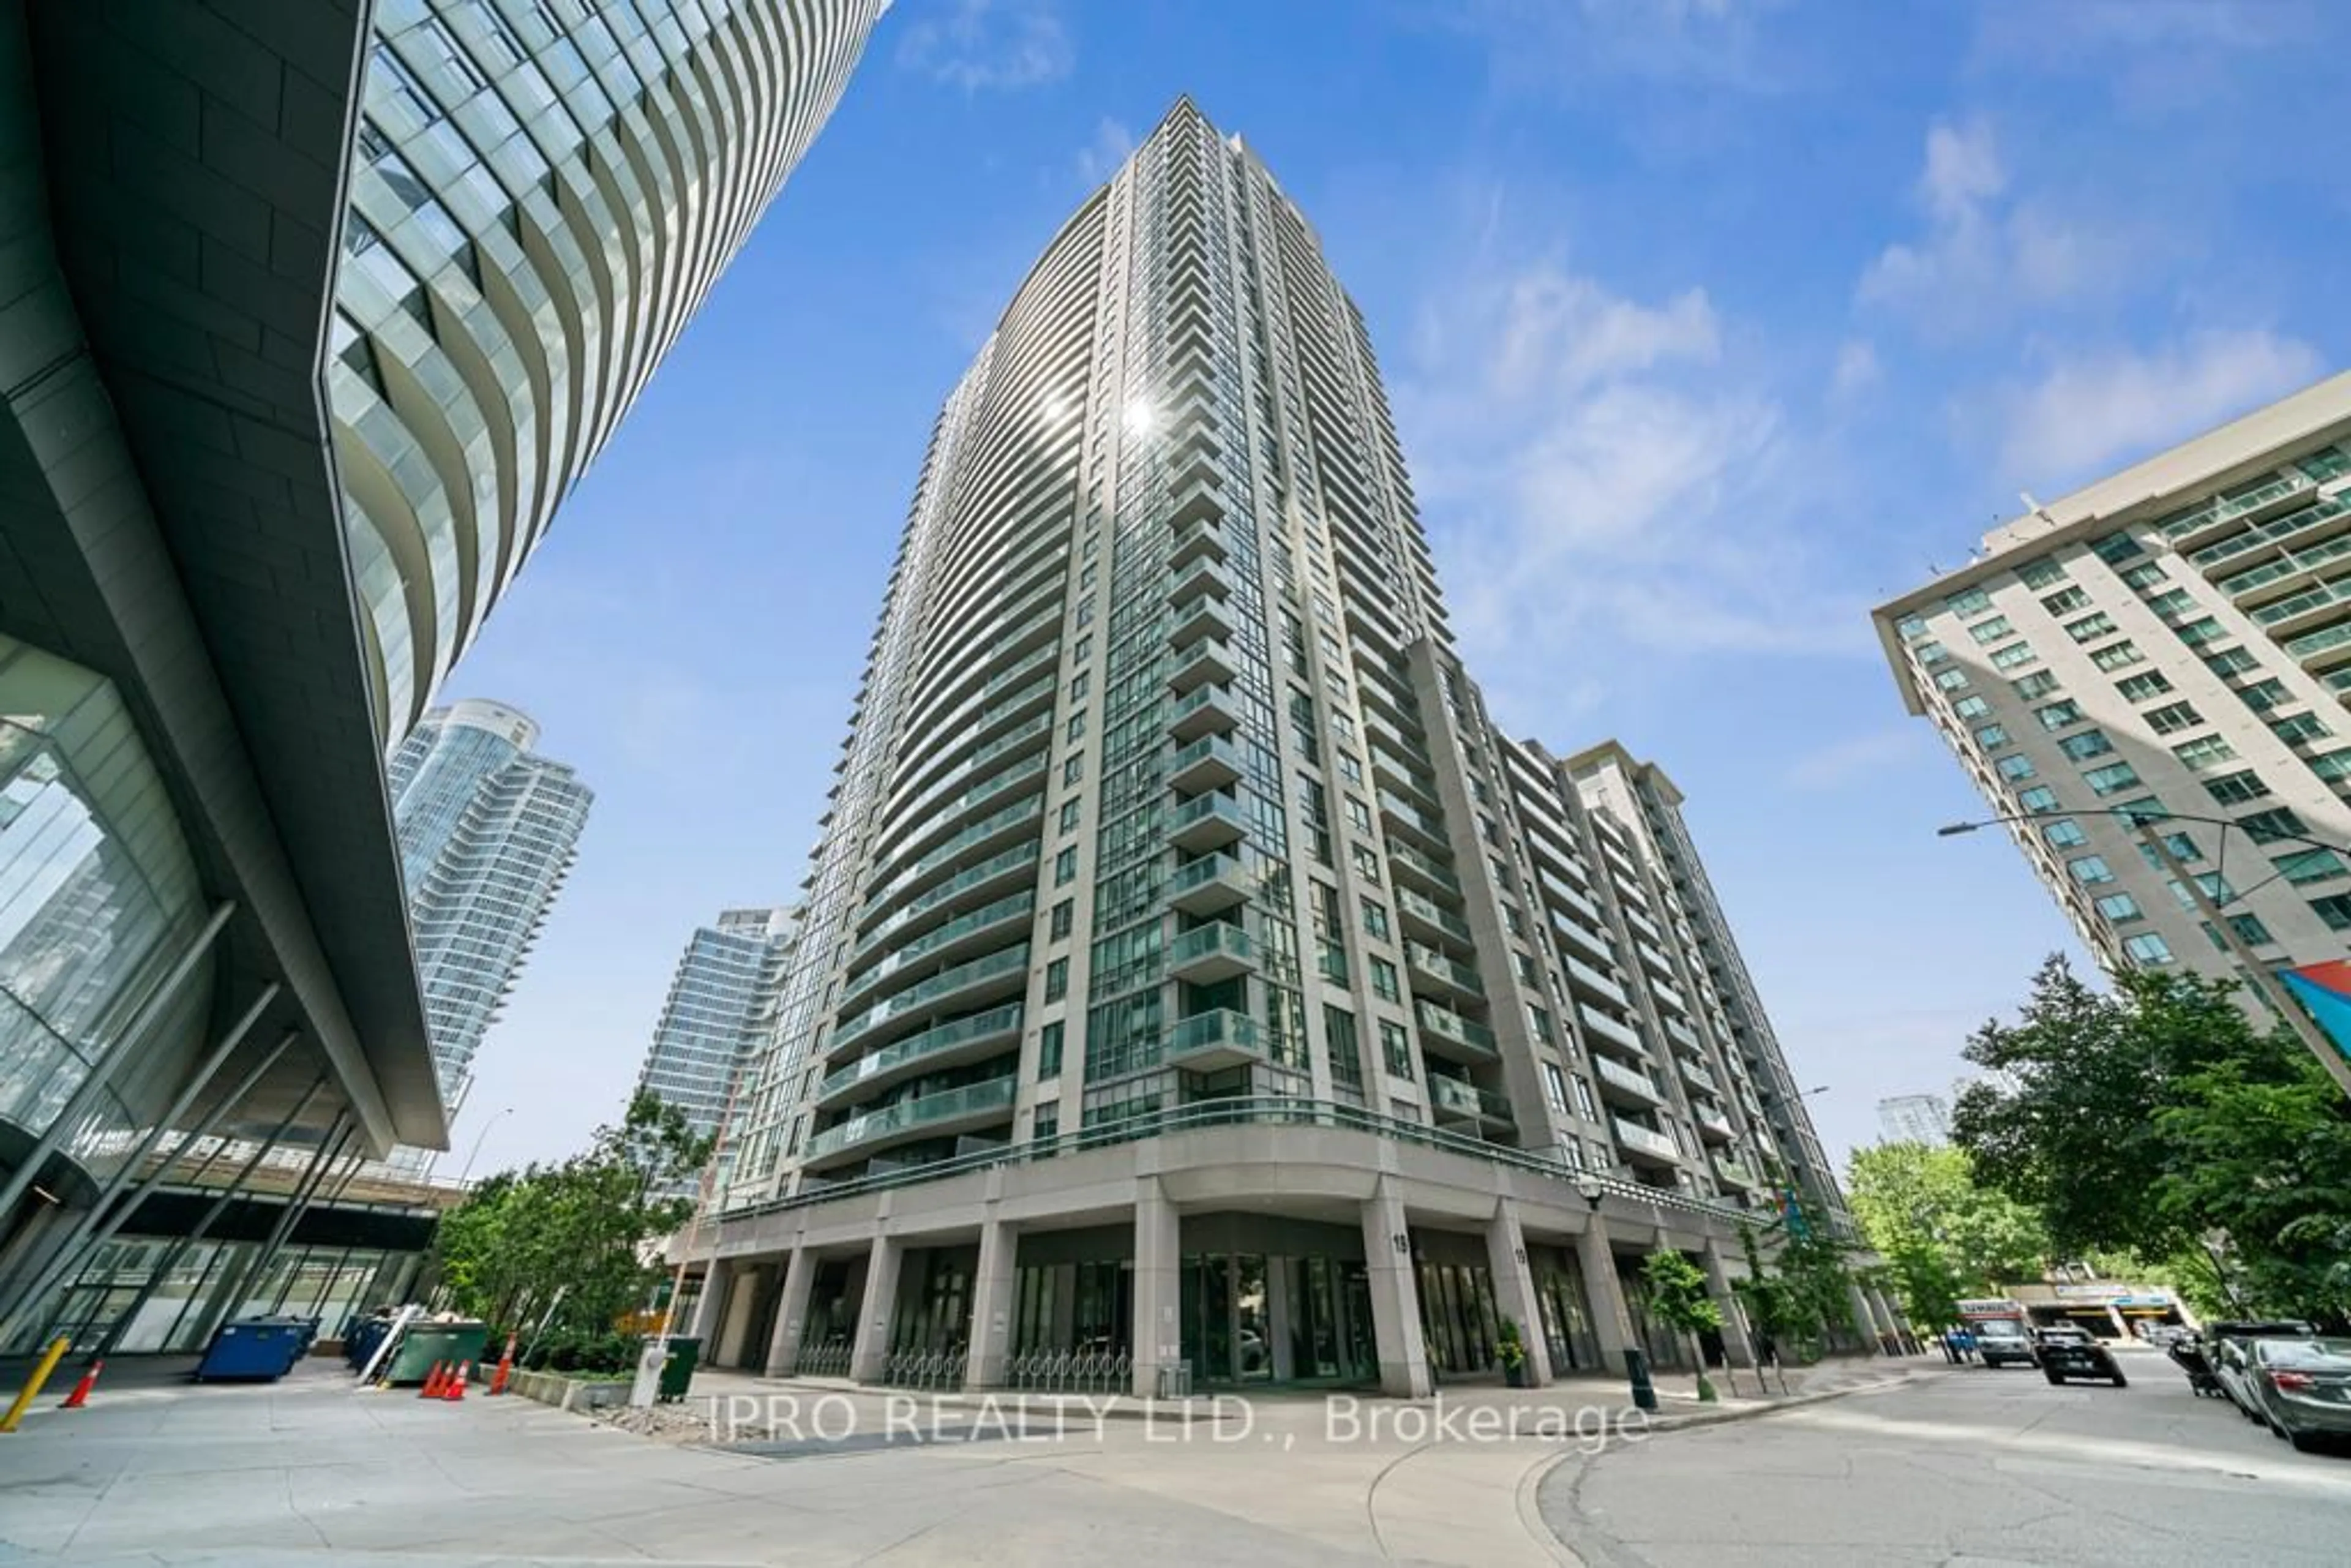
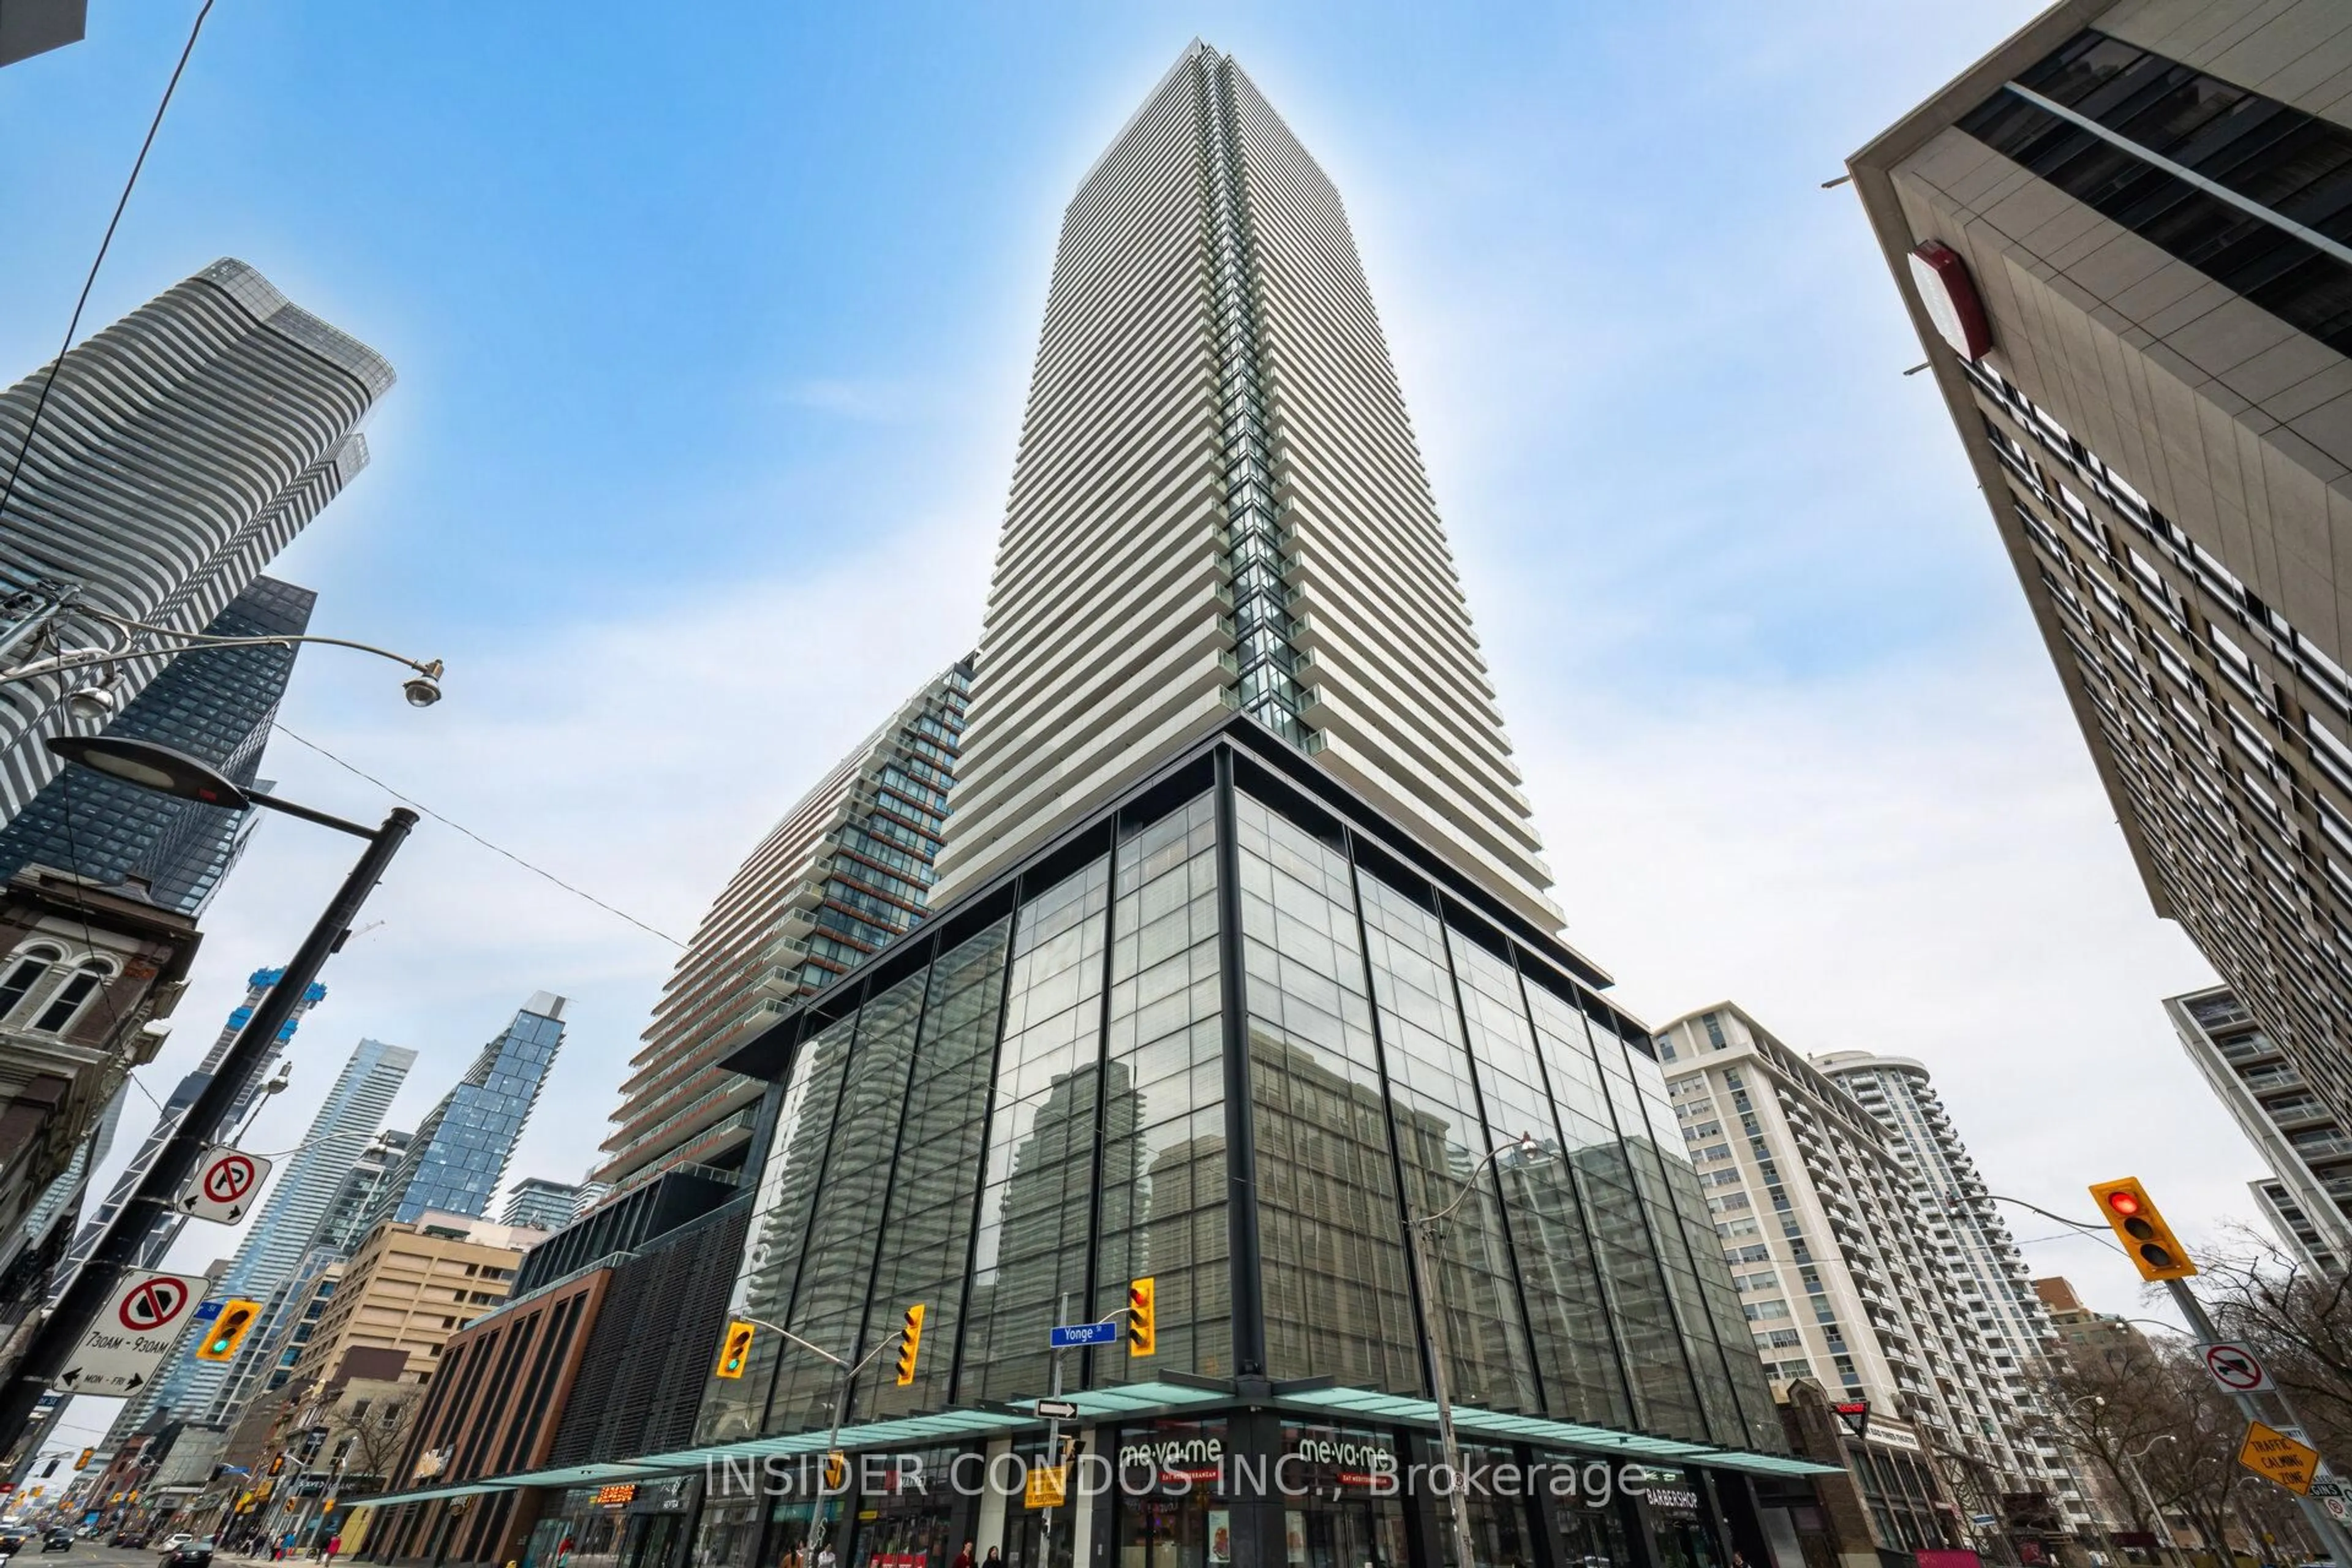
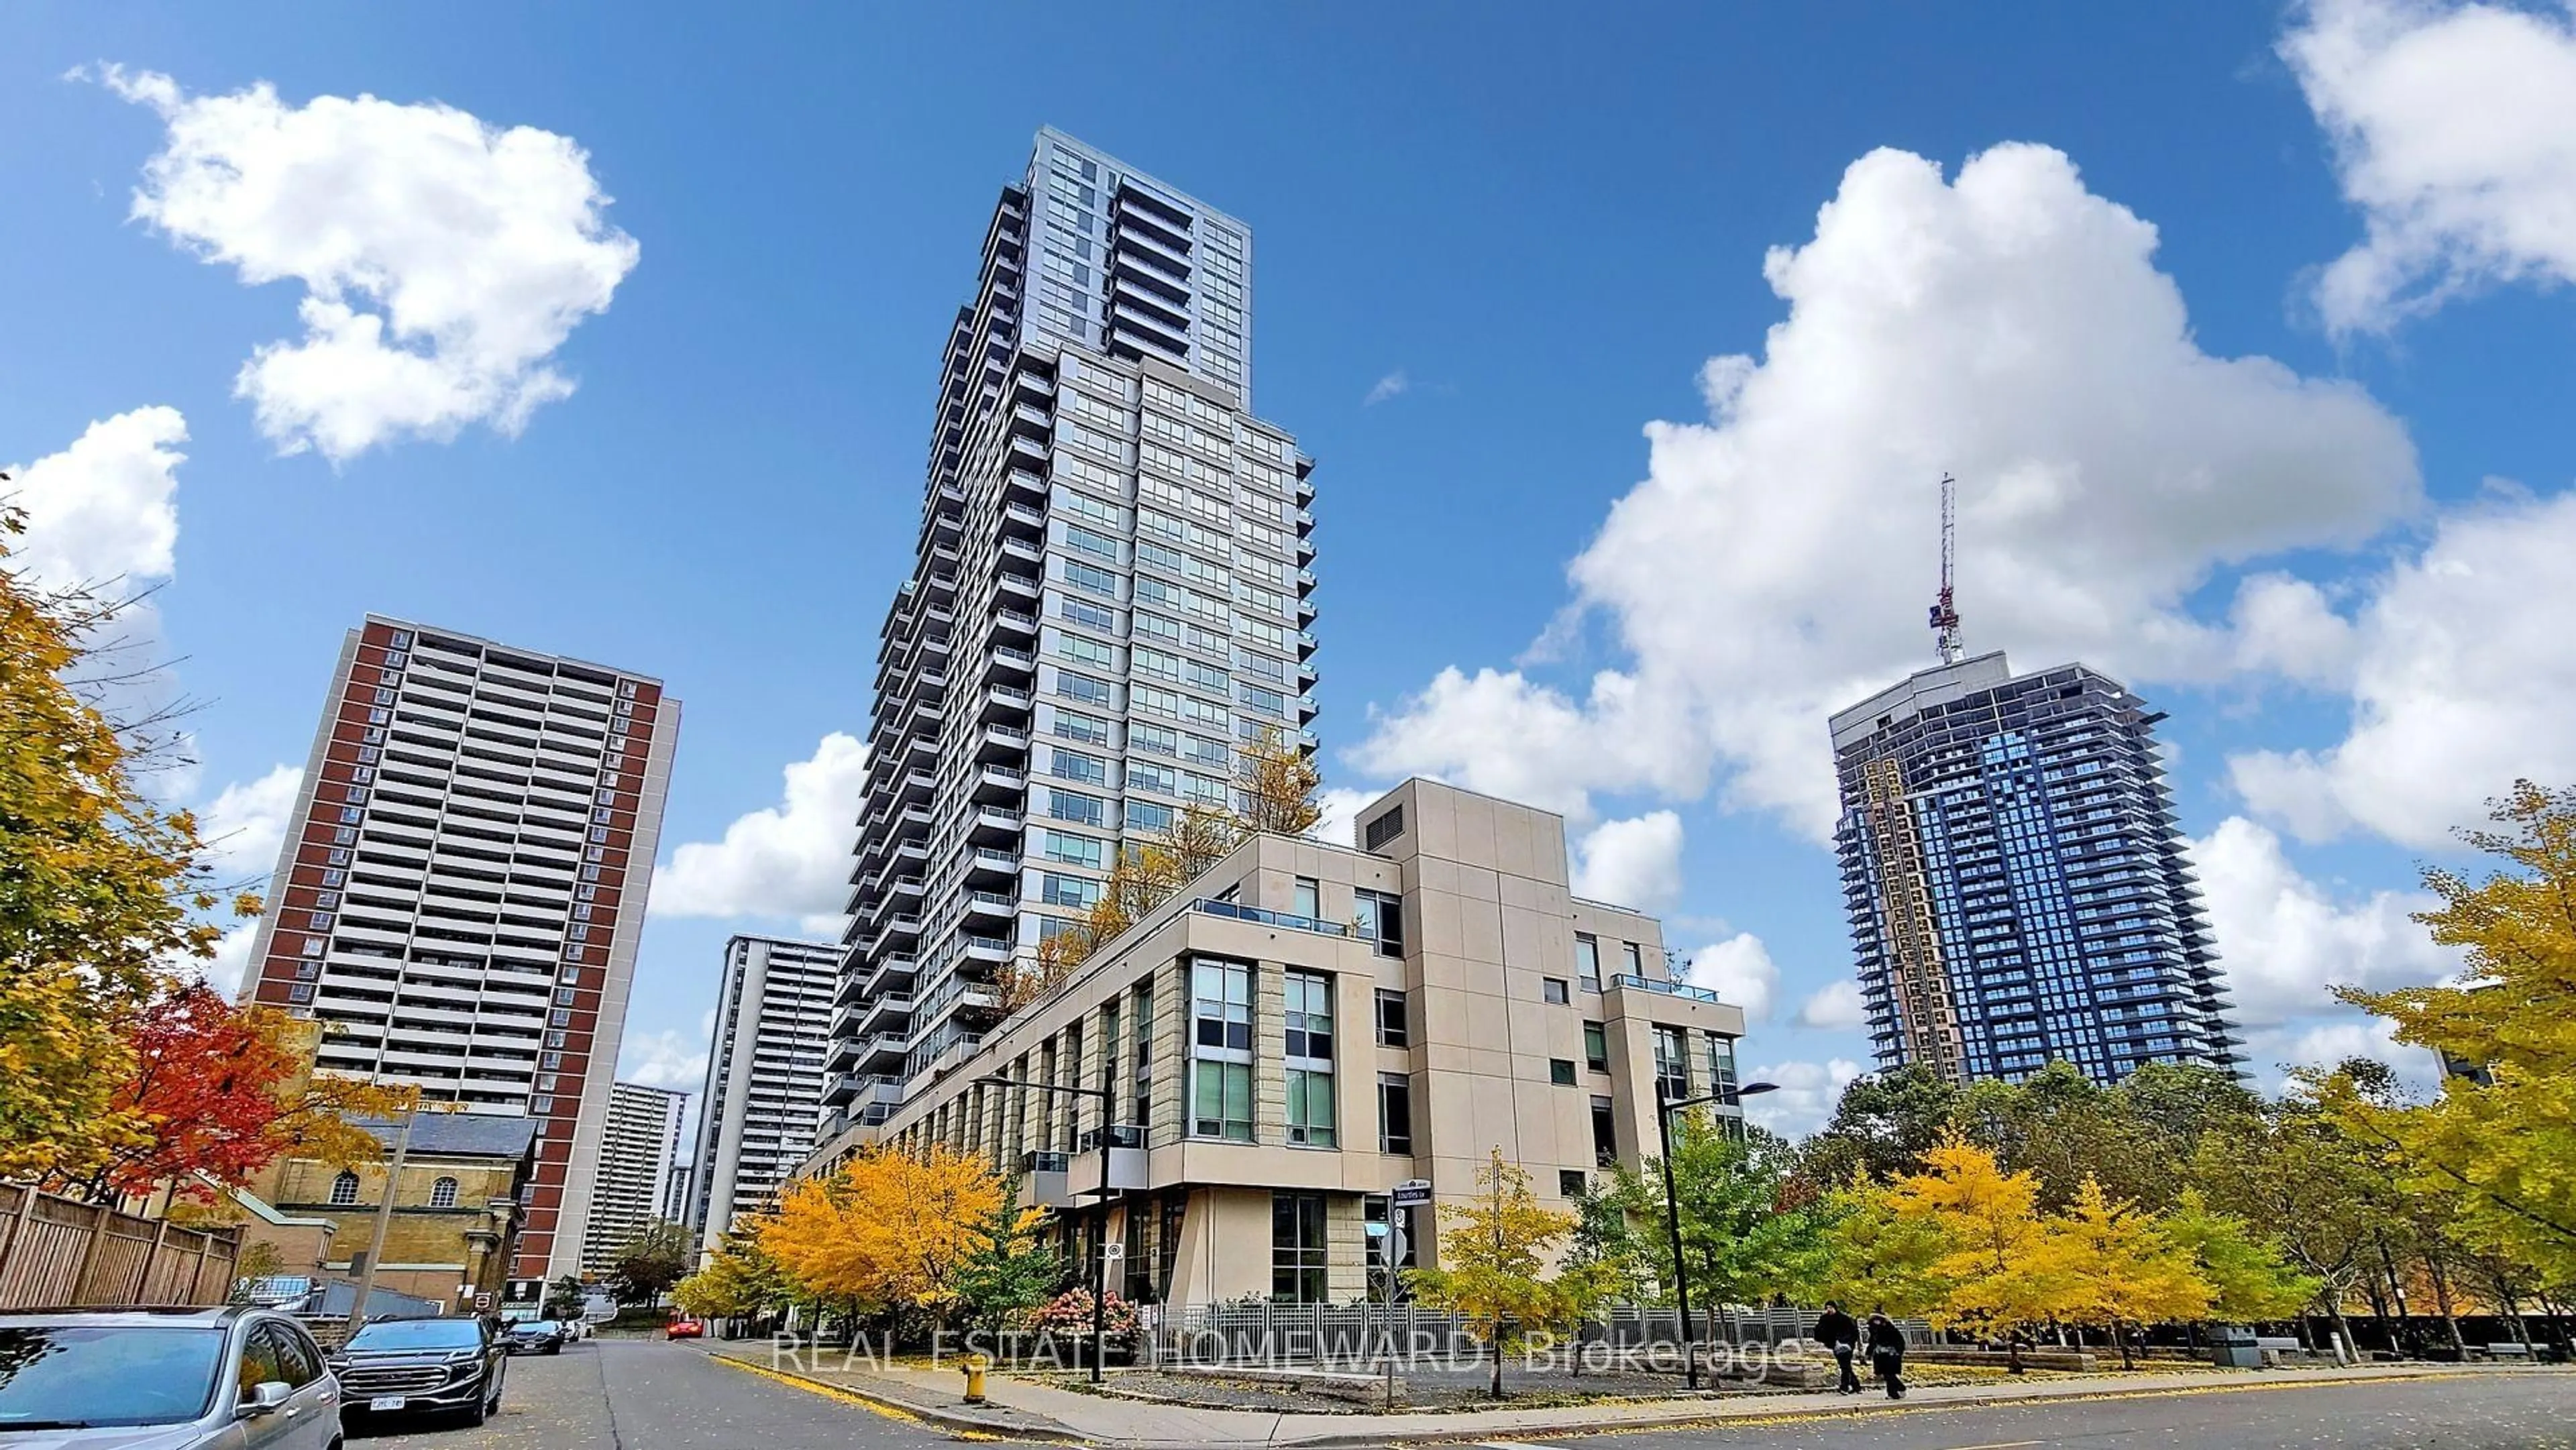
110 Charles St #707, Toronto, Ontario M4Y 2W7

In the same building:
-
Condo
2
2
~800-899 sqft
$788,000
Get pre-qualifiedPowered by nesto
Buy with Wahi to get
Up to
$7,880Cashback
Condo
2
2
~800-899 sqft

Contact us about this property

Call

Highlights

Property Estimate

Days on market6 days

Estimated valueNot available

Price/Sqft$931/sqft

Monthly cost

Open Calculator

CMA Subject Property

Curious about what homes are selling for in this area?

Get a report on comparable homes with helpful insights and trends.

+36

Properties sold*

$678K

Median sold price*

*Based on last 30 days

Description

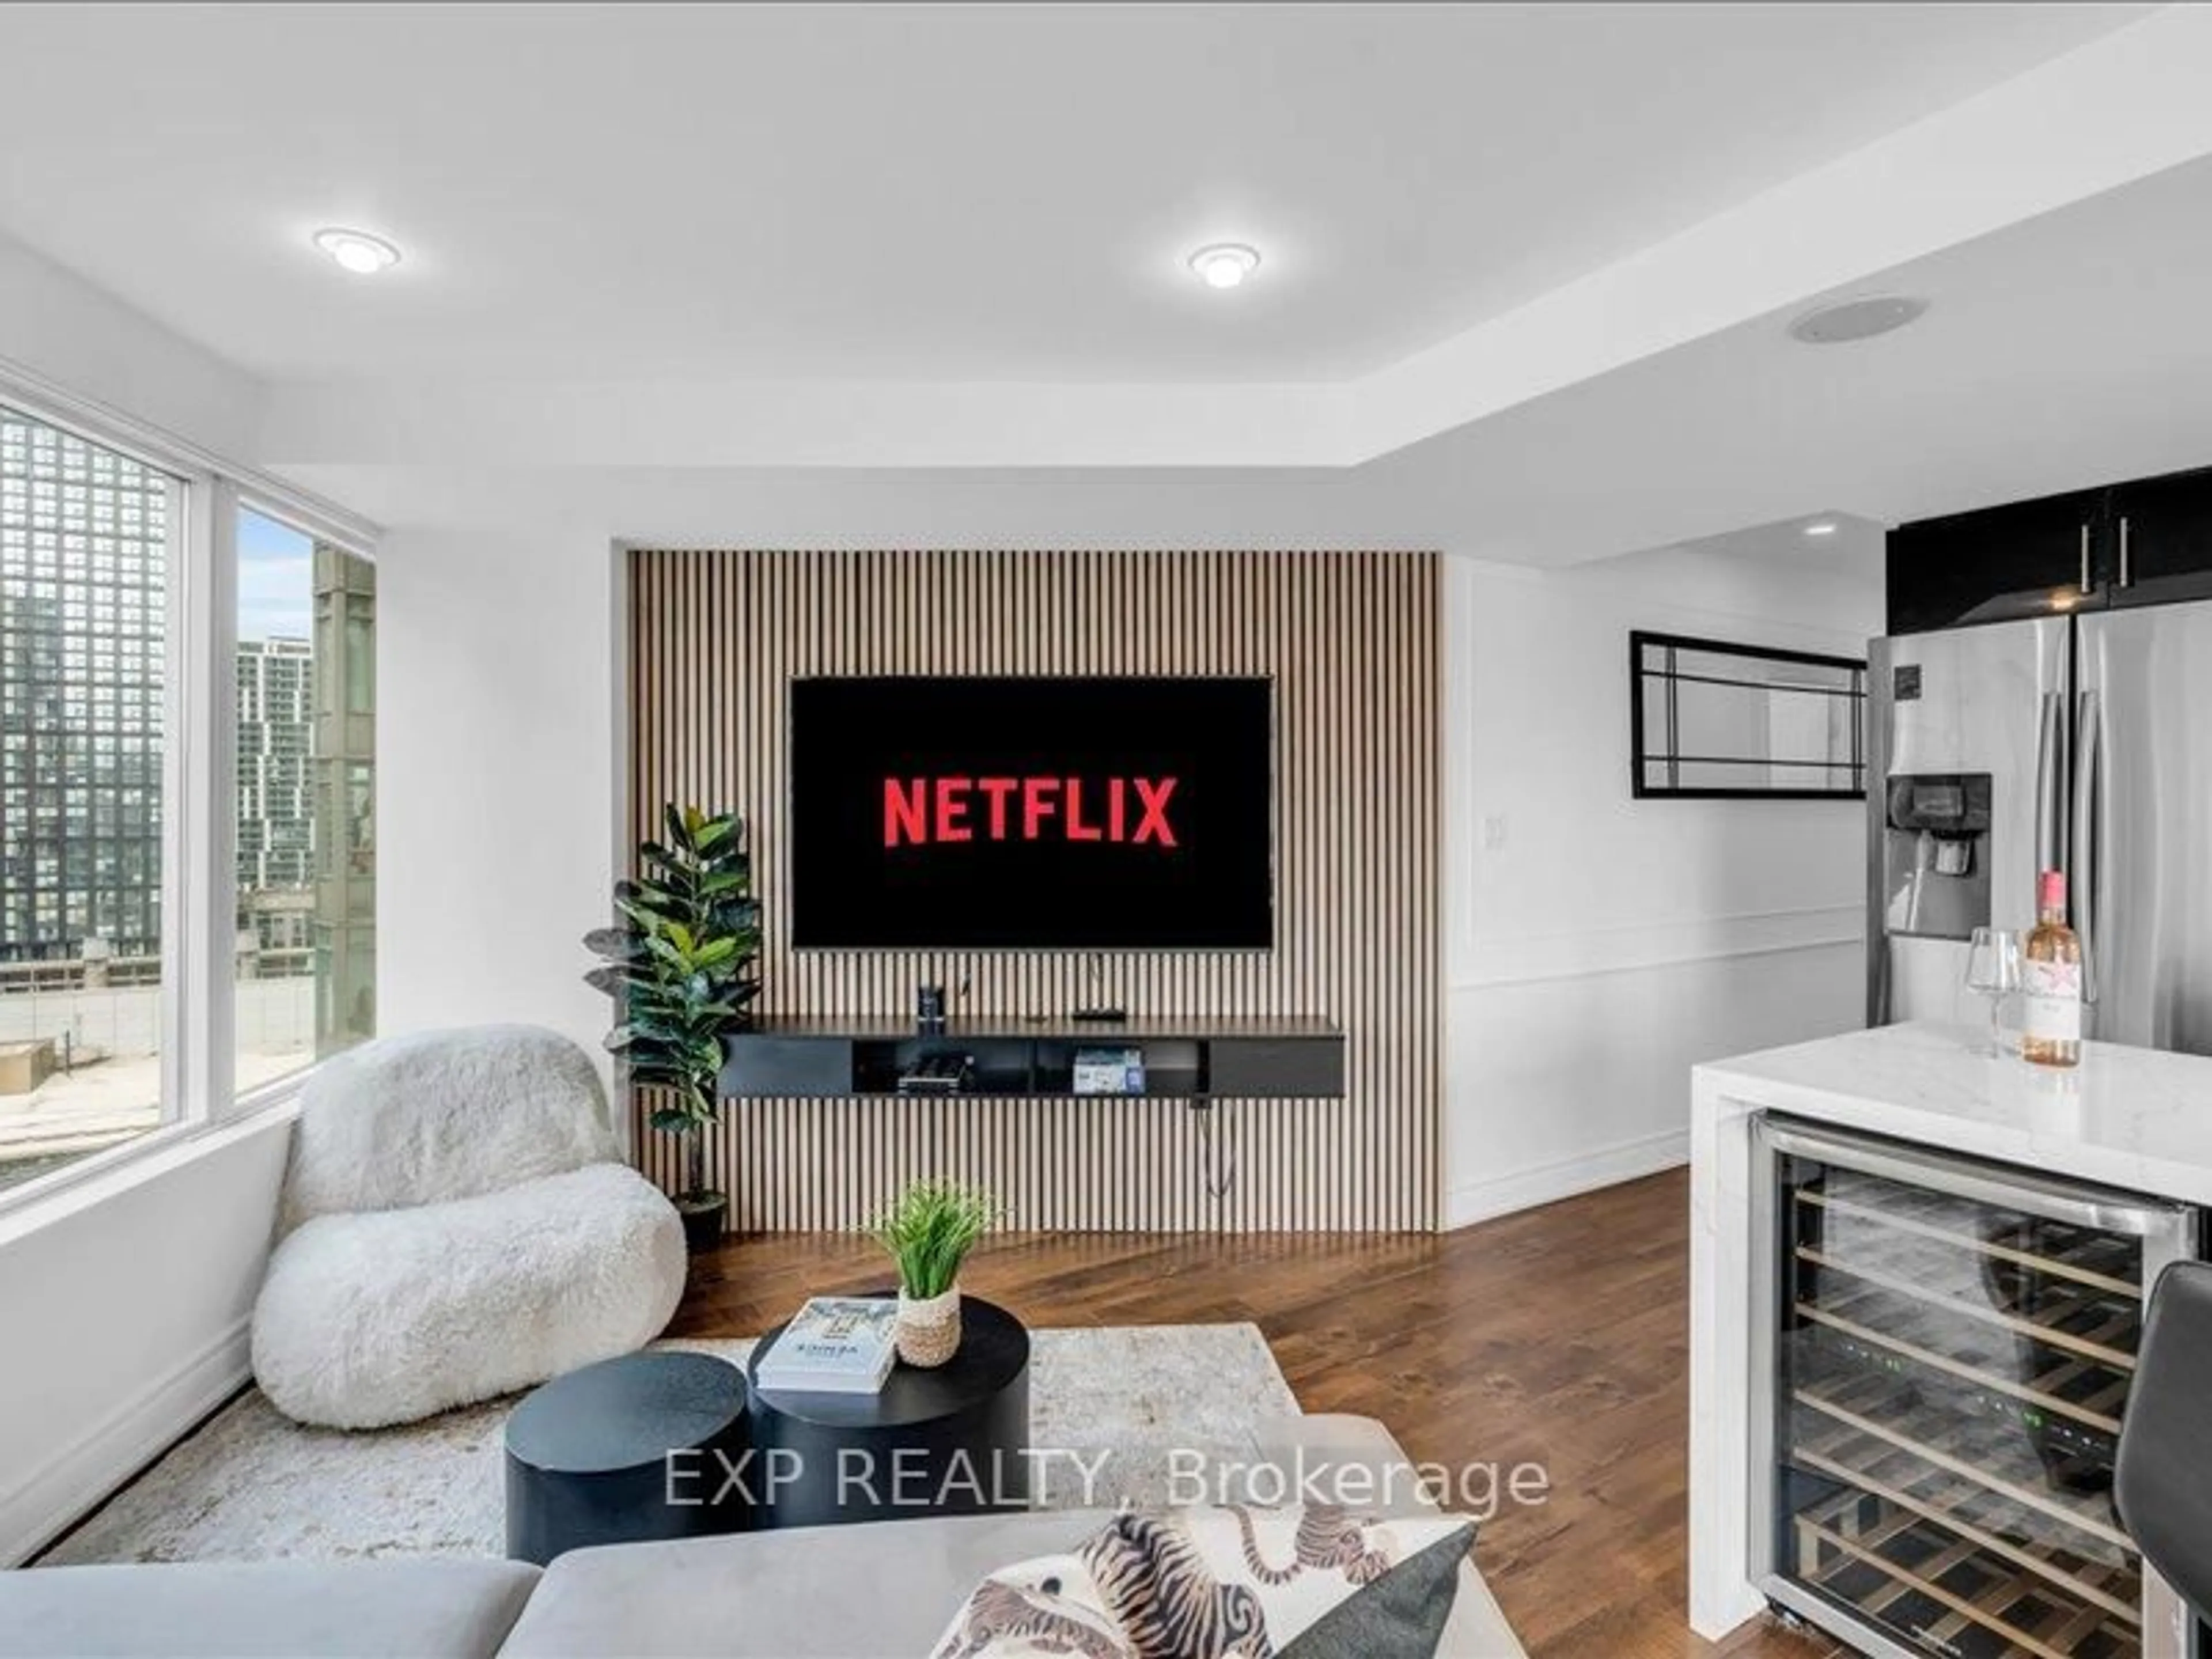
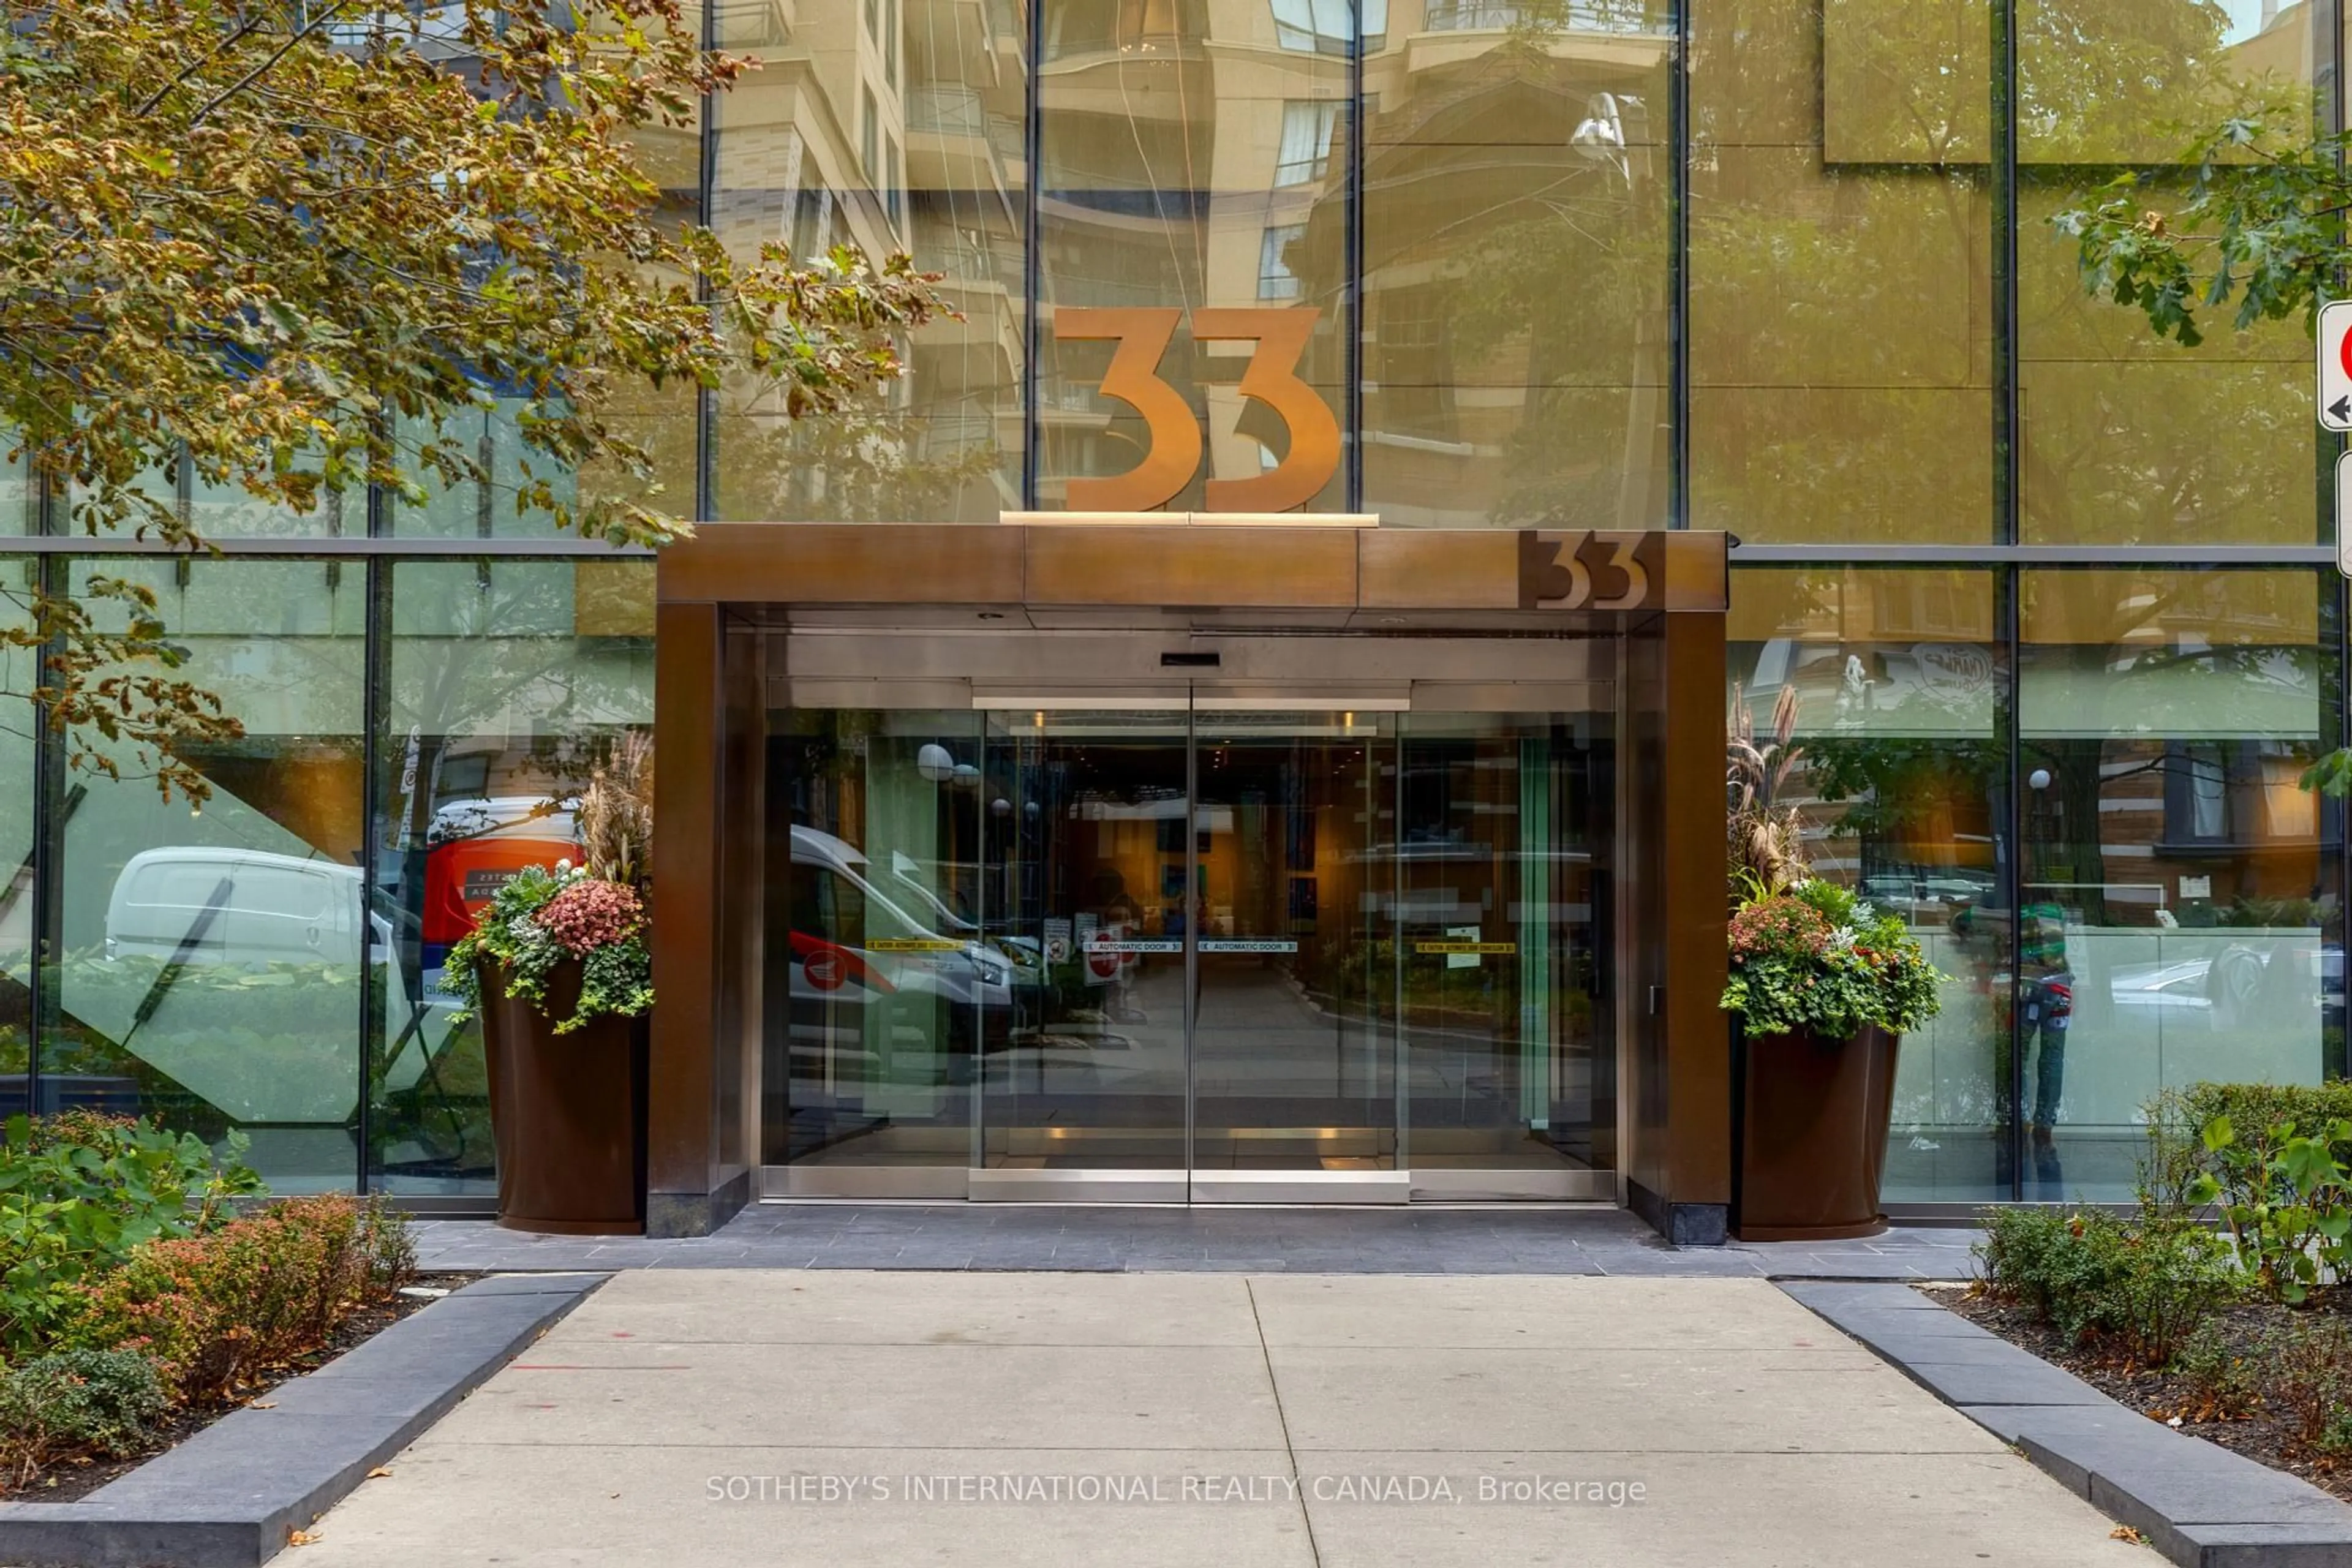
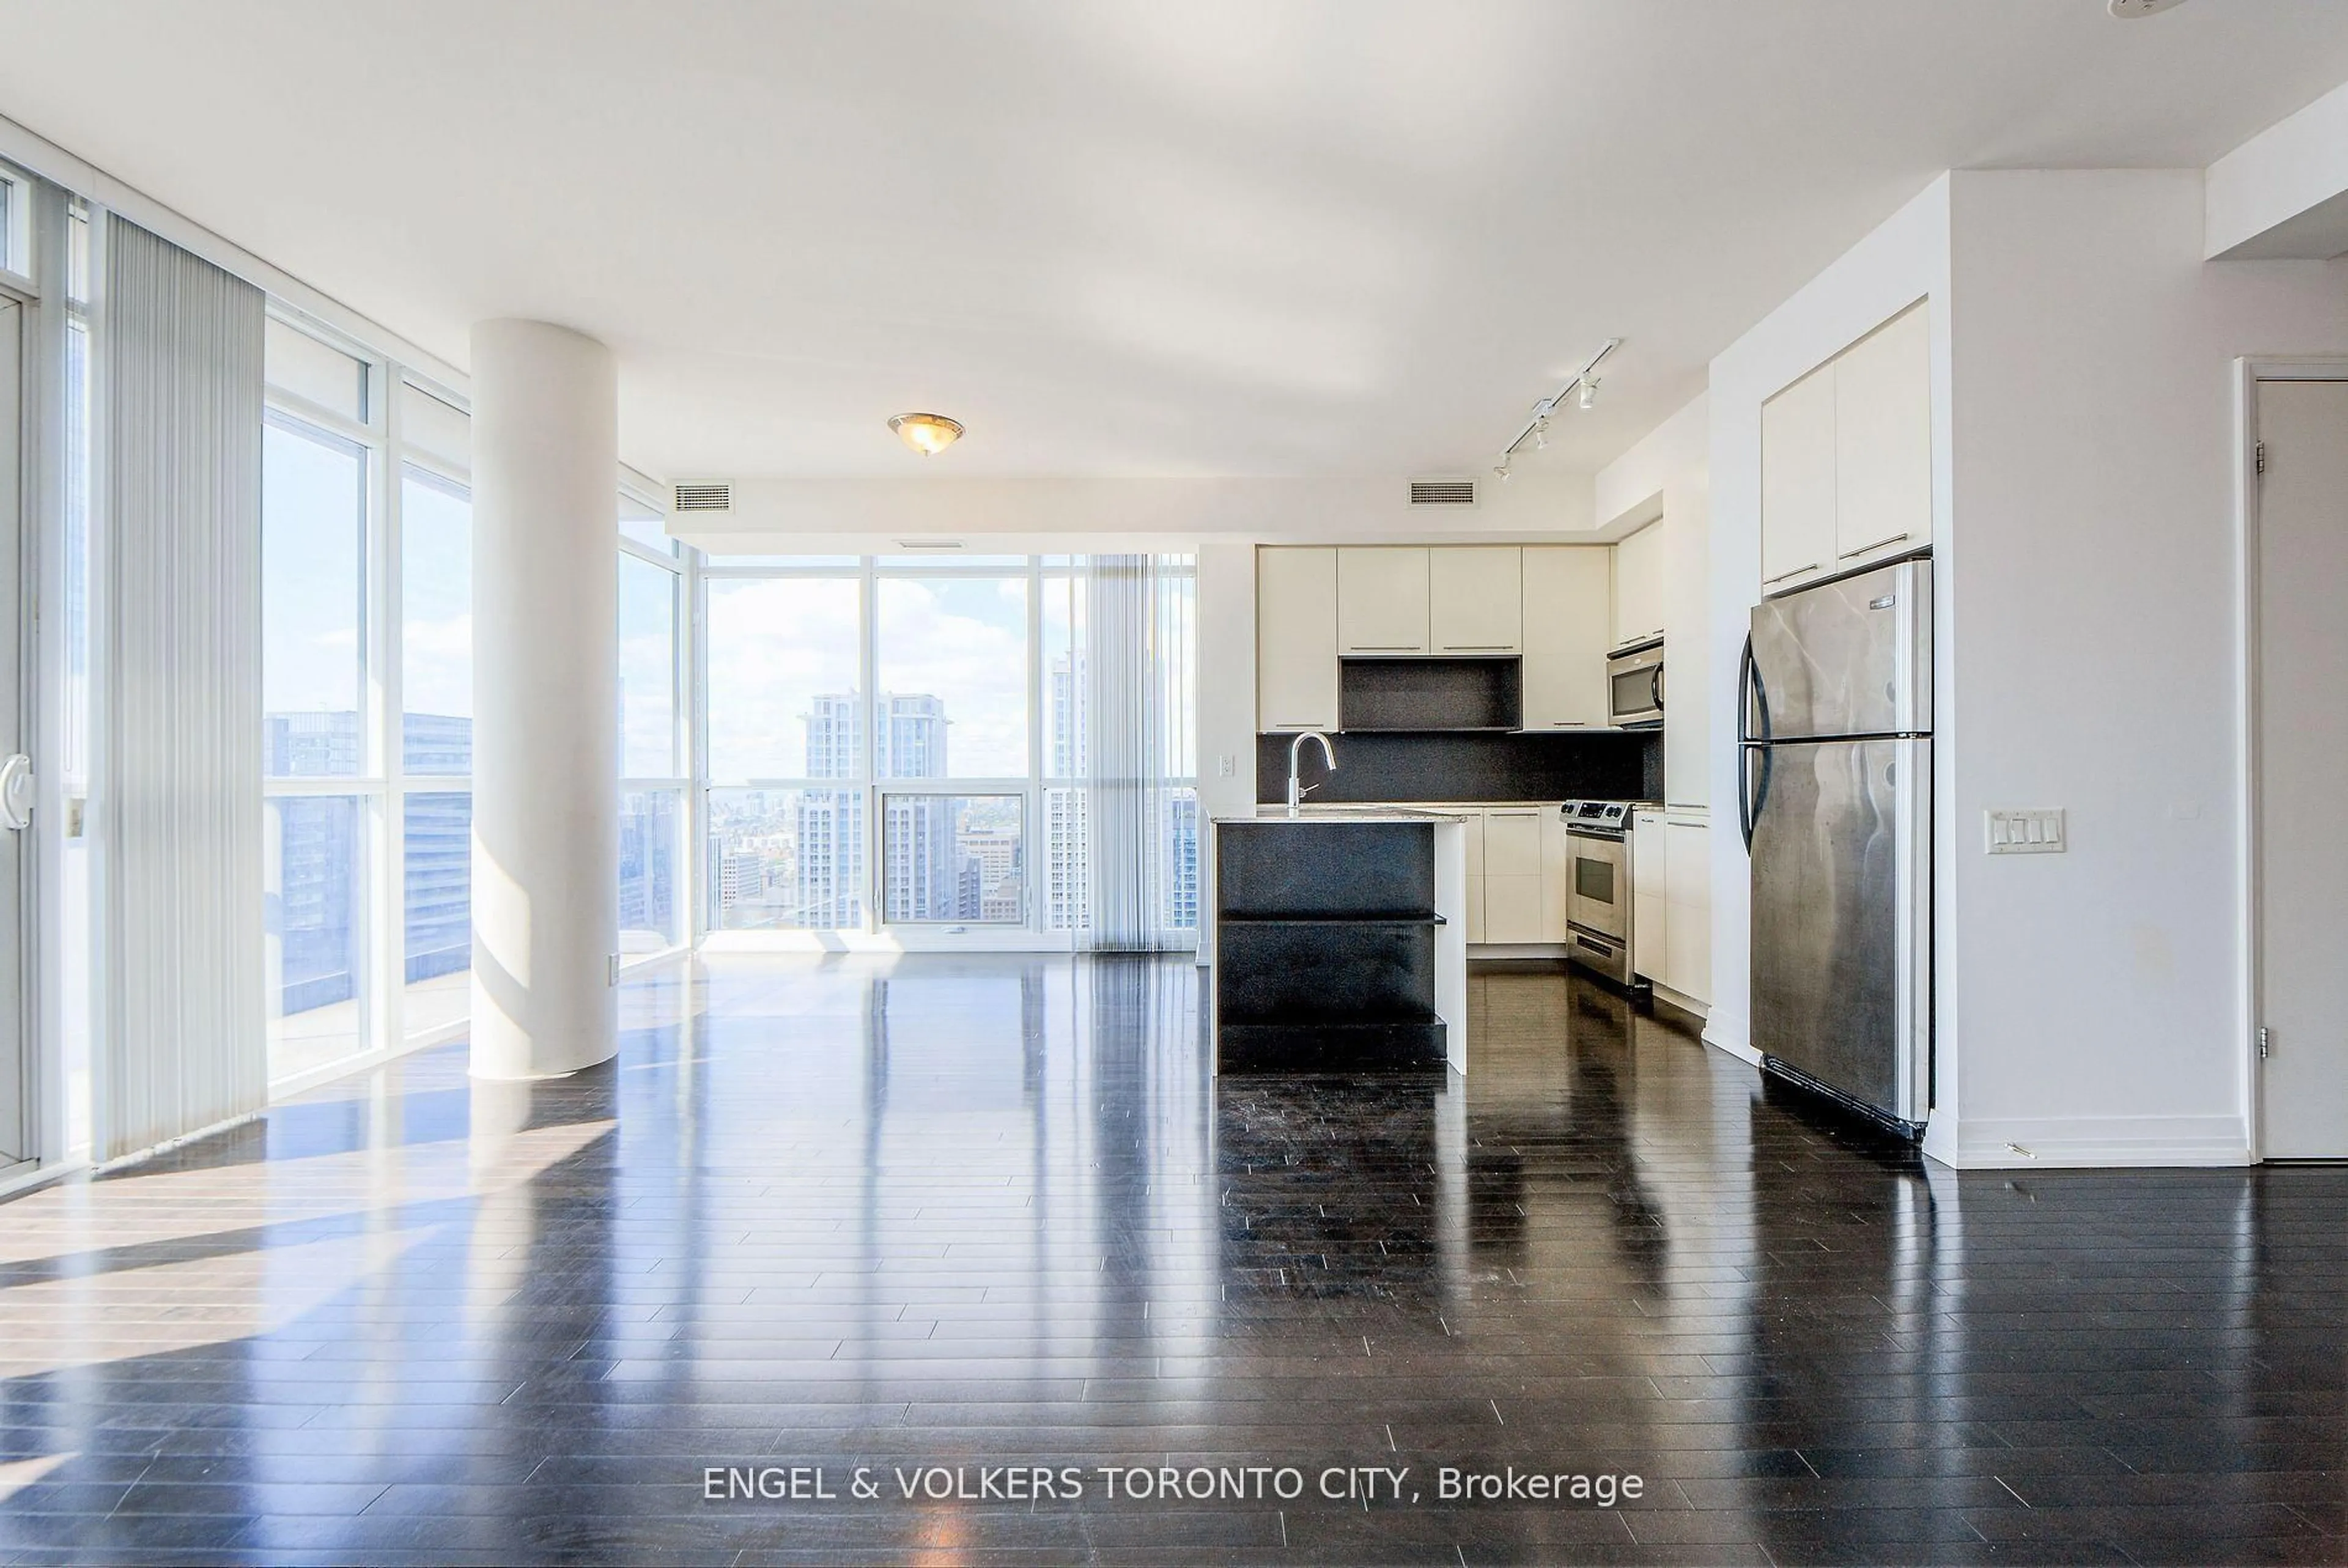
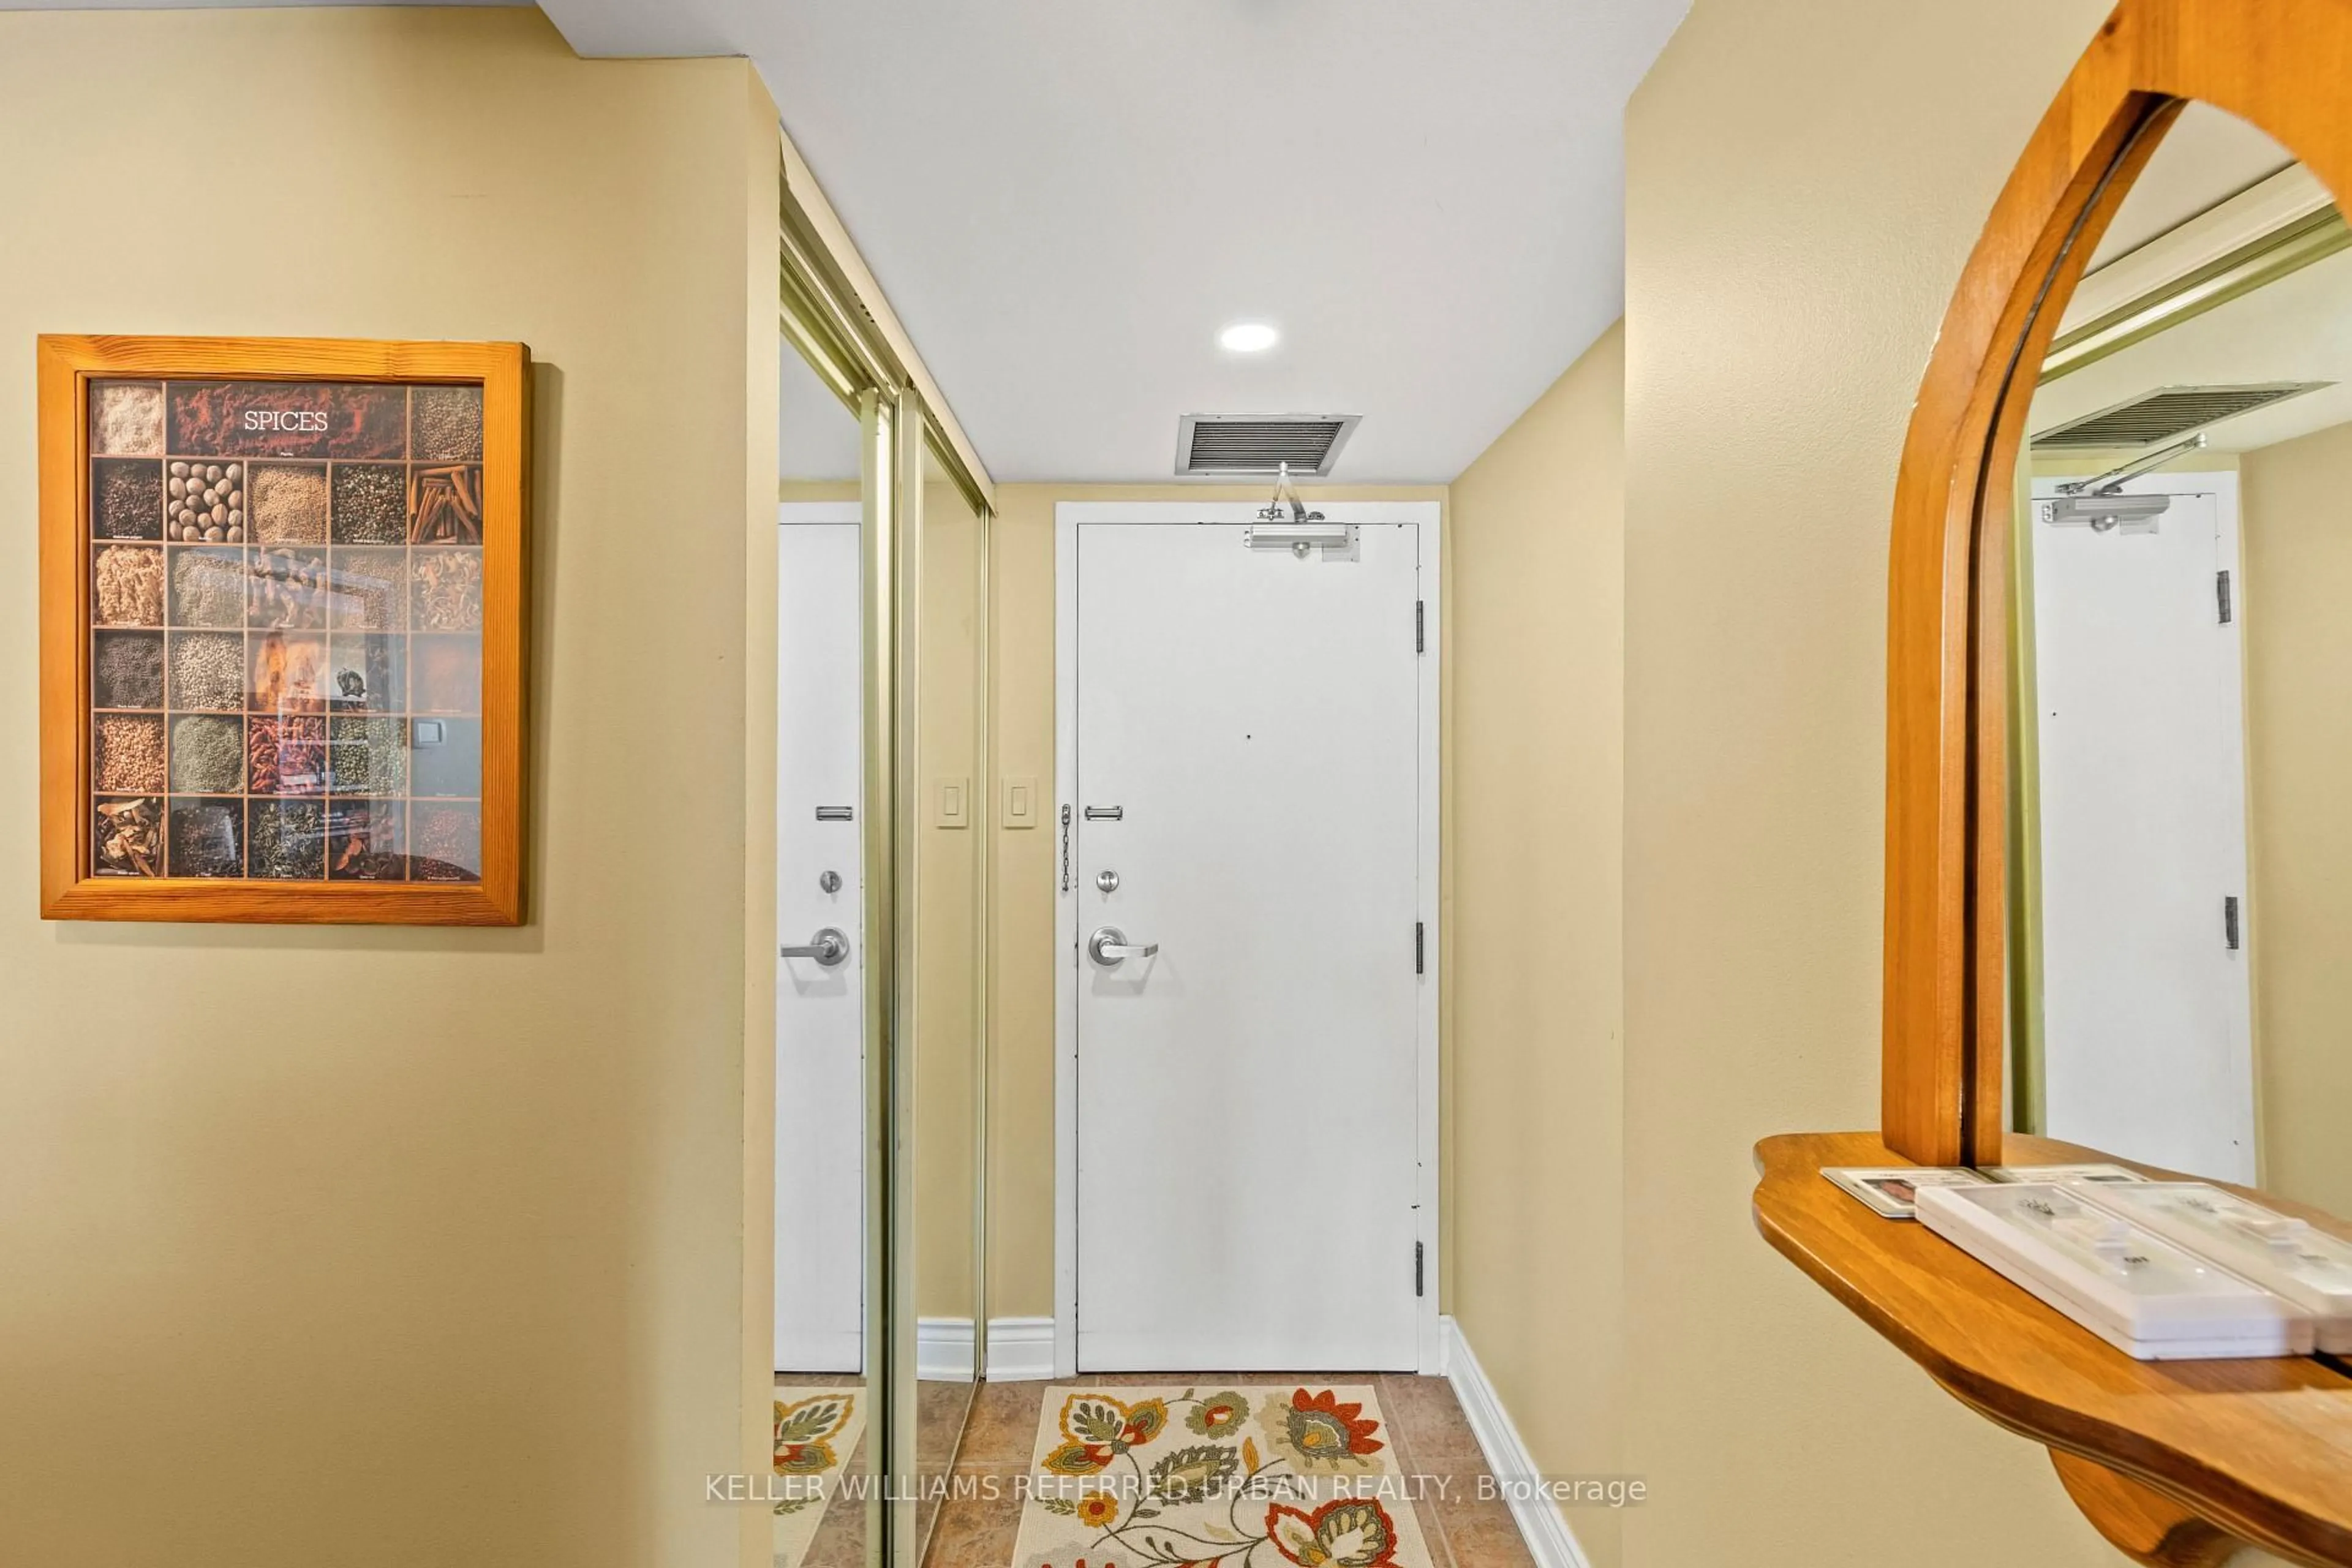
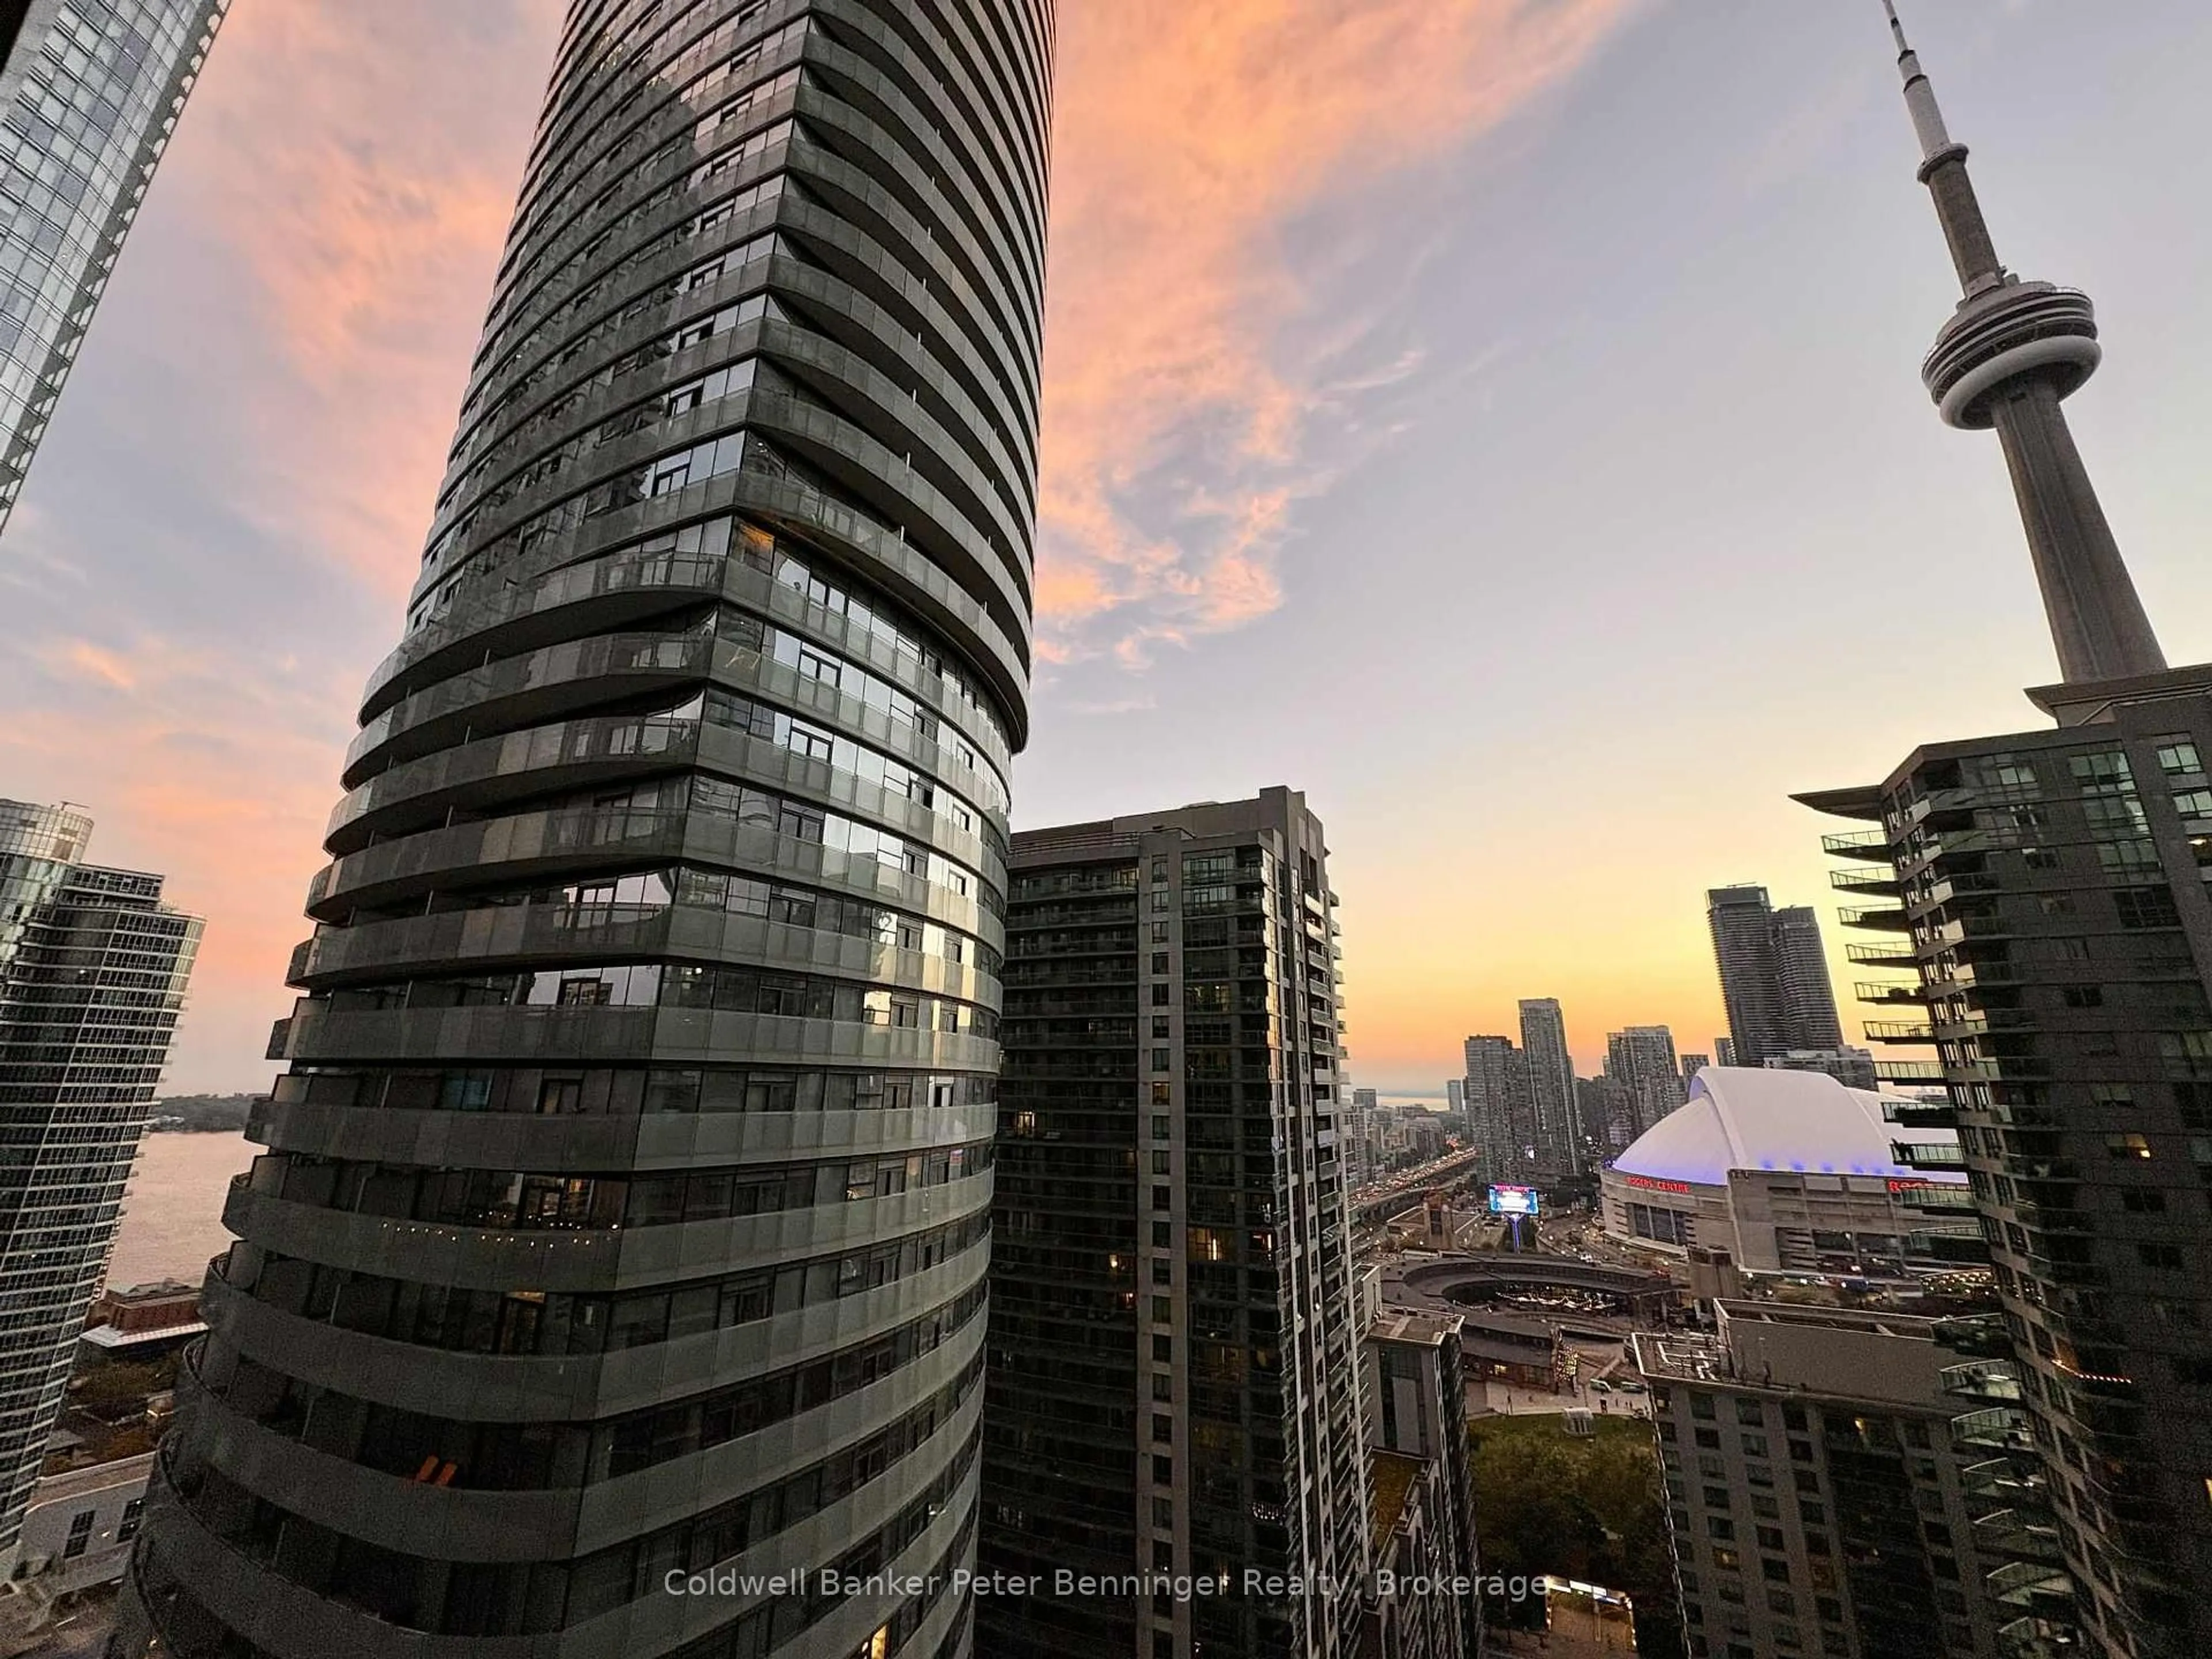
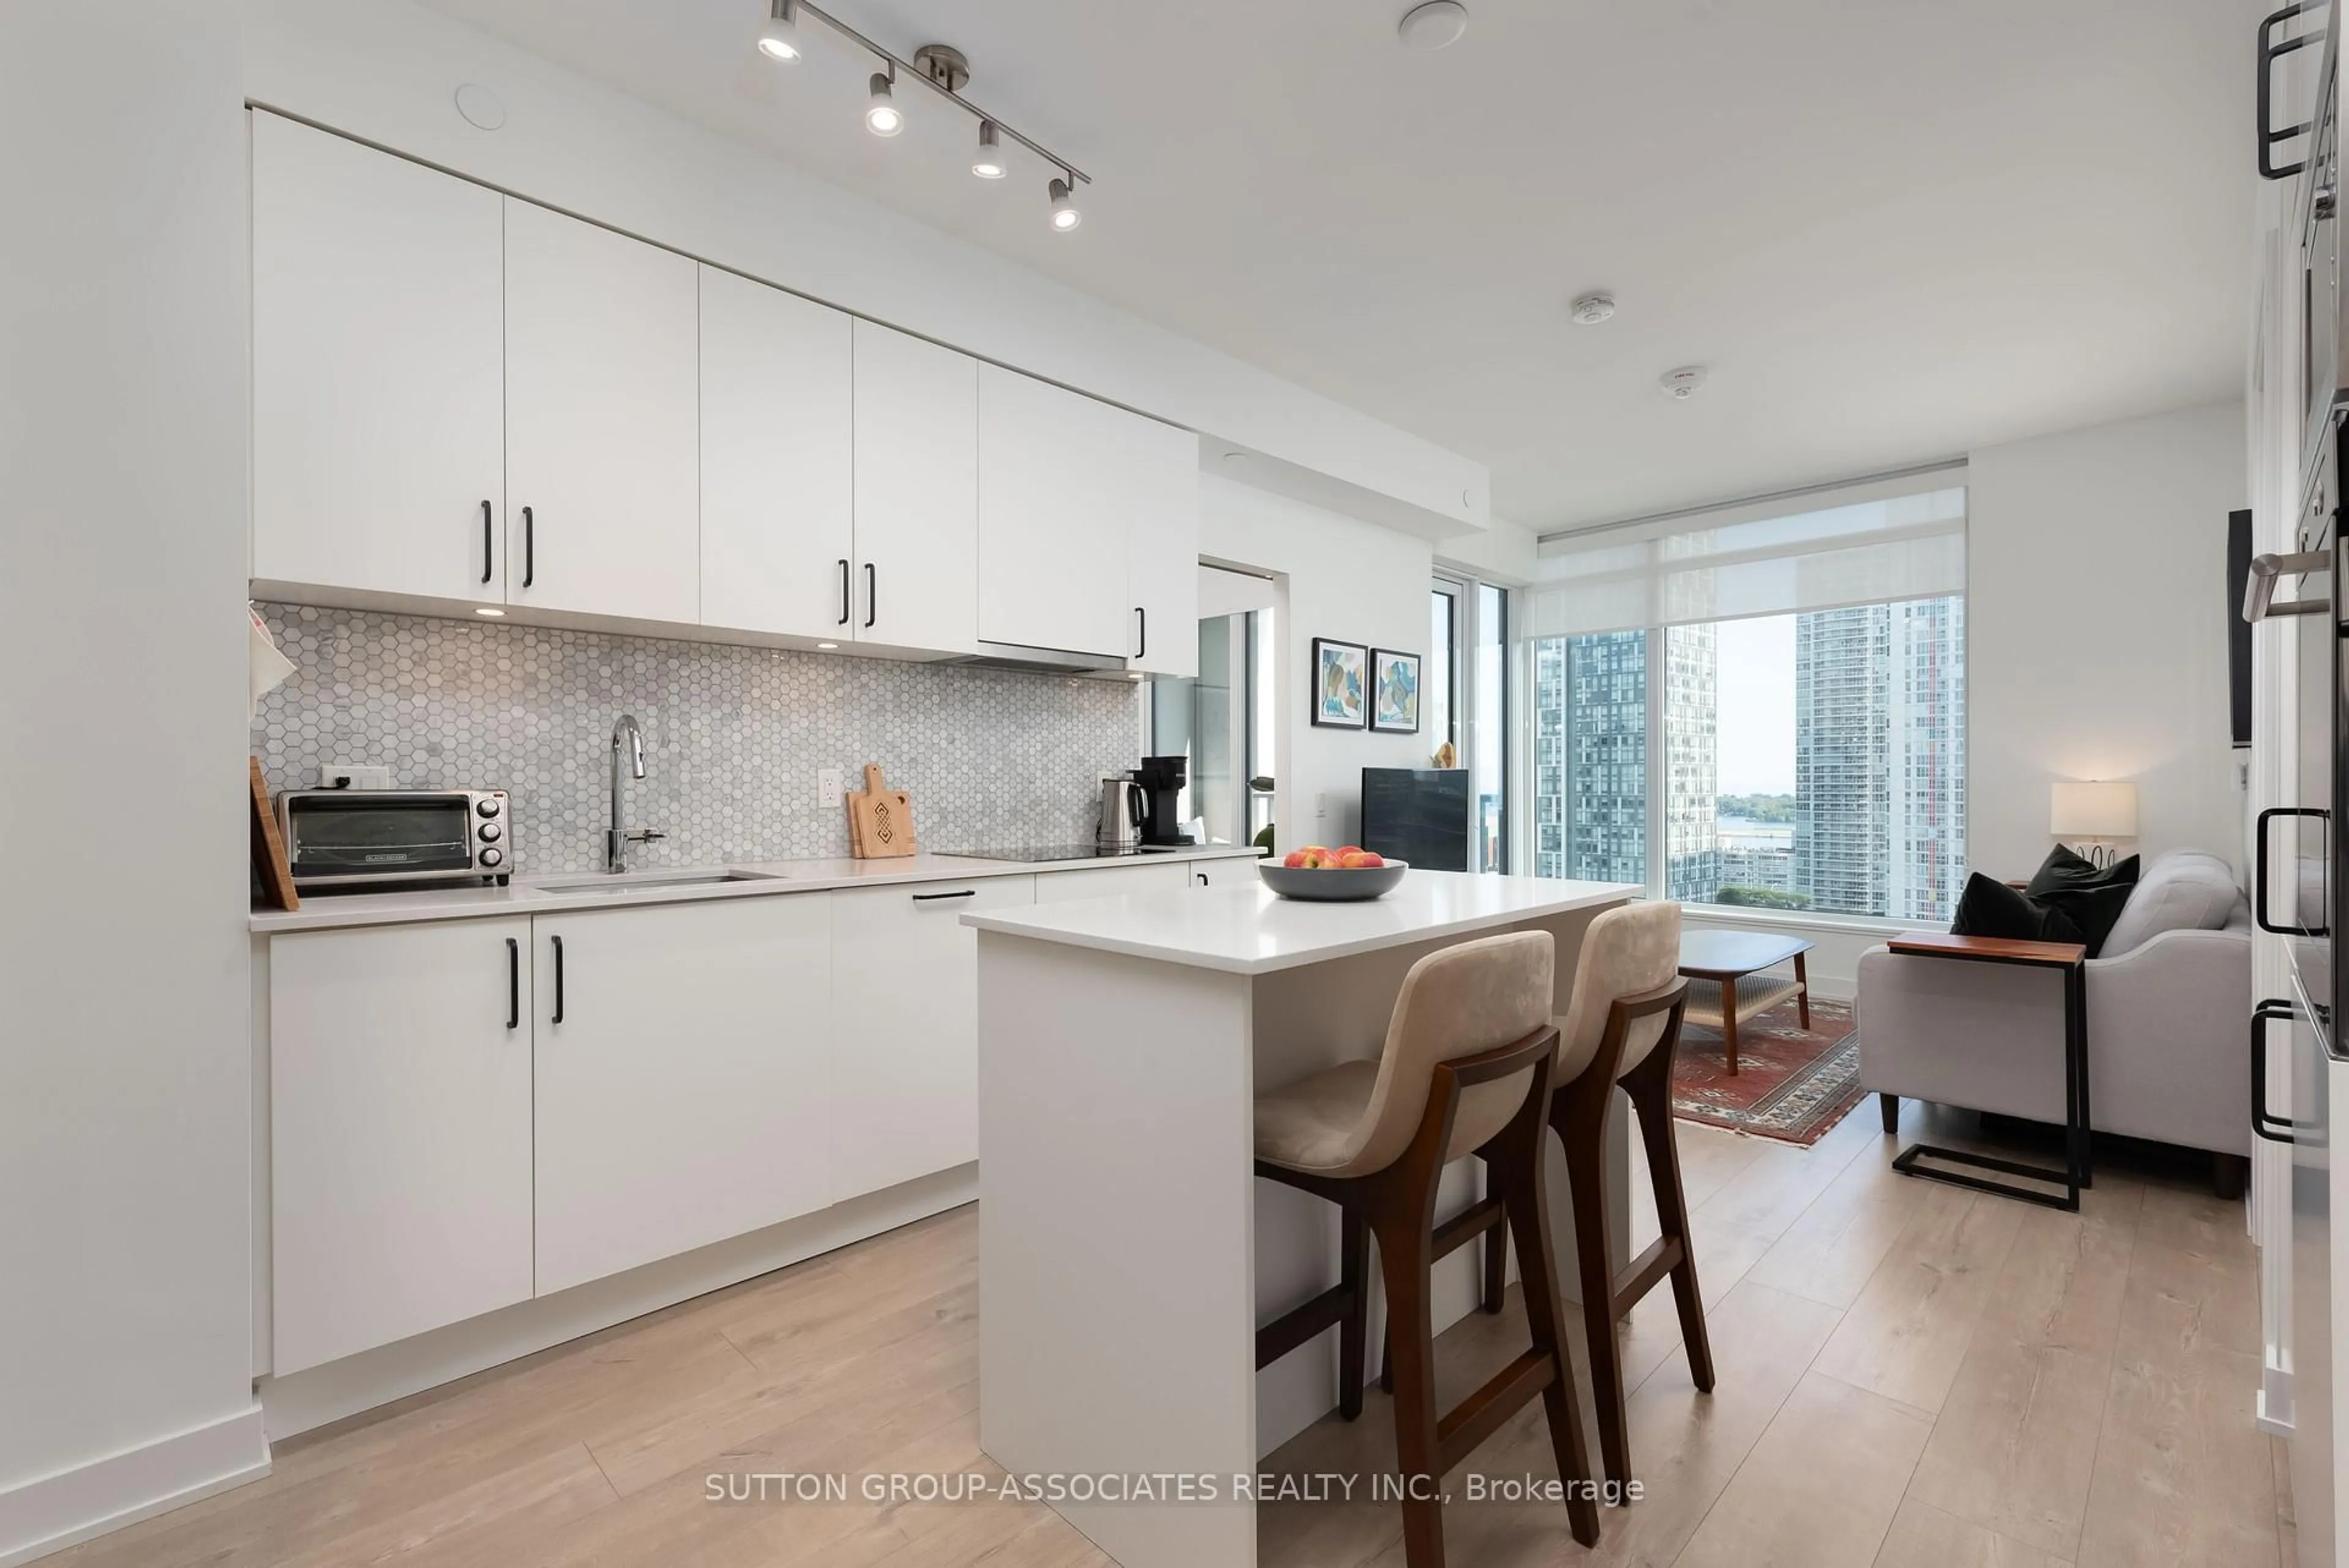
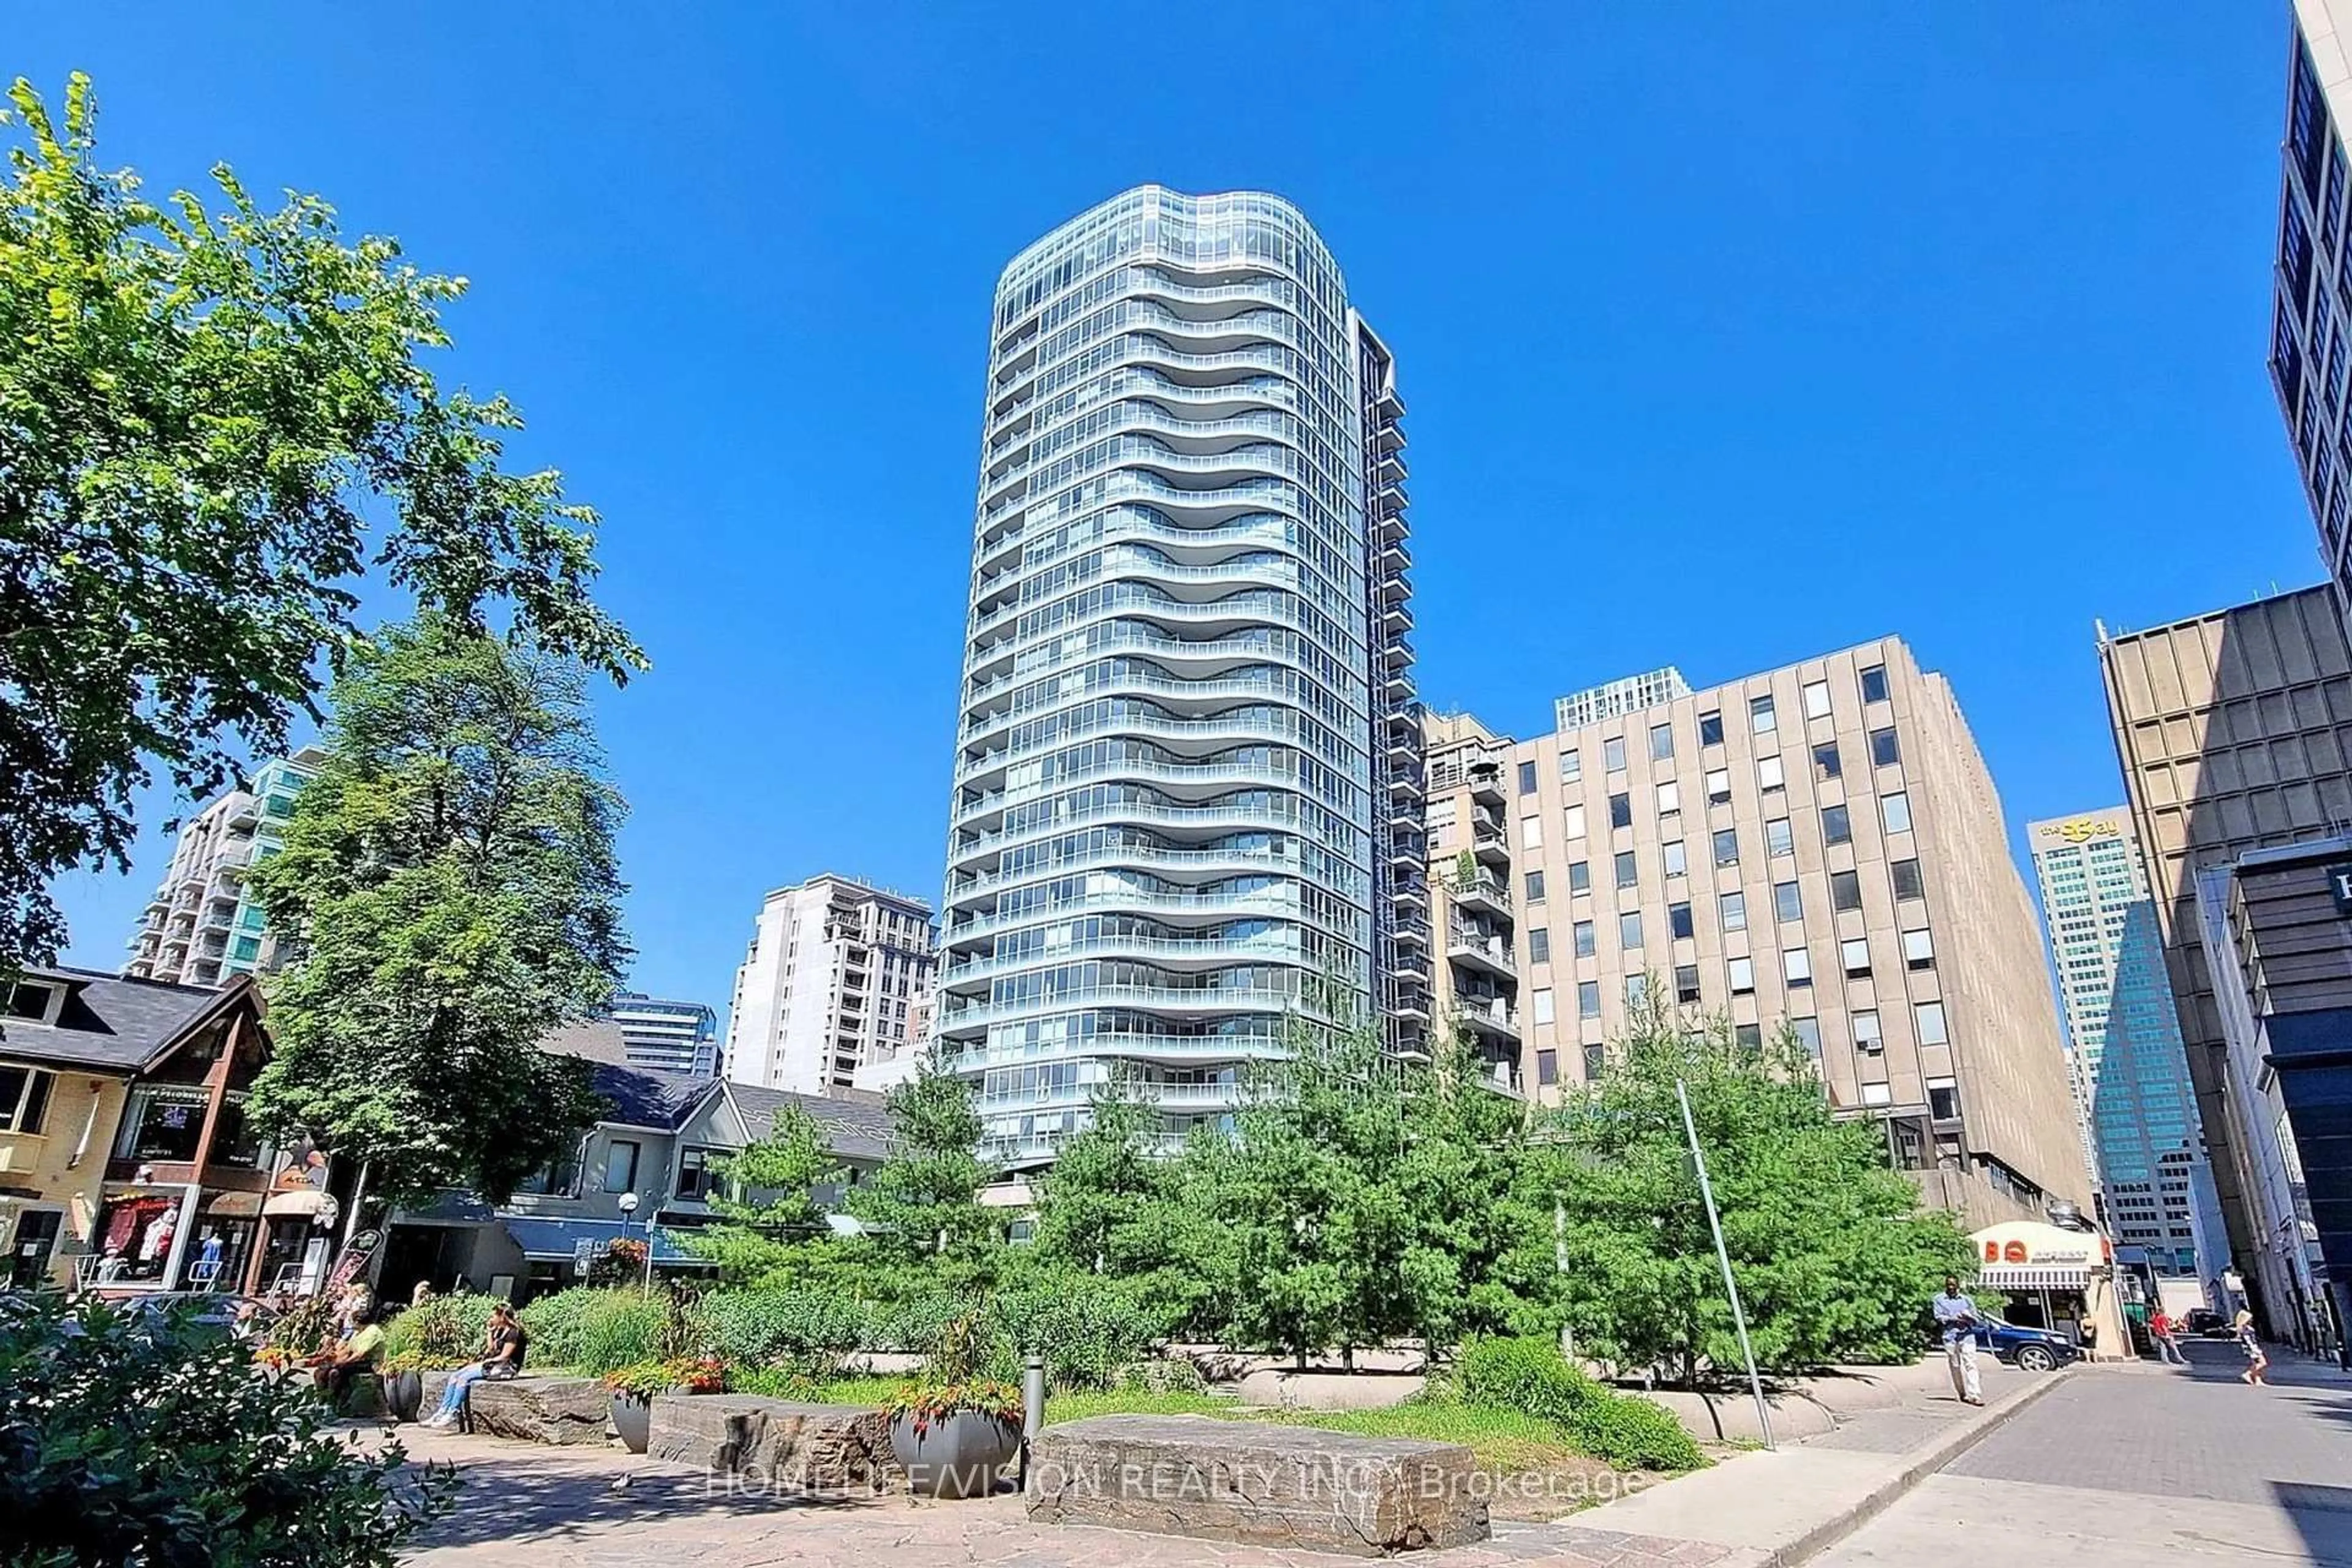
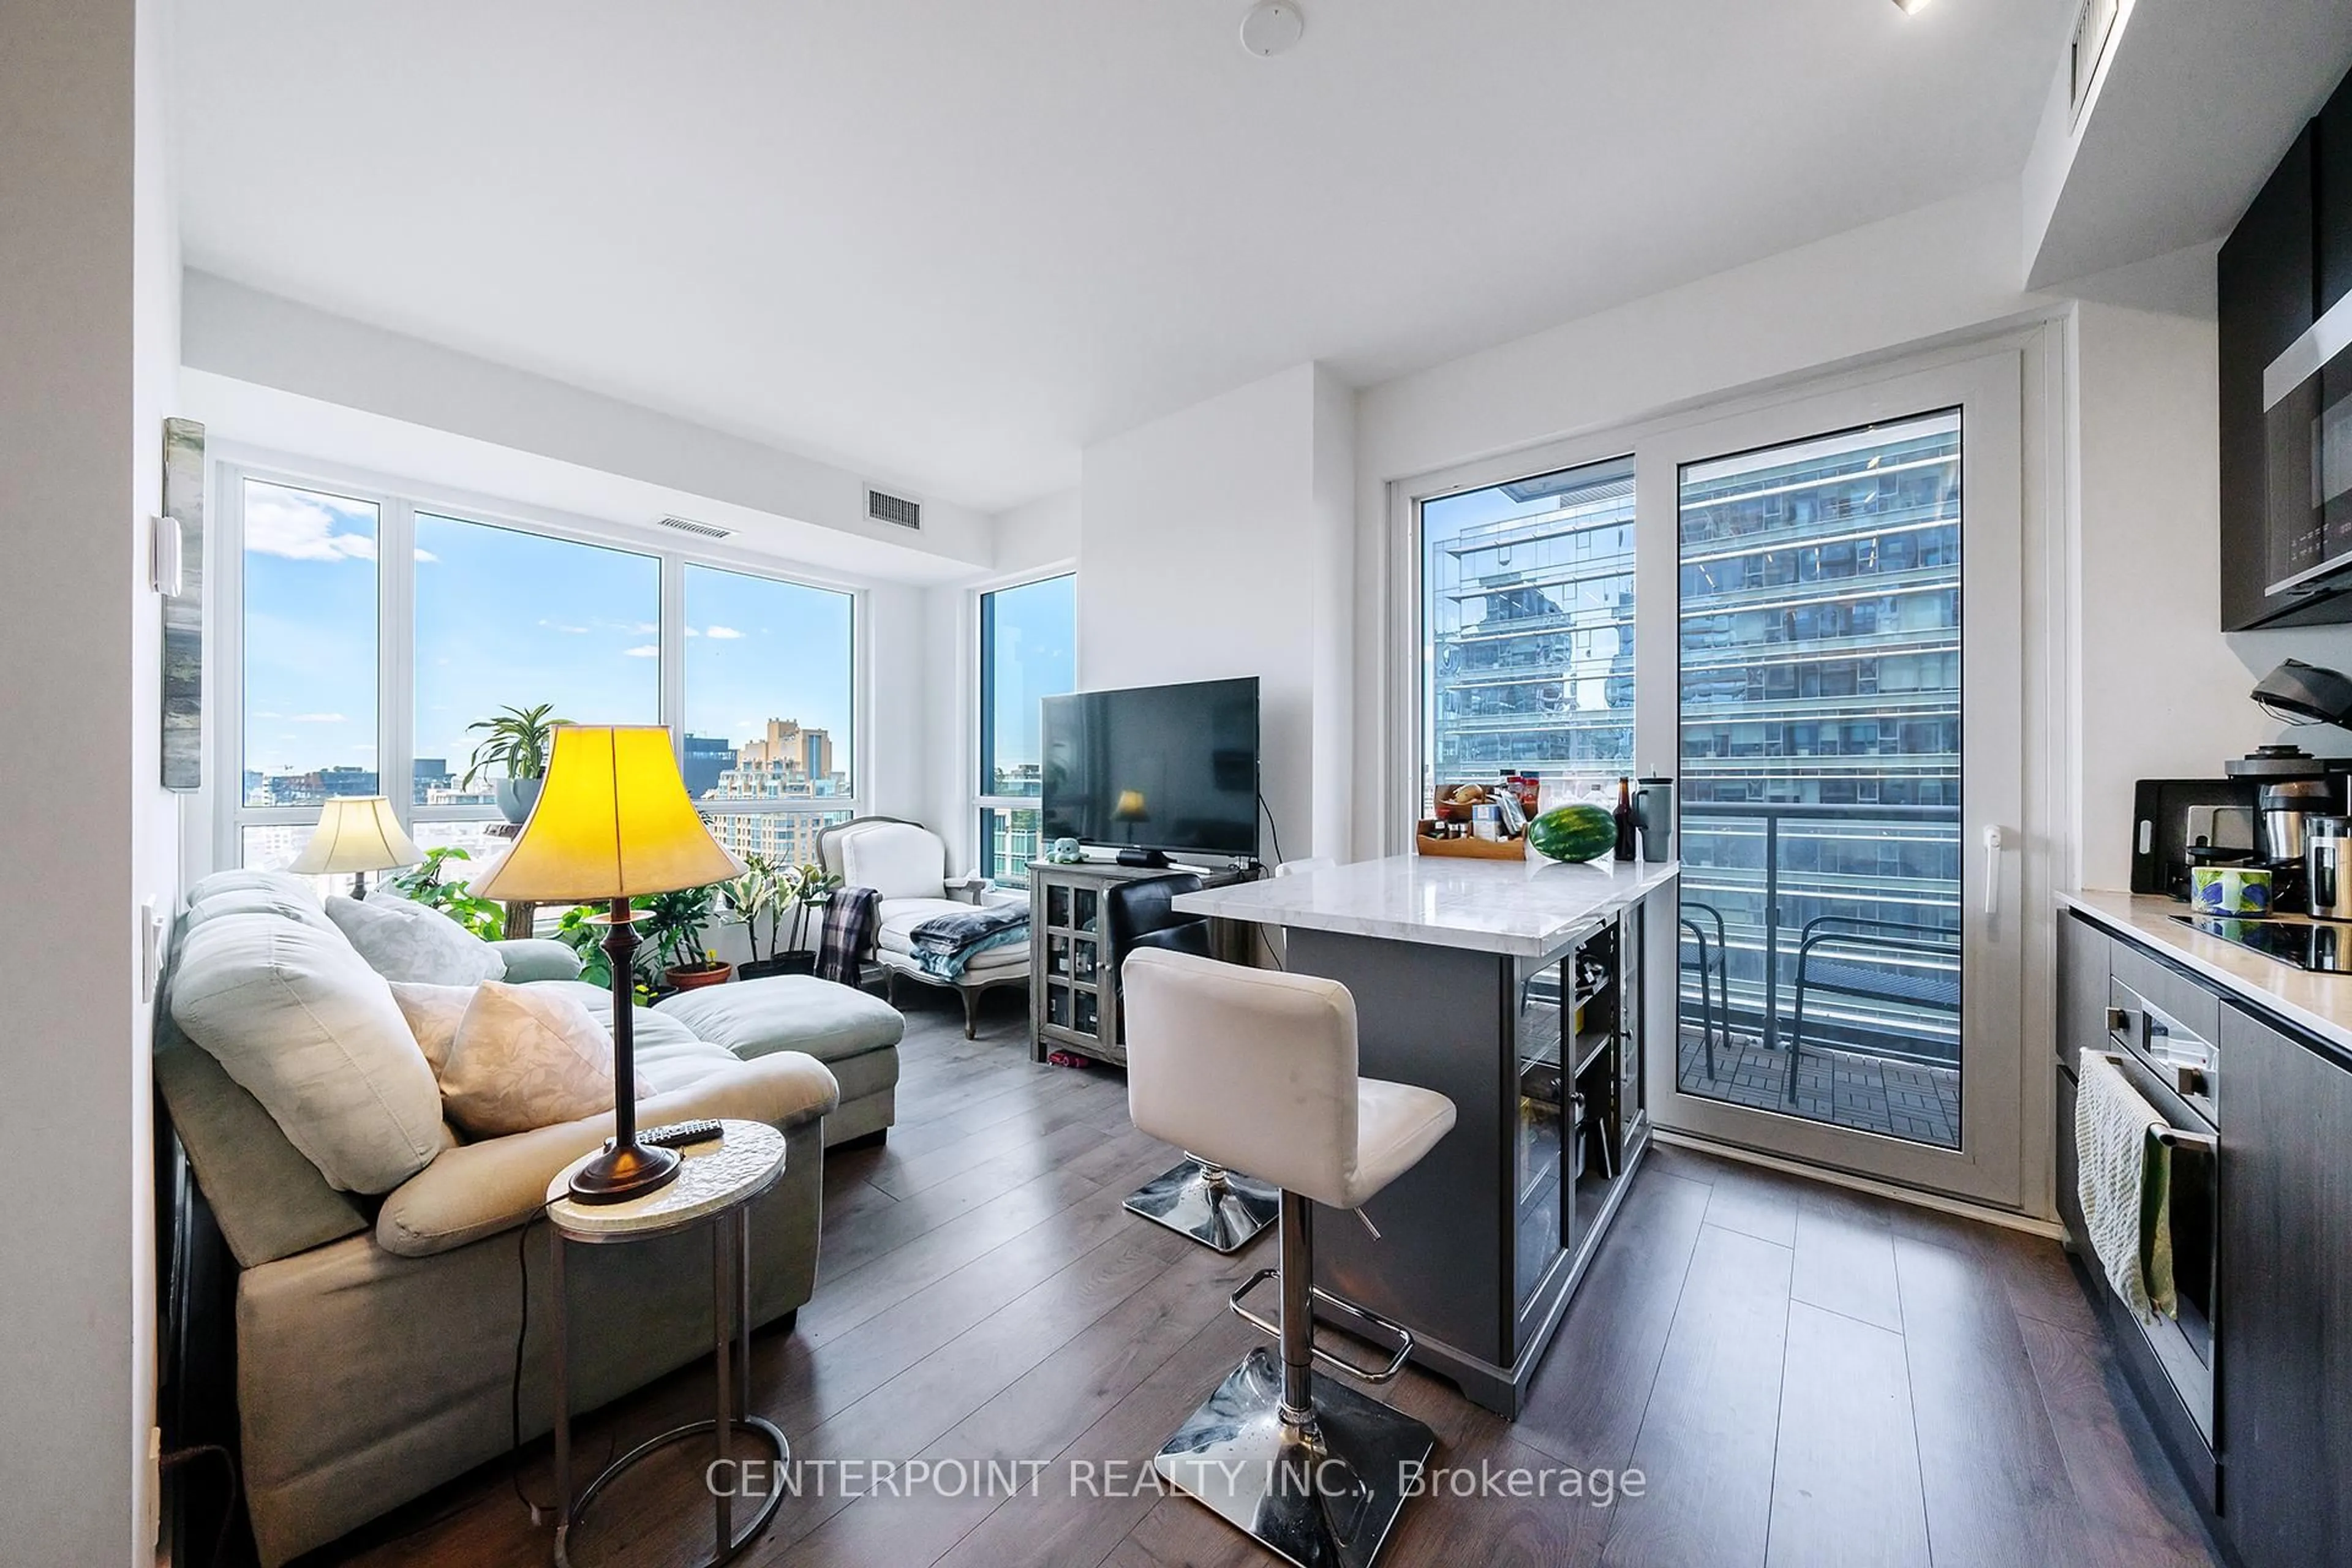
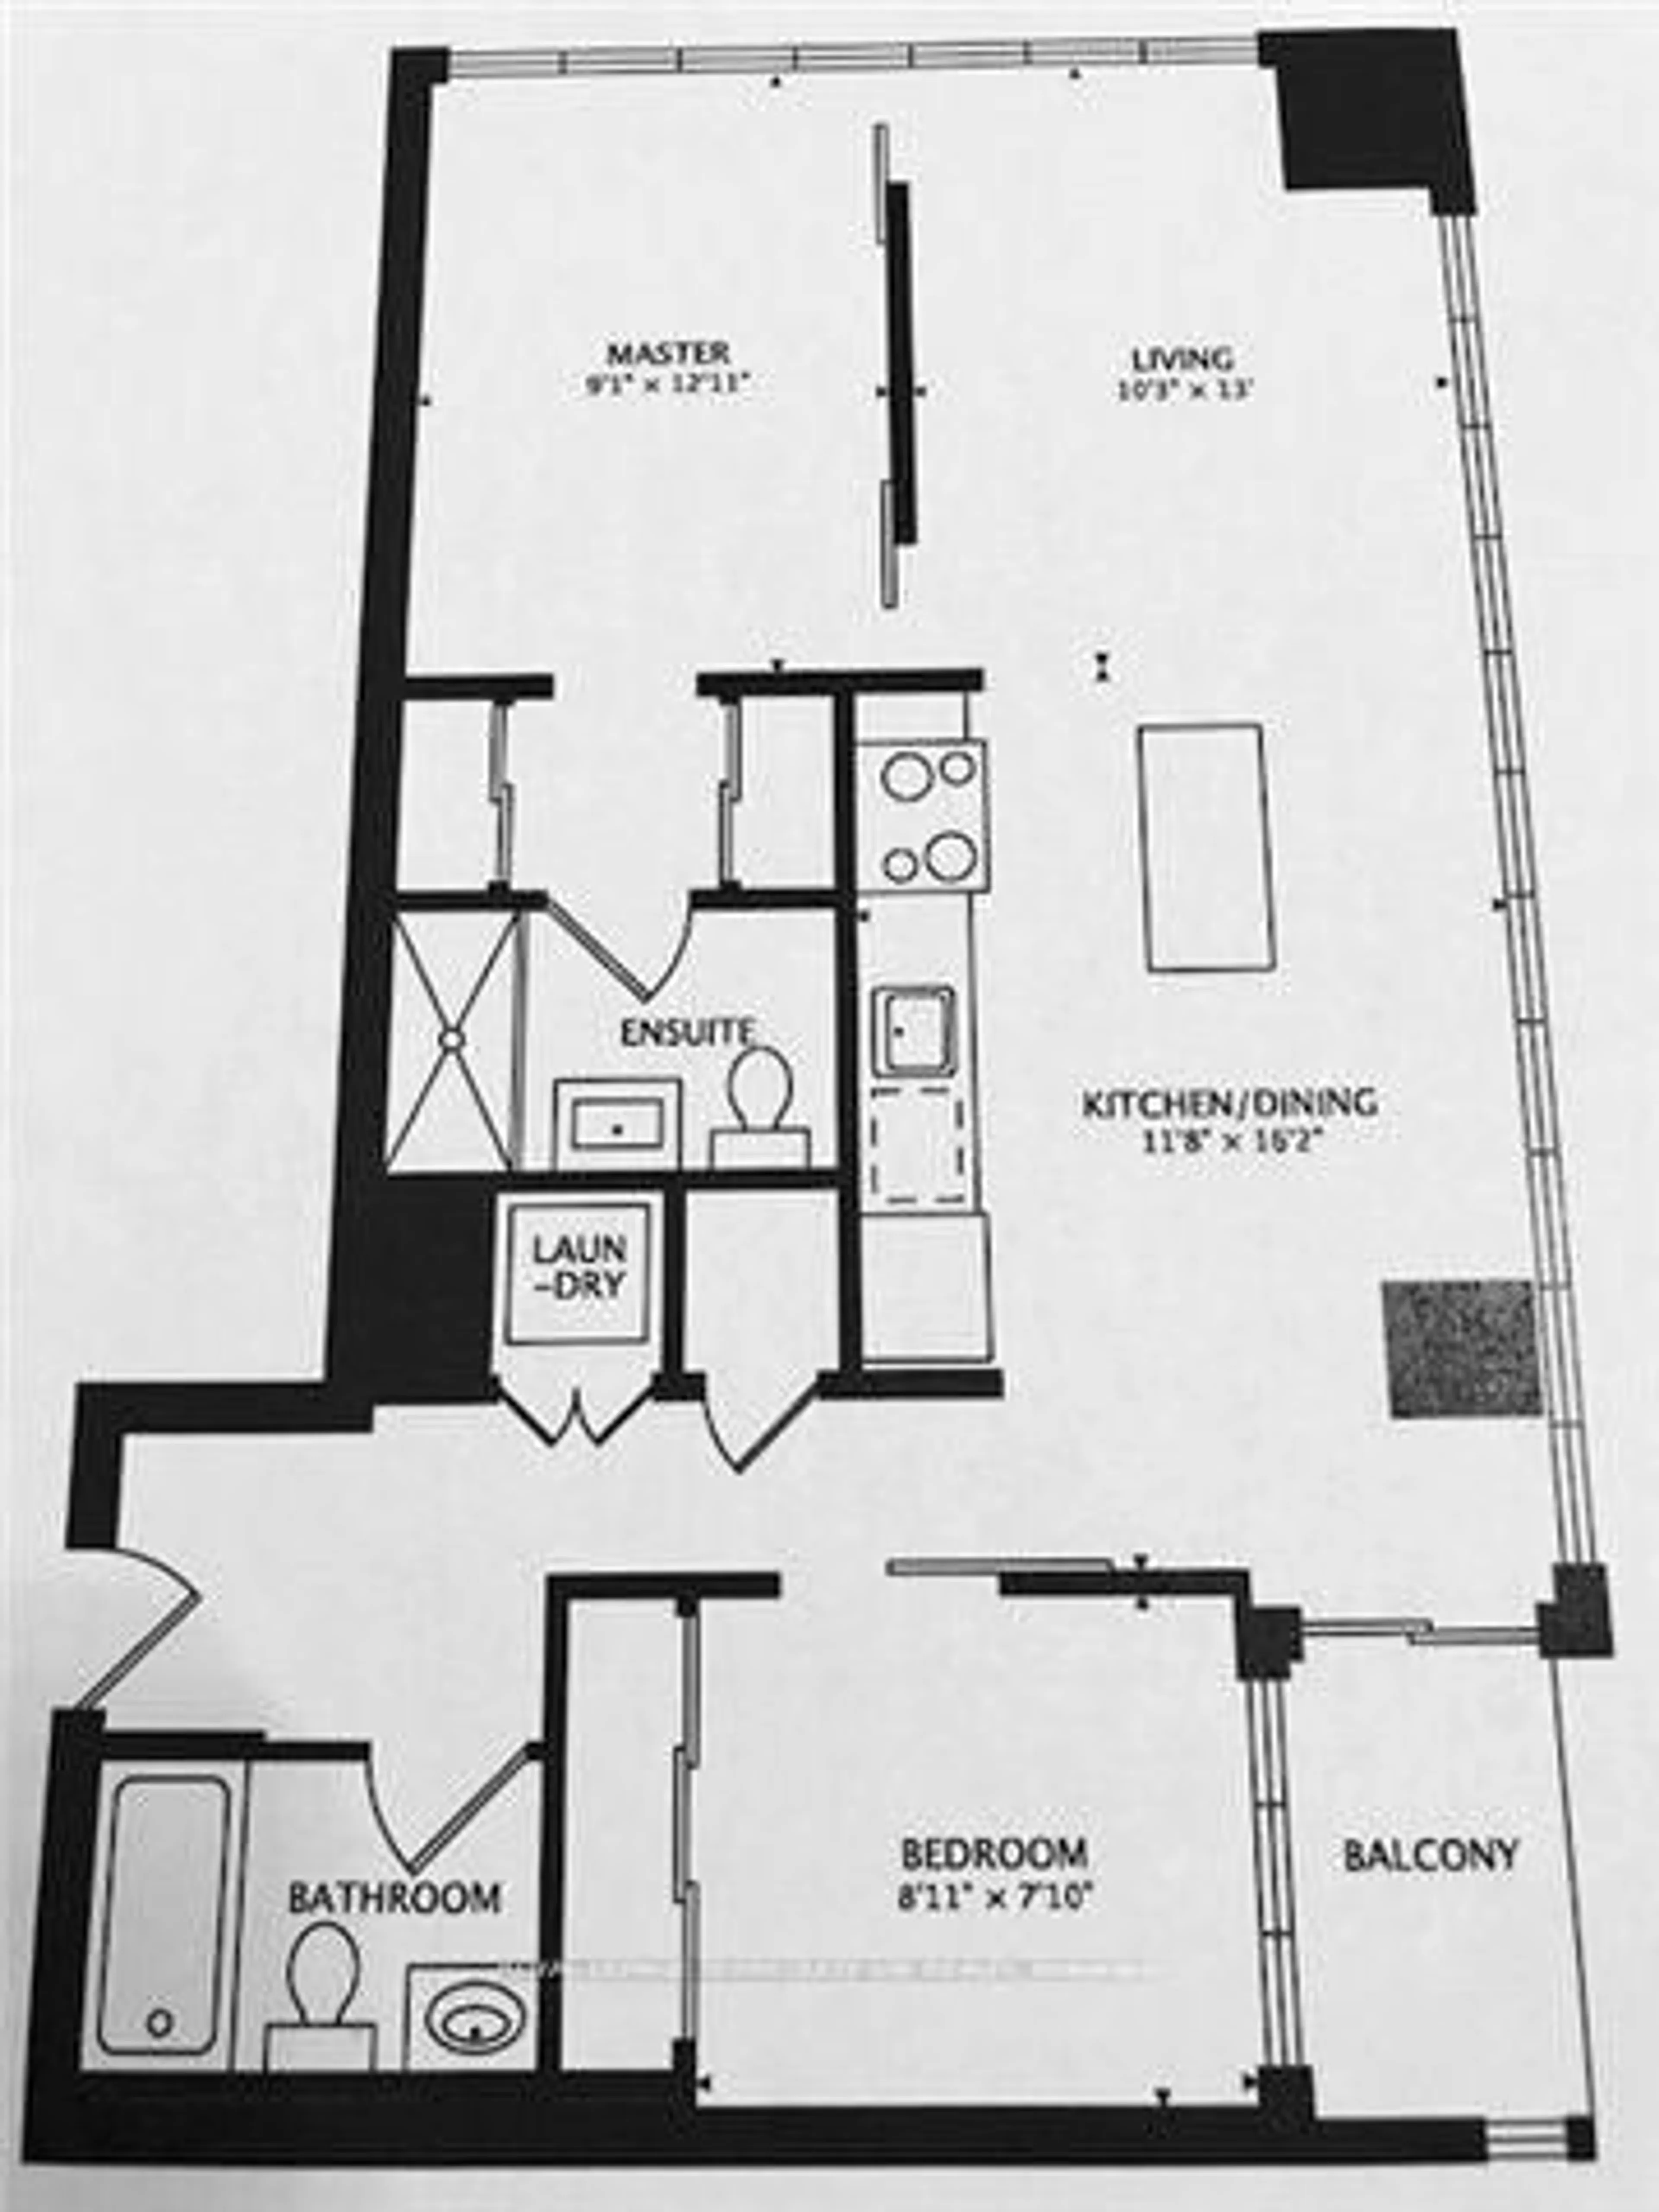
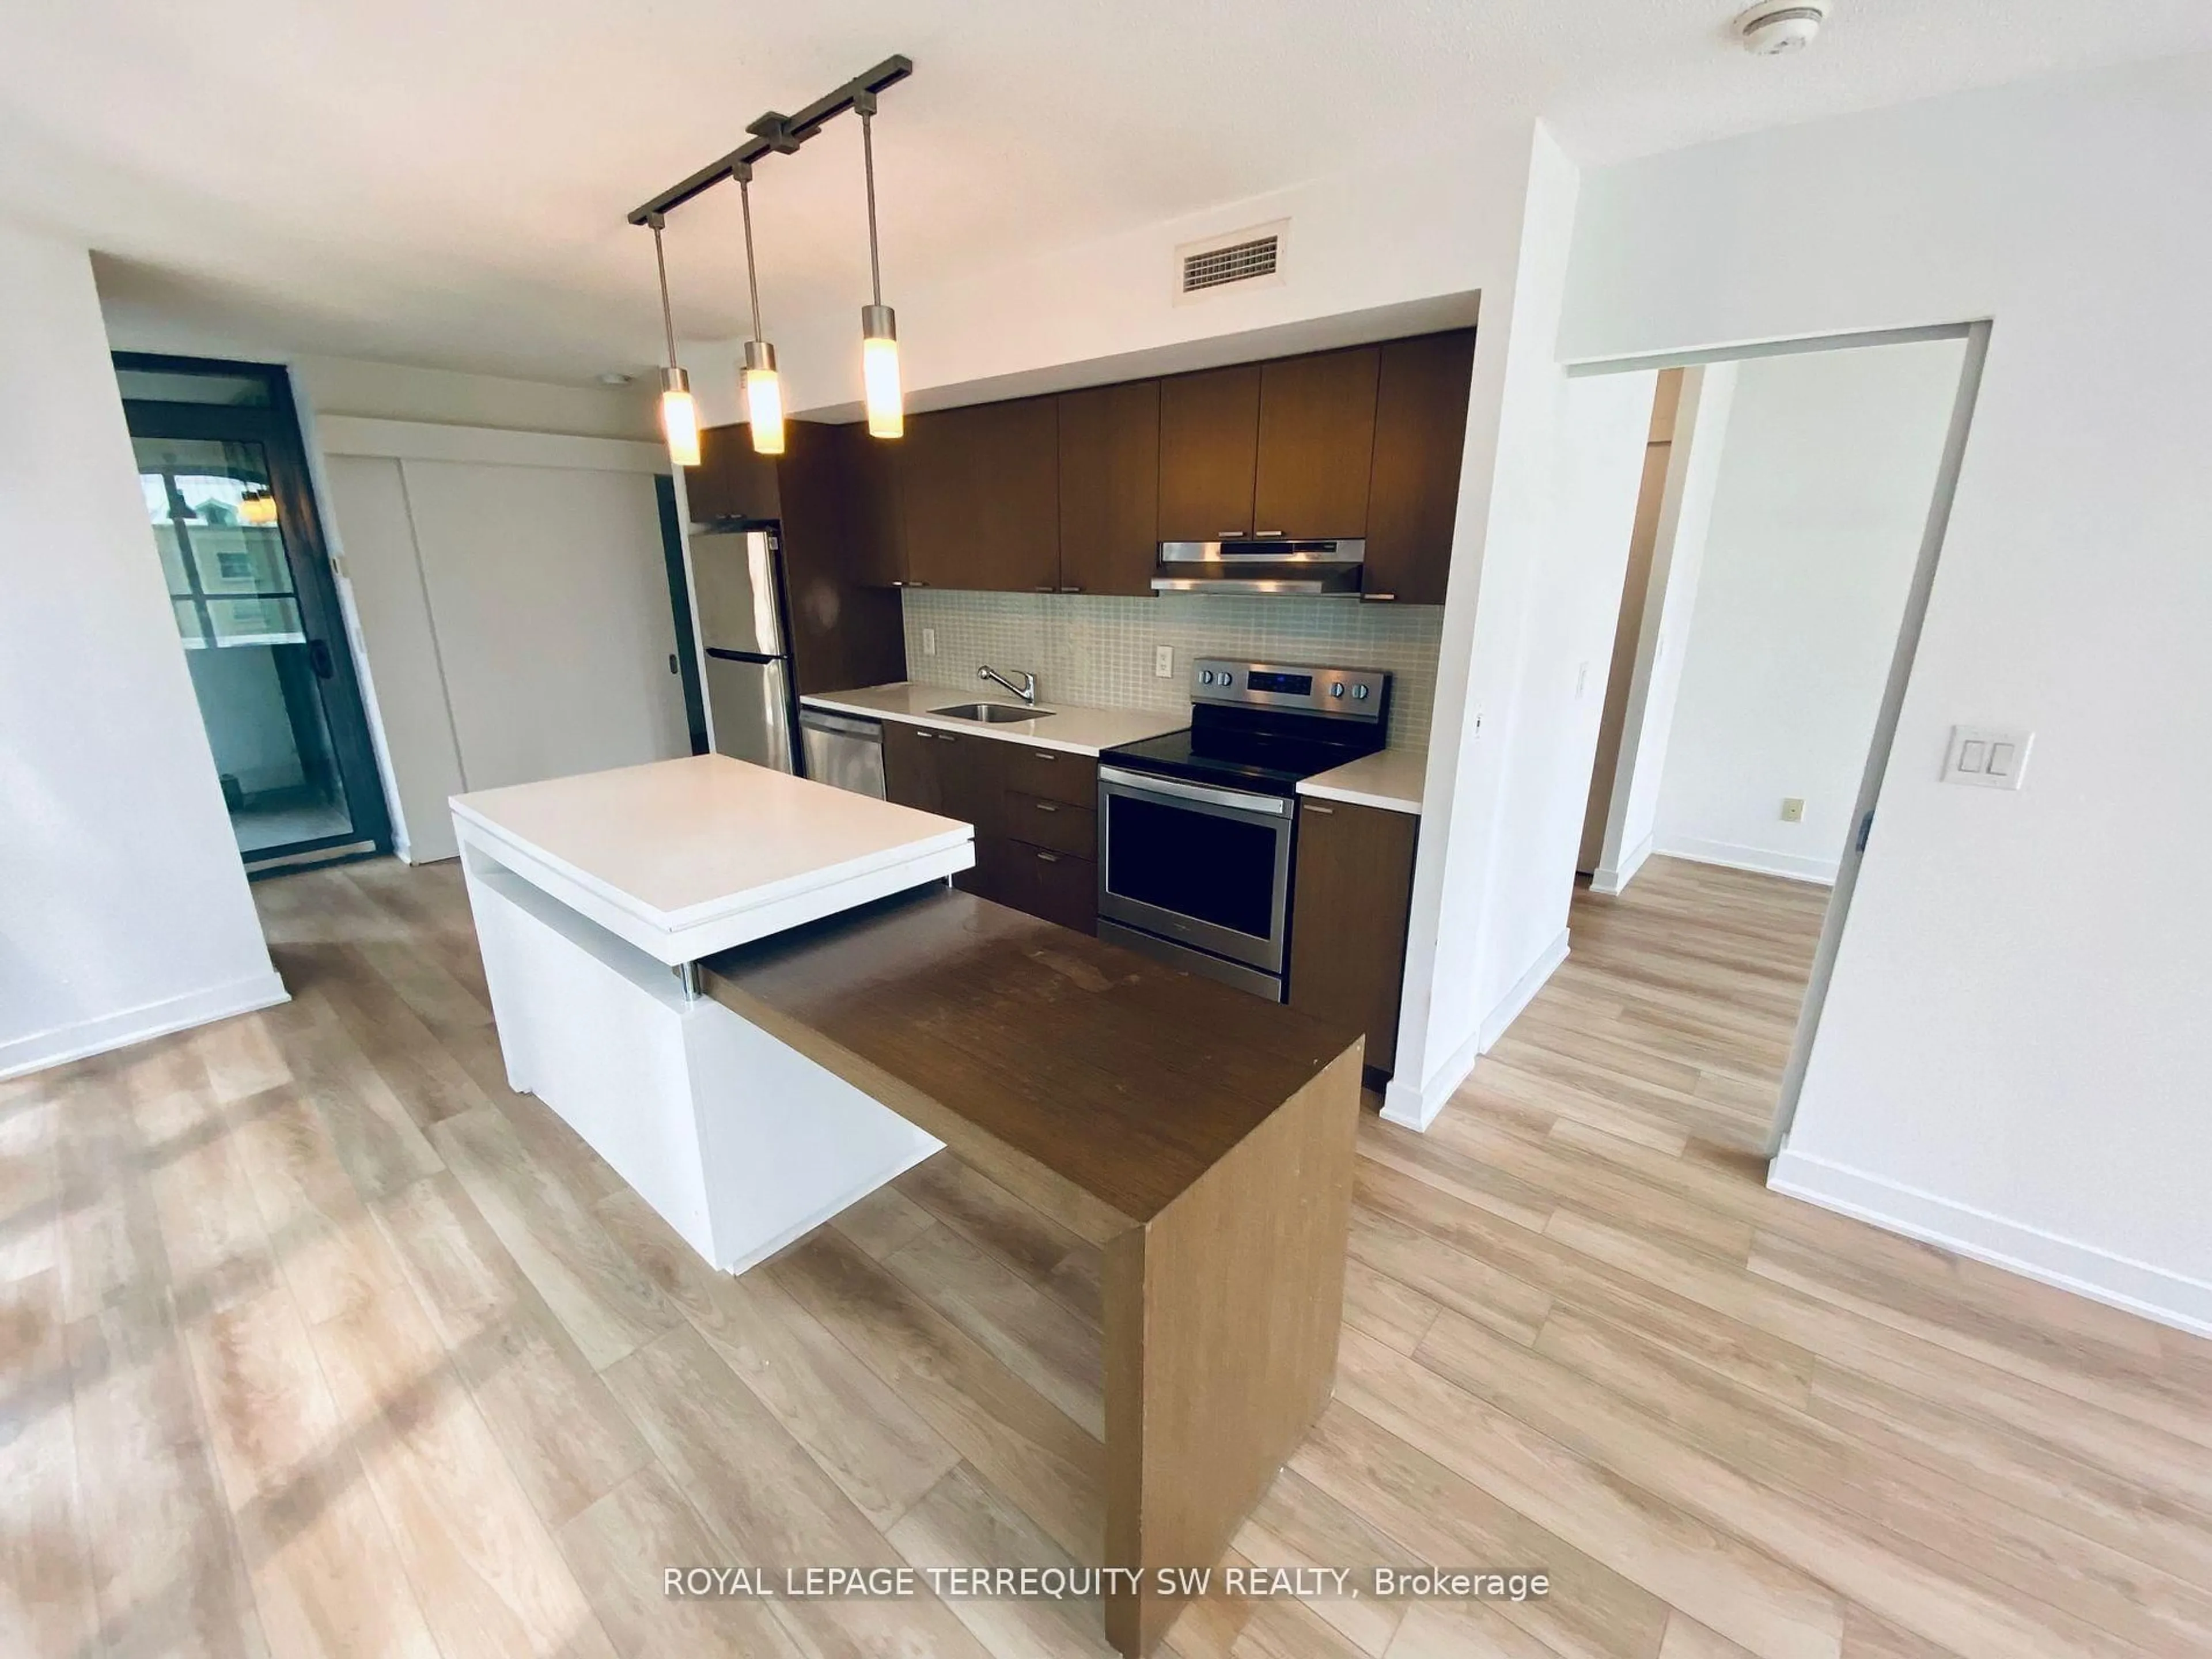
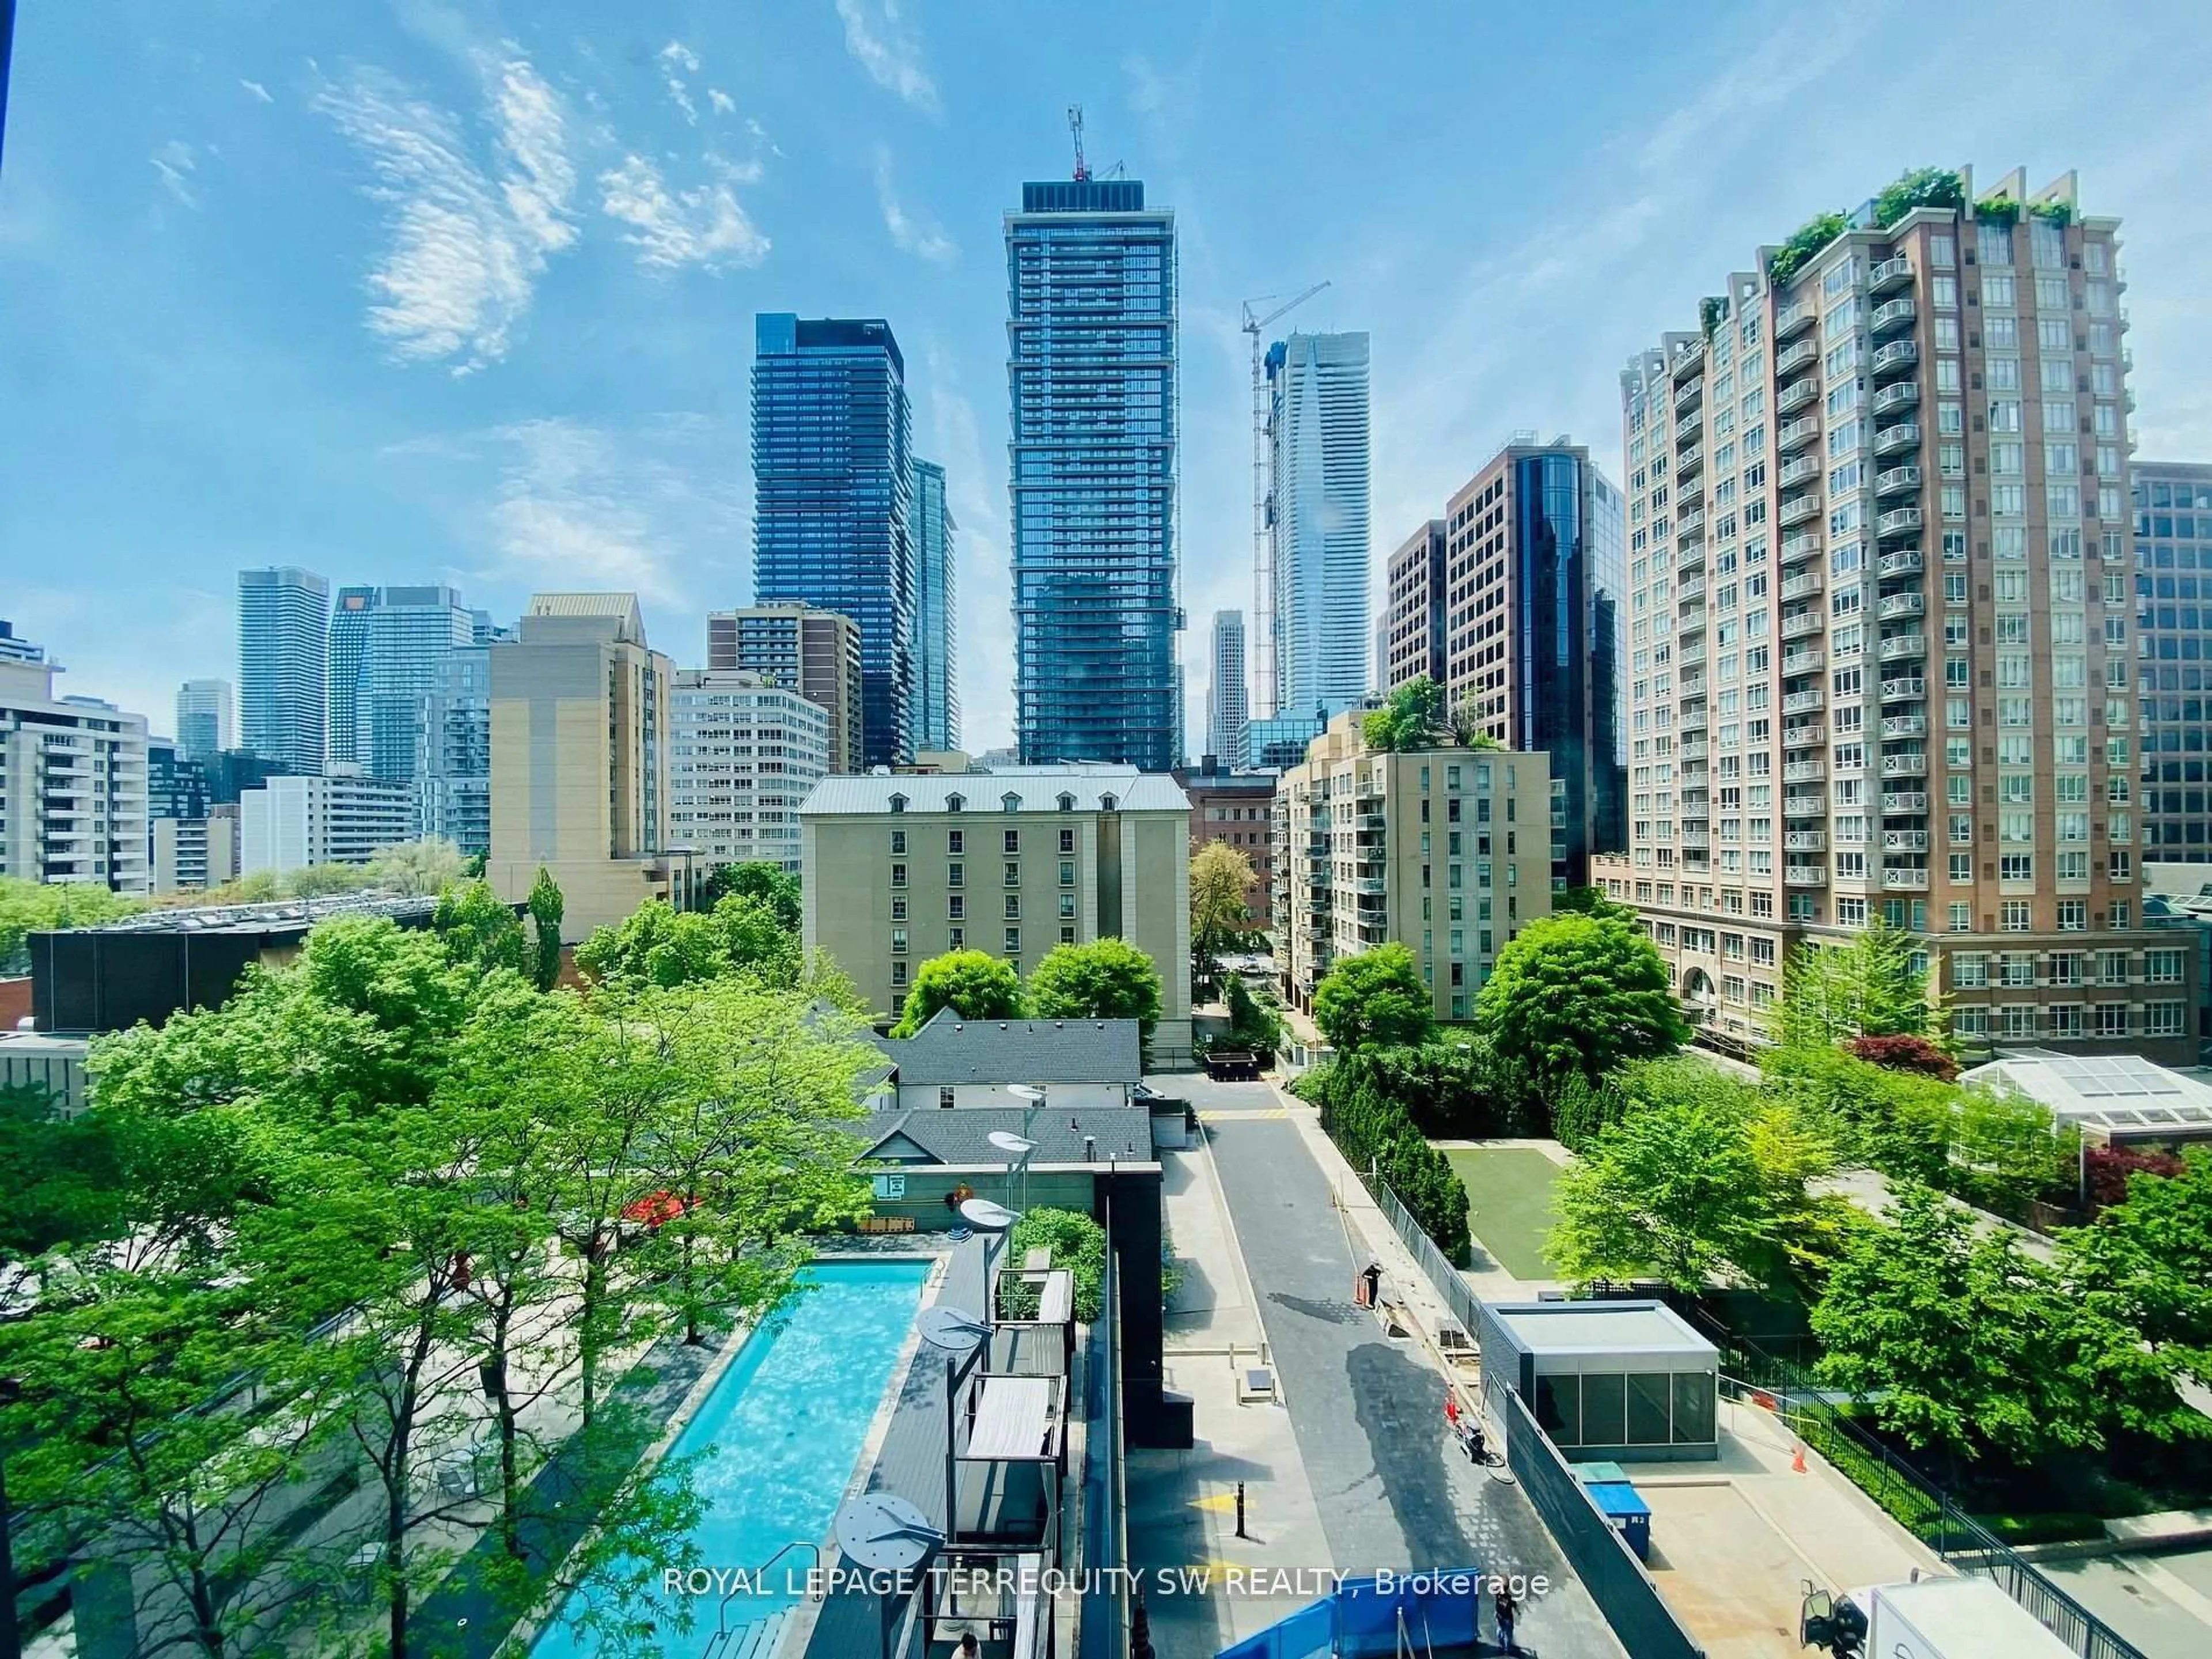
Luxury Living At One Of Toronto's Premier Addresses, The X! Ultra Modern Two Bedroom Corner Plan With Floor To Ceiling Windows! Unit Is Meticulously Finished & Includes A Custom Kitchen With Pull Out Dining Room Table, Custom Lighting & Wood Floors Throughout + Overlooking The Sleek Outdoor Pool Deck. Walk To All The Conveniences Of Dt Living With Shops, Restaurants, Markets & TTC Nearby + Resort Style Amenities & 24Hr Concierge! Parking Included


Property Details

StyleApartment
ViewCity, Clear, Skyline, Pool, Panoramic
Age of property-
SqFt~800-899 SqFt
Lot Size-
Parking Spaces1
MLS ®NumberC12419088
Community NameChurch-Yonge Corridor
Data SourceTRREB
Listing byROYAL LEPAGE TERREQUITY SW REALTY

Features

Heating: Forced Air
Cooling: Central Air

Main Floor

Br

2.74 x 2.46

hardwood floor / Closet / Window

Living

9.17 x 3.12

hardwood floor / Combined W/Dining / Open Concept

Dining

9.17 x 3.12

hardwood floor / Combined W/Living / W/O To Balcony

Kitchen

9.17 x 3.12

hardwood floor / Combined W/Dining / Centre Island


Features

Patio: Open
Balcony: Open

Parking

Garage spaces 1

Garage type Underground

Other parking spaces 0

Total parking spaces 1


7Story
Inclusions
Hydro
Water
Parking
Cable
Heat

Property History

Sep 22, 2025
ListedActive
$788,000
6 days on market
history photo preview32
Listing by trreb®

Market Data - Church-Yonge Corridor

Geo Zone Map ThumbnailChurch-Yonge Corridor

Strong Buyer's Market

View Market Data

Condo - for the past 30 days

Buyer's market Seller's market

Avg. Days on Market

Past 30 days

45 days

Compared to

2024

34 days

2023

26 days

2022

26 days

New Listings

Past 30 days

146 listings

Compared to

2024

125 listings

2023

177 listings

2022

125 listings

Units sold

Past 30 days

38 units

Compared to

2024

36 units

2023

43 units

2022

46 units

Median Sold Price

Past 30 days

$573,500

Compared to

2024

$677,500

2023

$696,000

2022

$684,000


Population and Demographics

Overview

Total population 40965
Average household income $118,874

Age (%)

0 to 19
8%
20 to 34
48%
35 to 49
19%
50 to 64
15%
65 and plus
10%

Household composition (%)

Single person
58%
Single family
29%
Multi person
13%
Multi family
0%

Mother tongue (%)

English
56%
Mandarin
15%
Yue (Cantonese)
4%
Spanish
4%
Korean
3%
French
3%
Arabic
3%
Others
2%
Russian
2%
Hindi
1%

House tenancy (%)

Renters
71%
Owners
29%

What’s nearby?Essentials within 5 km

Local Logic

Transportation Scores

Estimated Budget