Unknown for 54 Wilmont Dr, Toronto Ontario M3N 1N6
70 days on Market

54 Wilmont Dr, Toronto, Ontario M3N 1N6

Detached
3 + 4
3
~1100-1500 sqft
$1,388,800
Get pre-qualifiedPowered by nesto
Buy with Wahi to get
Up to
$13,888Cashback
Detached
3 + 4
3
~1100-1500 sqft

Contact us about this property

Call

Highlights

Property Estimate

Days on market70 days

Estimated valueNot available

Price/Sqft$1,094/sqft

Monthly cost

Open Calculator

CMA Subject Property

Curious about what homes are selling for in this area?

Get a report on comparable homes with helpful insights and trends.

+4

Properties sold*

$1M

Median sold price*

*Based on last 30 days

Description

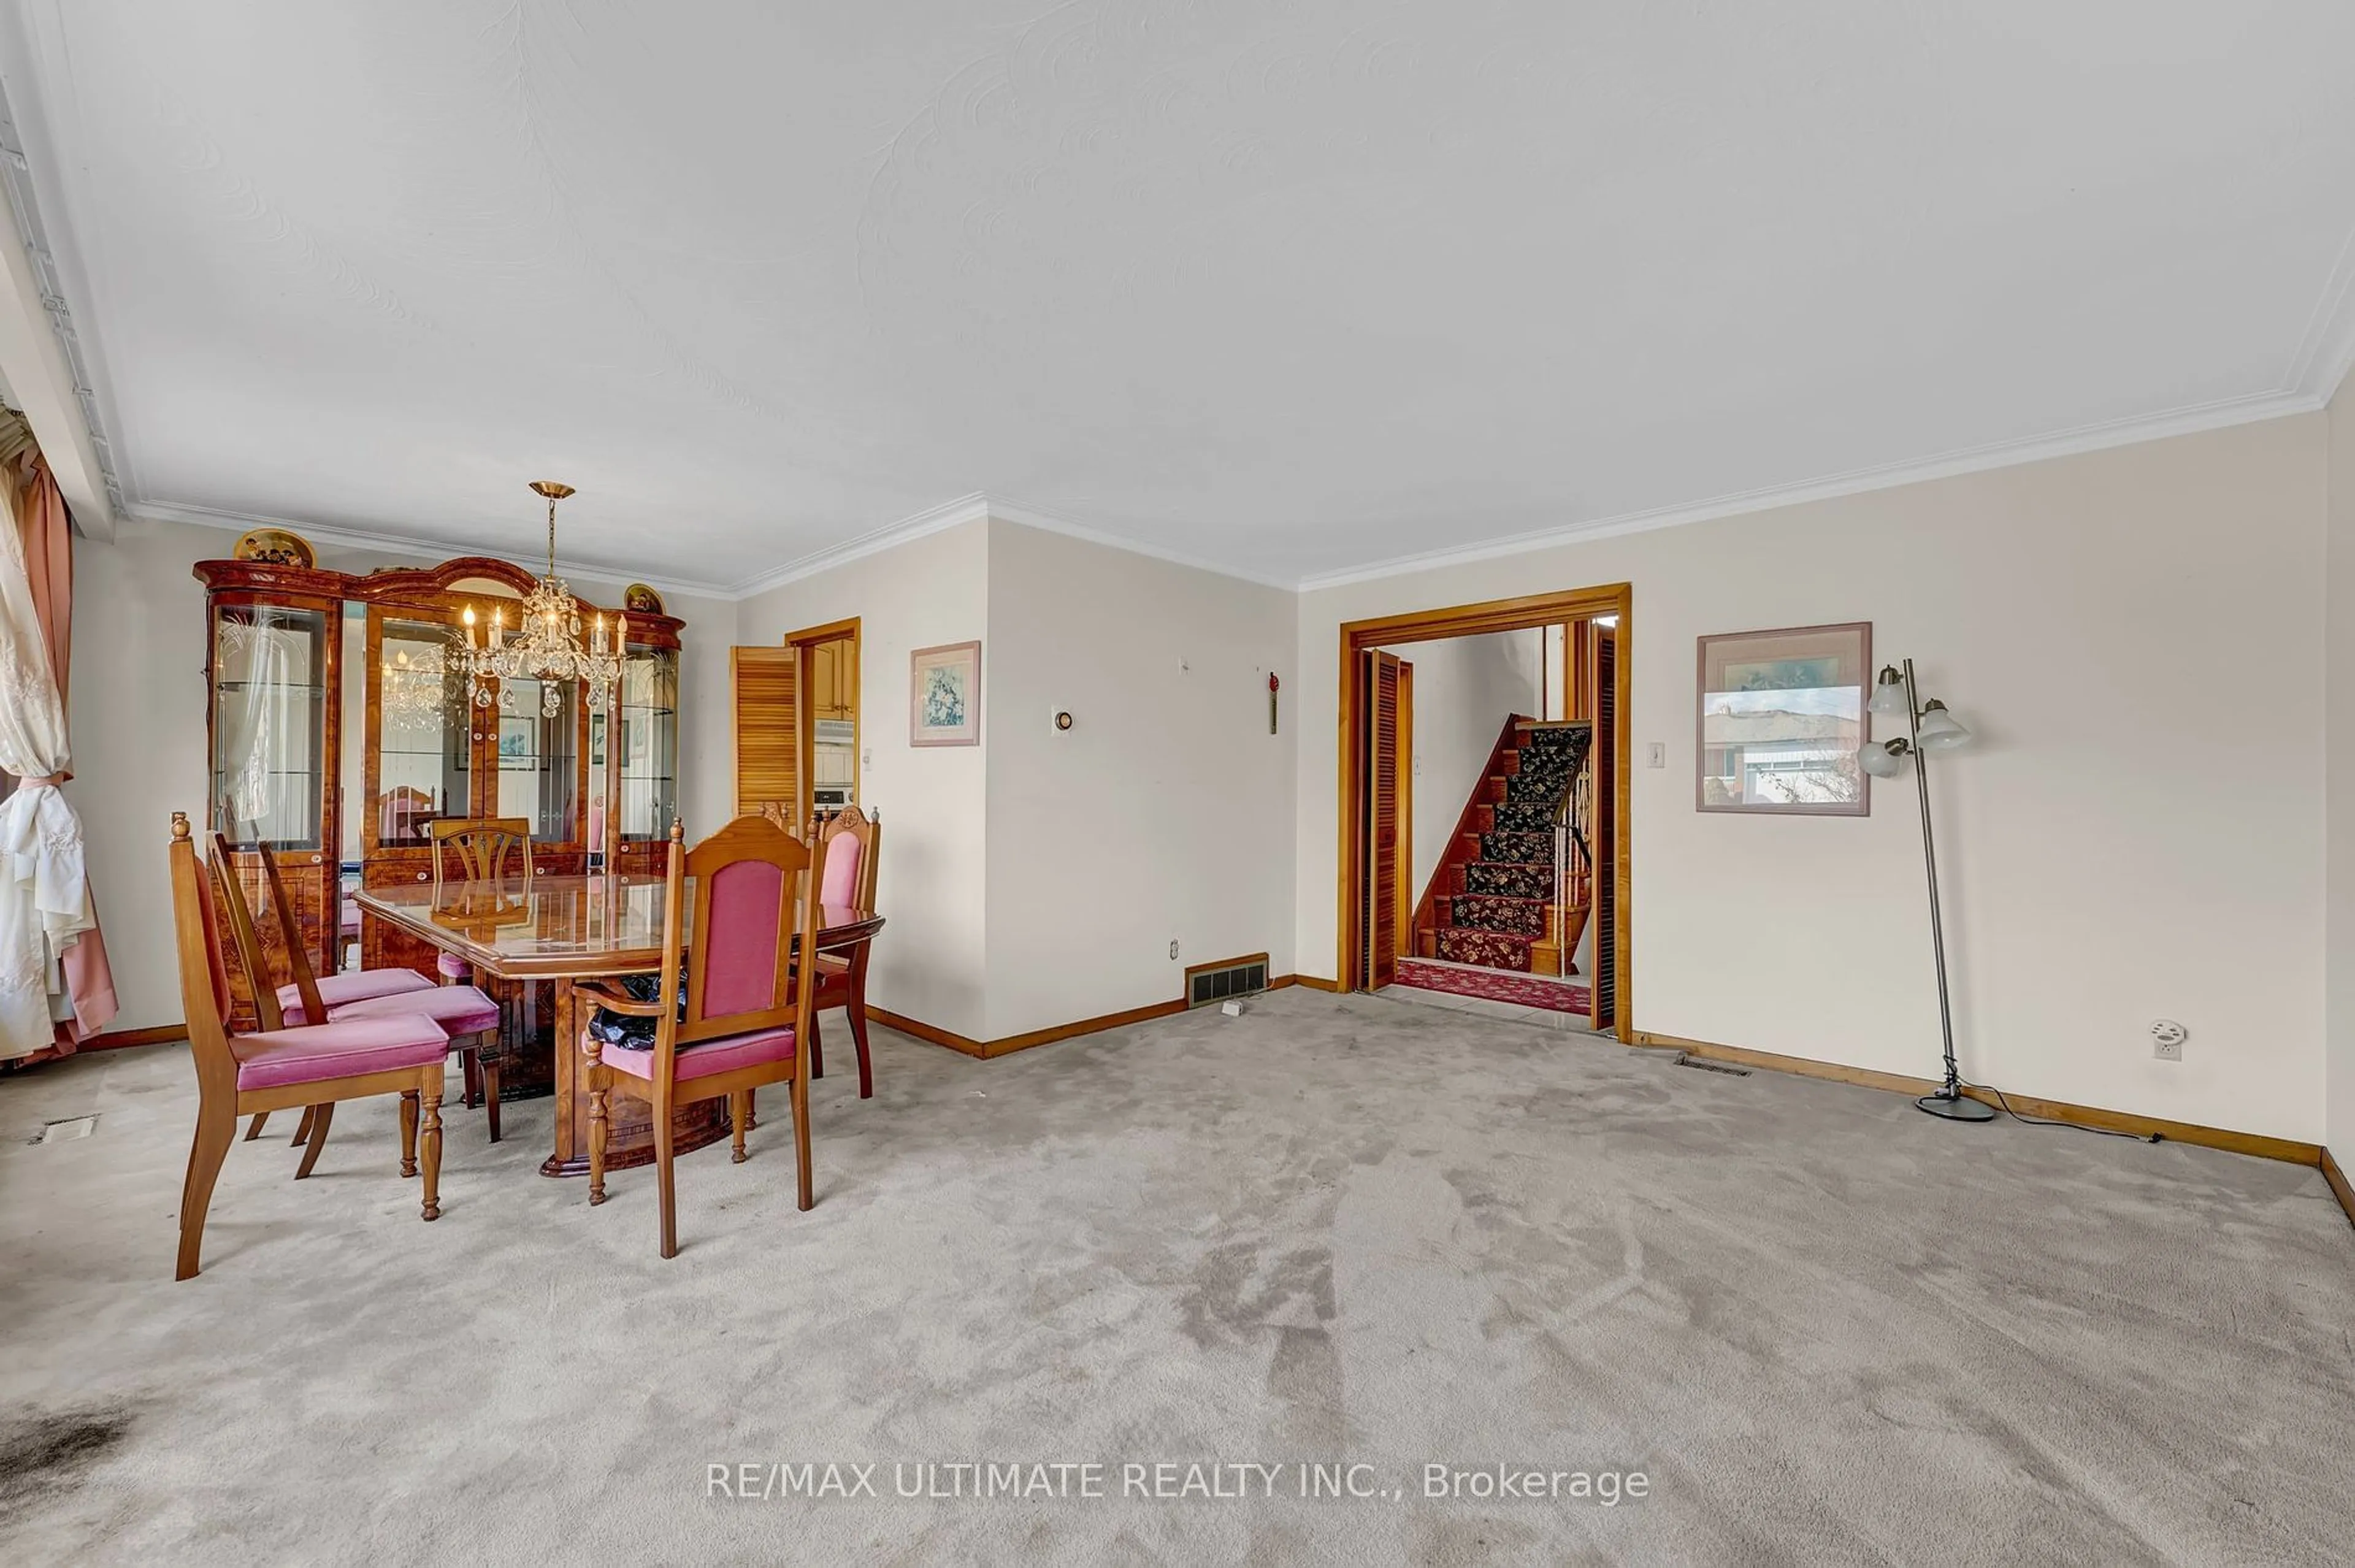
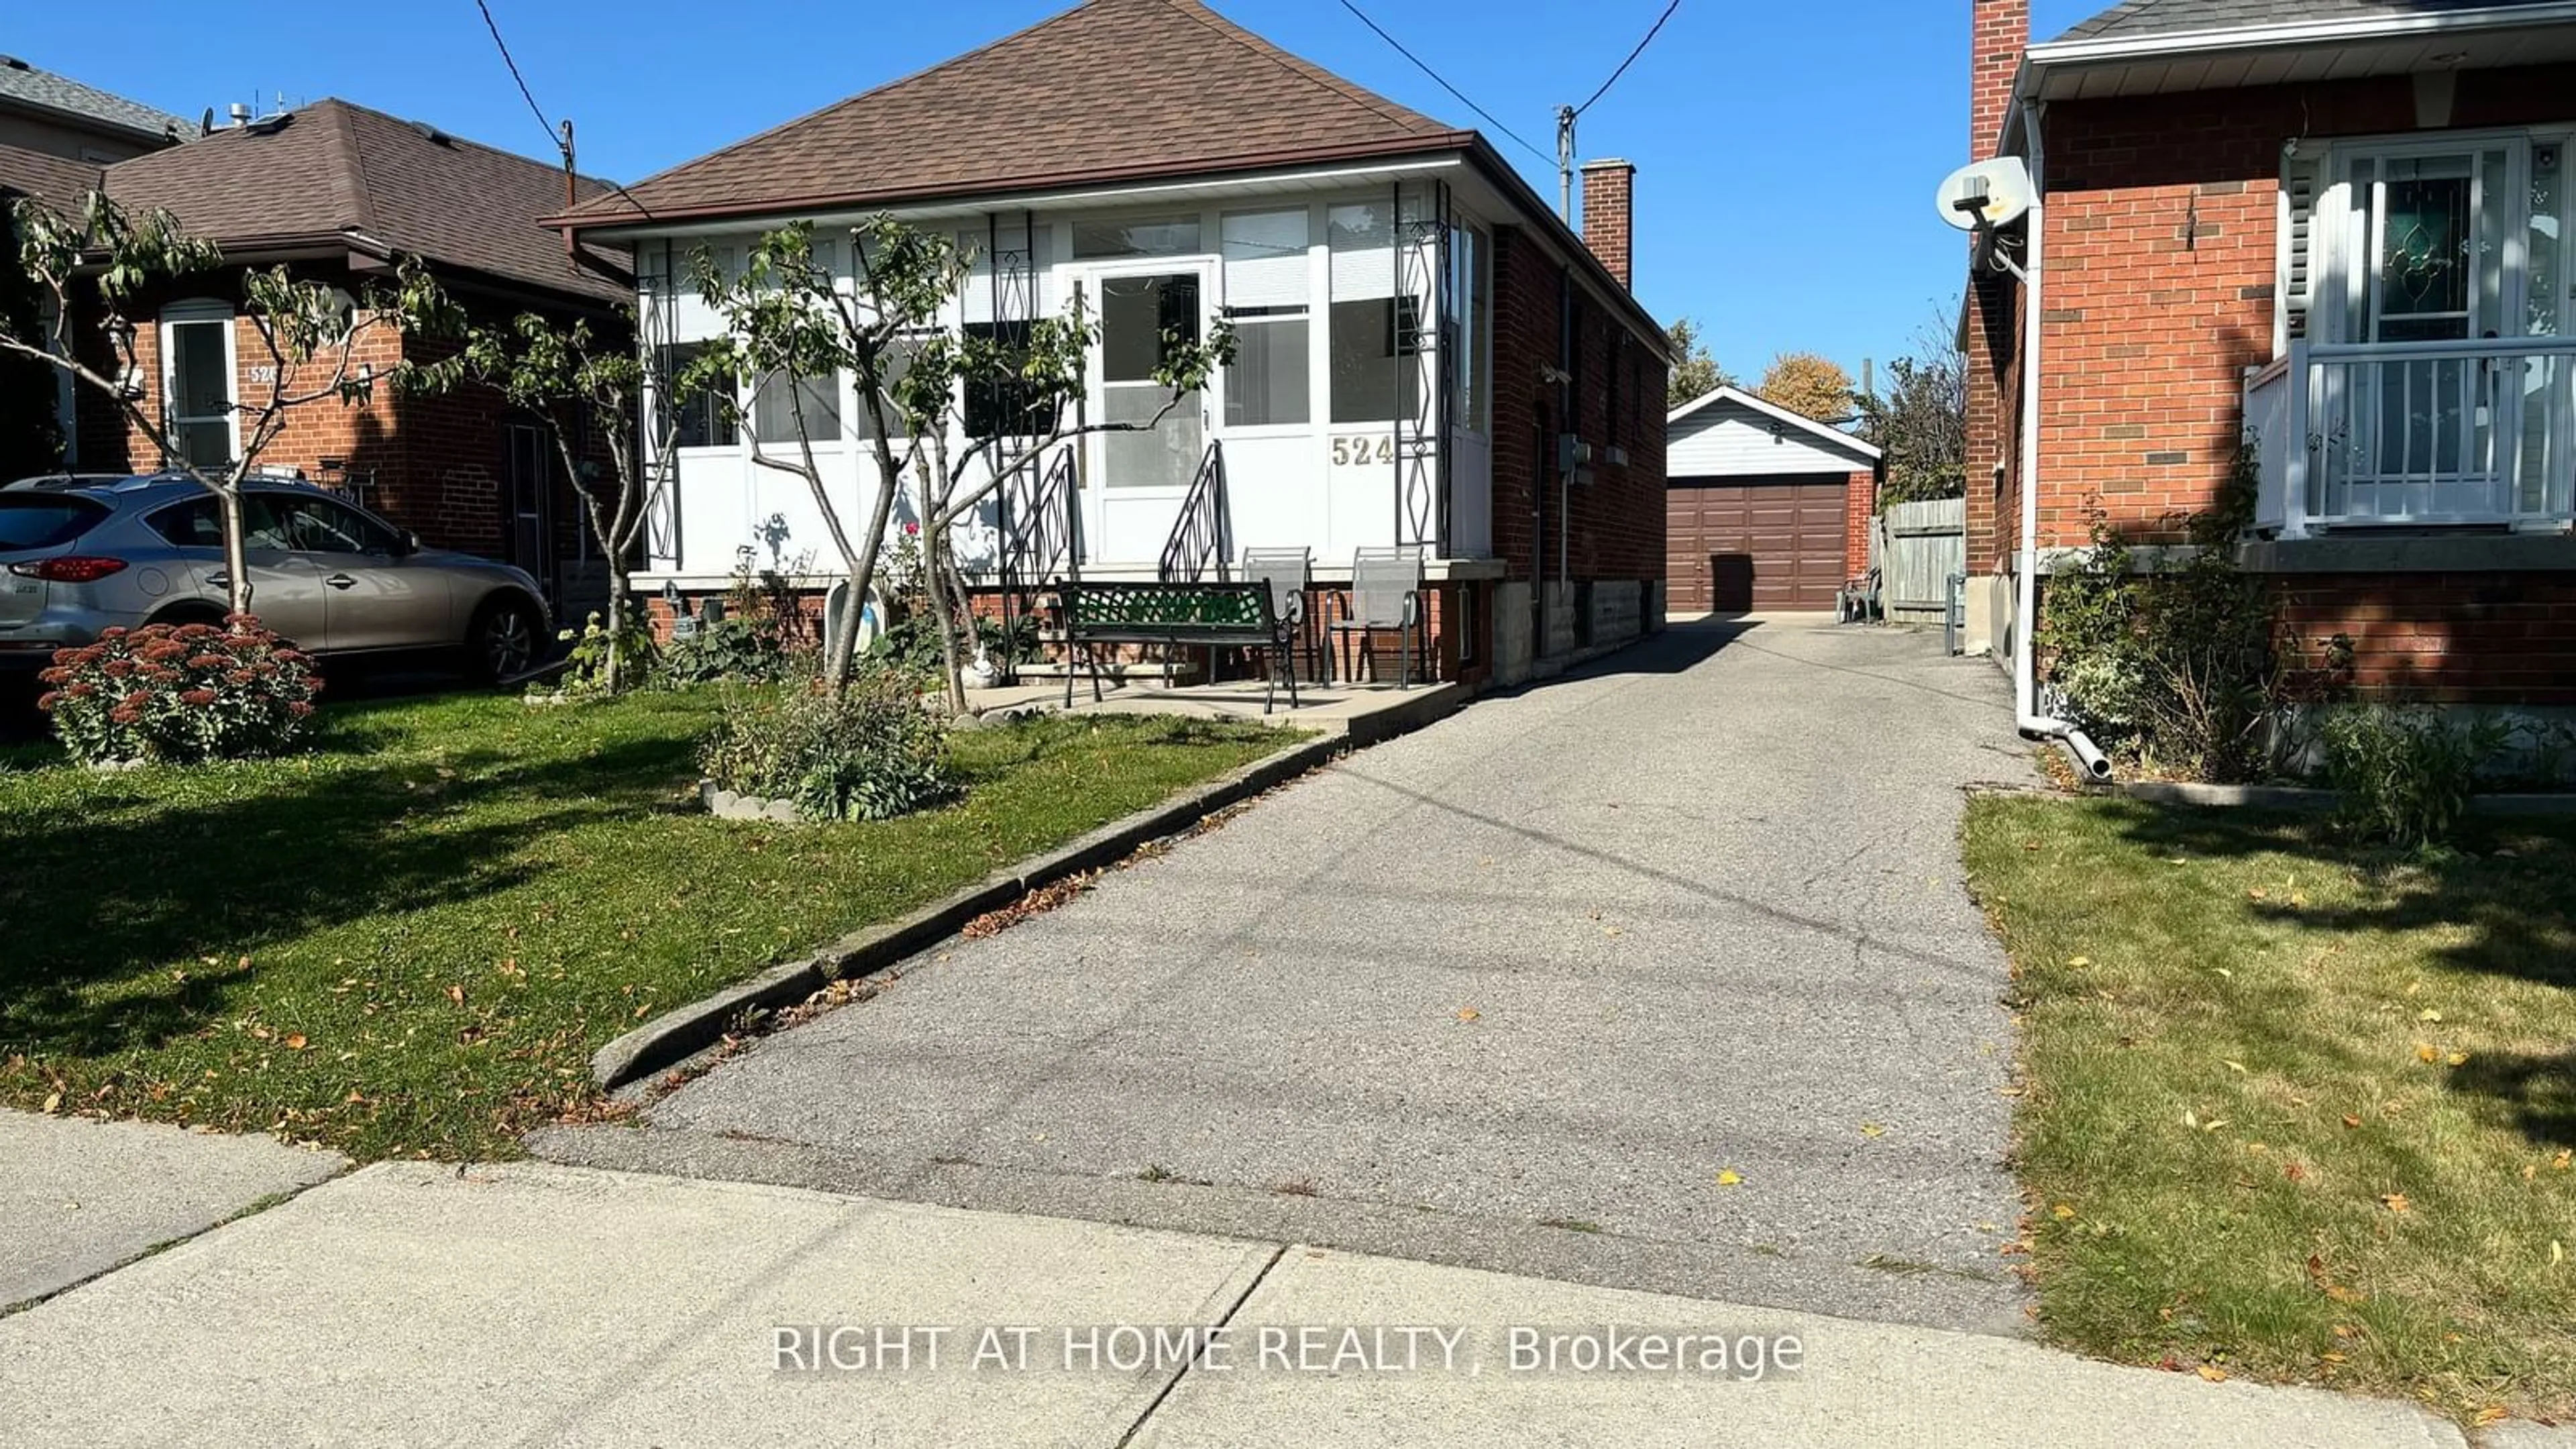
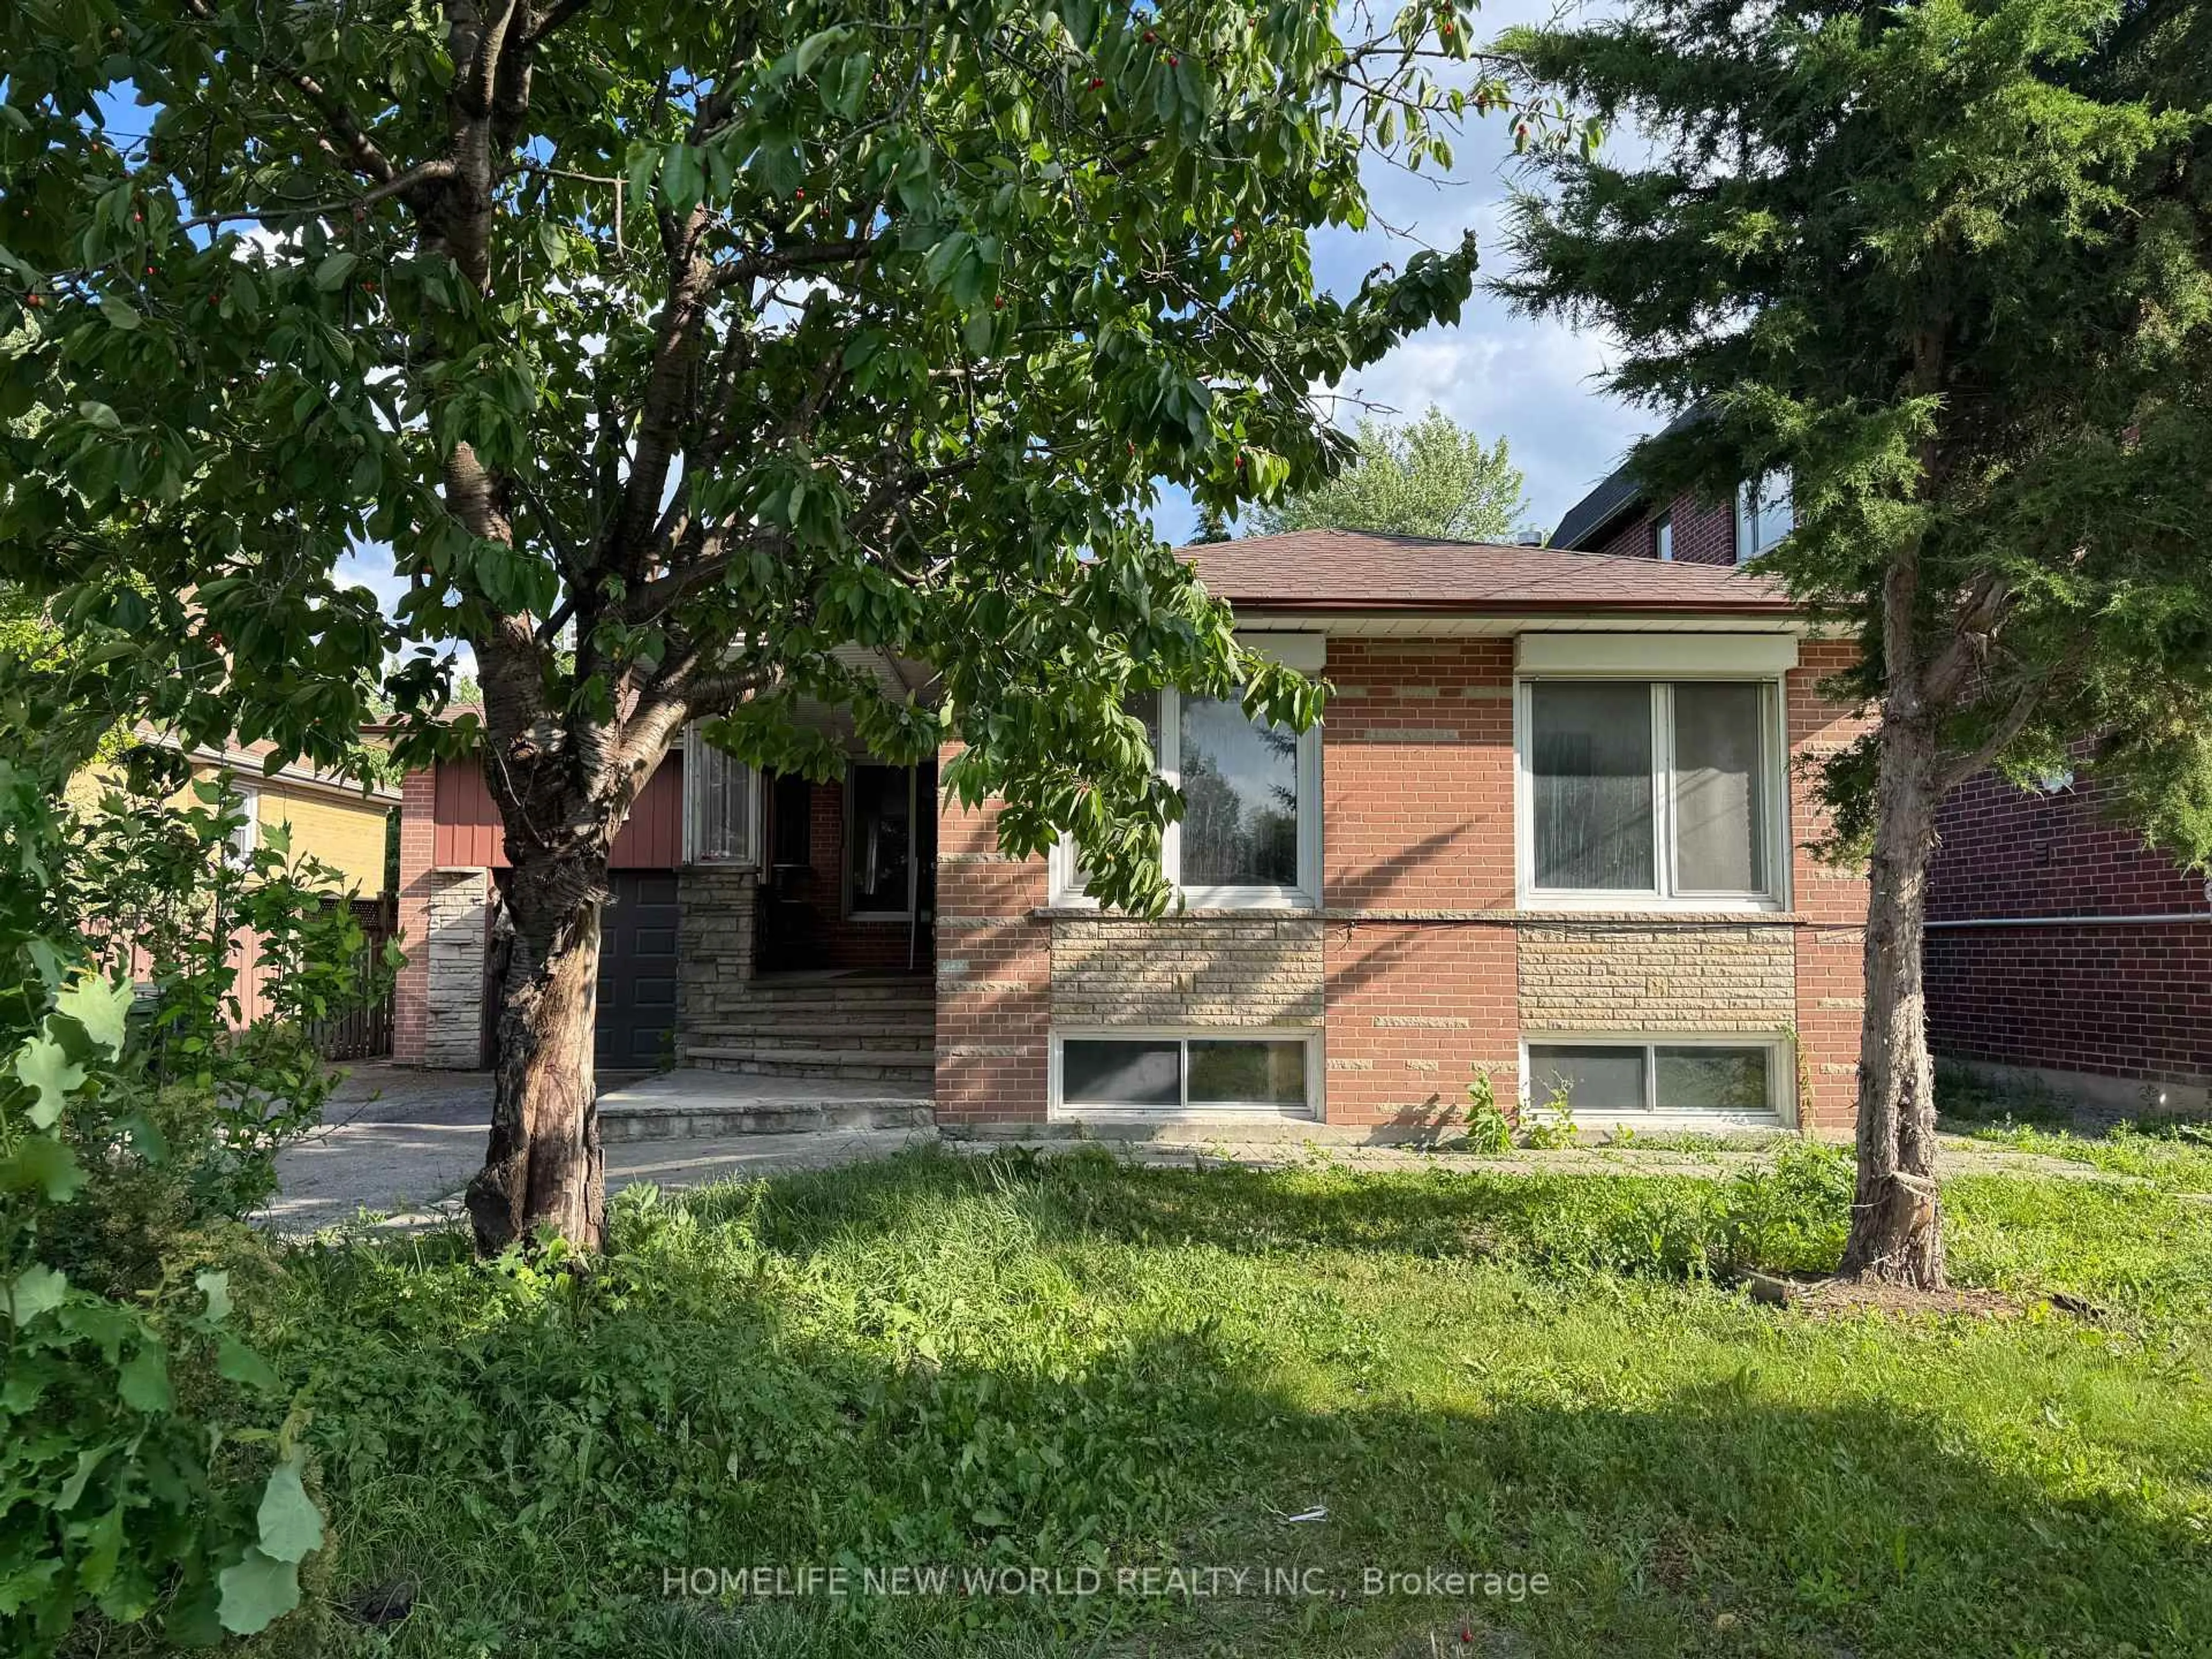
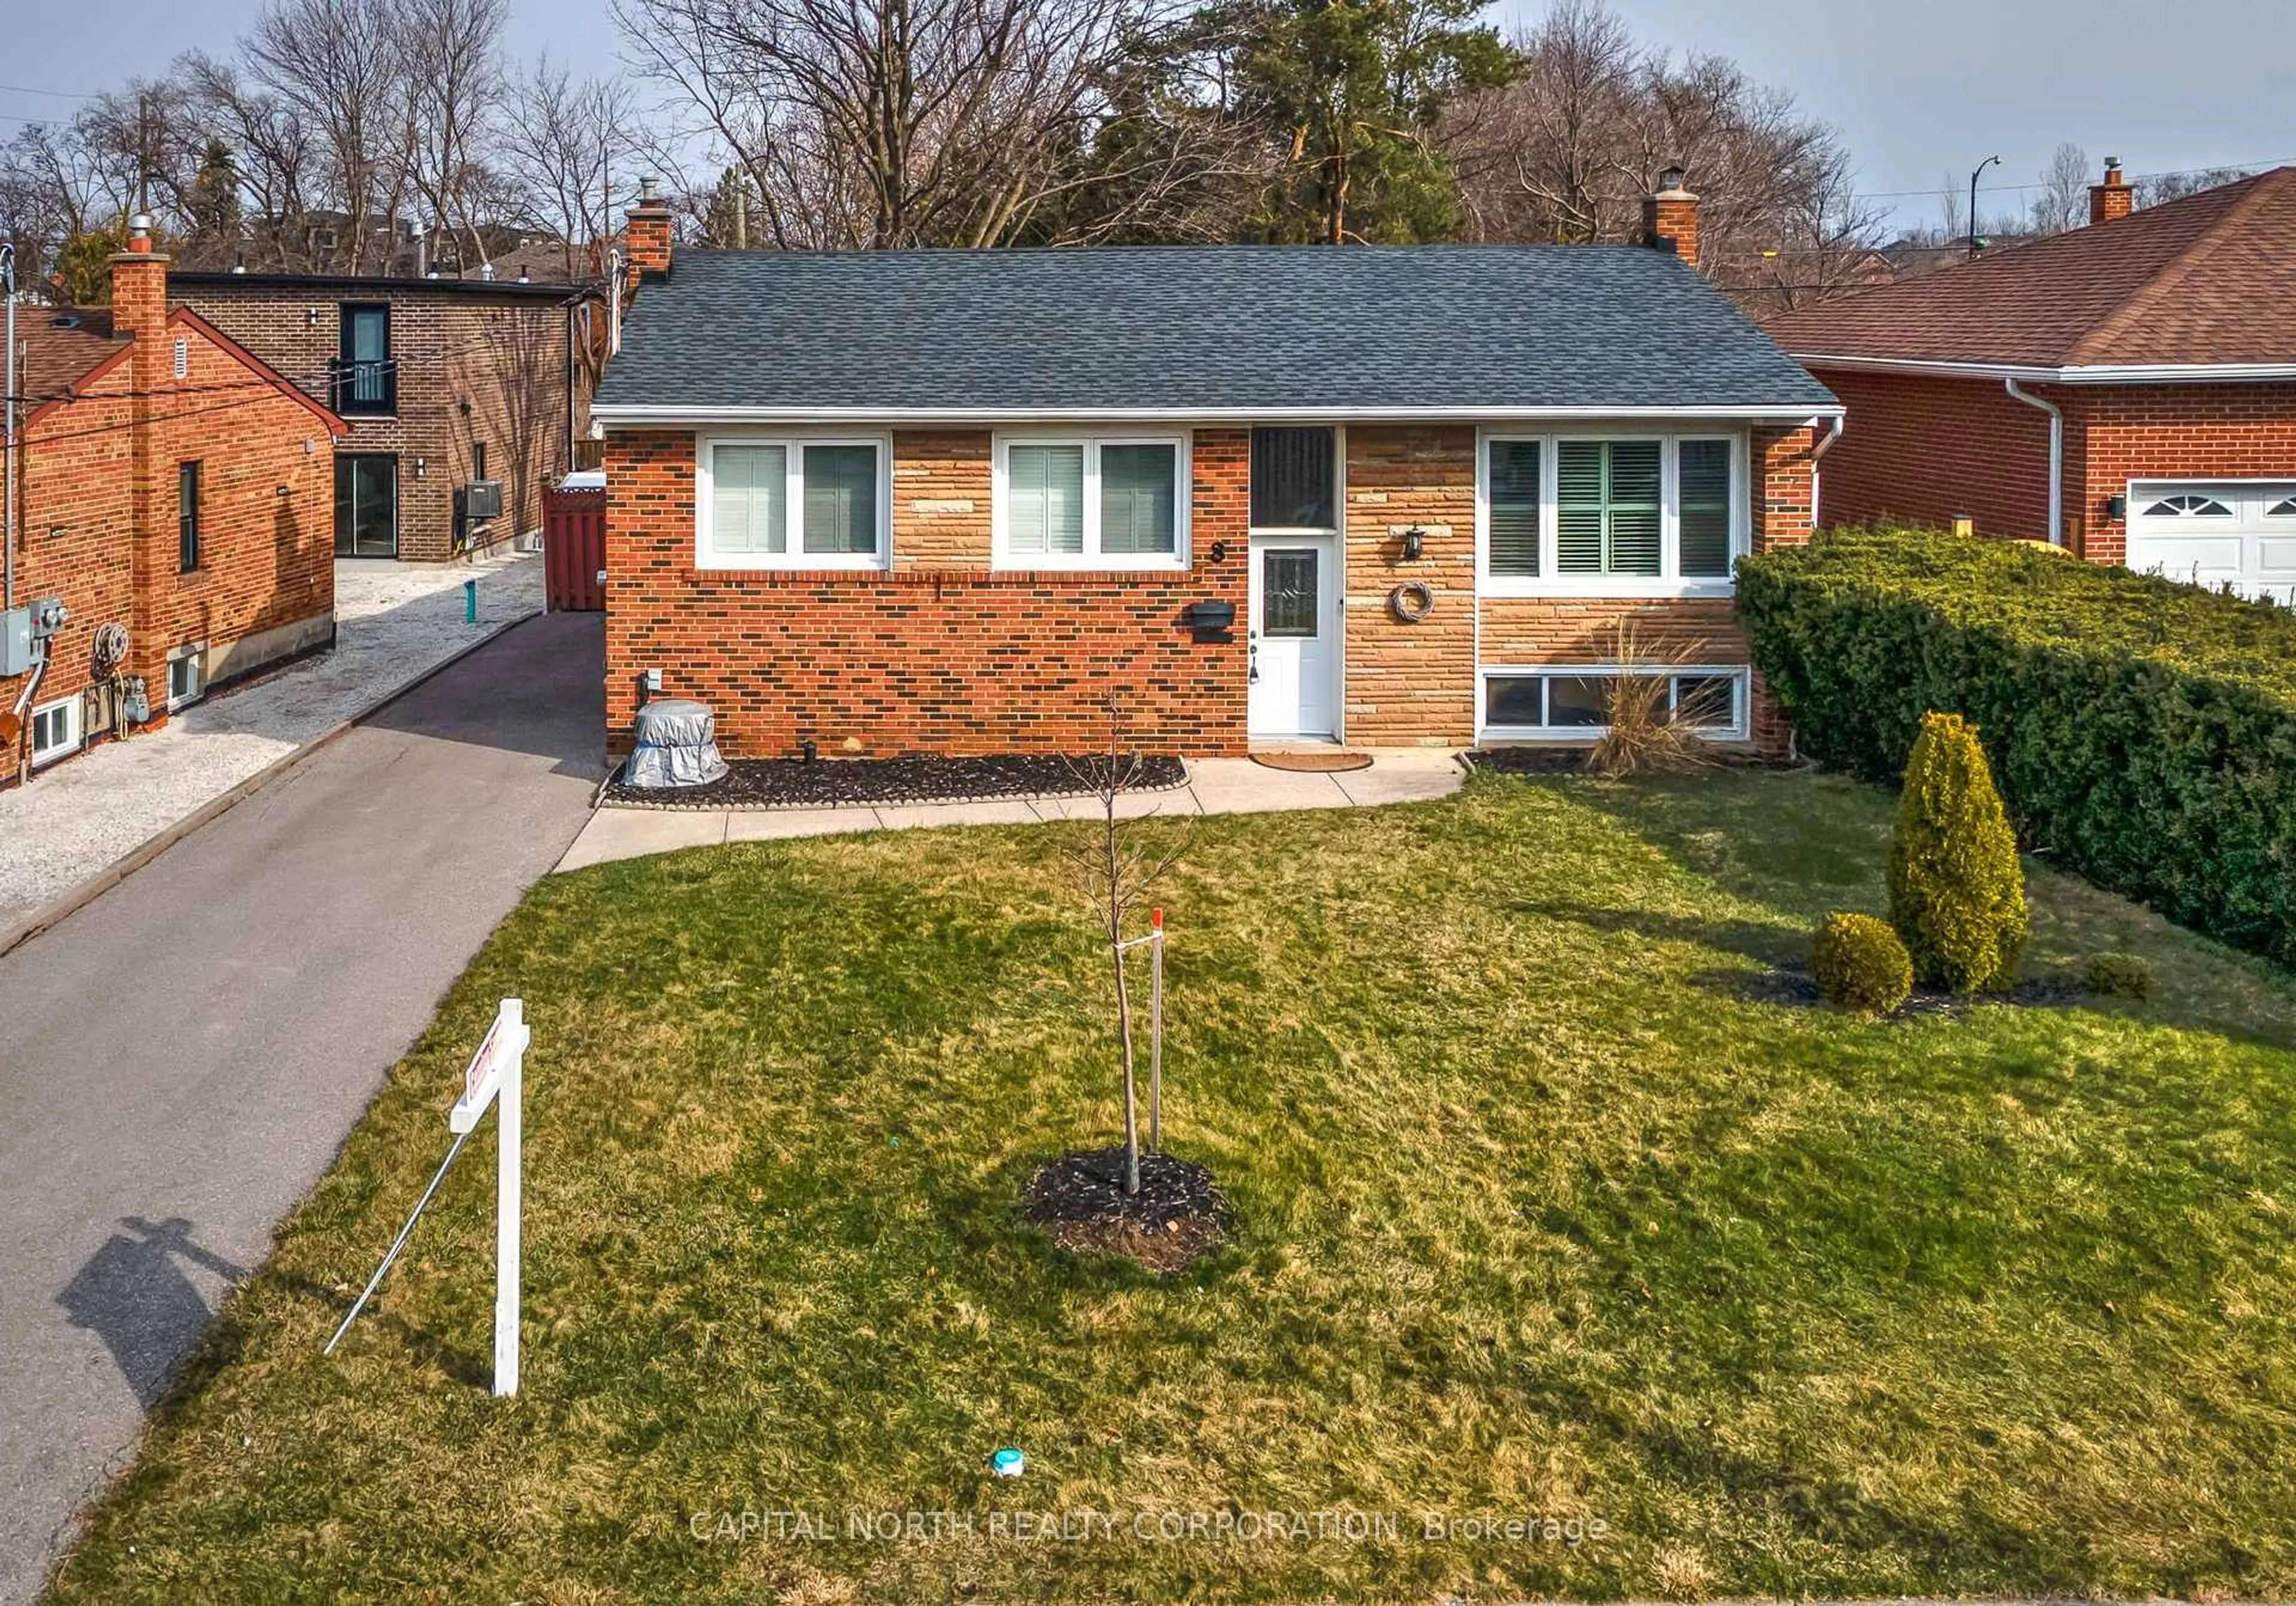
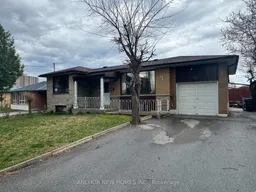
Excellent investment $$$ property with great cash flow. Detached Bungalow with 3 Bedrooms on the Main Floor + 4 Bedrooms In Basement, 2 Kitchens, Basement with Separate side Entrance. Recreation room has a skylight with great natural light. 1 Garage with 6 additional parking space. 2 Private Backyards. Very Convenience Location, Near To Schools, Public Transits, Park, Supermarket & Shopping Plaza, Minutes From York University Campus.


Property Details

StyleBungalow
View-
Age of property-
SqFt~1100-1500 SqFt
Lot Size8,880 SqFt(111 x 80)
Parking Spaces7
MLS ®NumberW12121583
Community NameJane and Finch
Data SourceTRREB
Listing byANCHOR NEW HOMES INC.

Features

Heating: Forced Air
Cooling: Central Air
Fireplace
Basement: Finished, Sep Entrance

Bsmt Floor

Br

0.0 x 0.0

Laminate

Kitchen

15.49 x 10.99

Ceramic Floor / B/I Appliances / Window

4th Br

0.0 x 0.0

Ceramic Floor

5th Br

0.0 x 0.0

Ceramic Floor


Features

Lot size: 8,880 SqFt

Parking

Garage spaces 1

Garage type Attached

Other parking spaces 6

Total parking spaces 7


Property History
May 3, 2025
ListedActive
$1,388,800
70 days on market
history photo preview24
Listing by trreb®

Market Data - Jane and Finch

Geo Zone Map ThumbnailJane and Finch

Strong Seller's Market

View Market Data

Detached house - for the past 30 days

Buyer's market Seller's market

Avg. Days on Market

Past 30 days

0 day

Compared to

2024

39 days

2023

32 days

2022

5 days

New Listings

Past 30 days

5 listings

Compared to

2024

4 listings

2023

8 listings

2022

7 listings

Units sold

Past 30 days

0 unit

Compared to

2024

4 units

2023

2 units

2022

2 units

Median Sold Price

Past 30 days

$0

Compared to

2024

$1,015,000

2023

$1,230,000

2022

$1,080,000


Population and Demographics

Overview

Total population 41248
Average household income $88,246

Age (%)

0 to 19
25%
20 to 34
21%
35 to 49
18%
50 to 64
20%
65 and plus
15%

Household composition (%)

Single family
64%
Single person
26%
Multi person
8%
Multi family
2%

Mother tongue (%)

English
54%
Vietnamese
10%
Spanish
8%
Italian
6%
Others
5%
Tagalog (Pilipino, Filipino)
4%
Yue (Cantonese)
3%
Assyrian Neo-Aramaic
2%
Tamil
1%

House tenancy (%)

Renters
60%
Owners
40%

What’s nearby?Essentials within 5 km

Local Logic

Transportation Scores

Estimated Budget