4 days on Market

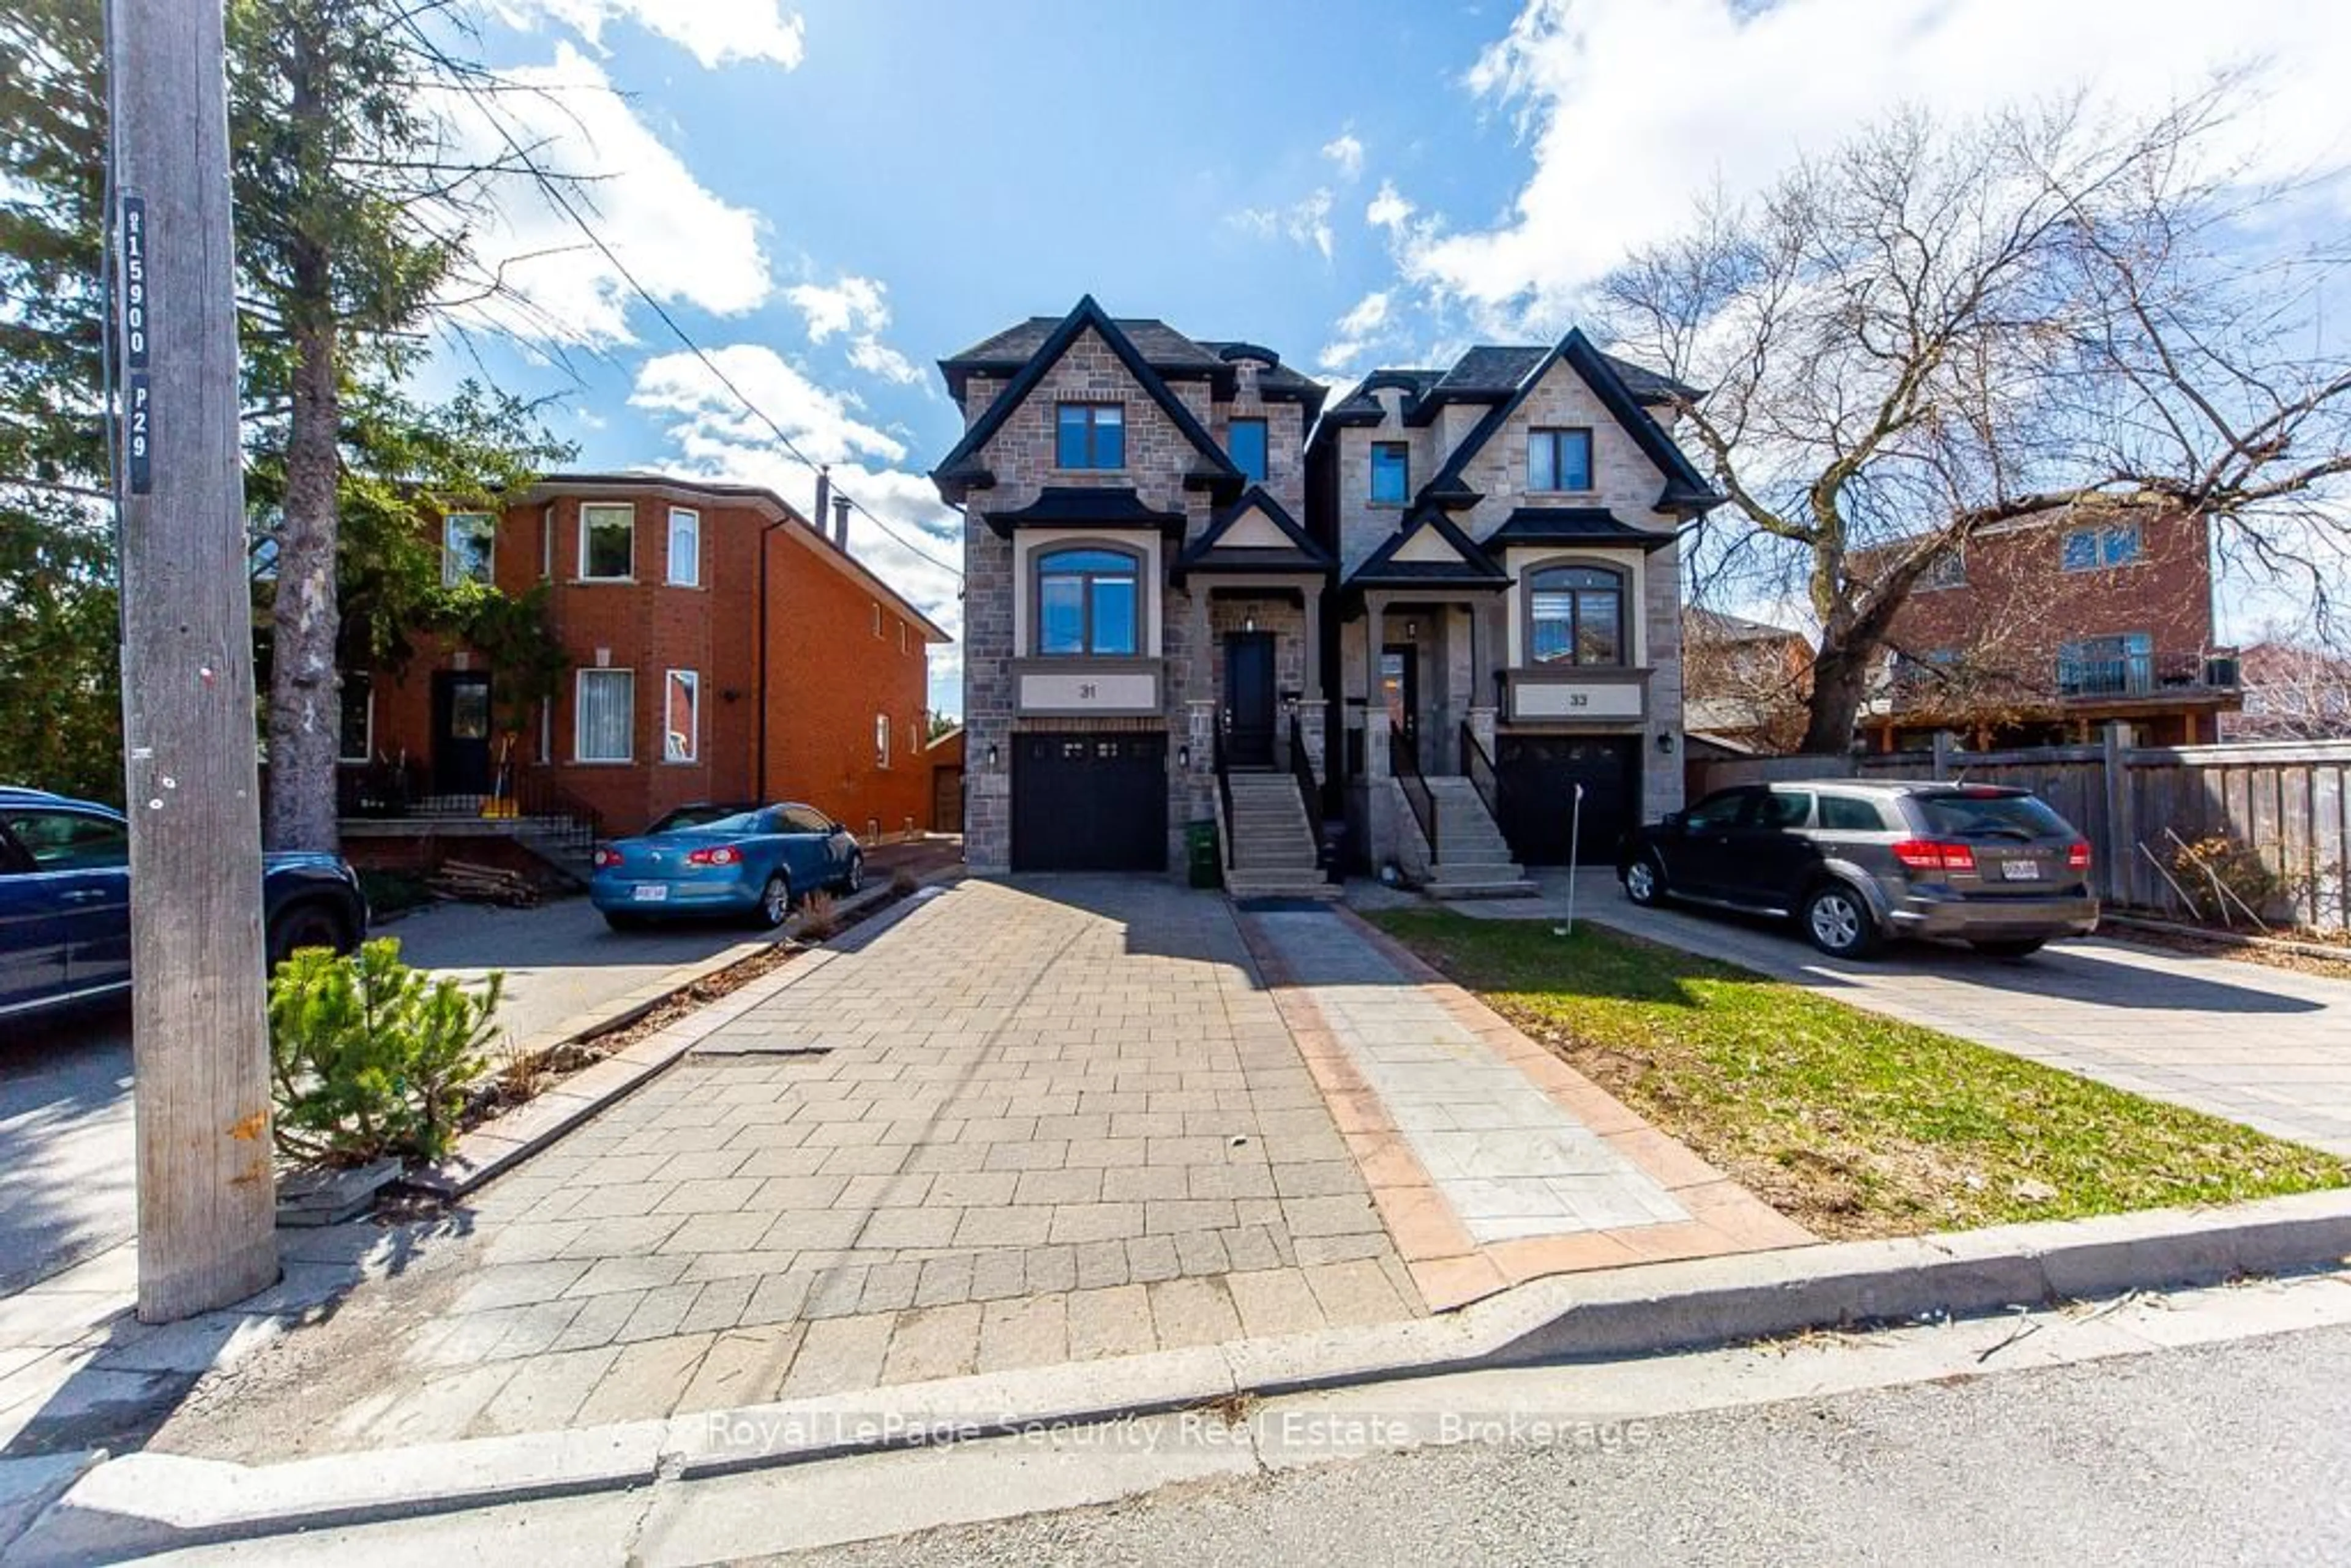
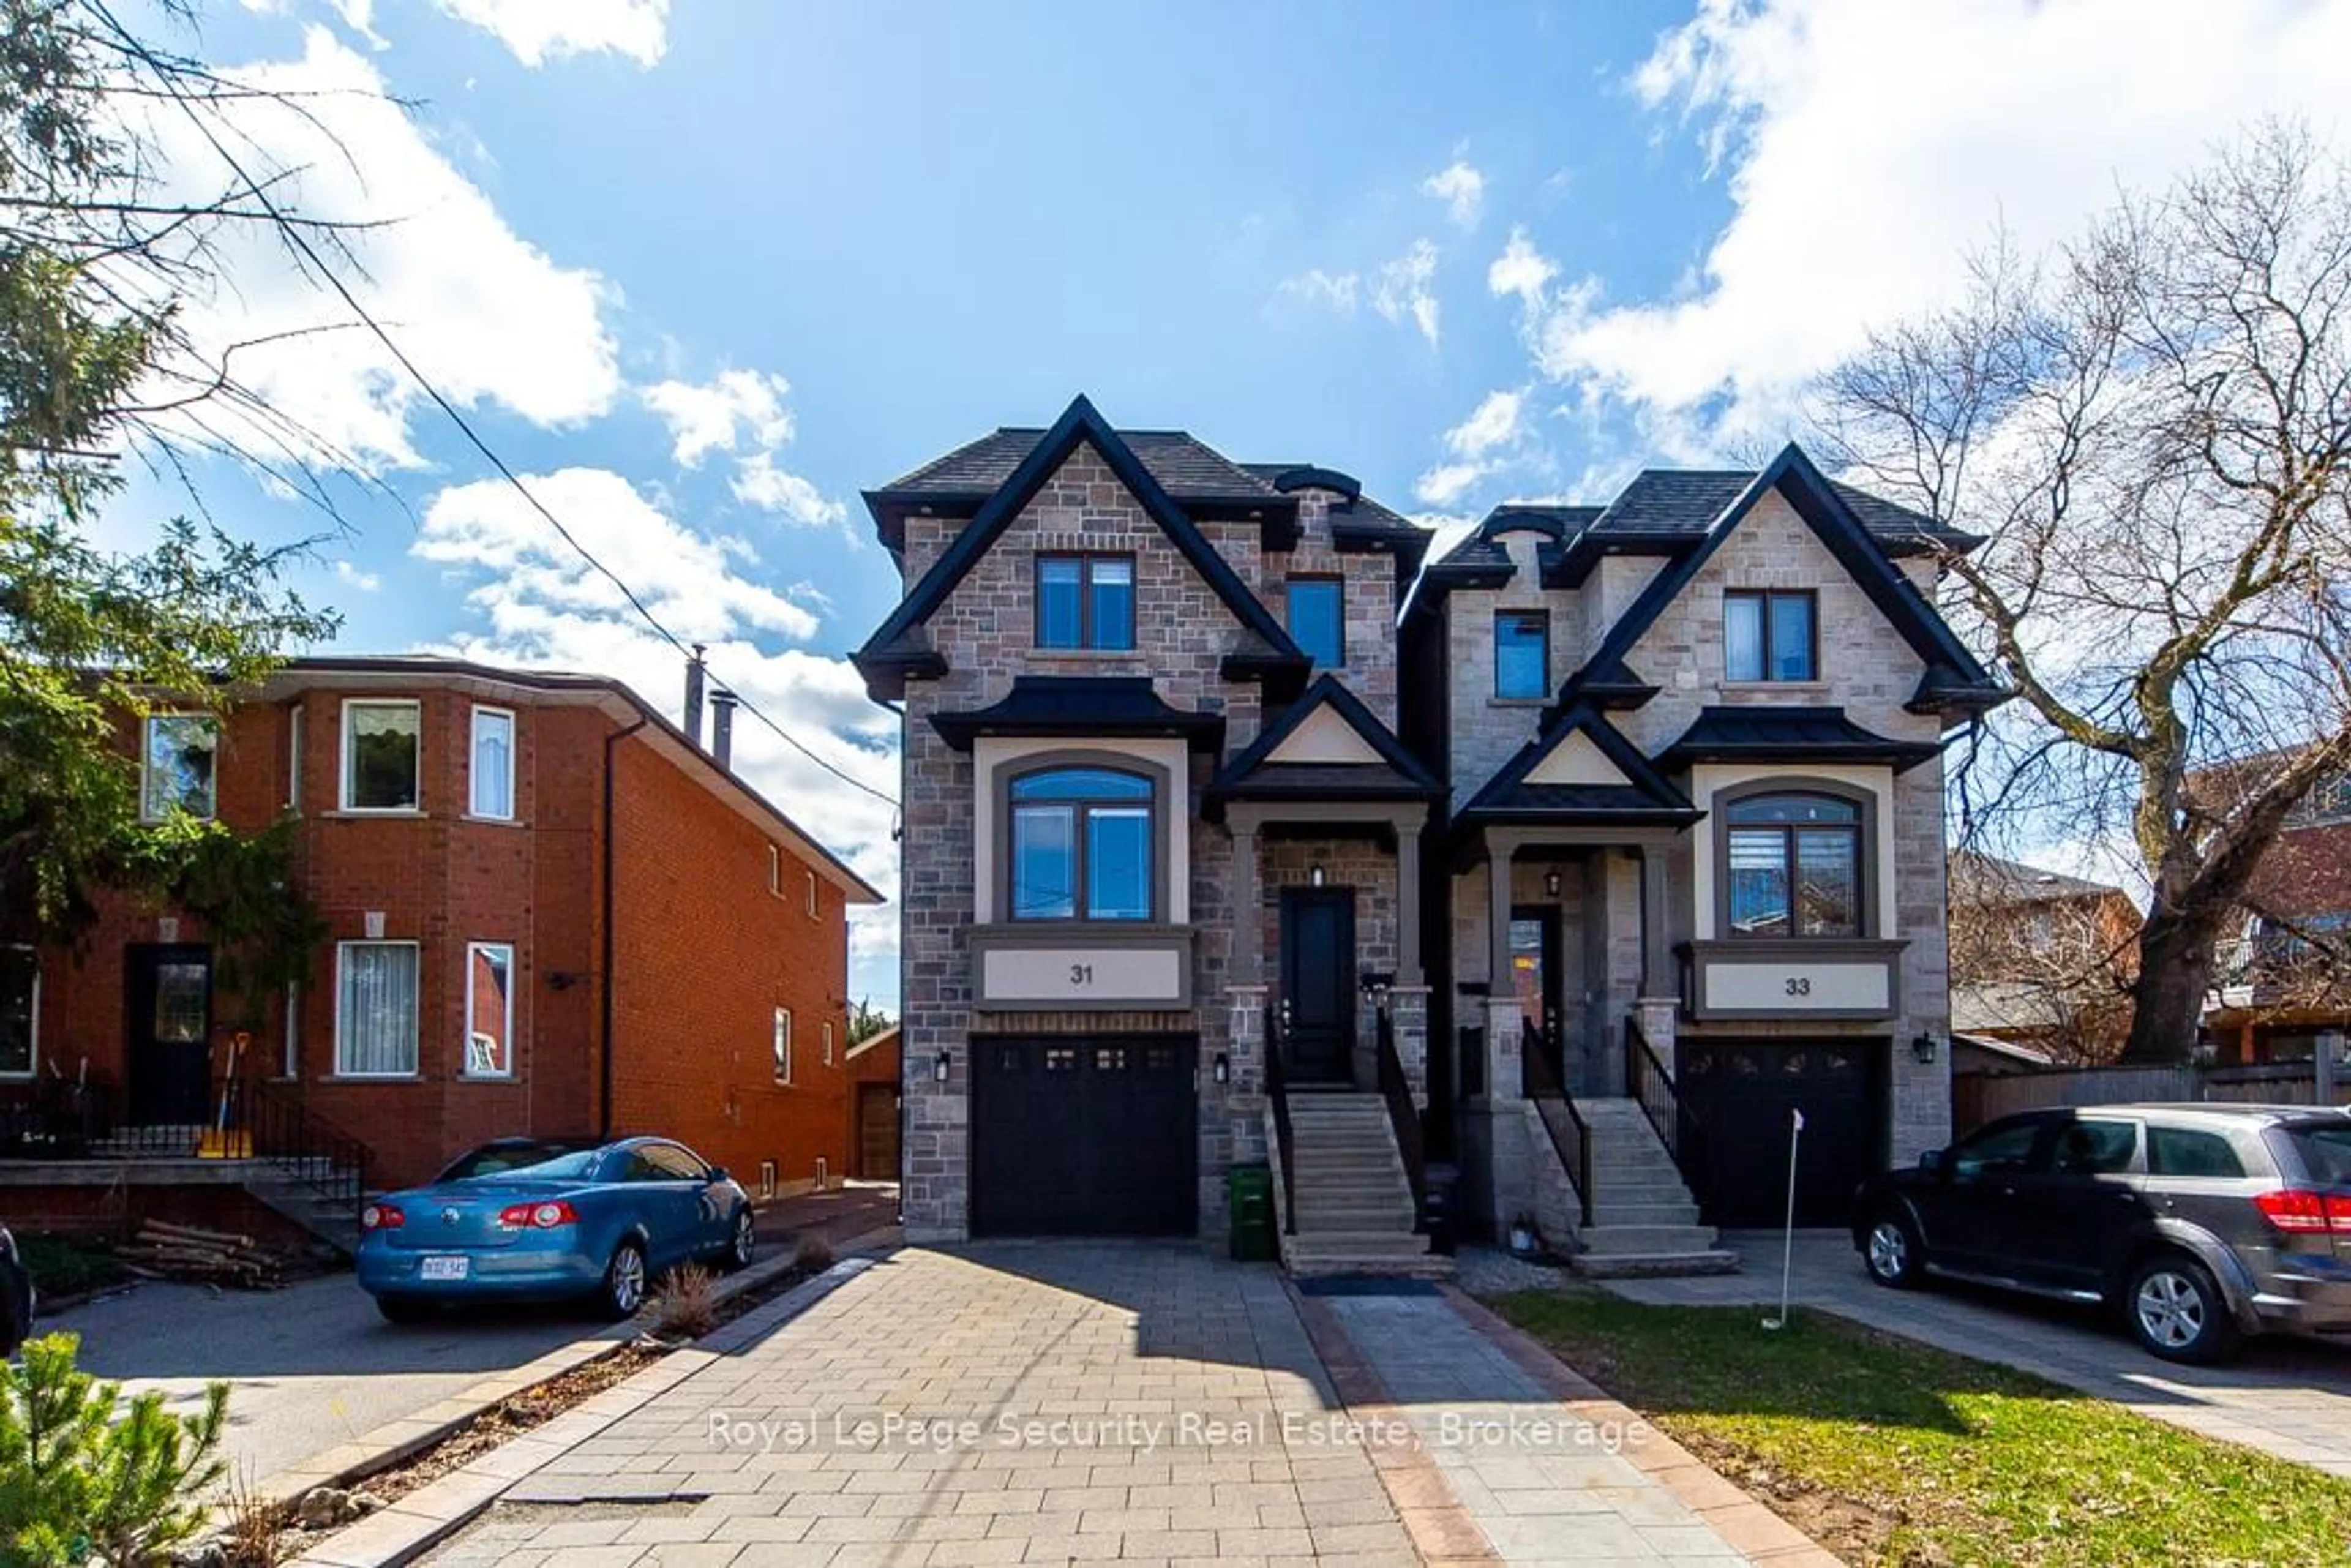
31 John Best Ave, Toronto, Ontario M9N 1C4

Detached
3
4
~2500-3000 sqft
$1,429,000
Get pre-qualifiedPowered by nesto
Detached
3
4
~2500-3000 sqft

Contact us about this property

Call

Highlights

Property Estimate

Days on market4 days

Estimated valueNot available

Price/Sqft$524/sqft

Monthly cost

Open Calculator

Description

This custom home built in 2017 with stone & brick exterior is approximately 2800sqft of living space. Featuring above ground heated floor basement with 2 entrances, large rec room with laundry & bath. Main level open concept family room and dining. Kitchen with living and walk out to deck. Quartz counter tops with island, stainless steel appliances and hardwood floors throughout. Upstairs primary bedroom has large walk in closet and 5 piece ensuite. The 2 other bedrooms sharing a bathroom, lots of natural light, hardwood floors and large closets. Close to TTC, grocery stores, and HWY 400/401. A must see!


Property Details

Style2-Storey
View-
Age of property6-15
SqFt~2500-3000 SqFt
Lot Size2,563 SqFt(105.83 x 24.22)
Parking Spaces4
MLS ®NumberW12995776
Community NameWeston
Data SourceTRREB
Listing byRoyal LePage Security Real Estate

Features

Heating: Forced Air
Cooling: Central Air
Fireplace
Basement: Fin W/O, Sep Entrance

Main Floor

Foyer

1.52 x 1.21

Ceramic Floor / Closet

Living

8.6 x 4.44

hardwood floor / Combined W/Dining / Crown Moulding

Dining

8.6 x 4.13

hardwood floor / Combined W/Living / Crown Moulding

Kitchen

4.56 x 3.58

Ceramic Floor / Centre Island / Eat-In Kitchen


Features

Lot size: 2,563 SqFt

Parking

Garage spaces 1

Garage type Built-In

Other parking spaces 3

Total parking spaces 4


Property History

Apr 14, 2026
ListedActive
$1,429,000
4 days on market
history photo preview50
Listing by trreb®
Property listed by Royal LePage Security Real Estate, Brokerage
Agent Banner Image
Interested in this property?Get in touch to get the inside scoop.

Market Data - Weston

Geo Zone Map ThumbnailWeston

Balanced Market

View Market Data

Detached house - for the past 30 days

Buyer's market Seller's market

Avg. Days on Market

Past 30 days

11 days

Compared to

2025

14 days

2024

24 days

2023

16 days

New Listings

Past 30 days

14 listings

Compared to

2025

20 listings

2024

19 listings

2023

8 listings

Units sold

Past 30 days

5 units

Compared to

2025

4 units

2024

8 units

2023

4 units

Median Sold Price

Past 30 days

$870,000

Compared to

2025

$1,022,500

2024

$1,244,500

2023

$902,500


Population and Demographics

Overview

Total population 24591
Average household income $104,799

Age (%)

0 to 19
21%
20 to 34
21%
35 to 49
20%
50 to 64
21%
65 and plus
16%

Household composition (%)

Single family
60%
Single person
33%
Multi person
6%
Multi family
1%

Mother tongue (%)

English
62%
Spanish
7%
Portuguese
7%
Italian
5%
Somali
4%
Others
3%
Vietnamese
3%
Tagalog (Pilipino, Filipino)
3%

House tenancy (%)

Renters
54%
Owners
46%

What’s nearby?Essentials within 5 km

Local Logic

Transportation Scores

Estimated Budget