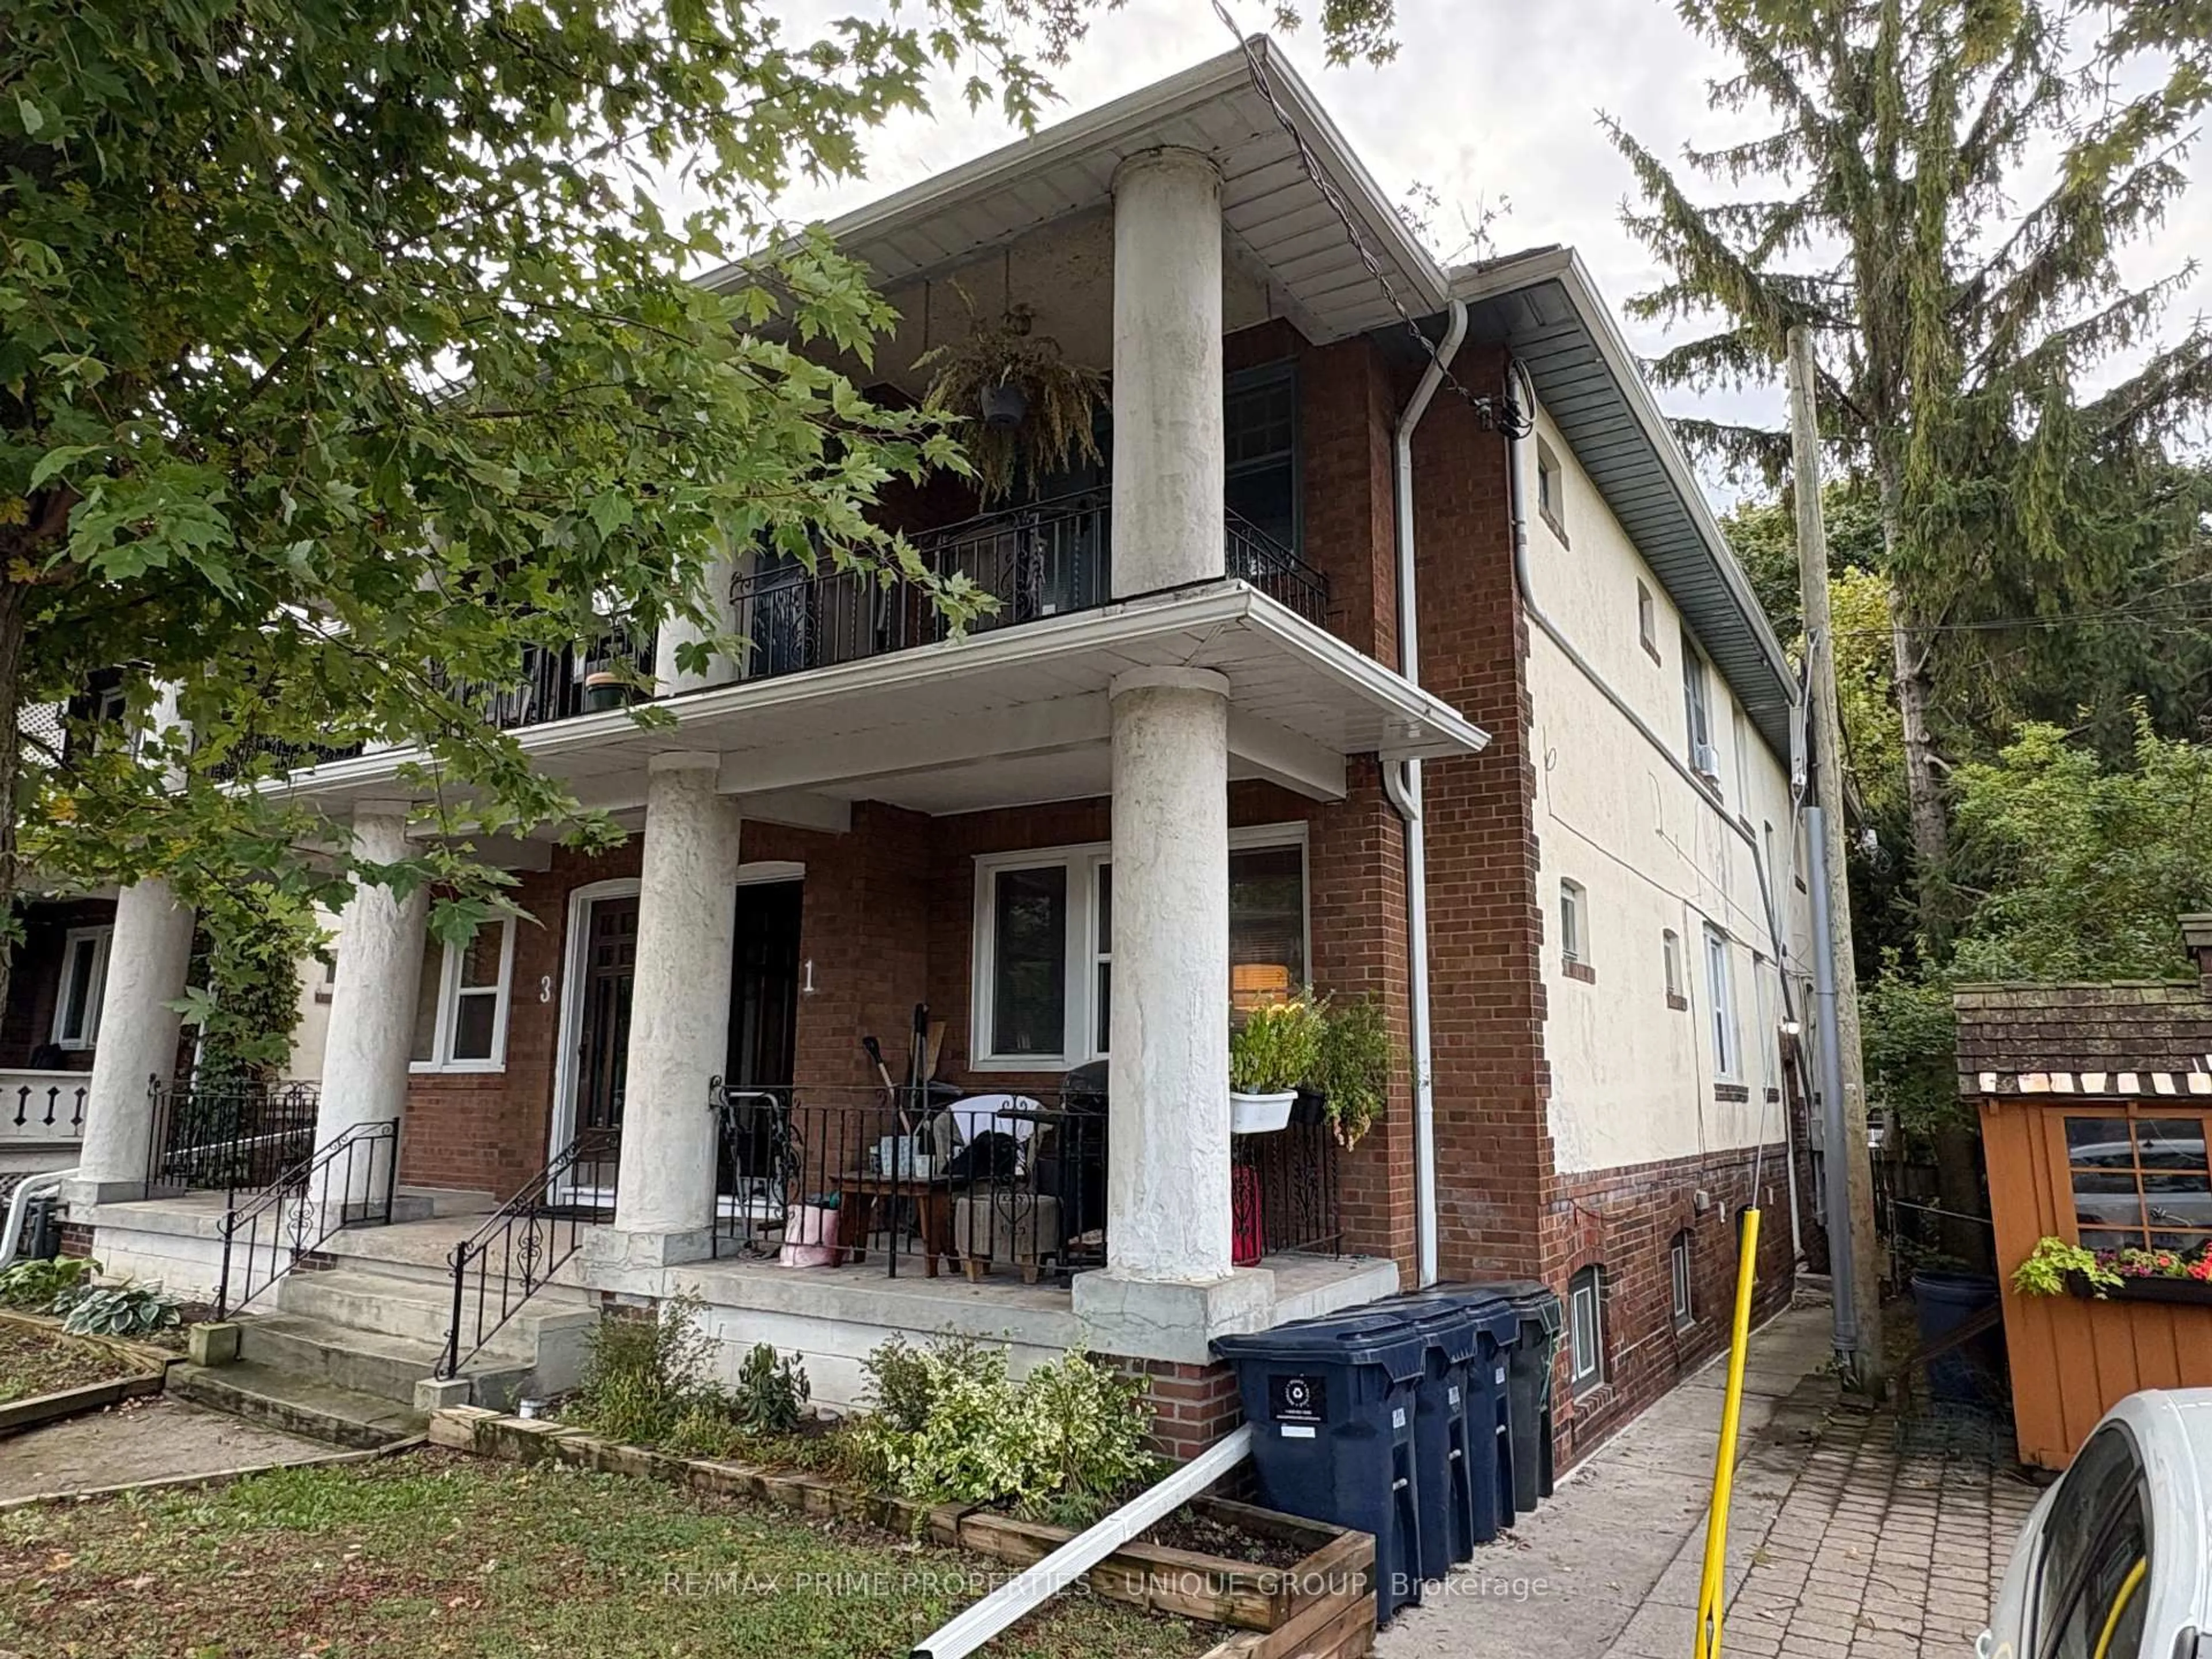
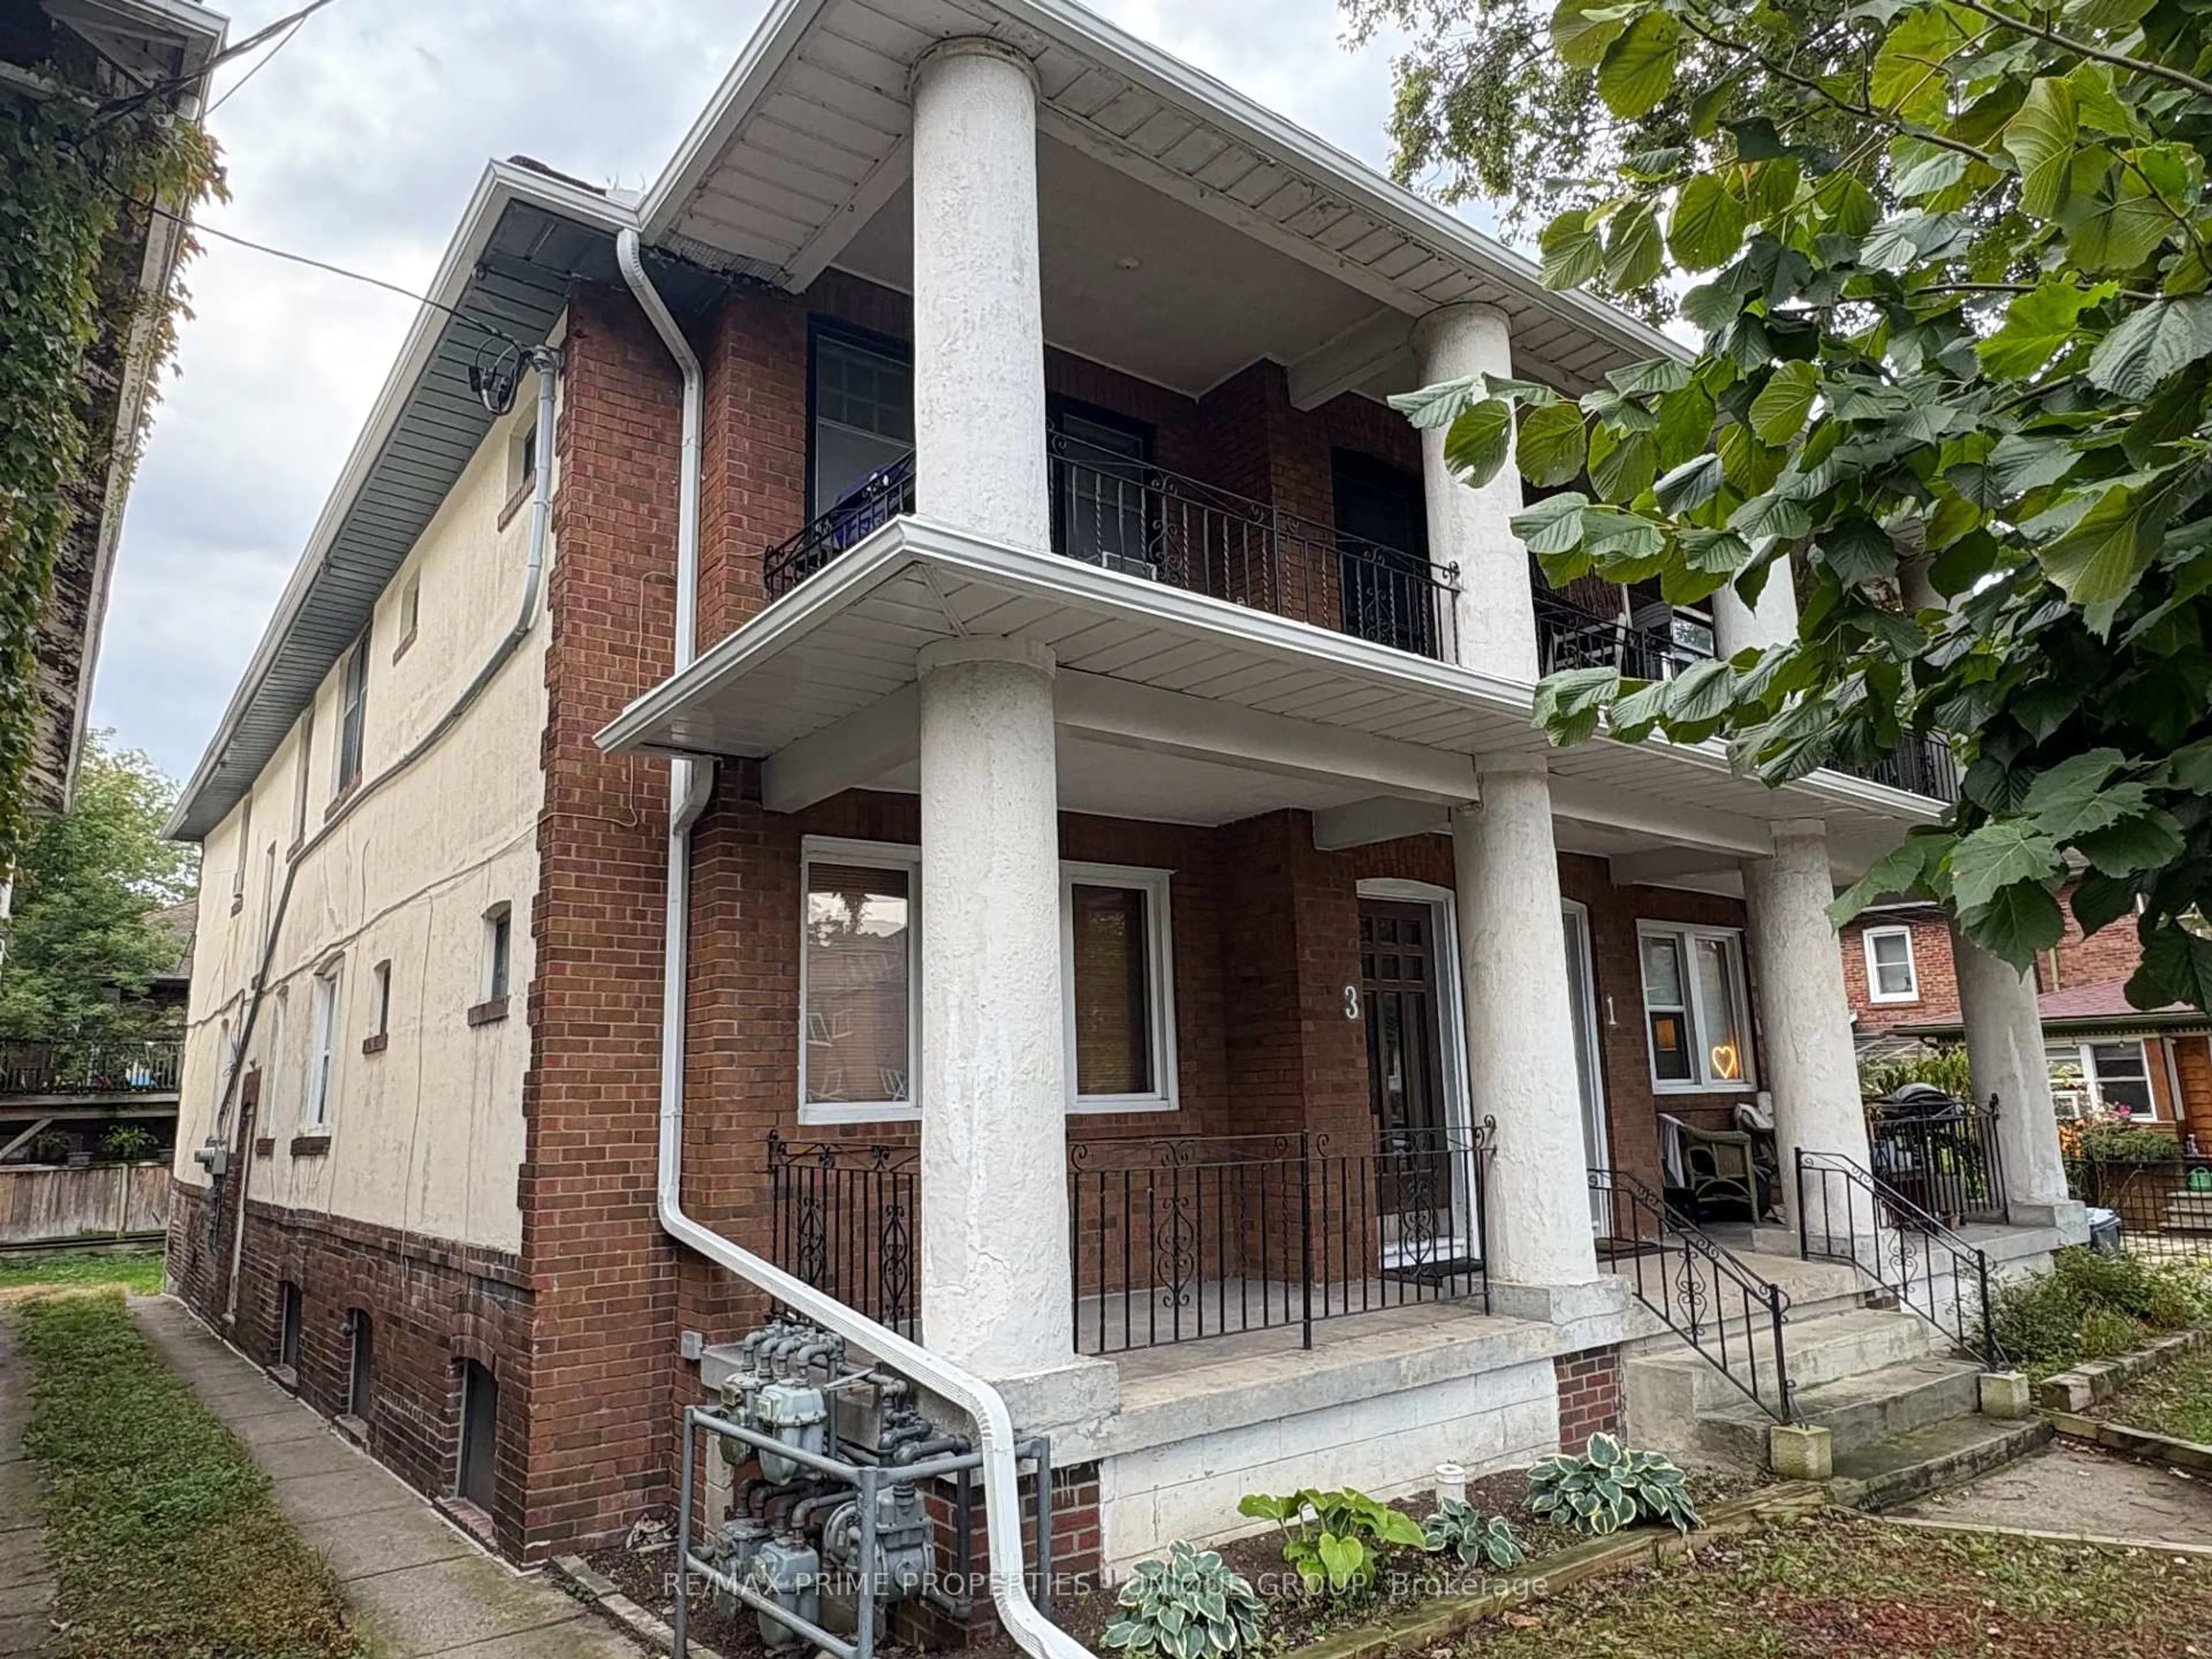
1-3 Bonfield Ave, Toronto, Ontario M4E 1B9
Contact us about this property
Highlights
Estimated valueThis is the price Wahi expects this property to sell for.
The calculation is powered by our Instant Home Value Estimate, which uses current market and property price trends to estimate your home’s value with a 90% accuracy rate.Not available
Price/Sqft$630/sqft
Monthly cost
Open Calculator
Description
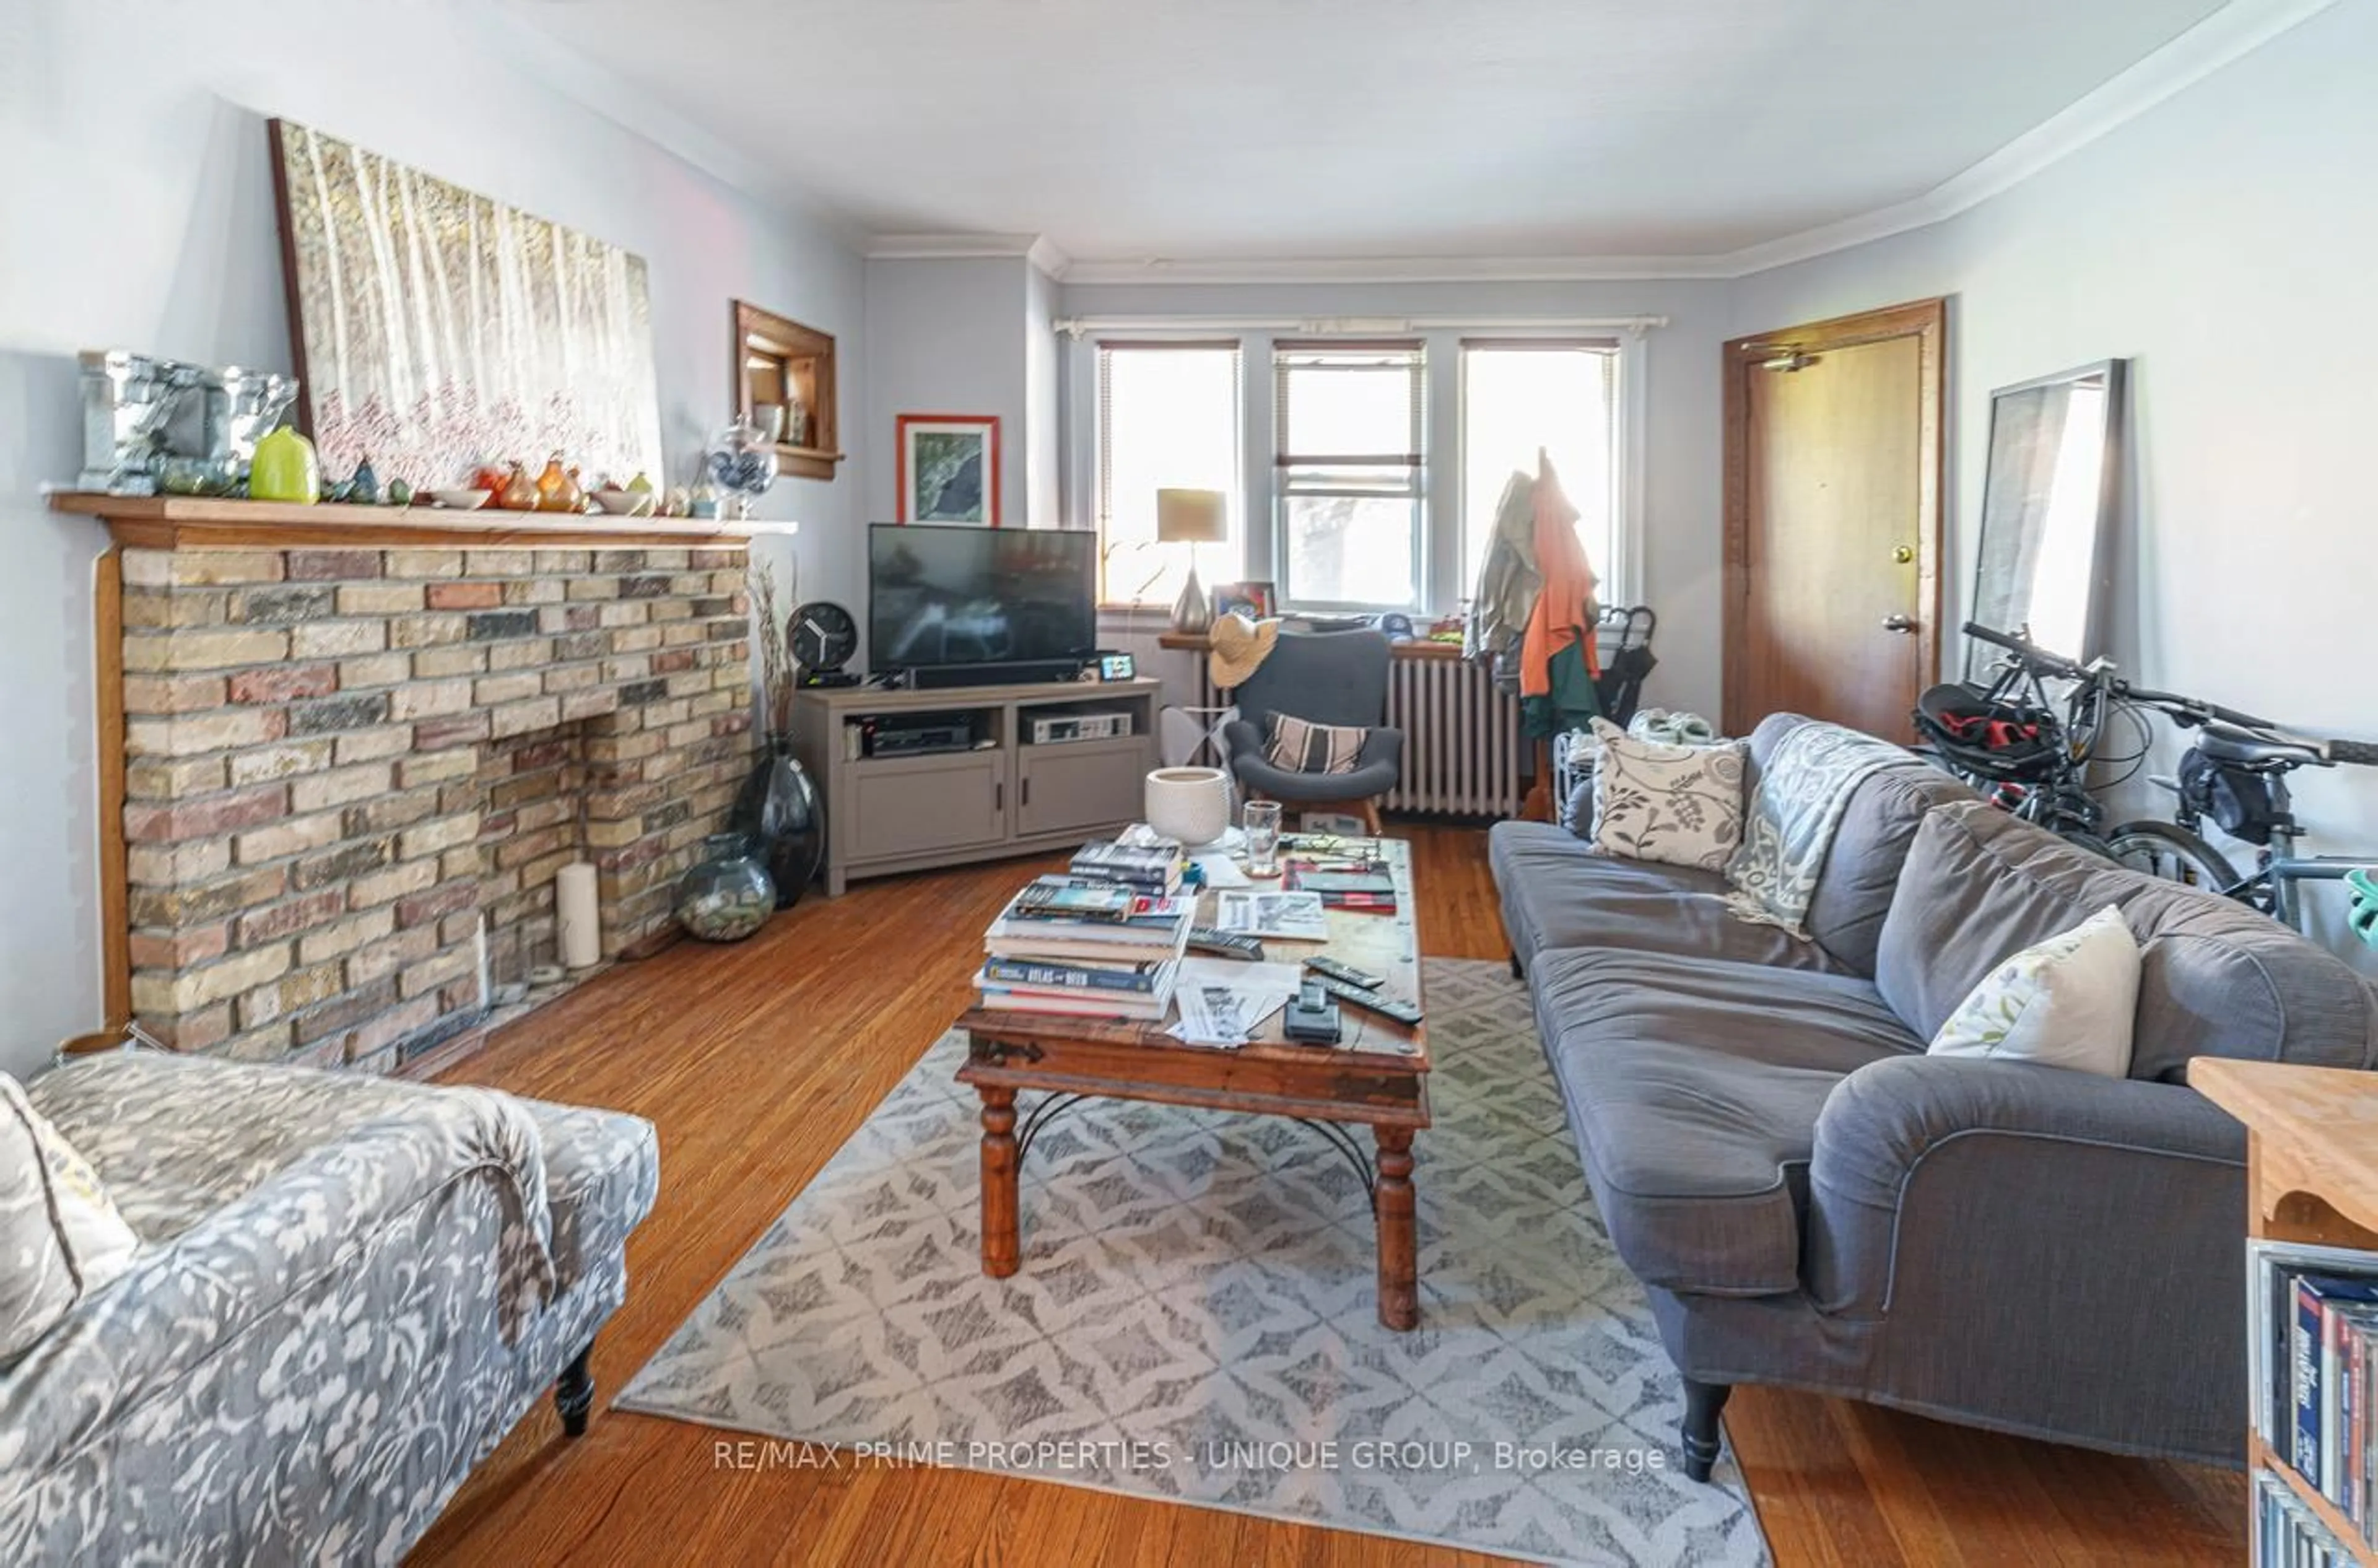
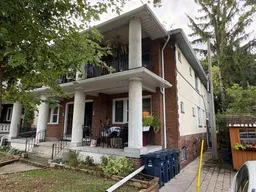
1 - 3 Bonfield Avenue. Prime Beach Investment Property -- South of Queen Street East. 6 Charming Suites in AAA Location. 4--2 Bedroom / One Bedroom / Studio. Detached 2 Storey Brick Building. Short Walk to Boardwalk, Beach, Vibrant Queen St E. Charming front Balconies for Upper Suites and Front Porches for Main Floor Suites. Two Car Garage in Rear of Building. Income Statement, Survey, and Floor Plans are attached. Main Floor Apartment on East Side is Vacant. Inspection Report is available.
Property Details
Interior
Features
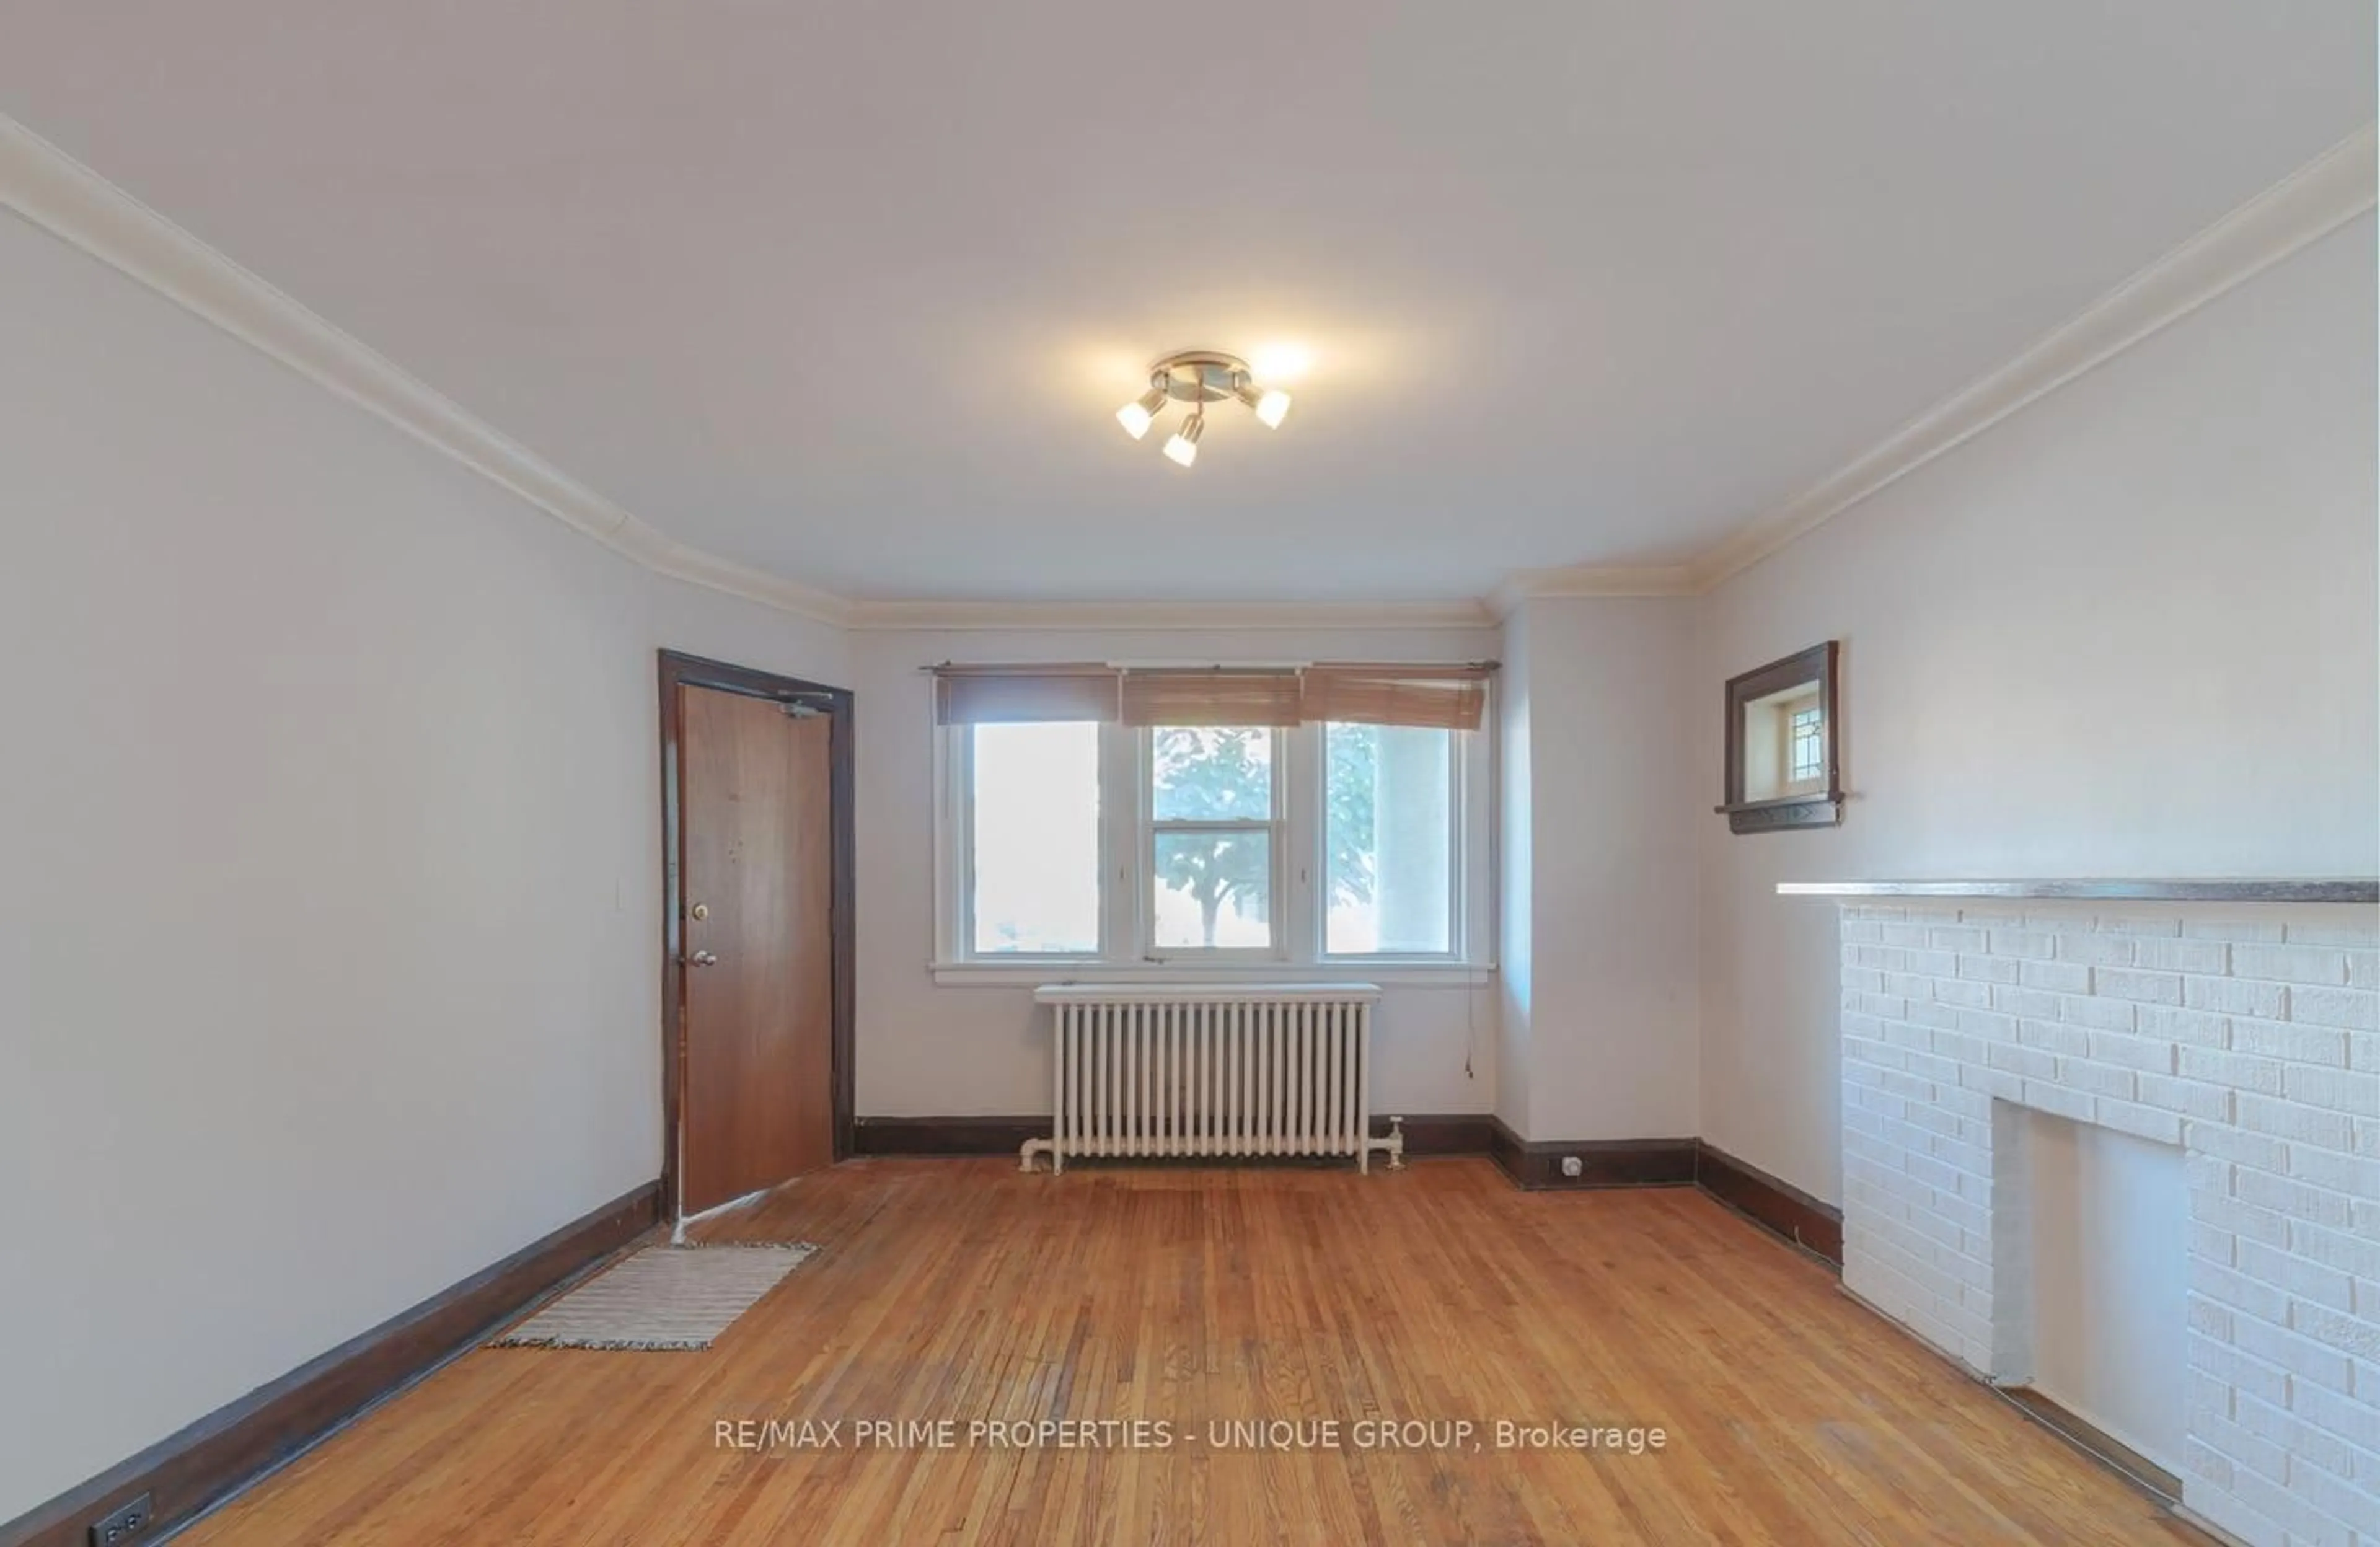
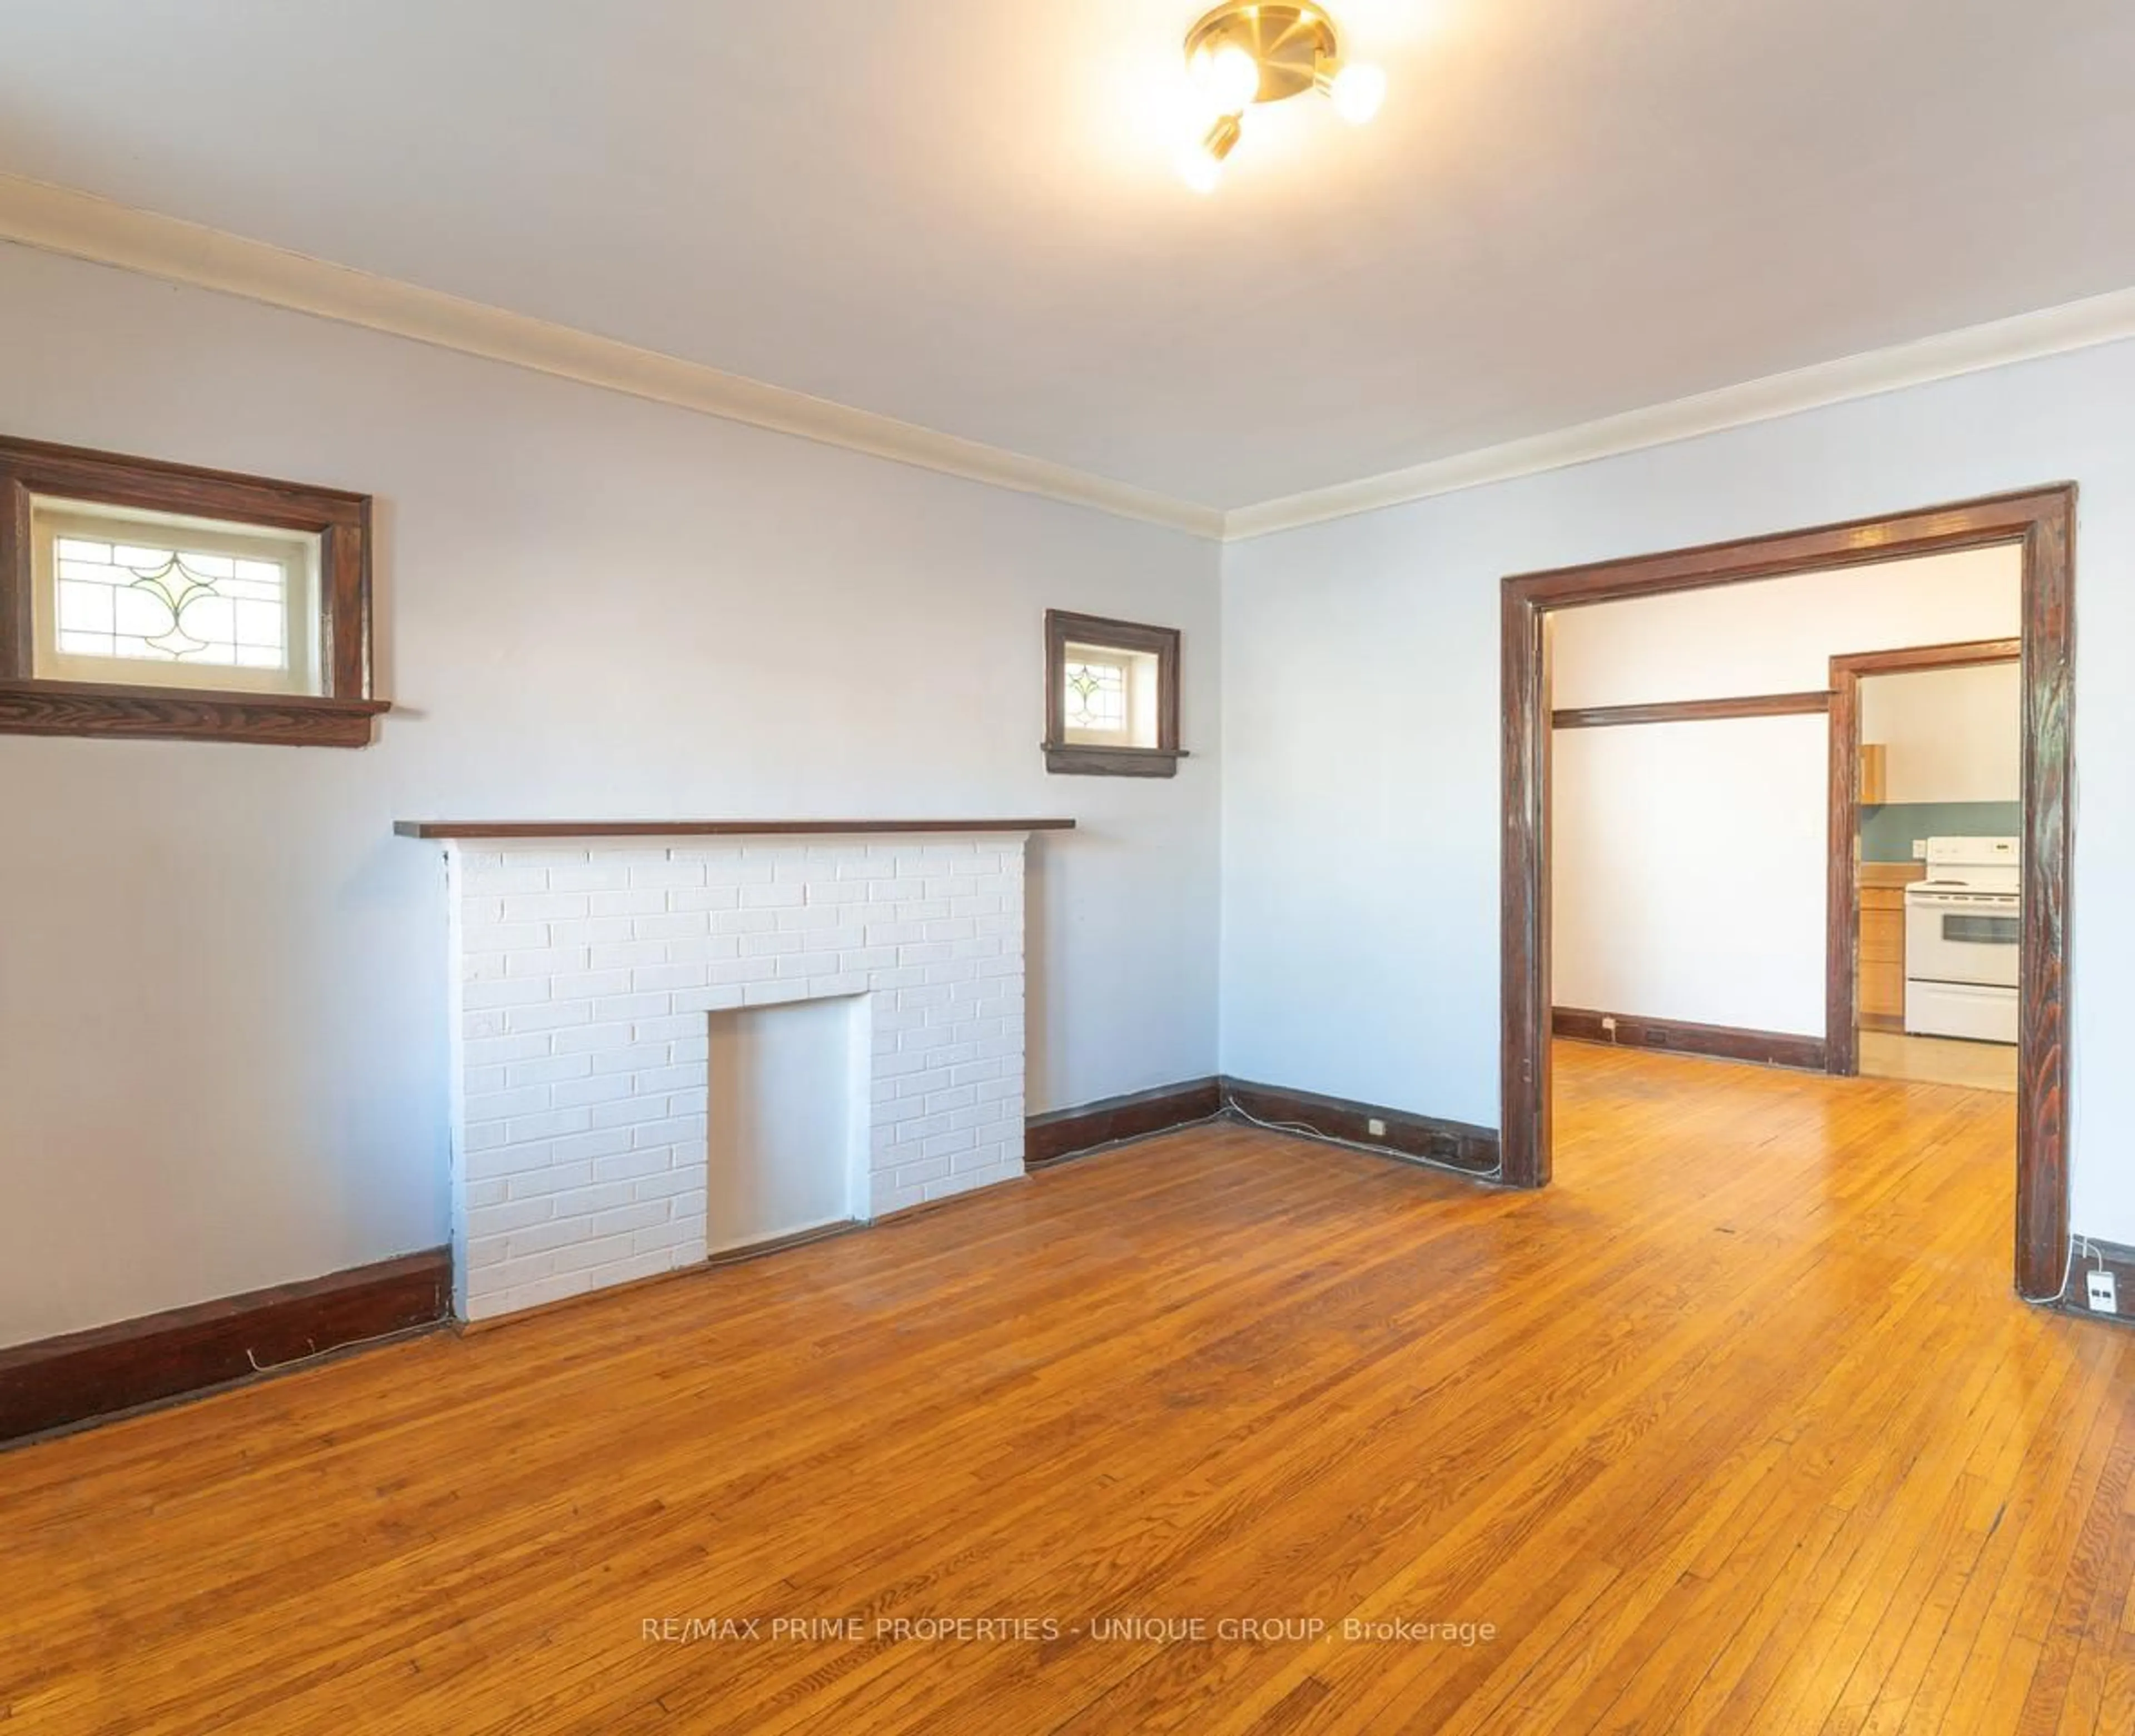
Main Floor
Dining
4.2 x 2.85Hardwood Floor
Kitchen
4.2 x 2.0Br
4.2 x 2.9Hardwood Floor
2nd Br
3.6 x 2.75Hardwood Floor
Exterior
Features
Parking
Garage spaces 2
Garage type Detached
Other parking spaces 0
Total parking spaces 2
Property History
 24
24

