Unknown for 250 Wellington St #428, Toronto Ontario M5V 2V4
5 days on Market

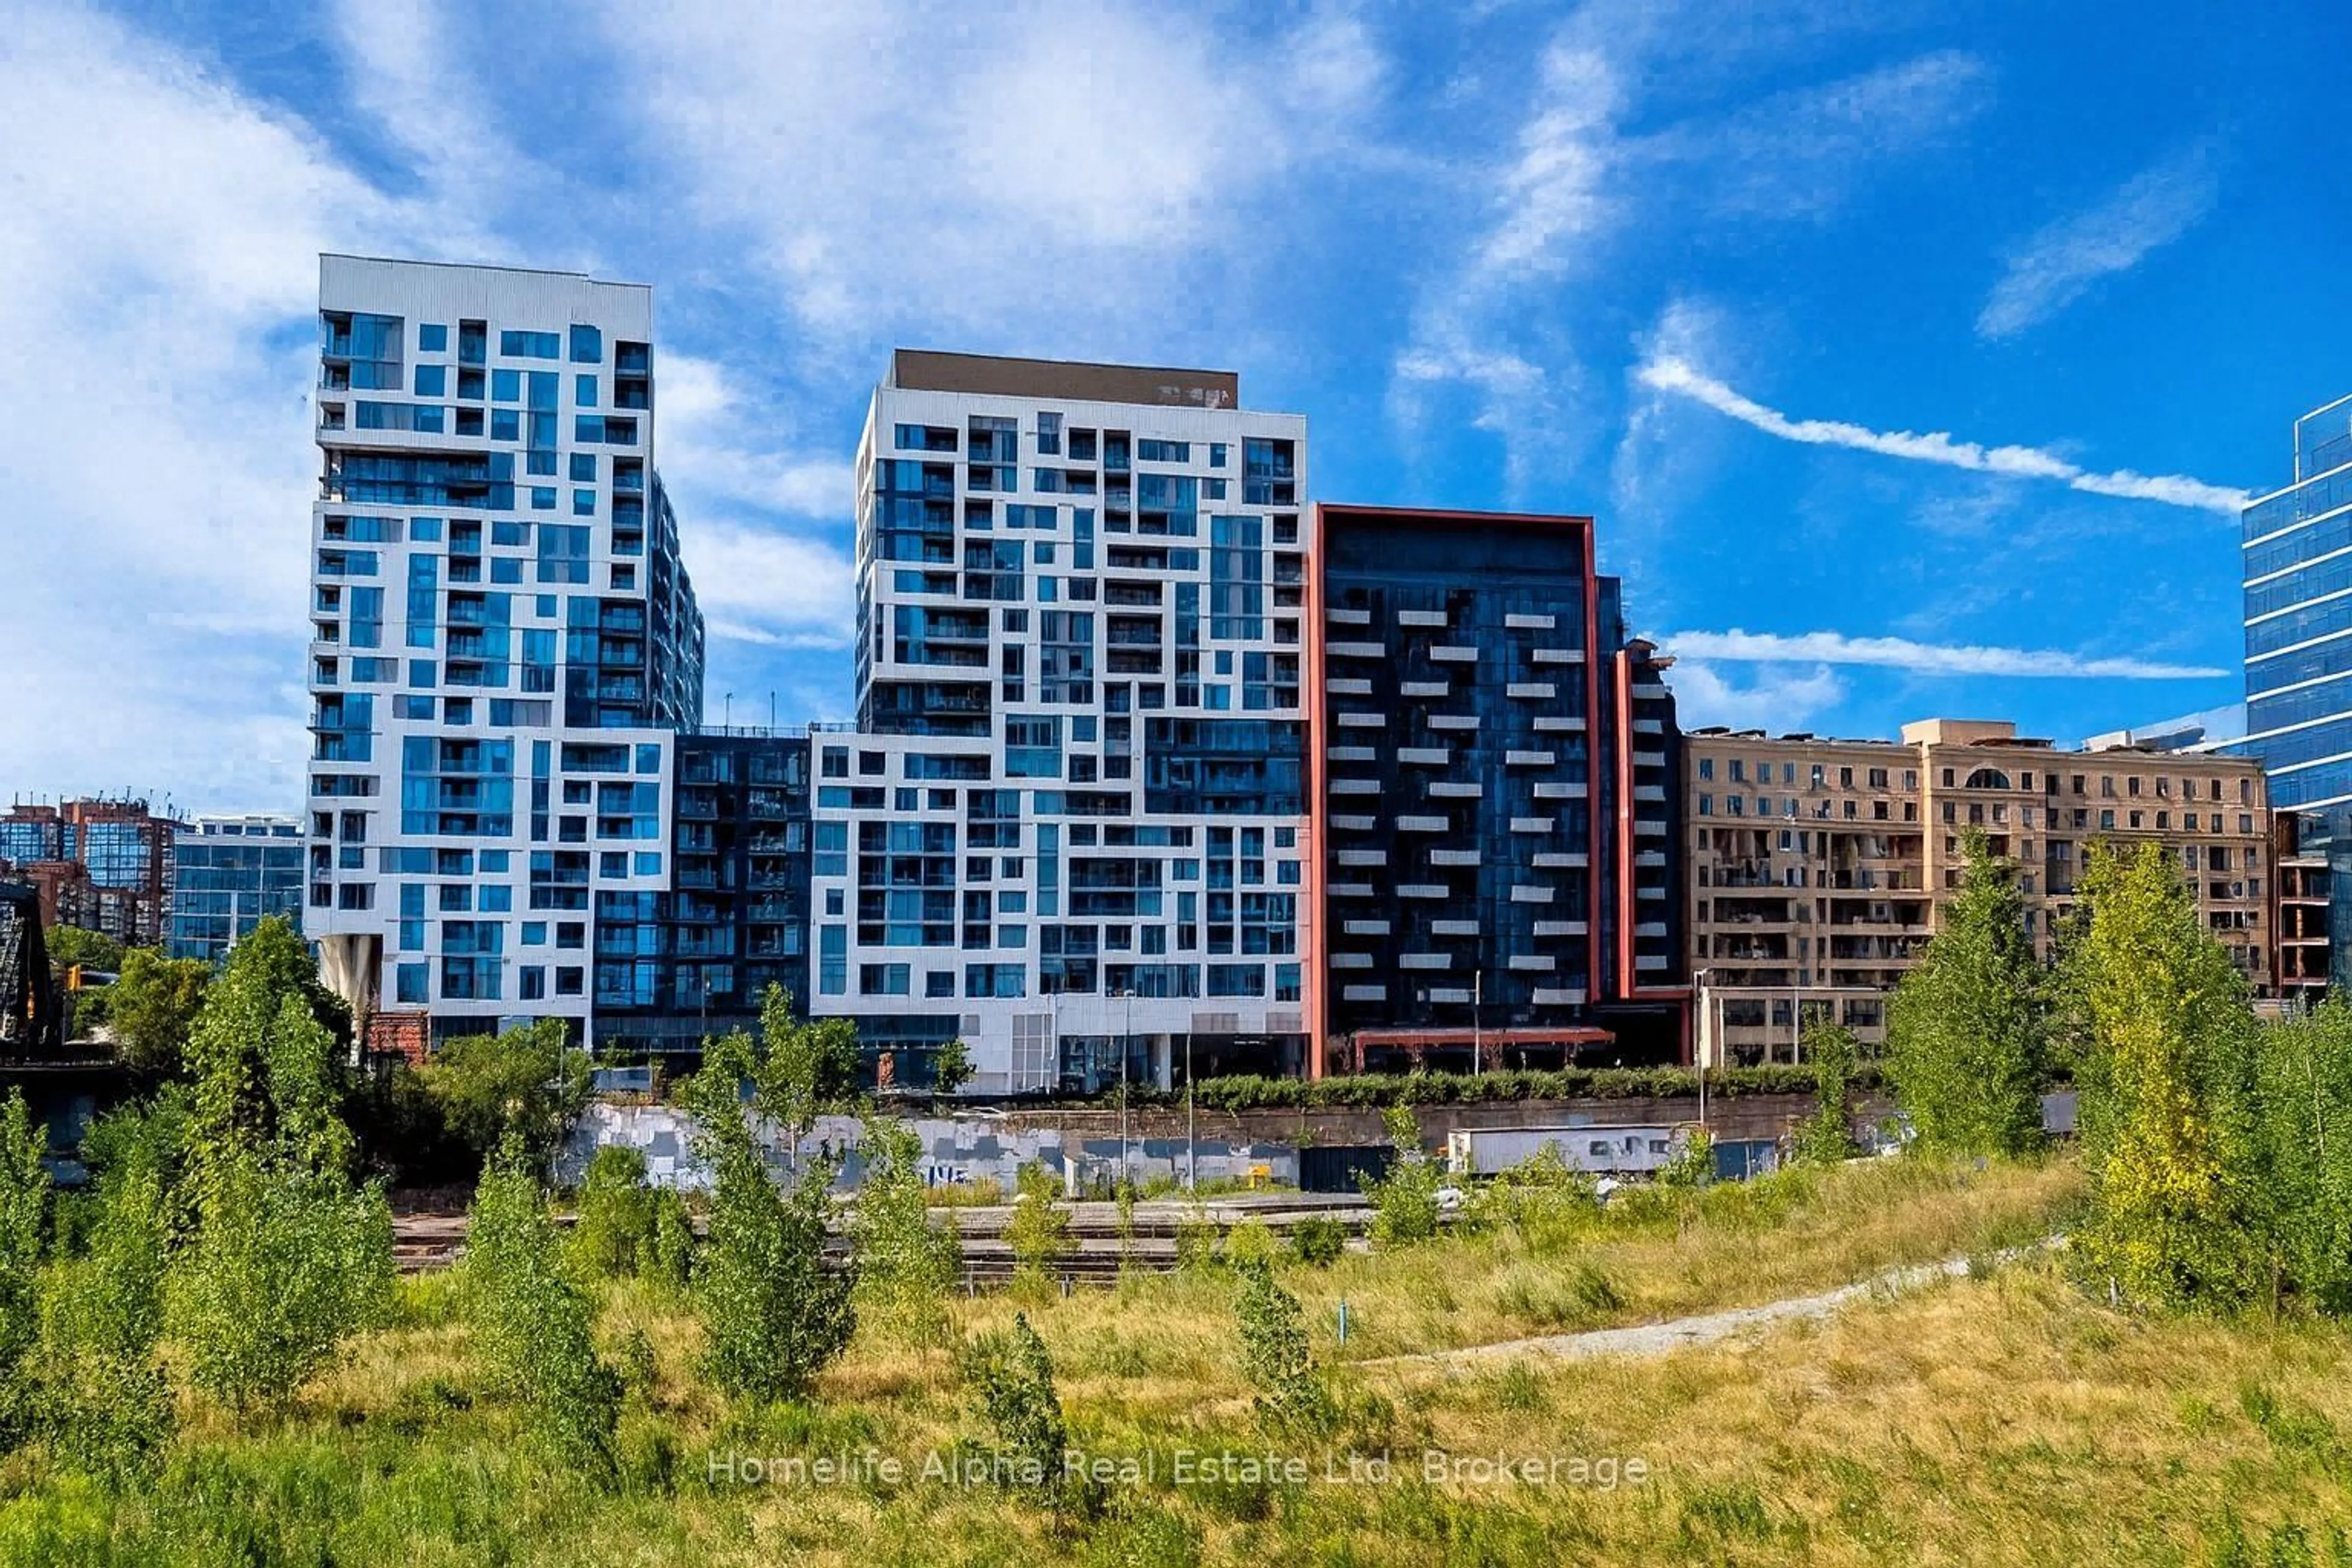
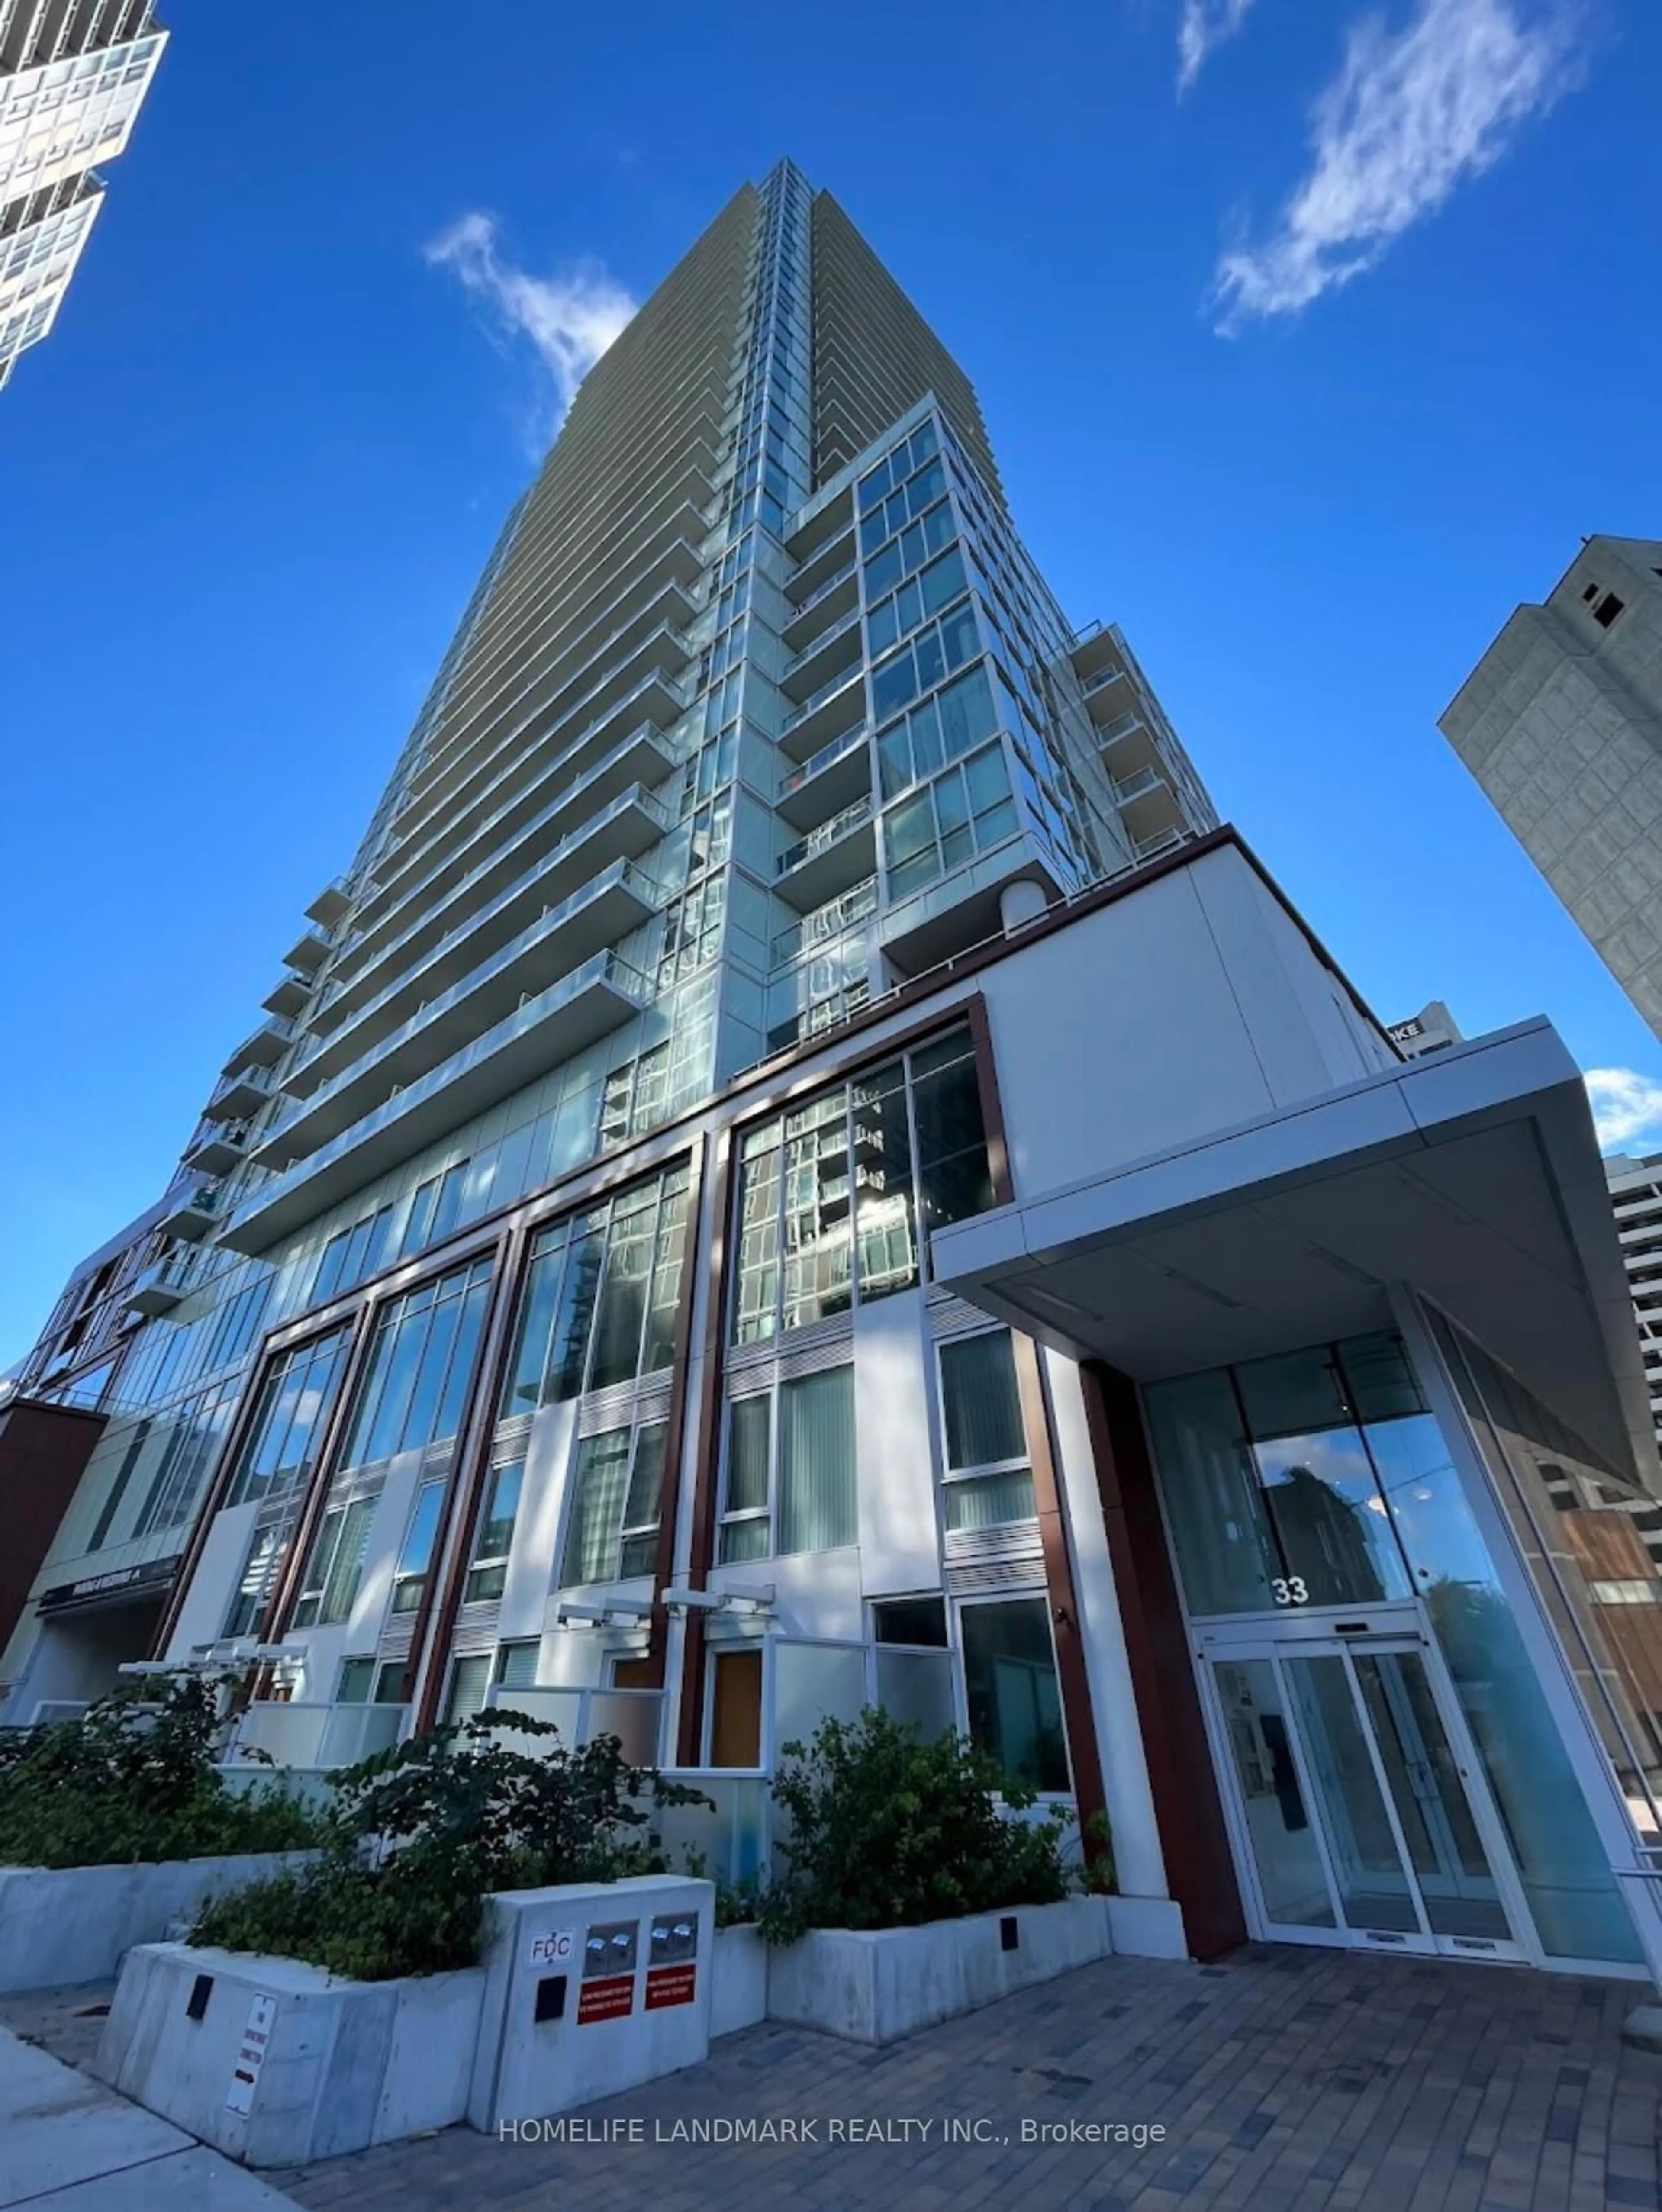
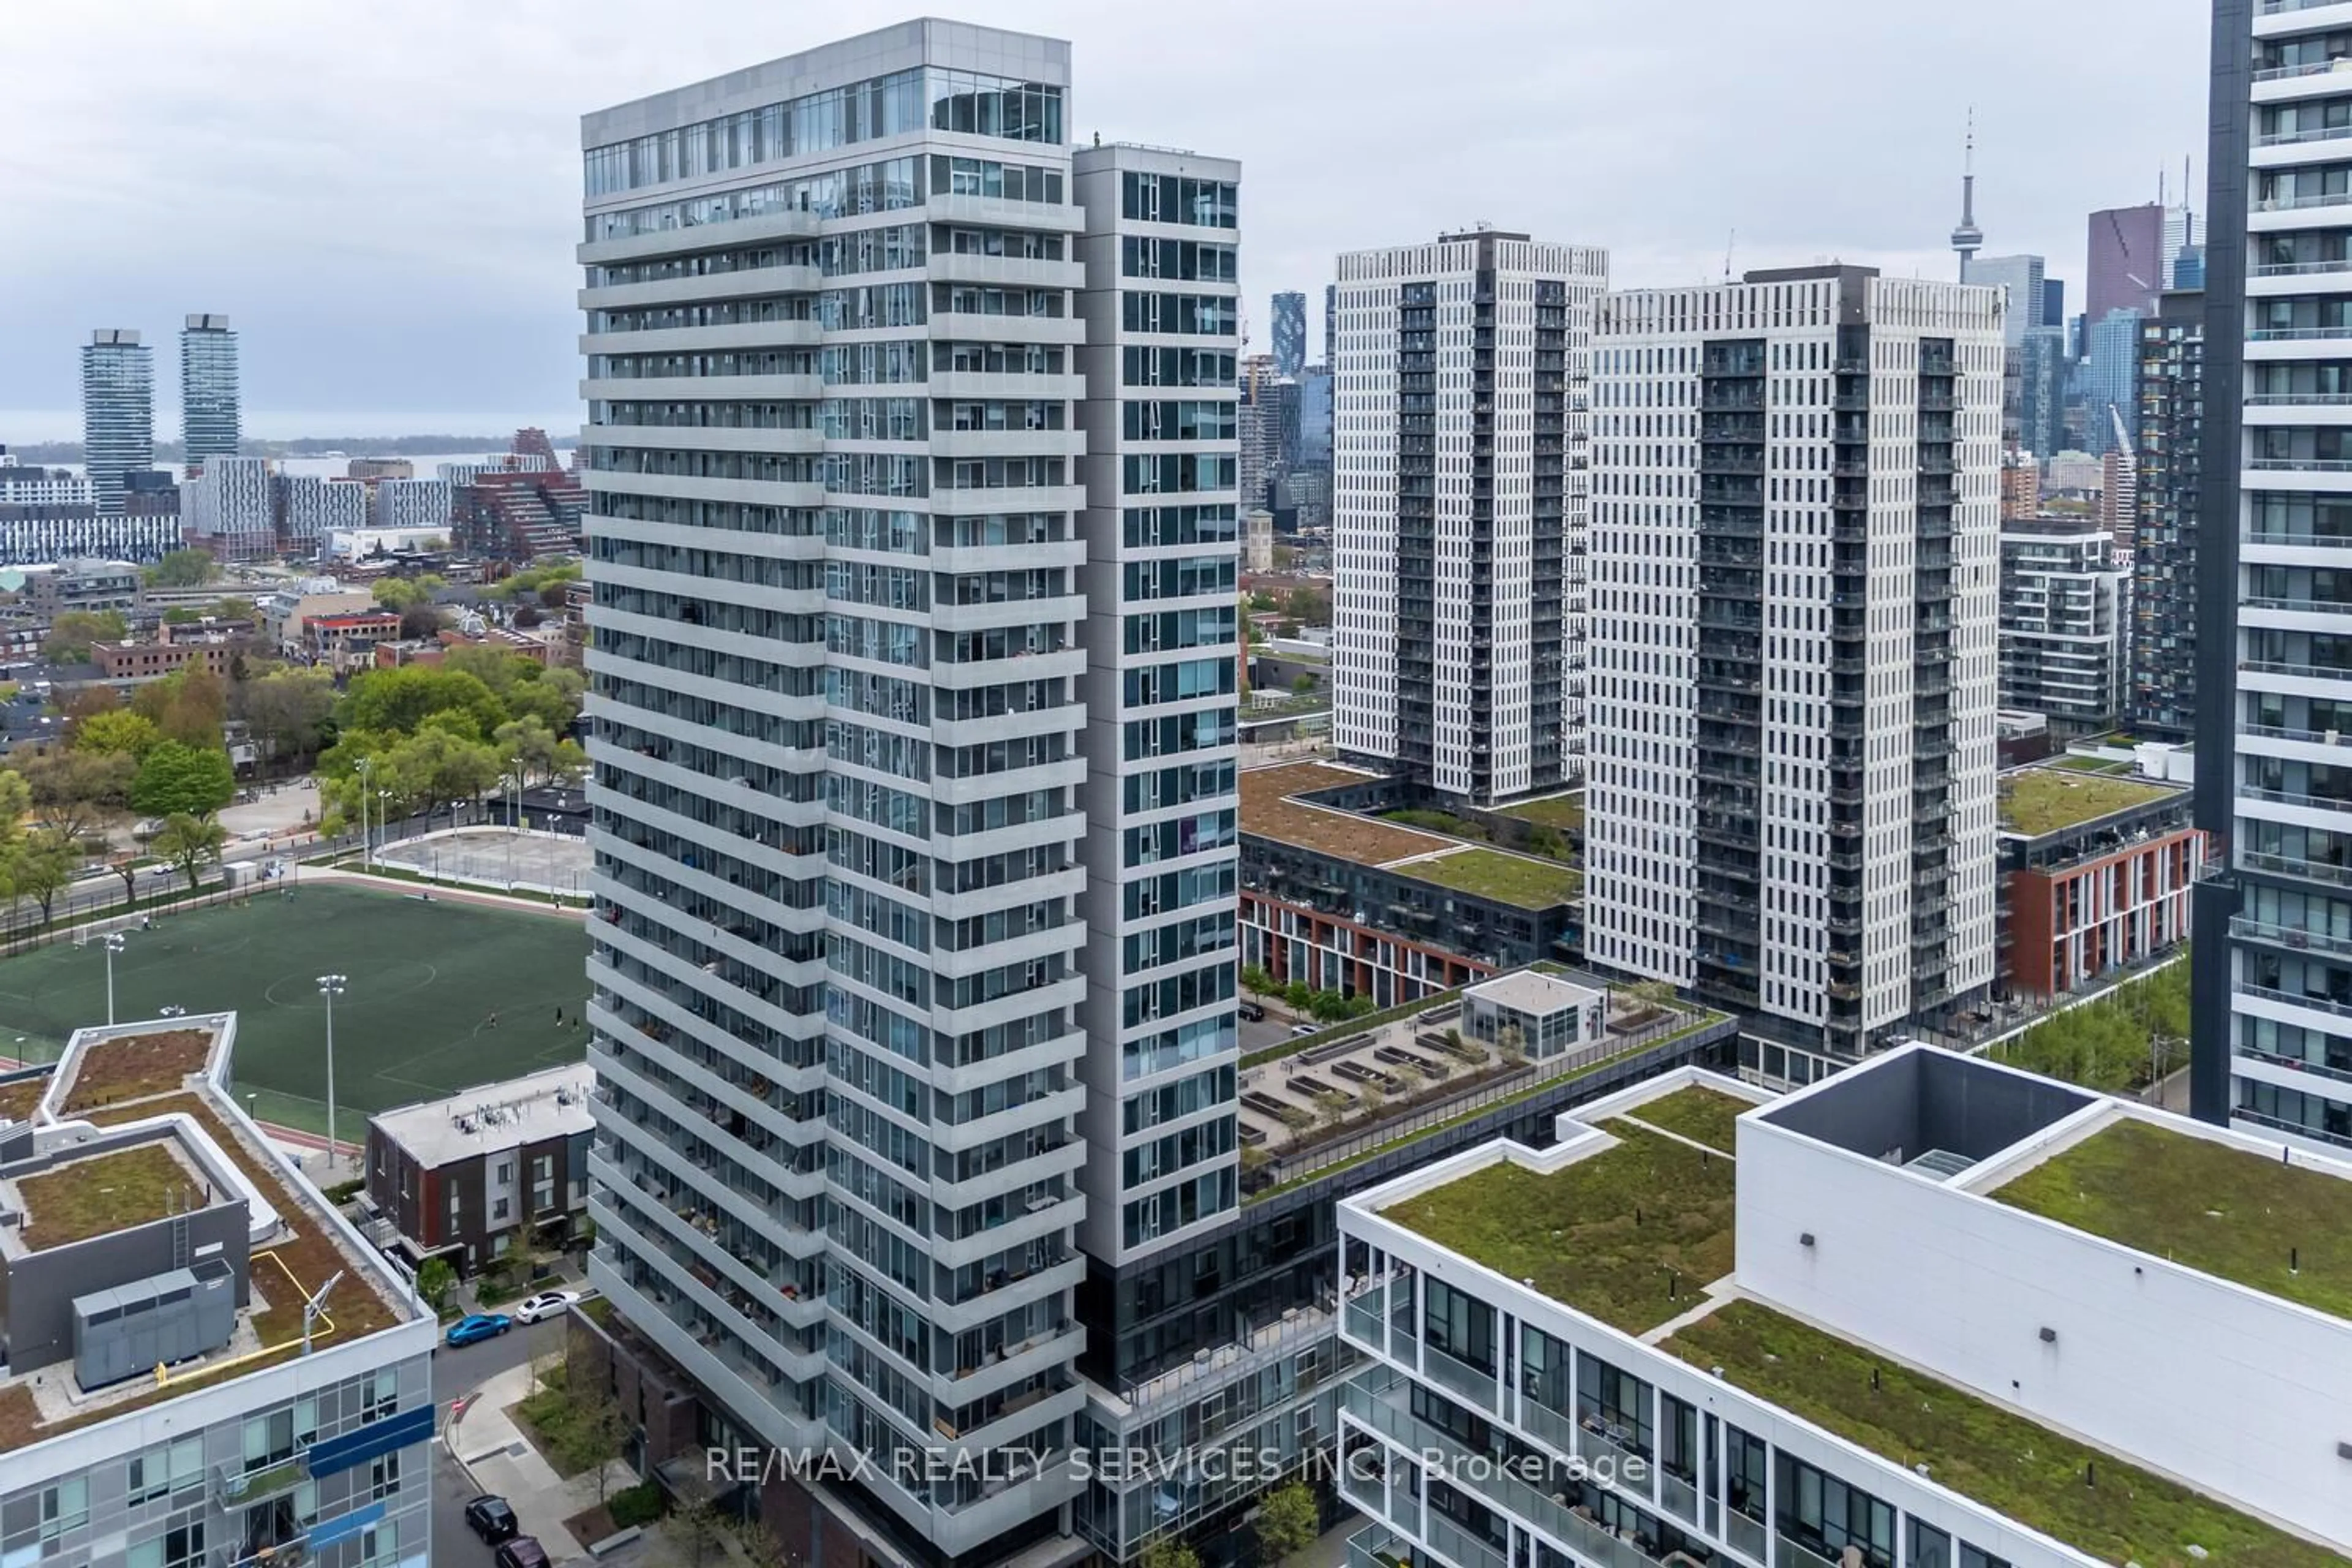
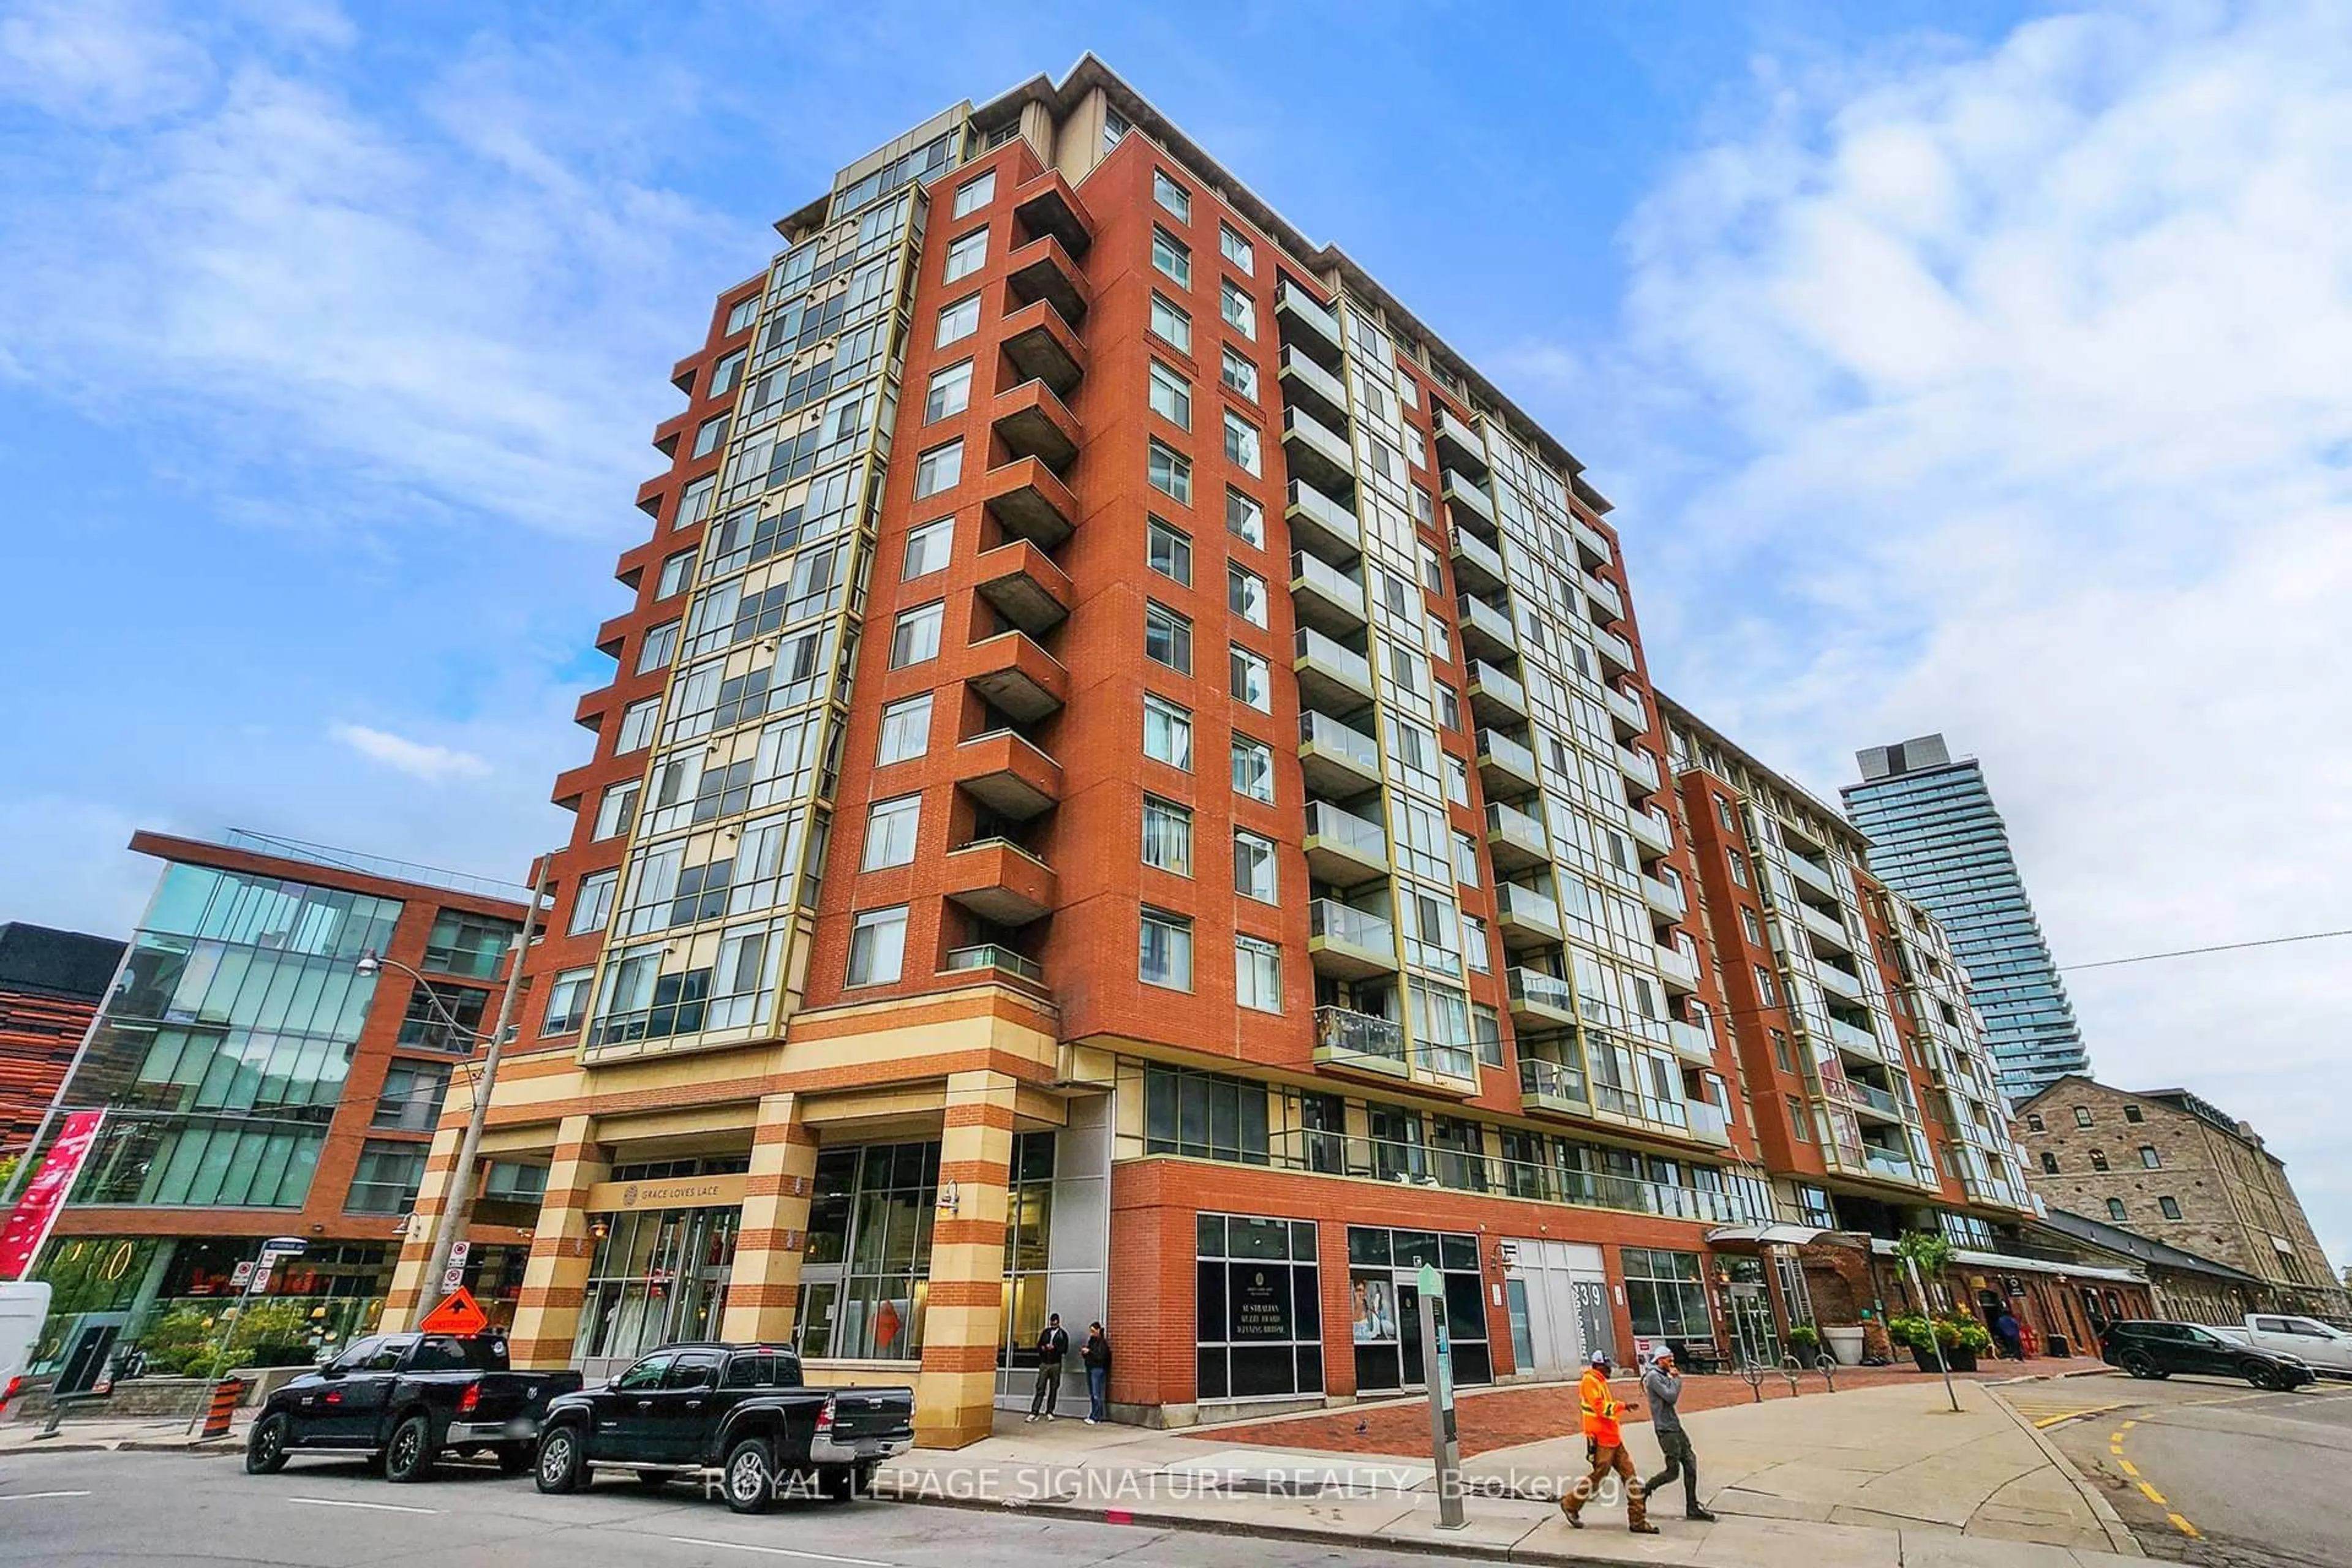
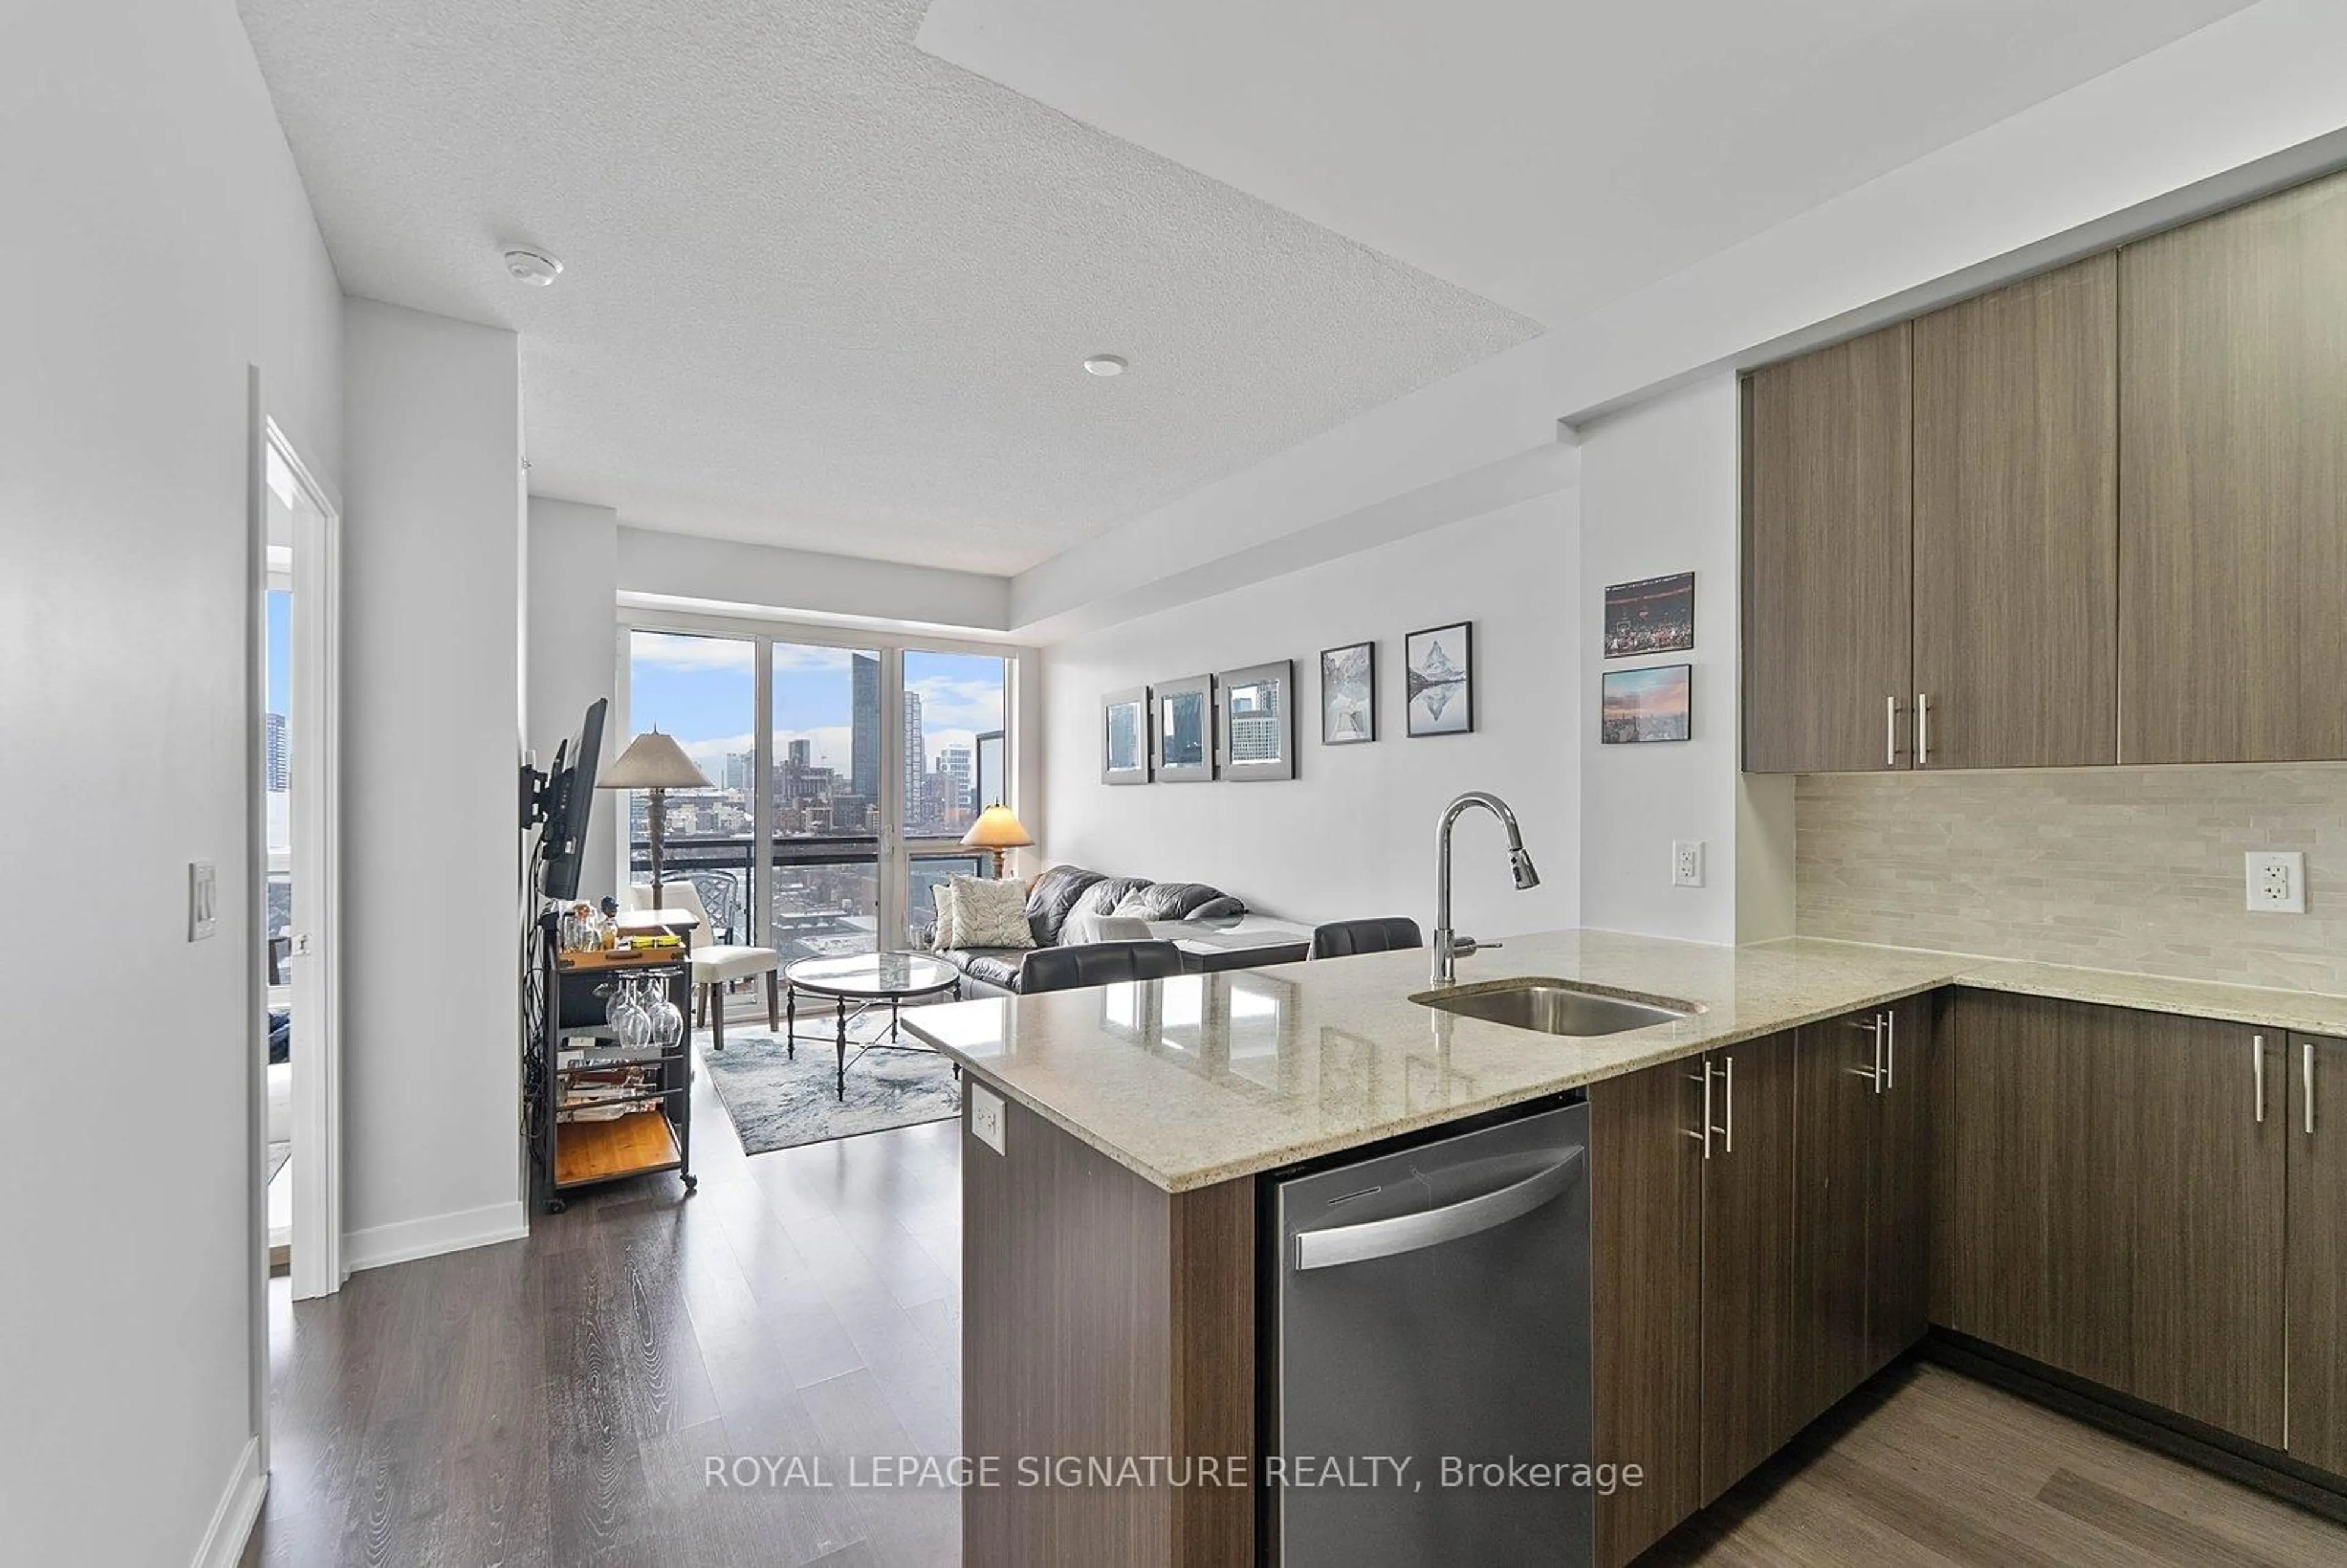
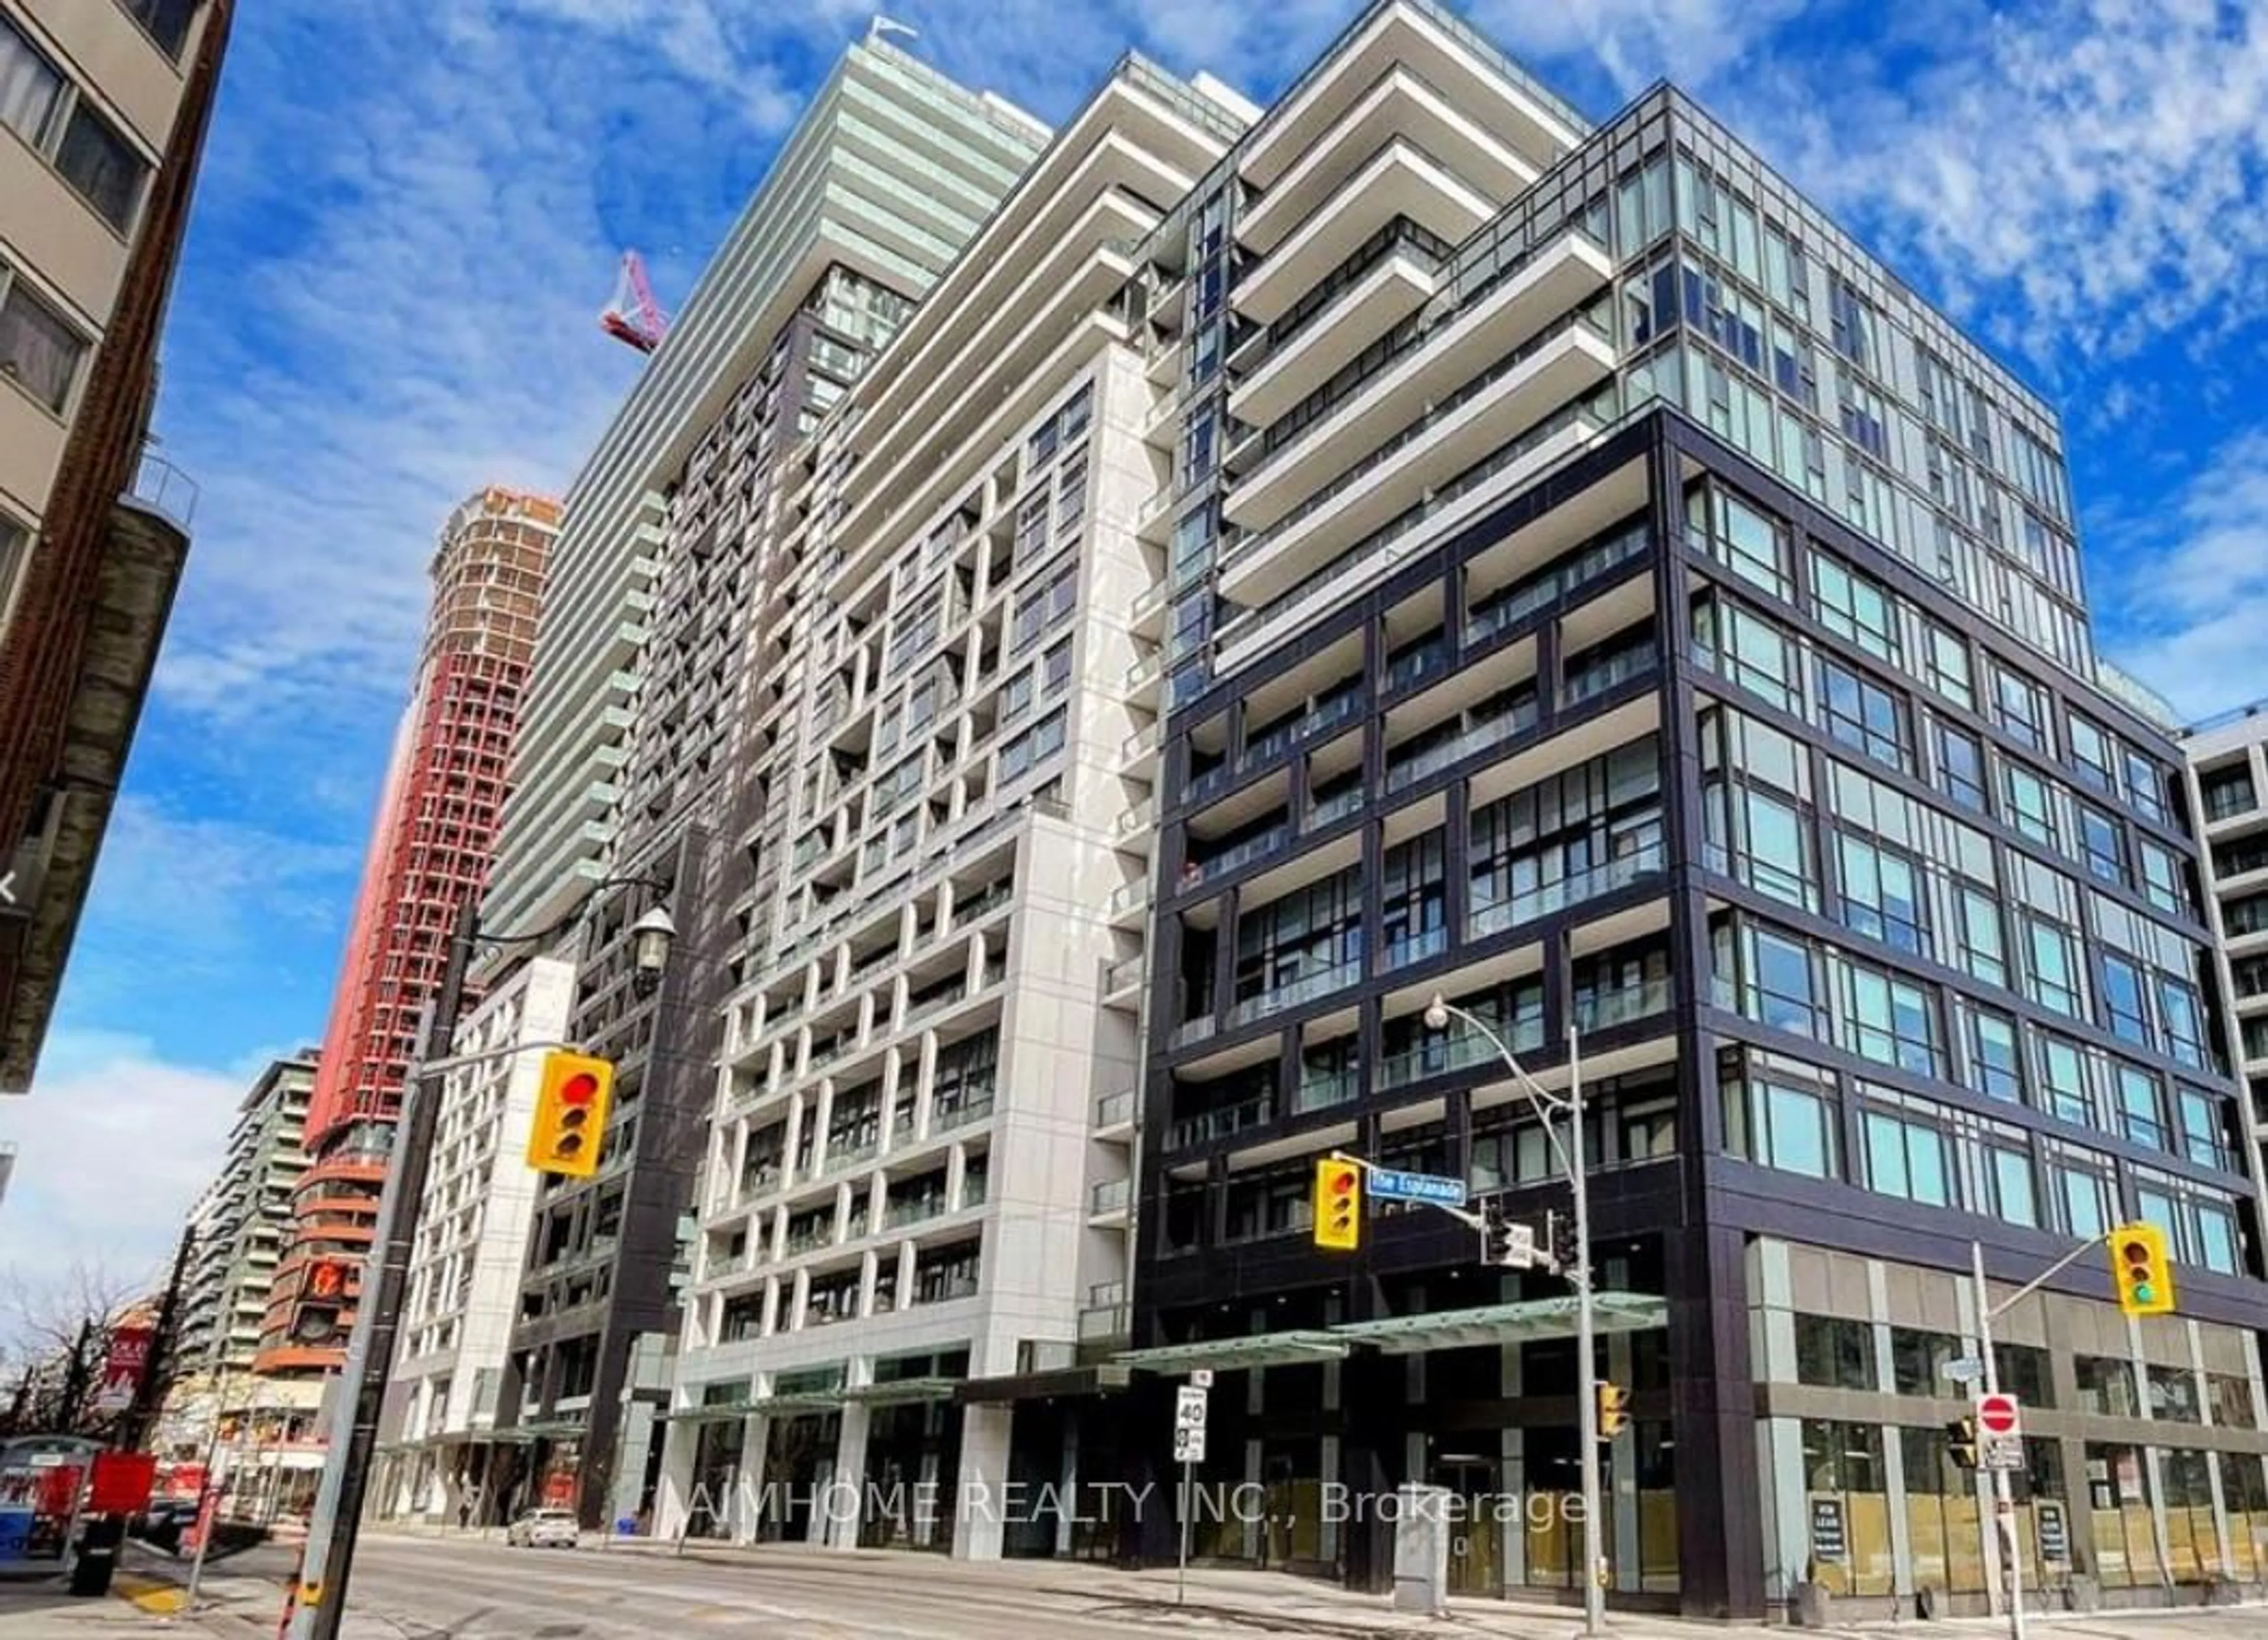
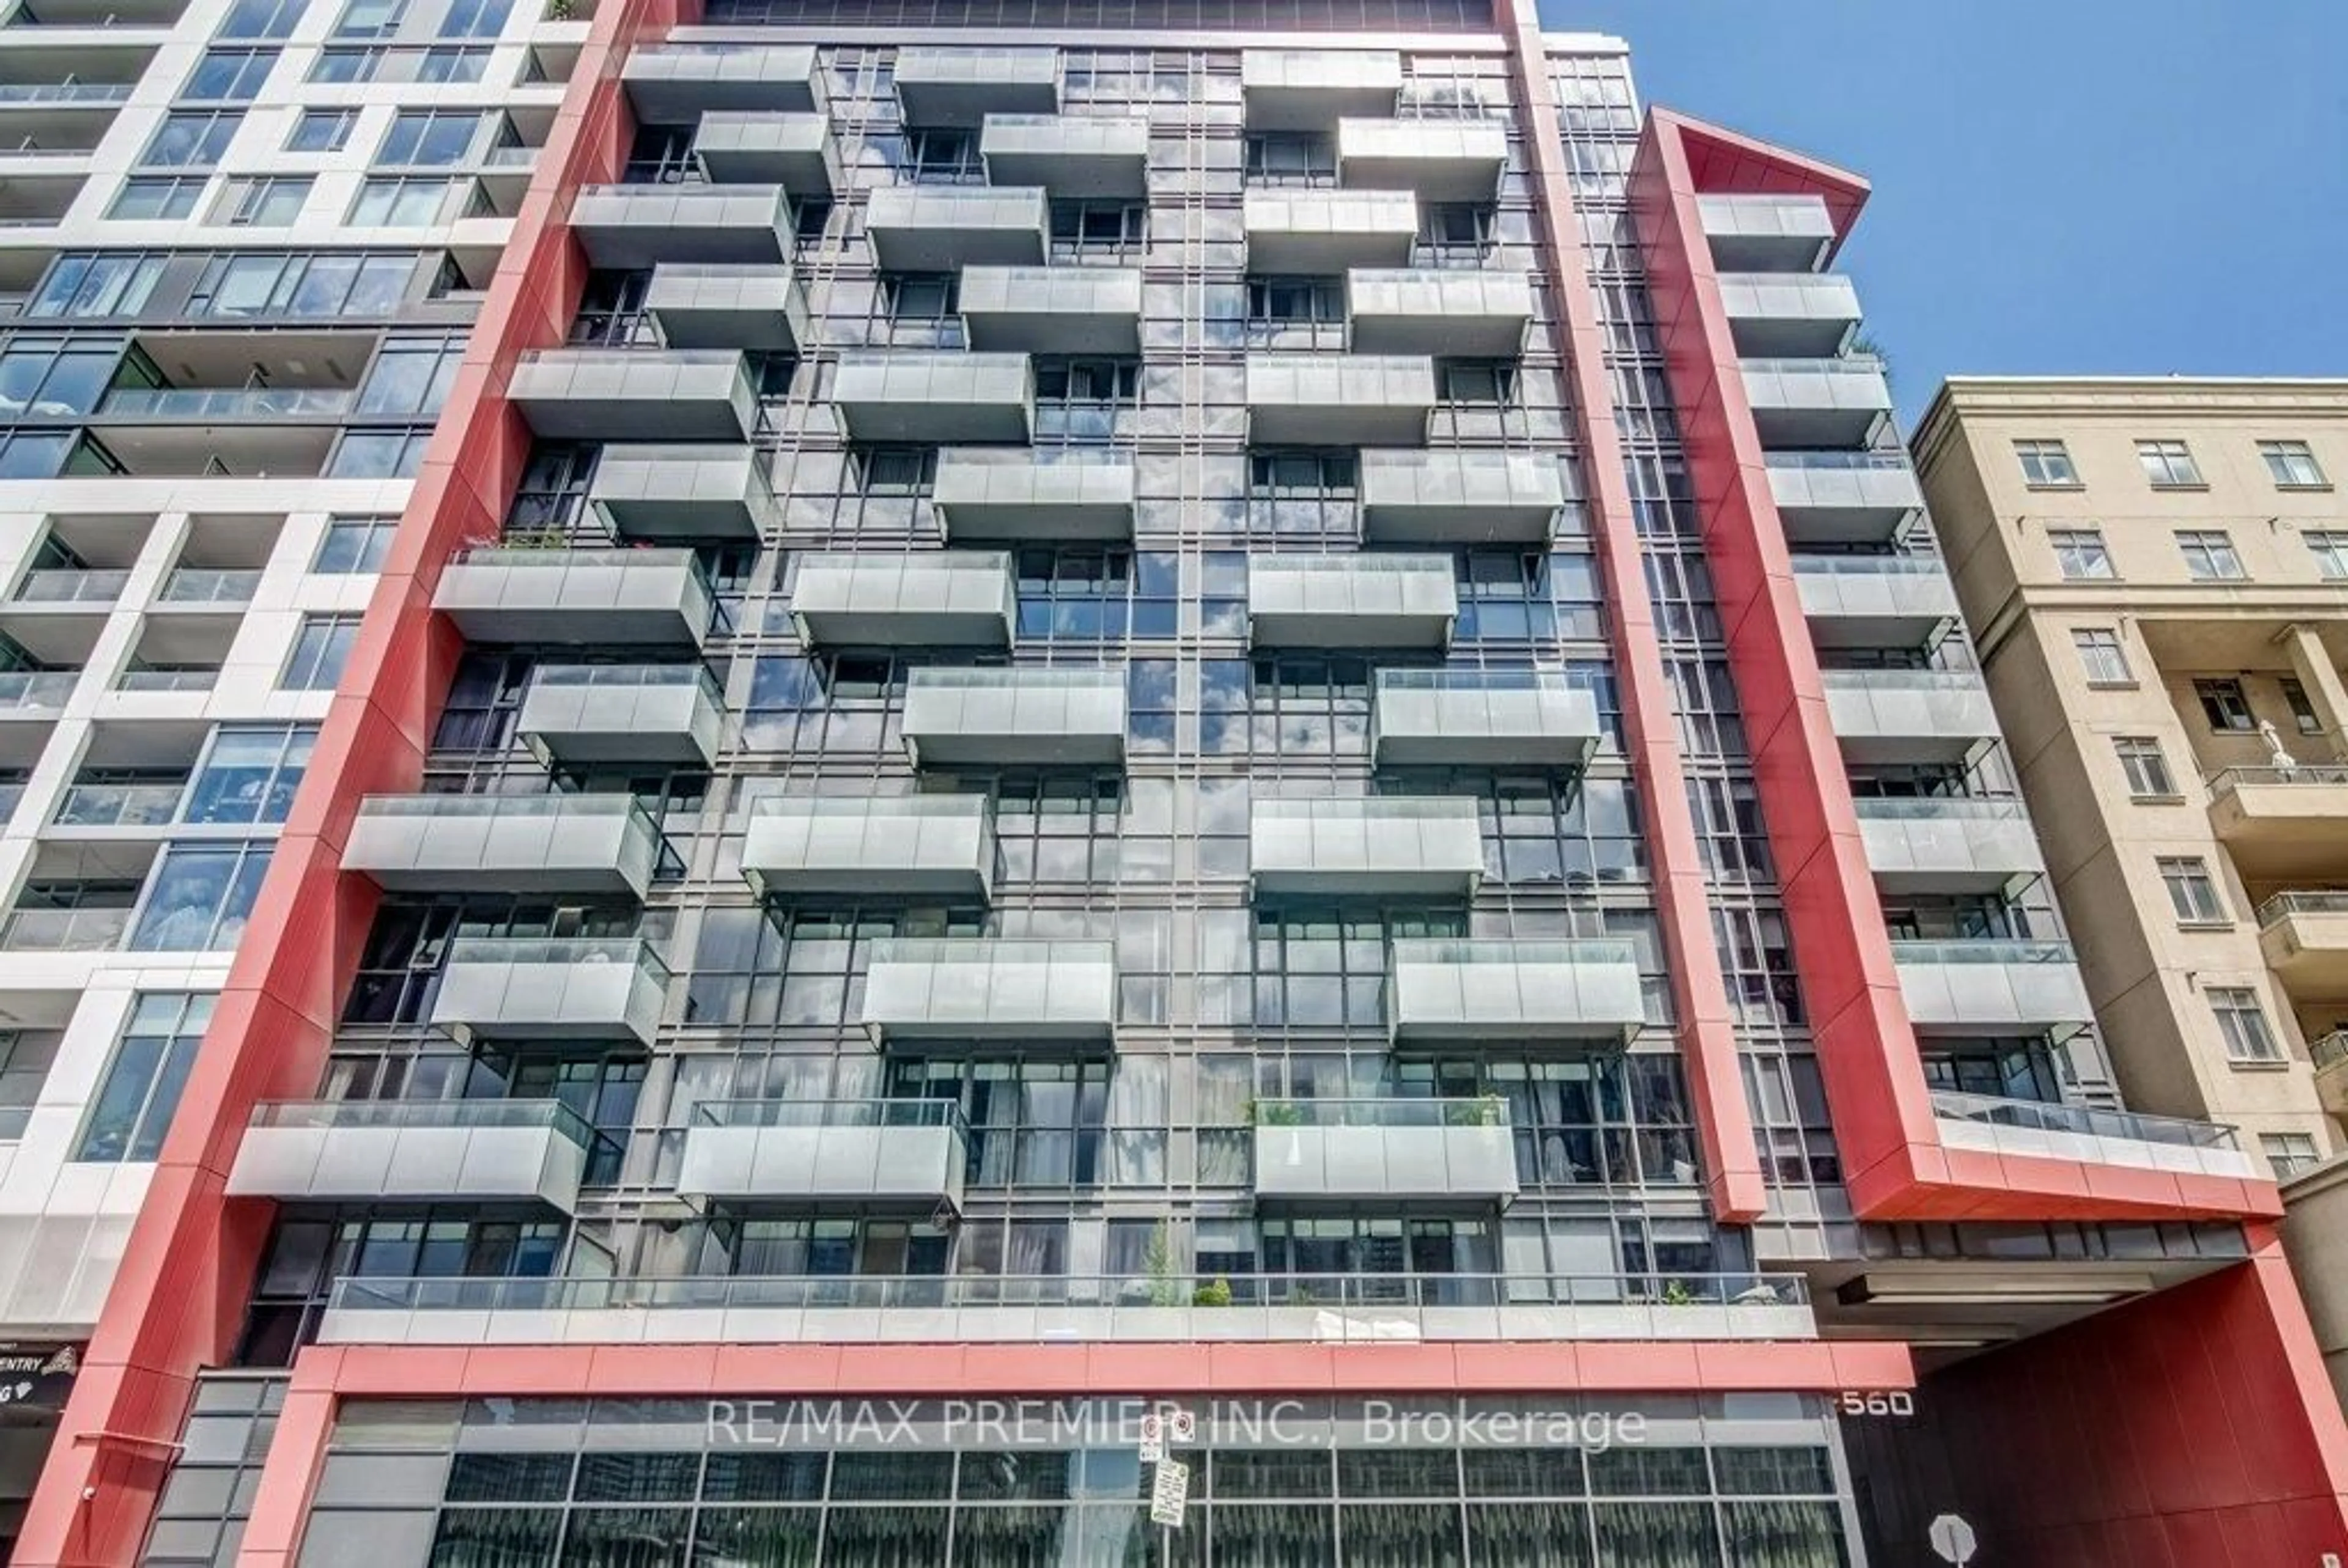
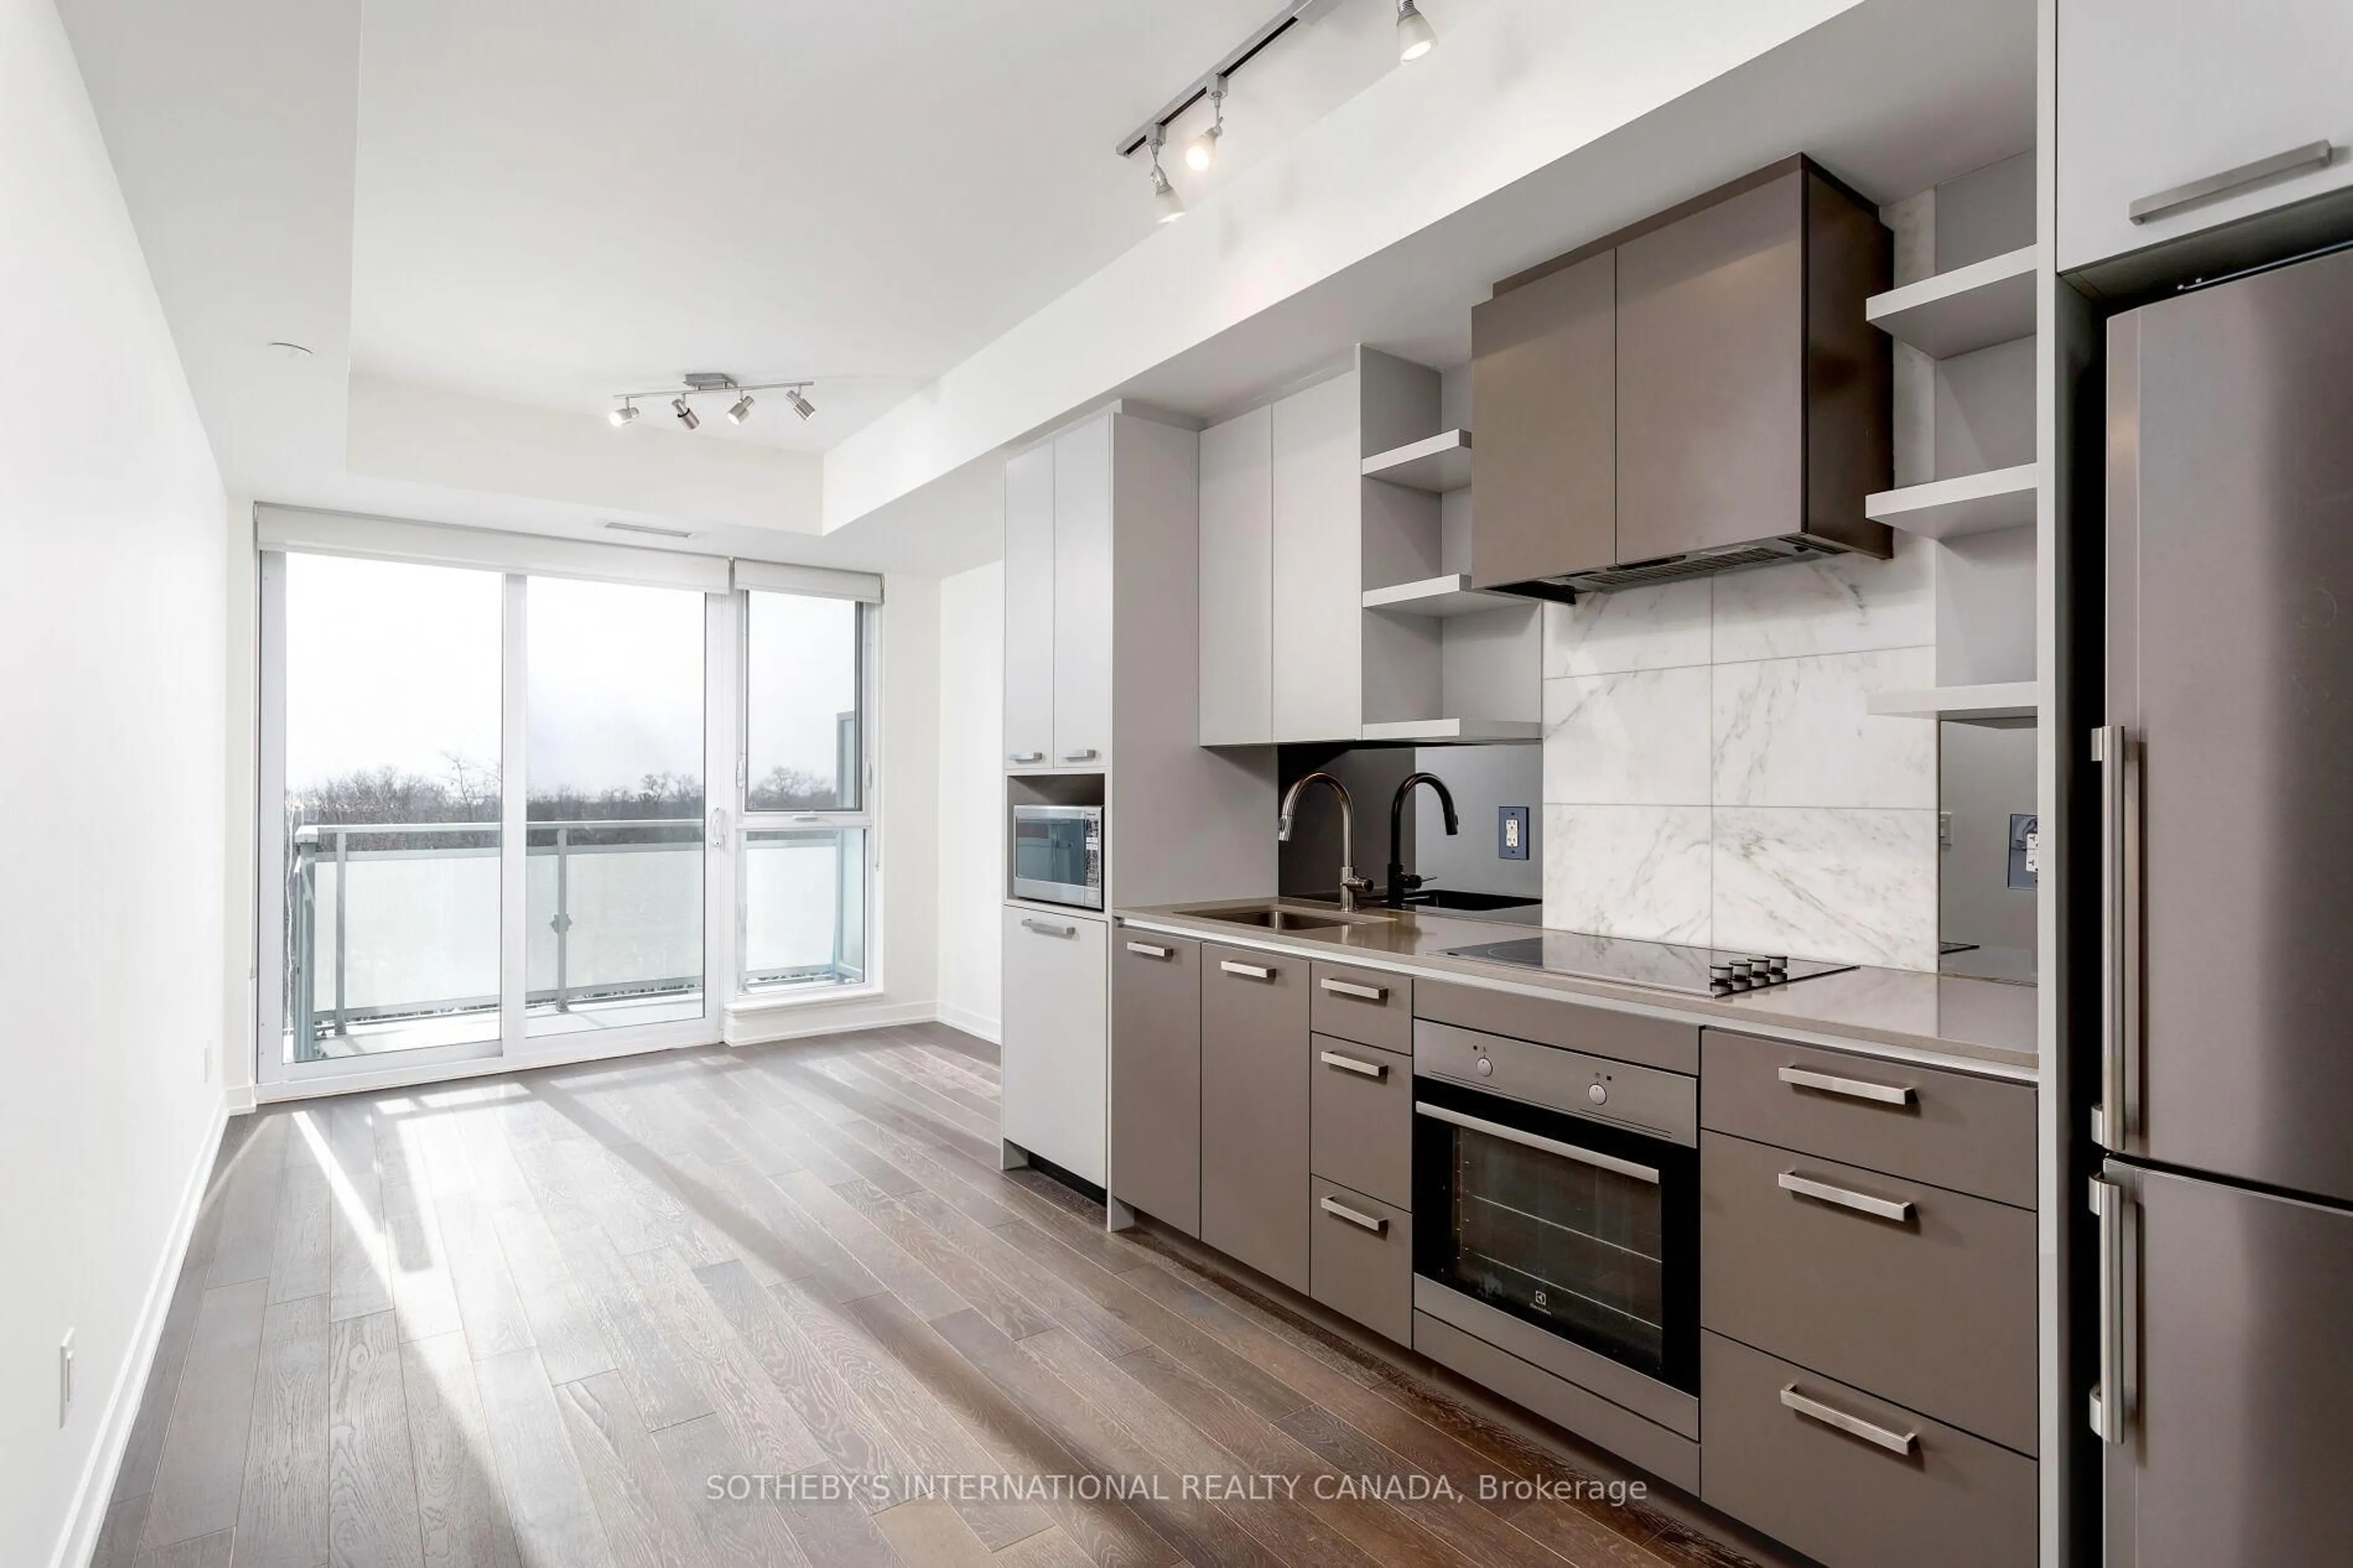
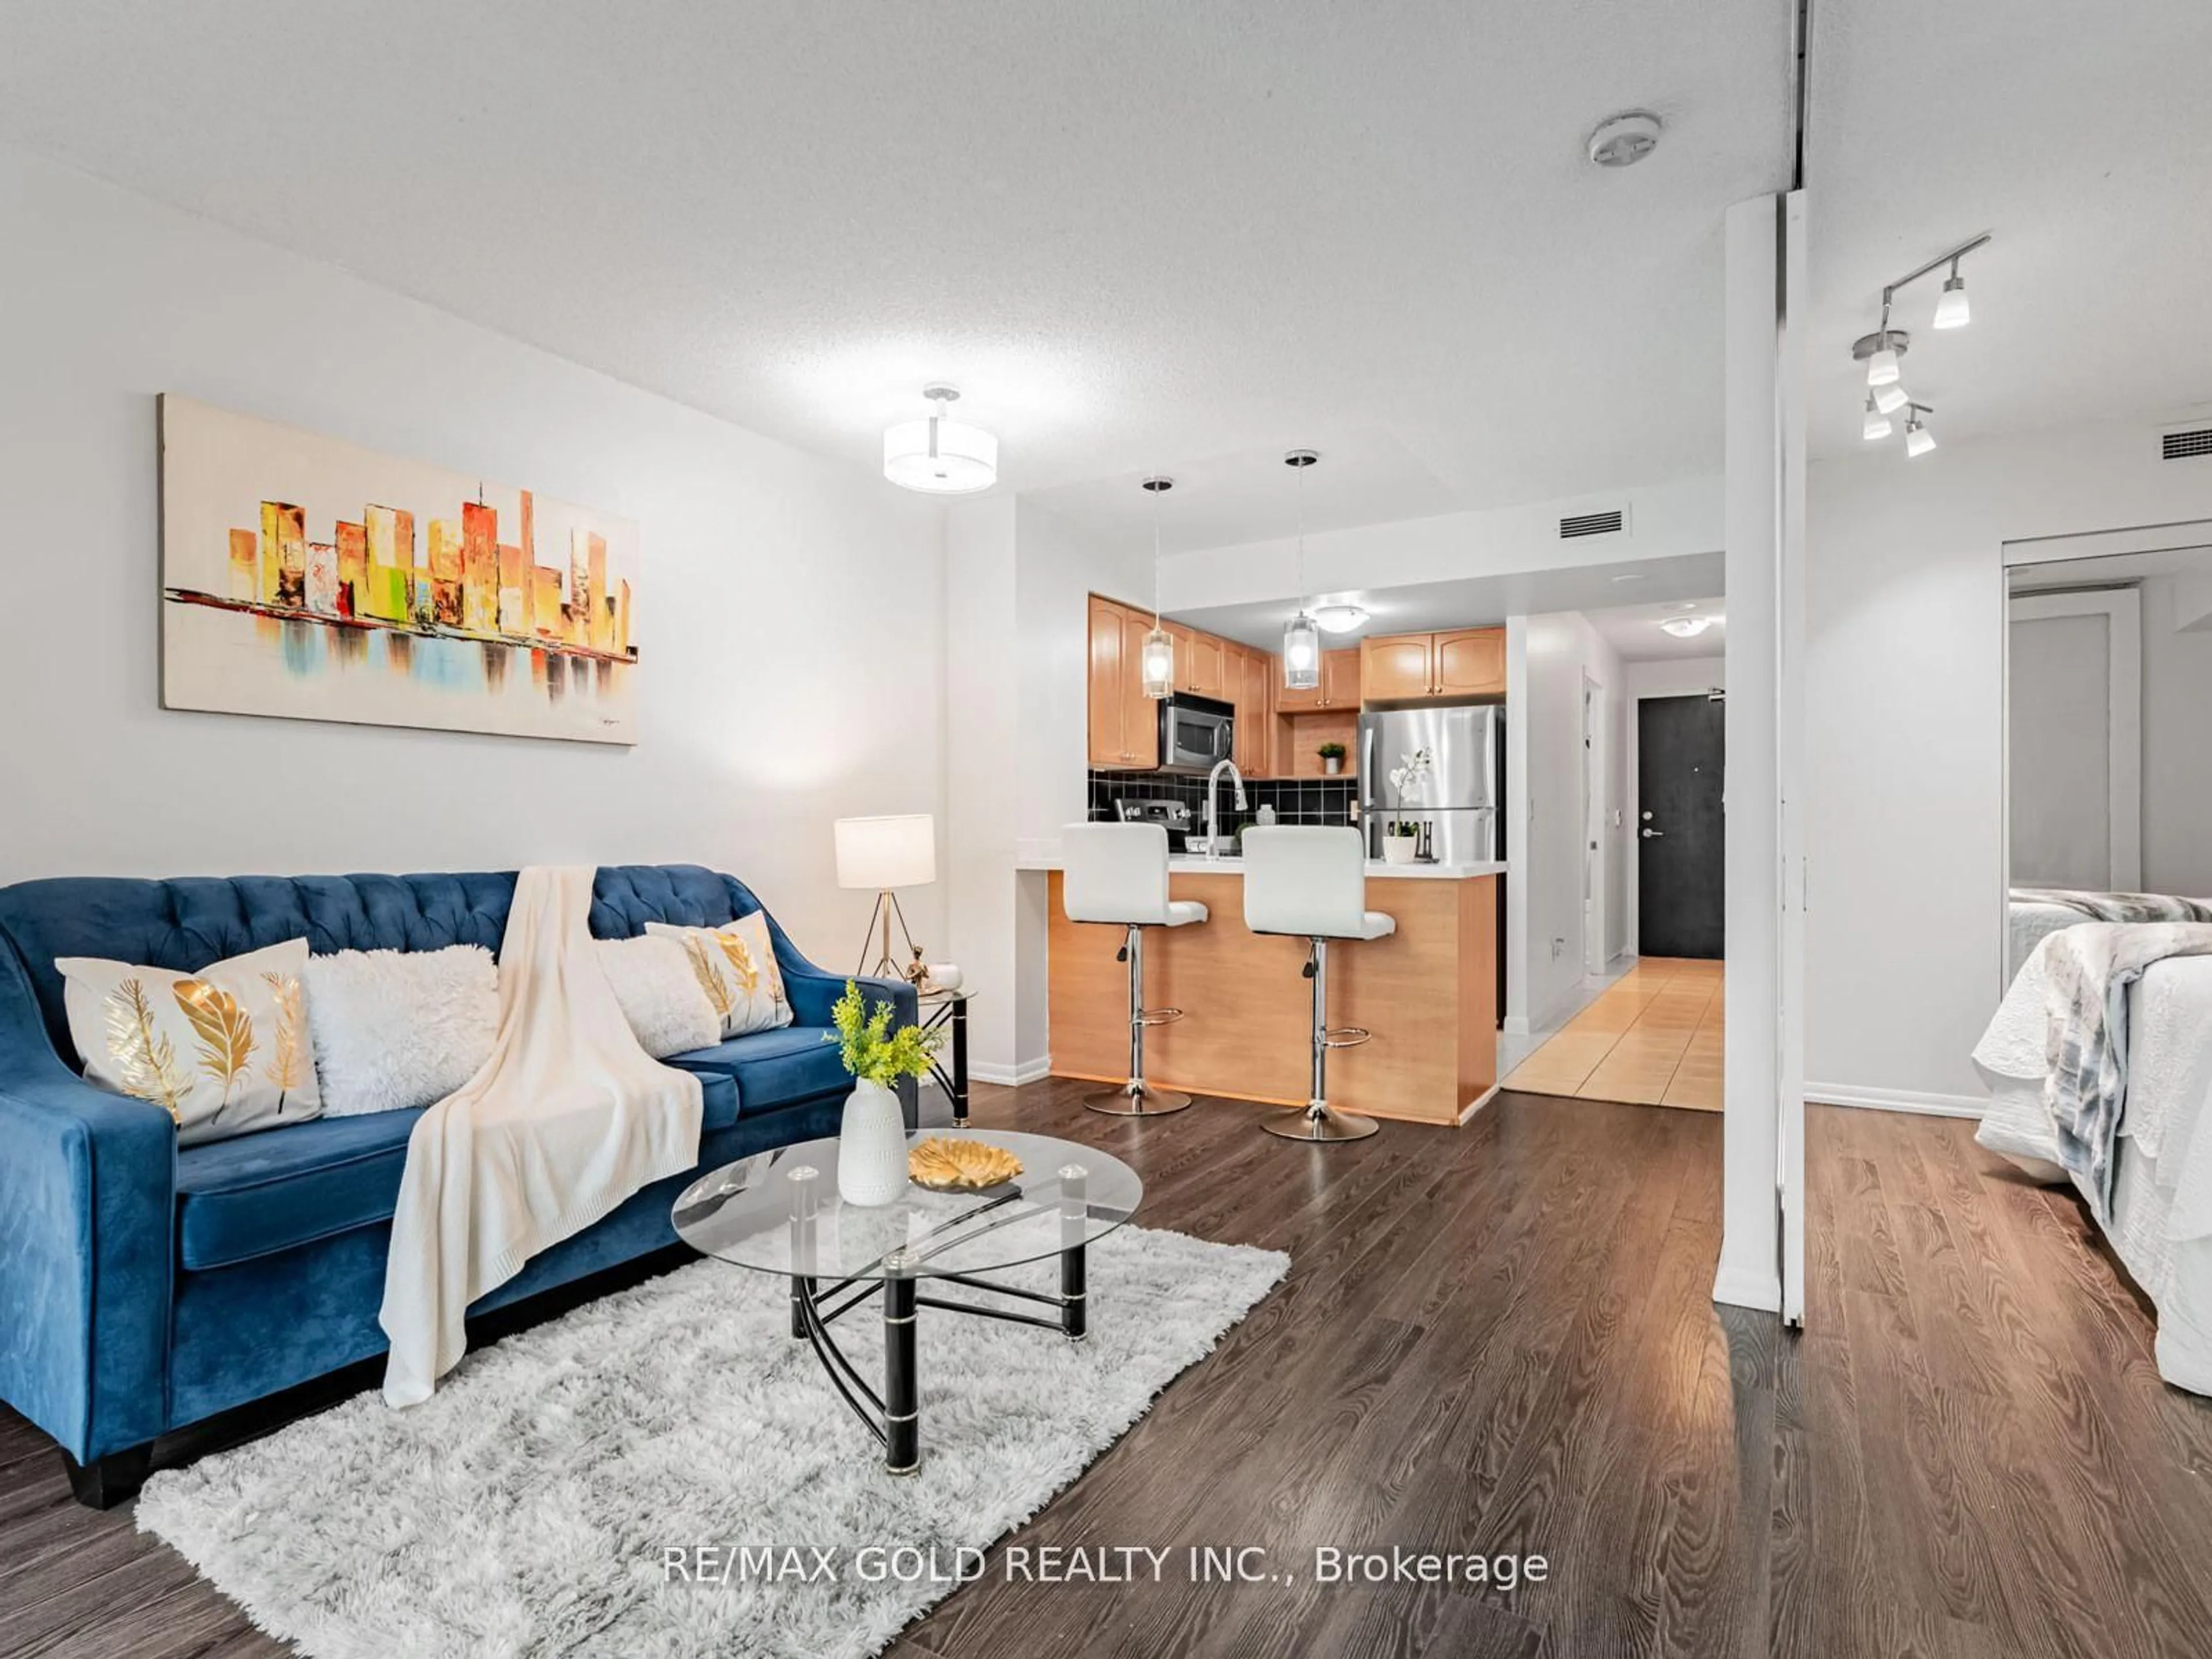
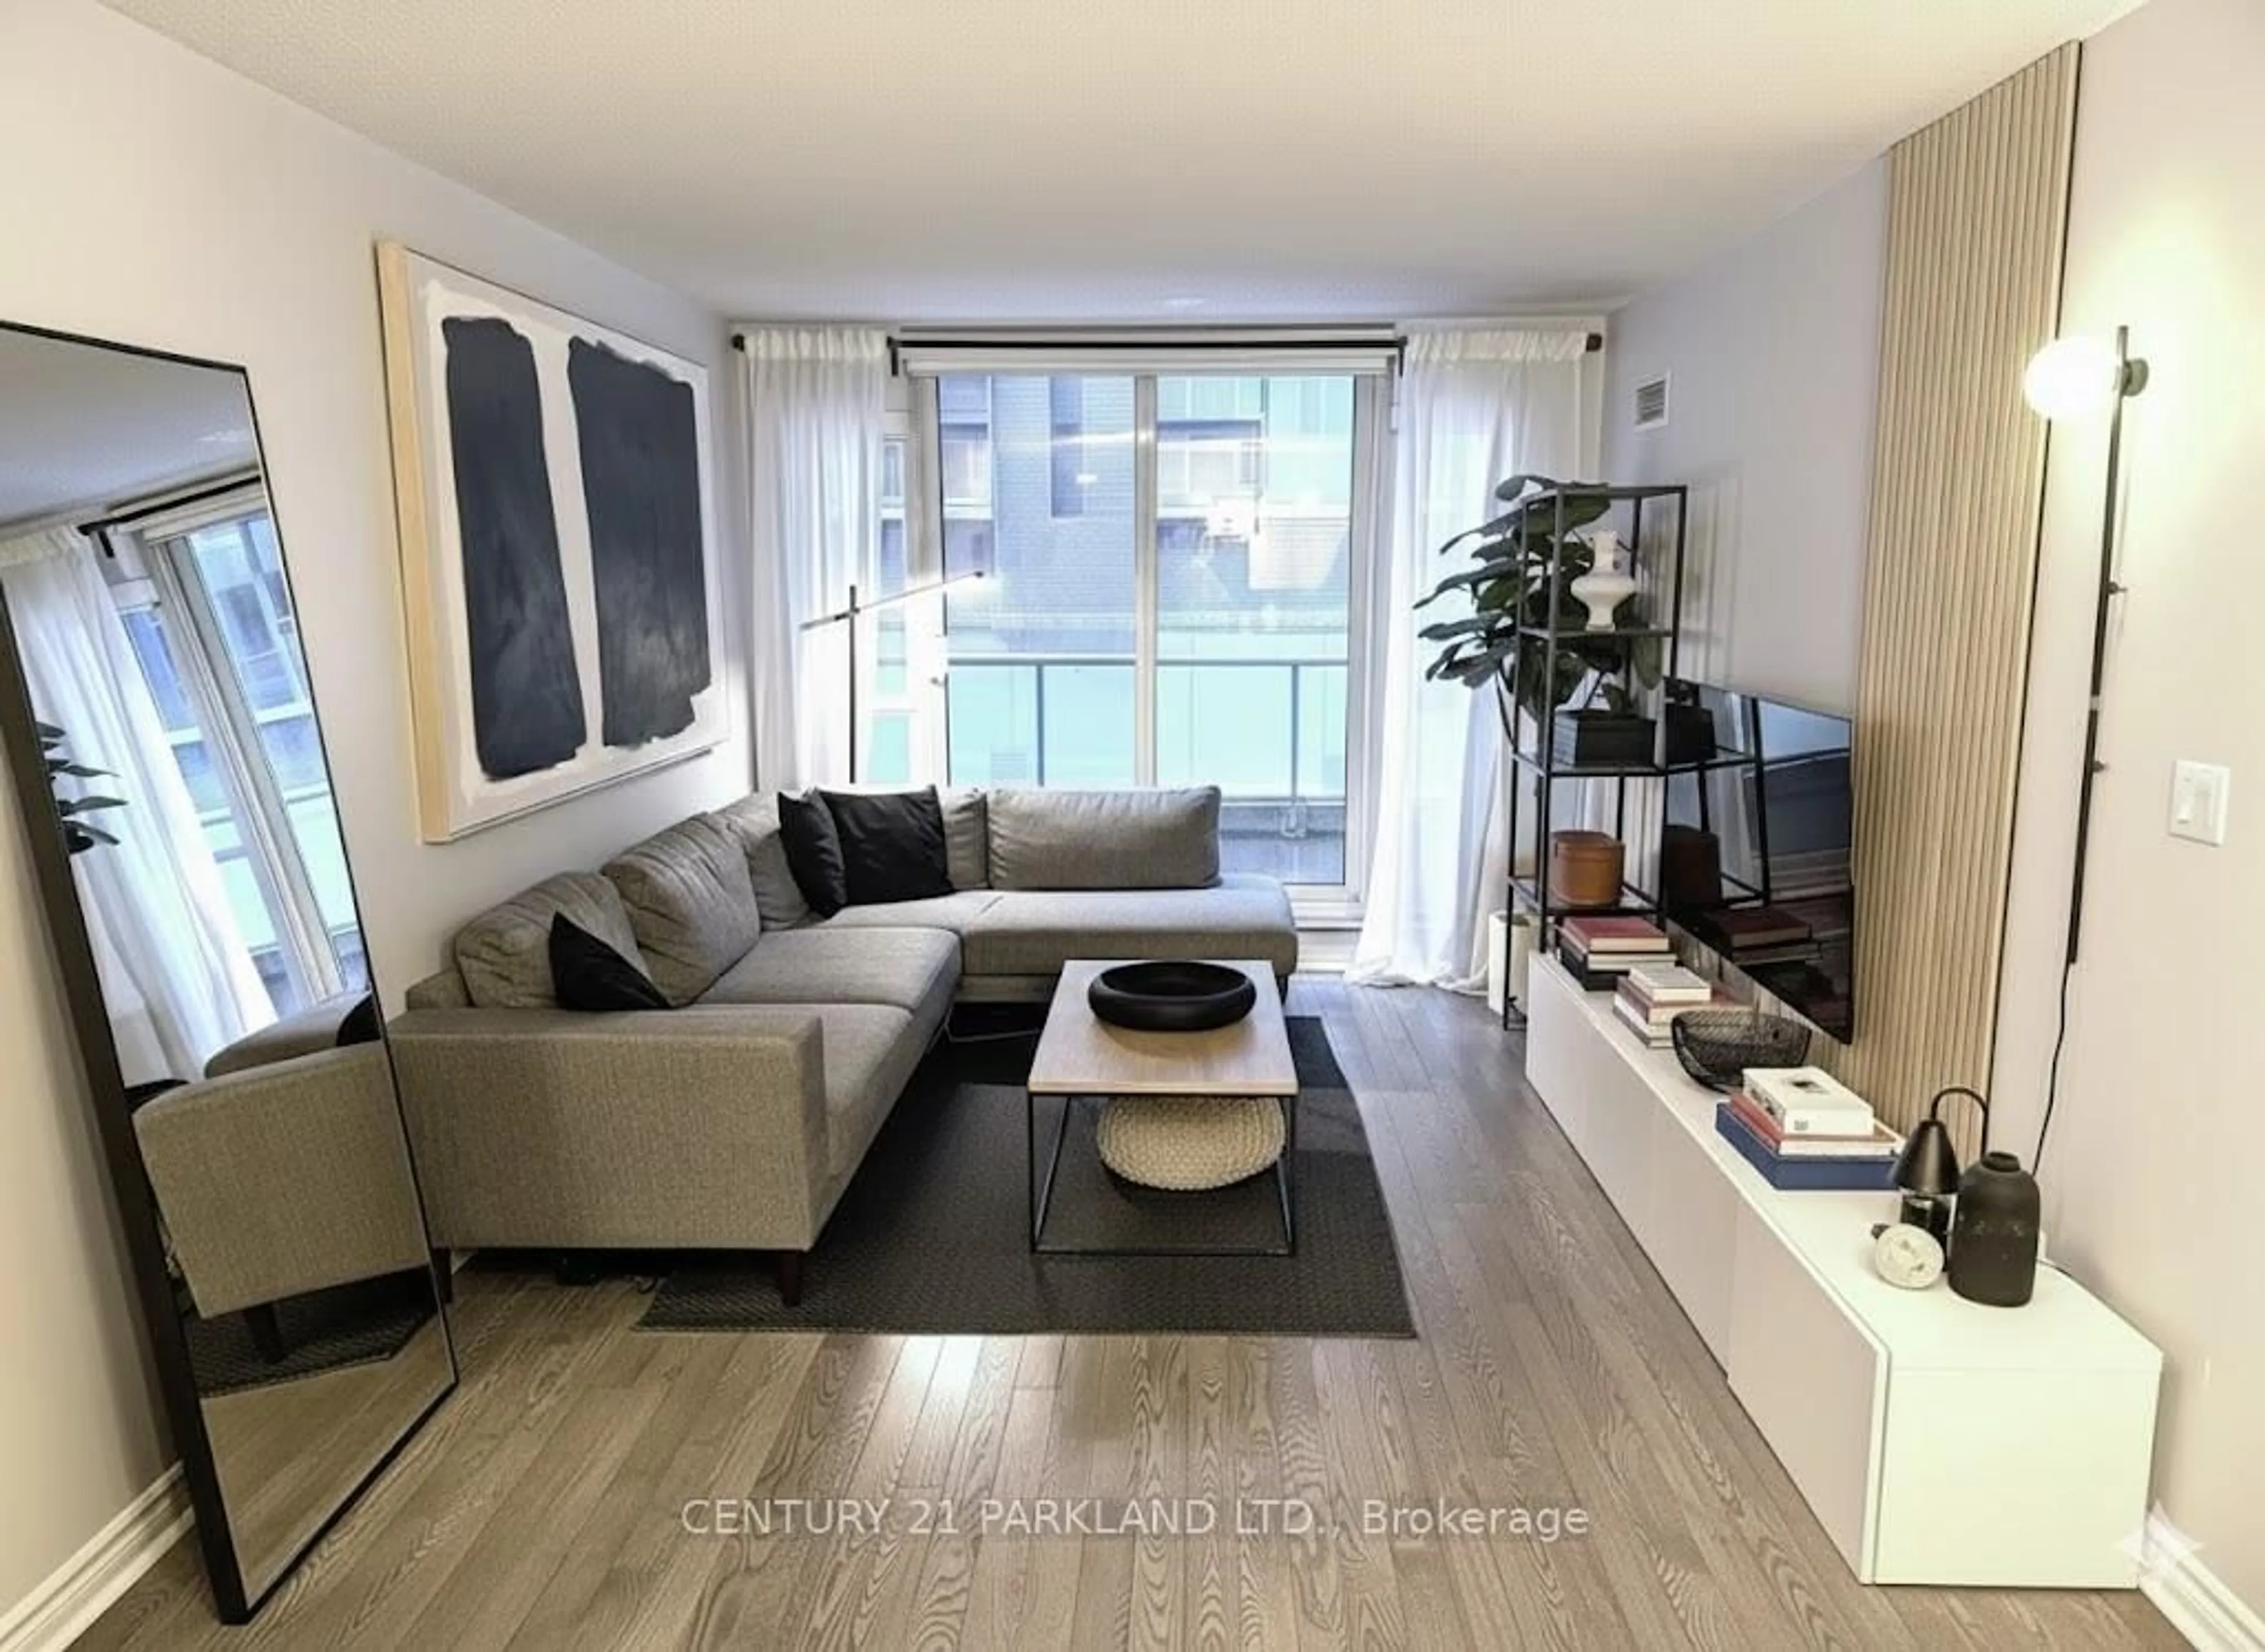
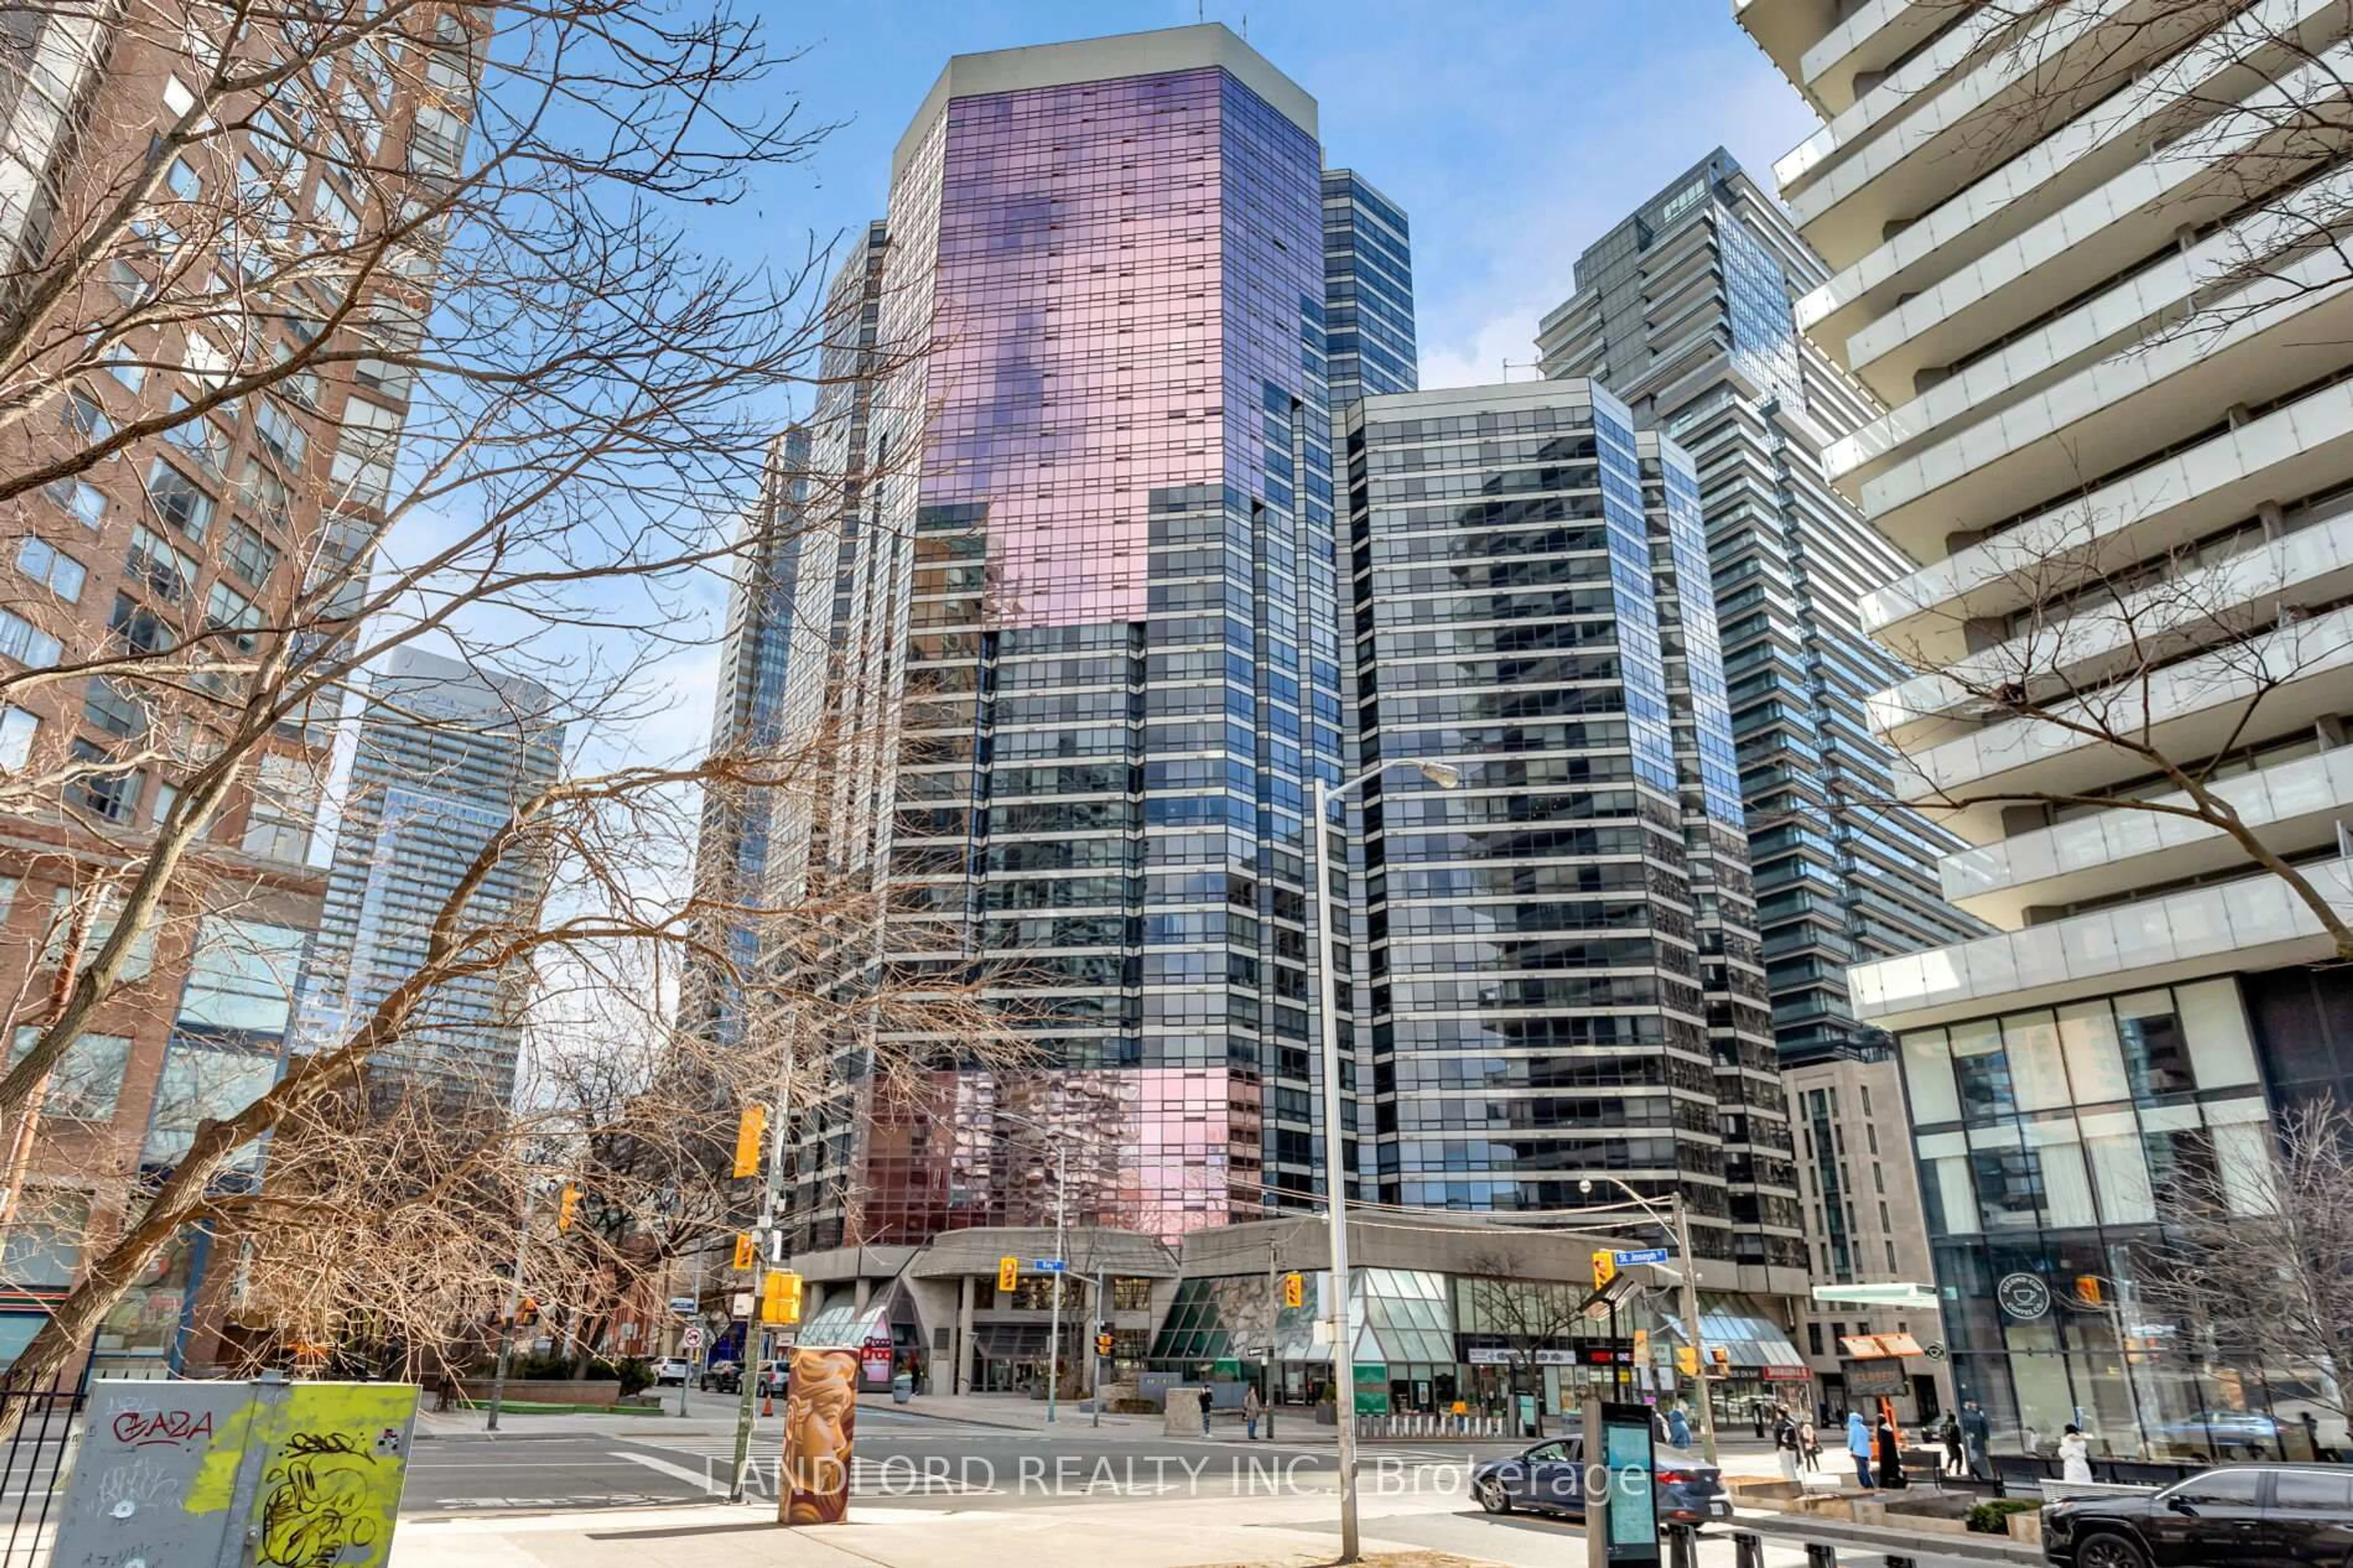
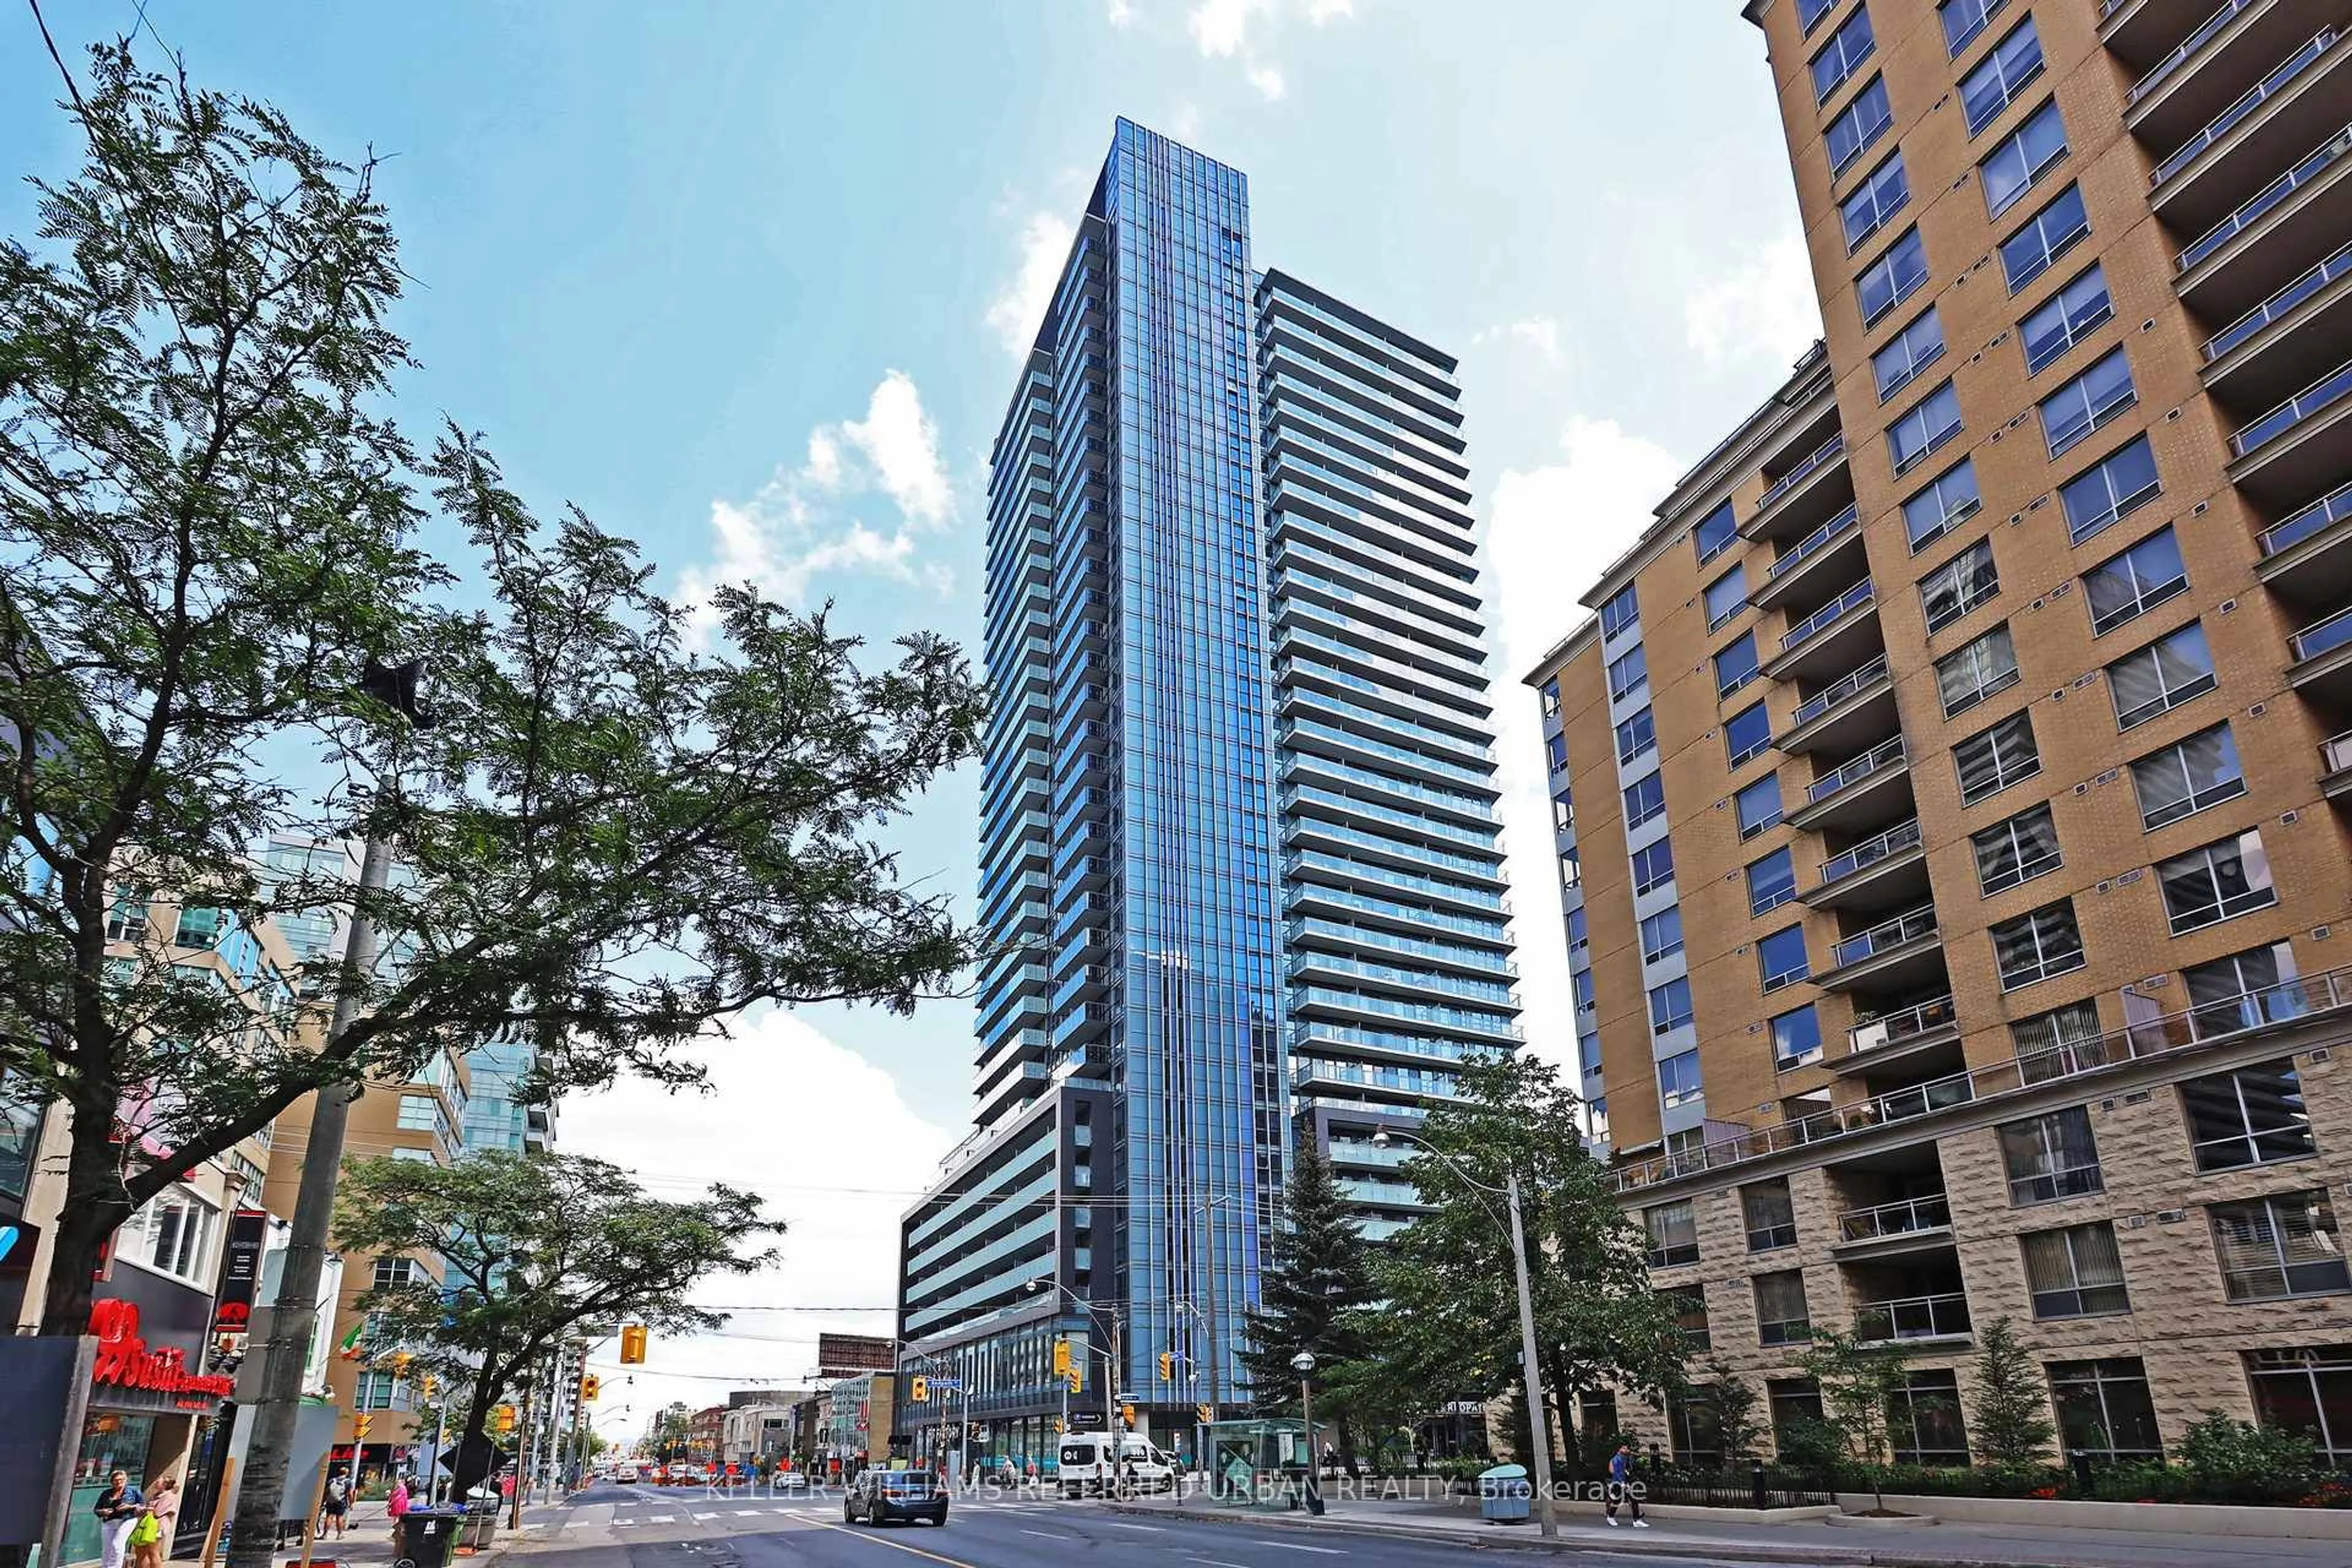
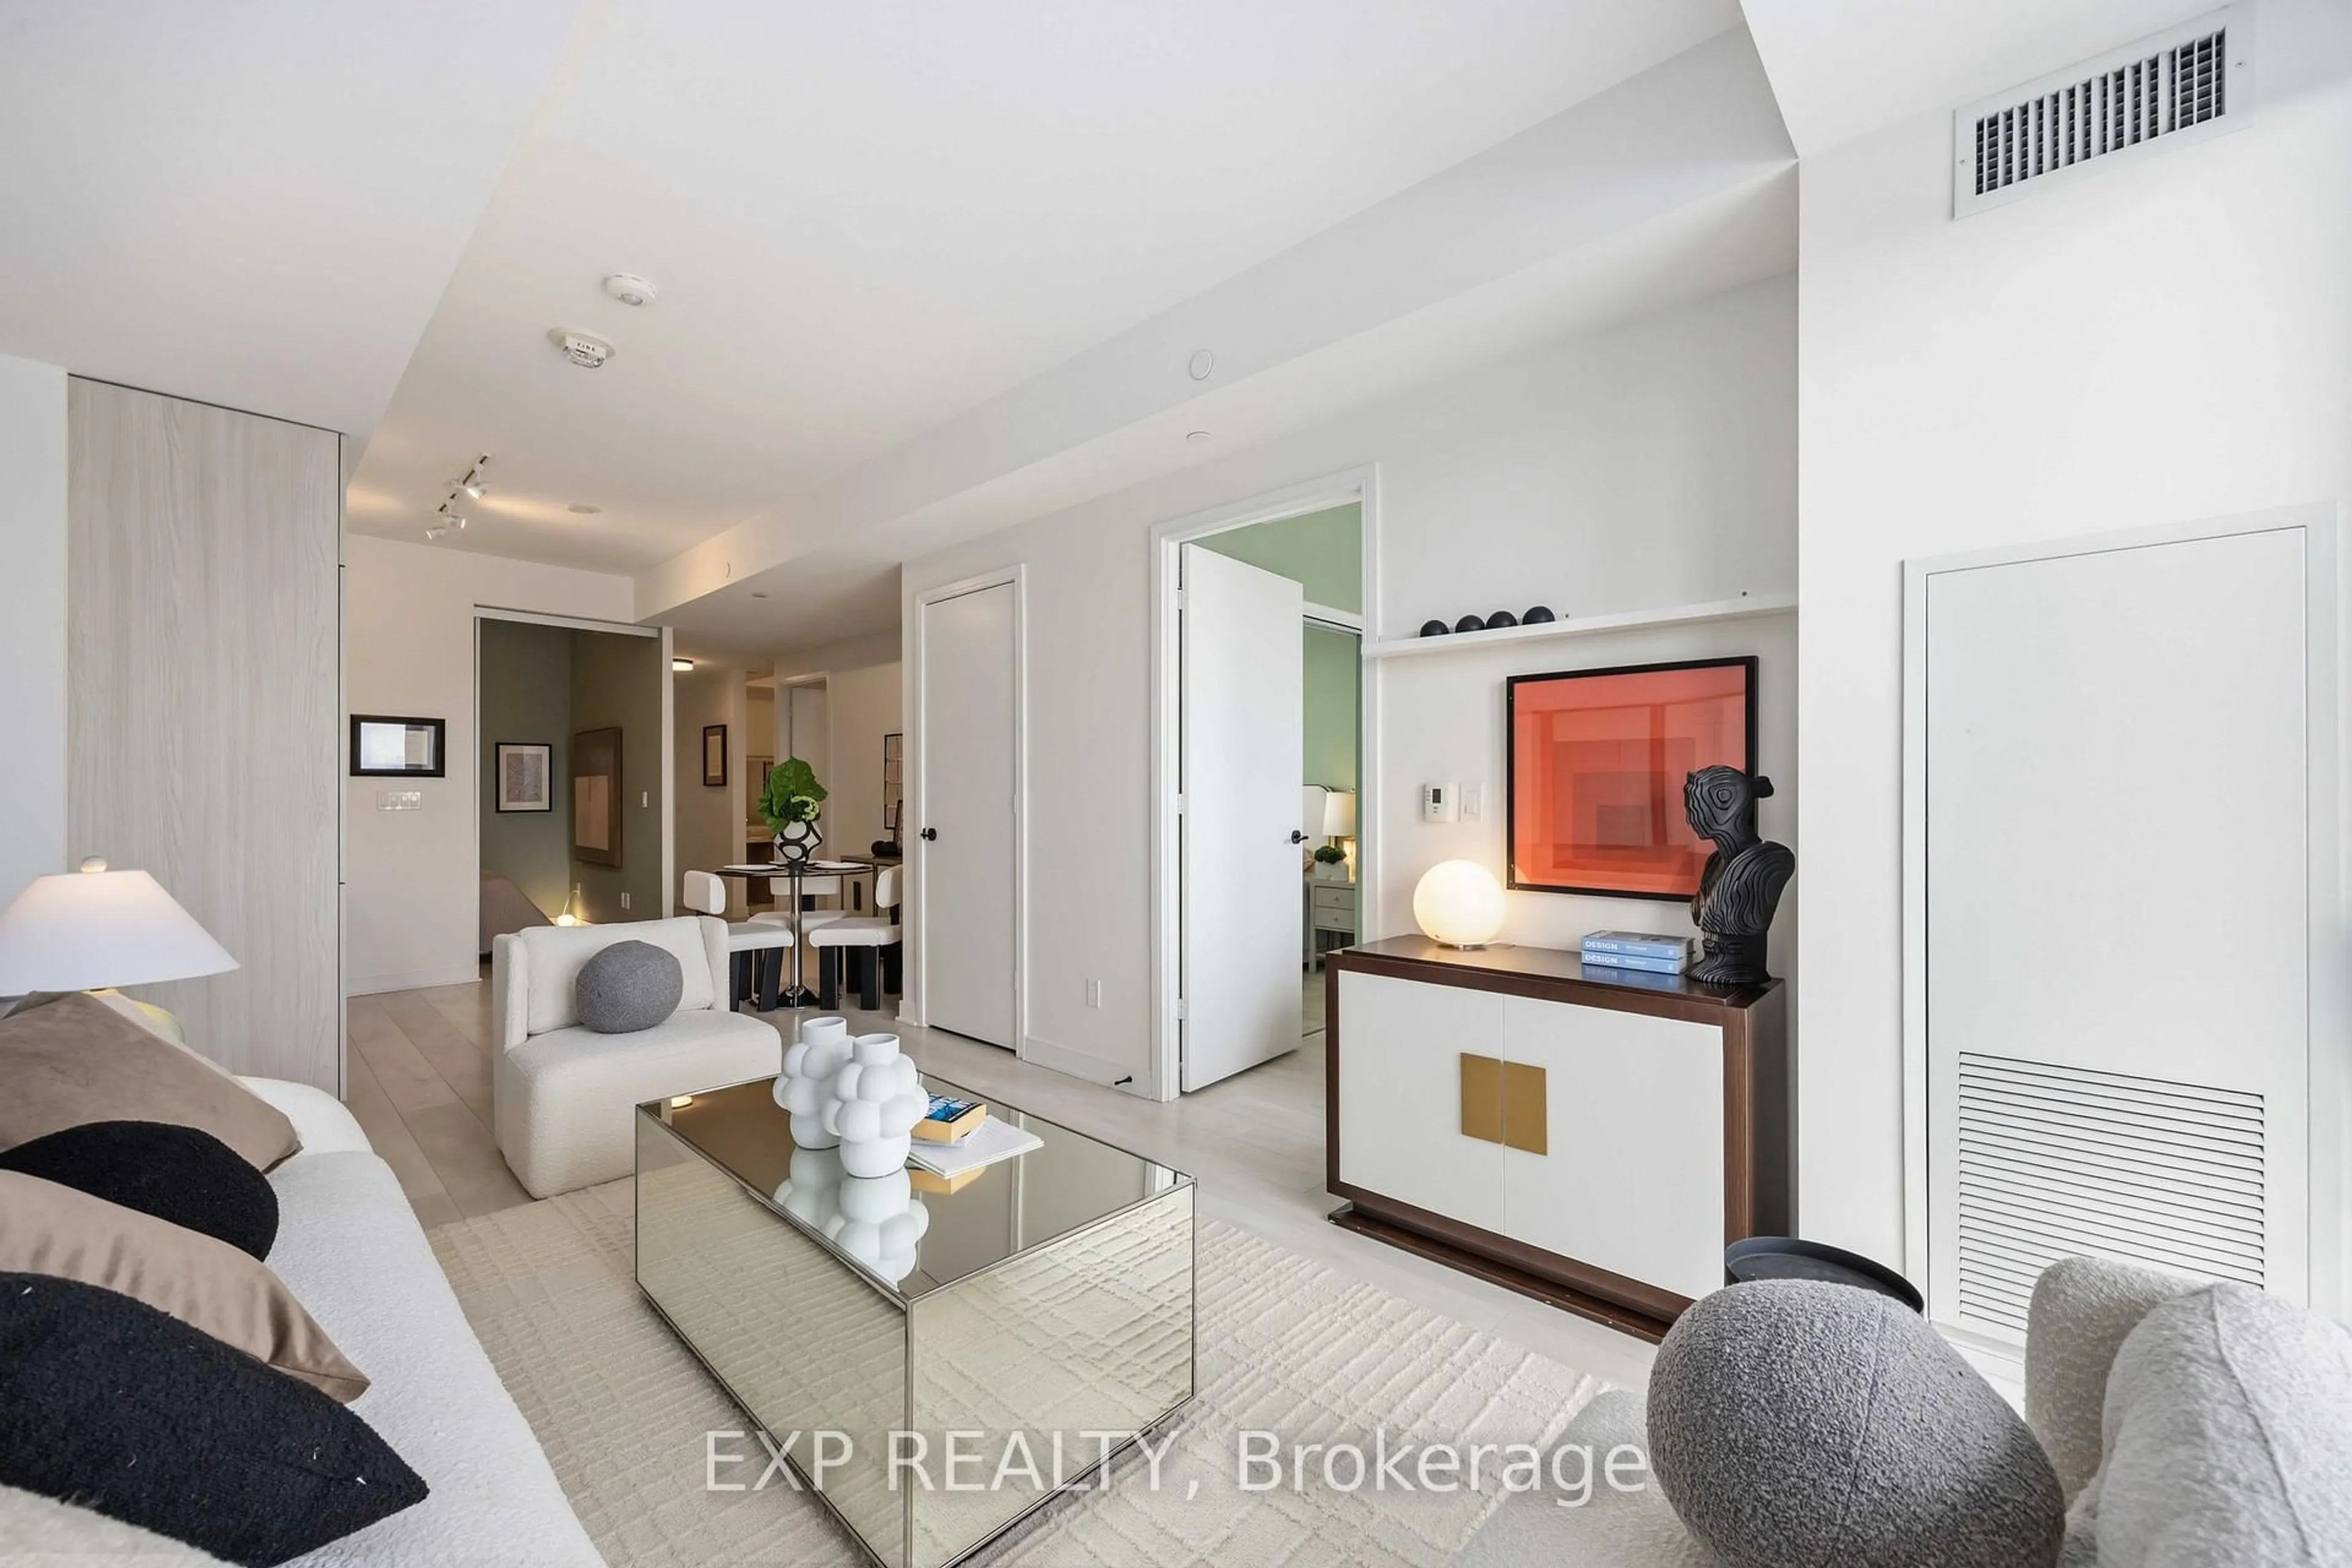
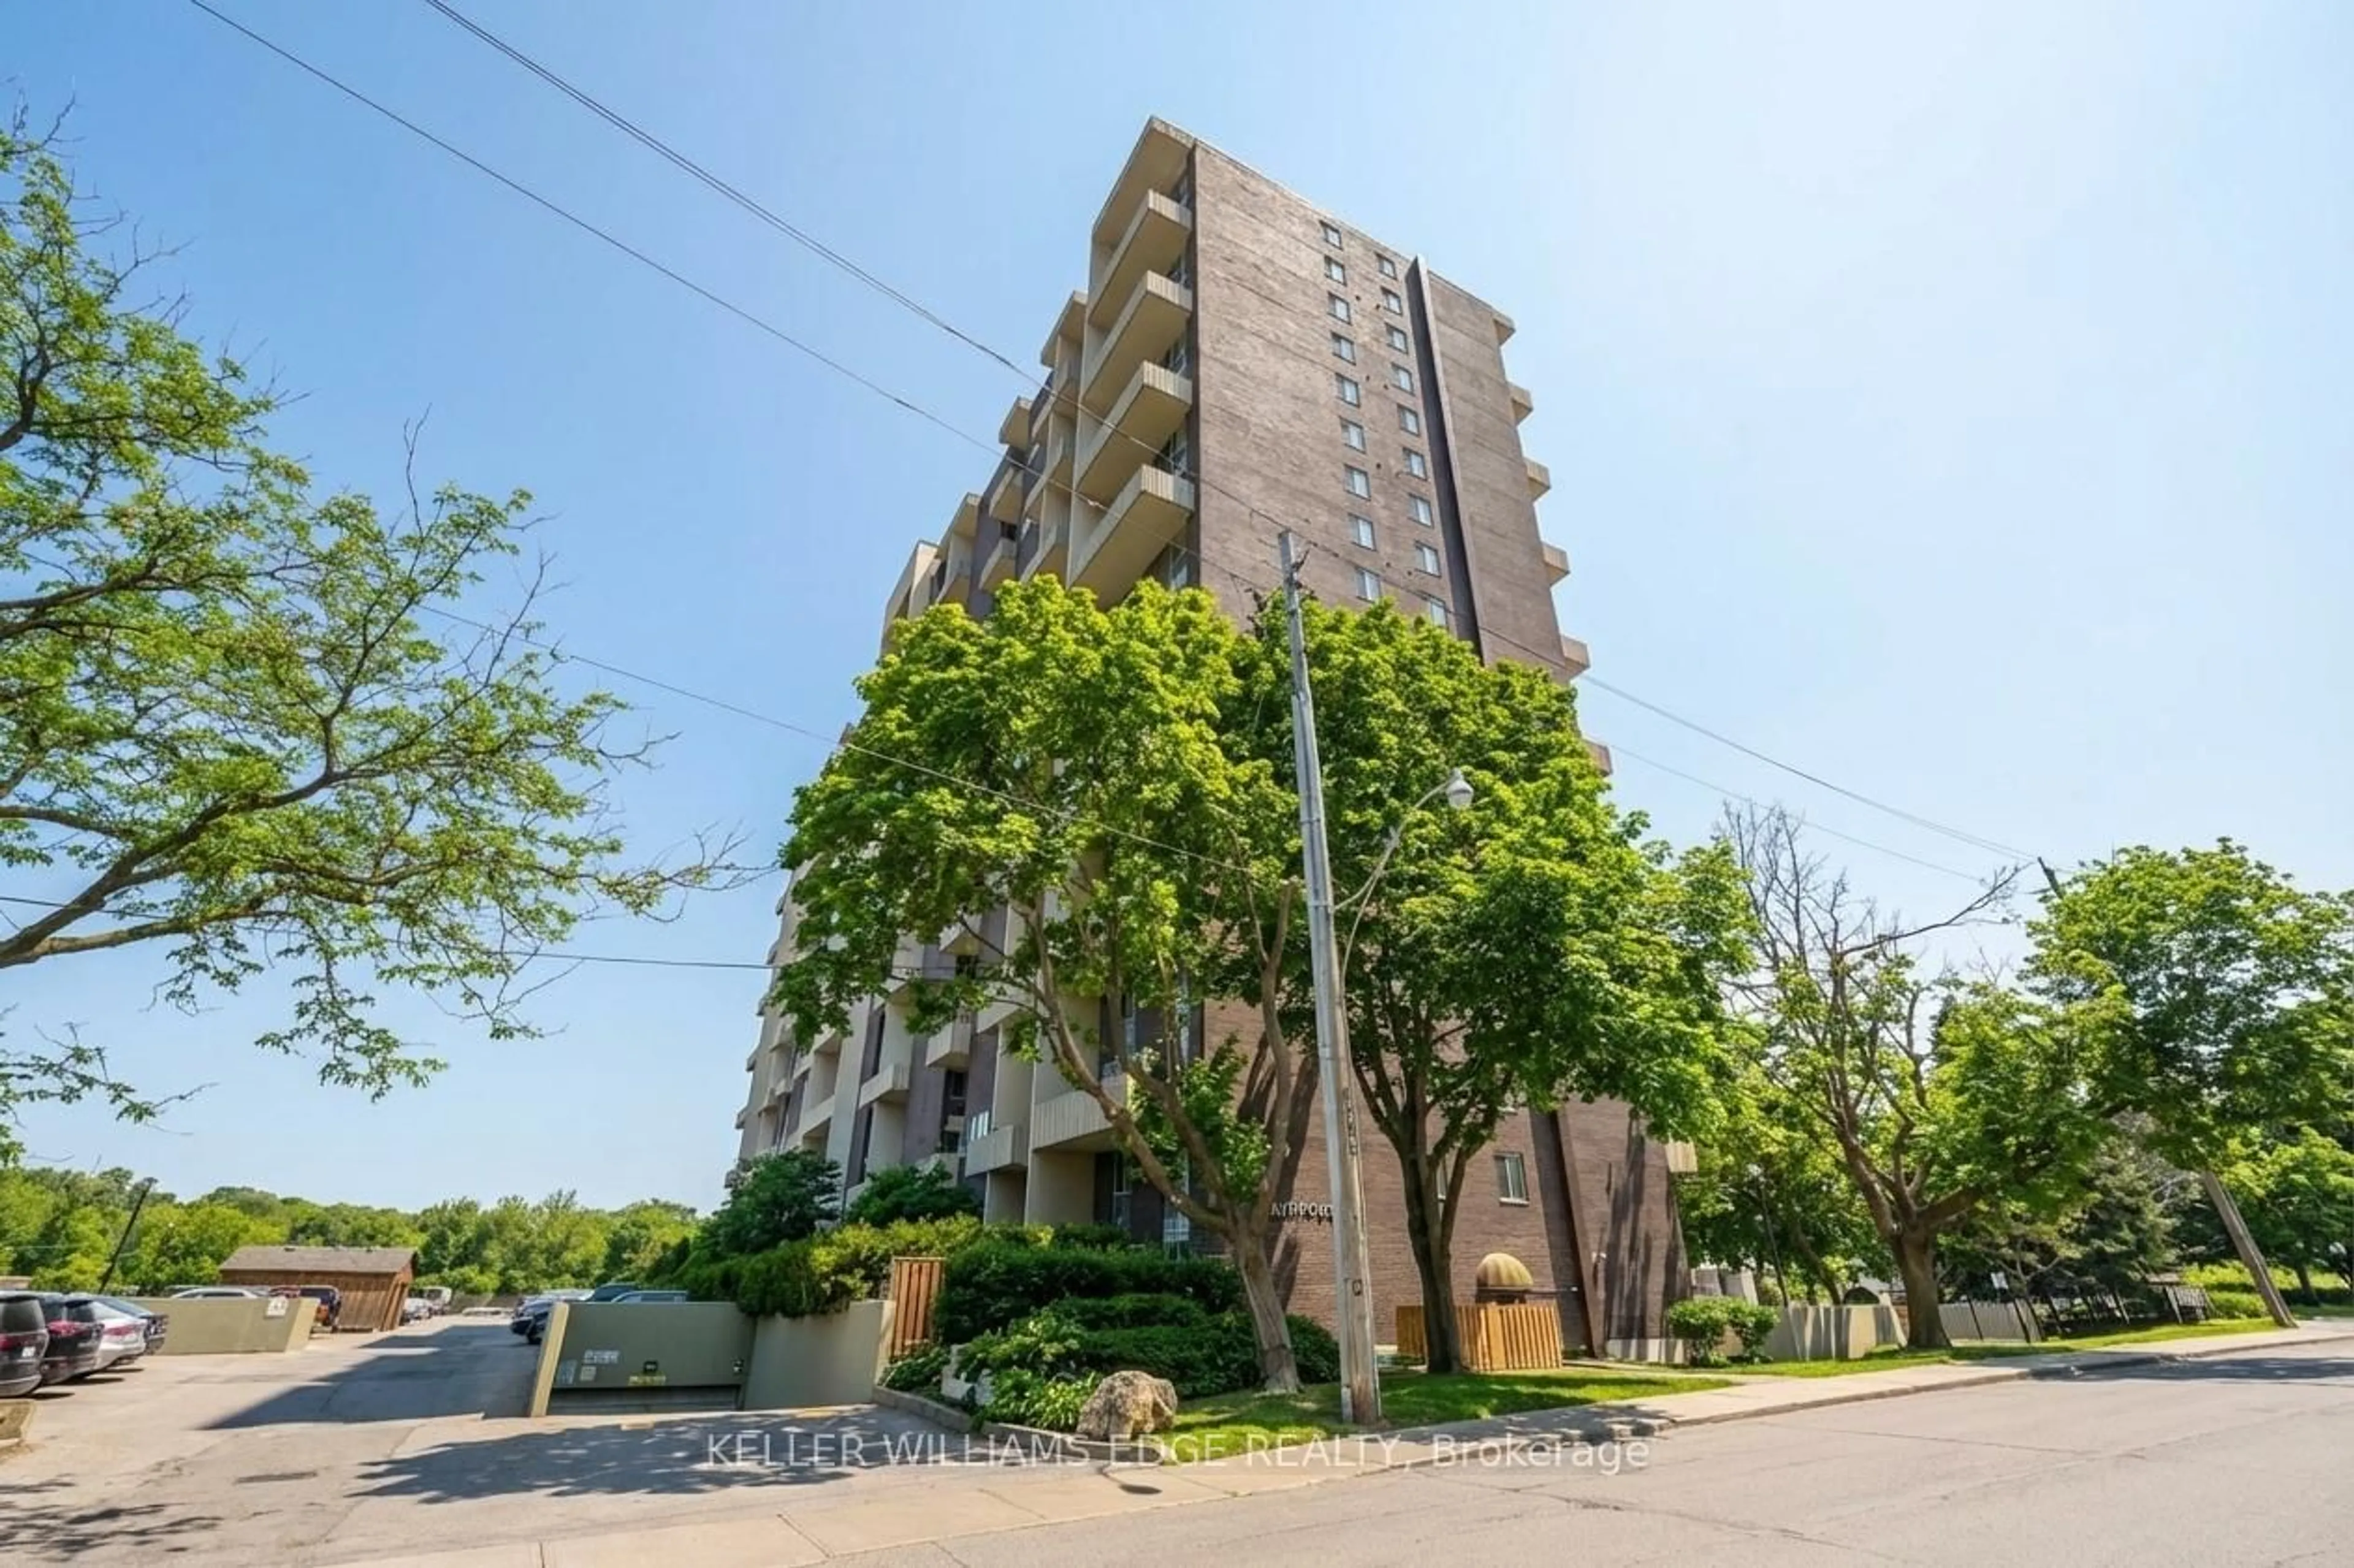
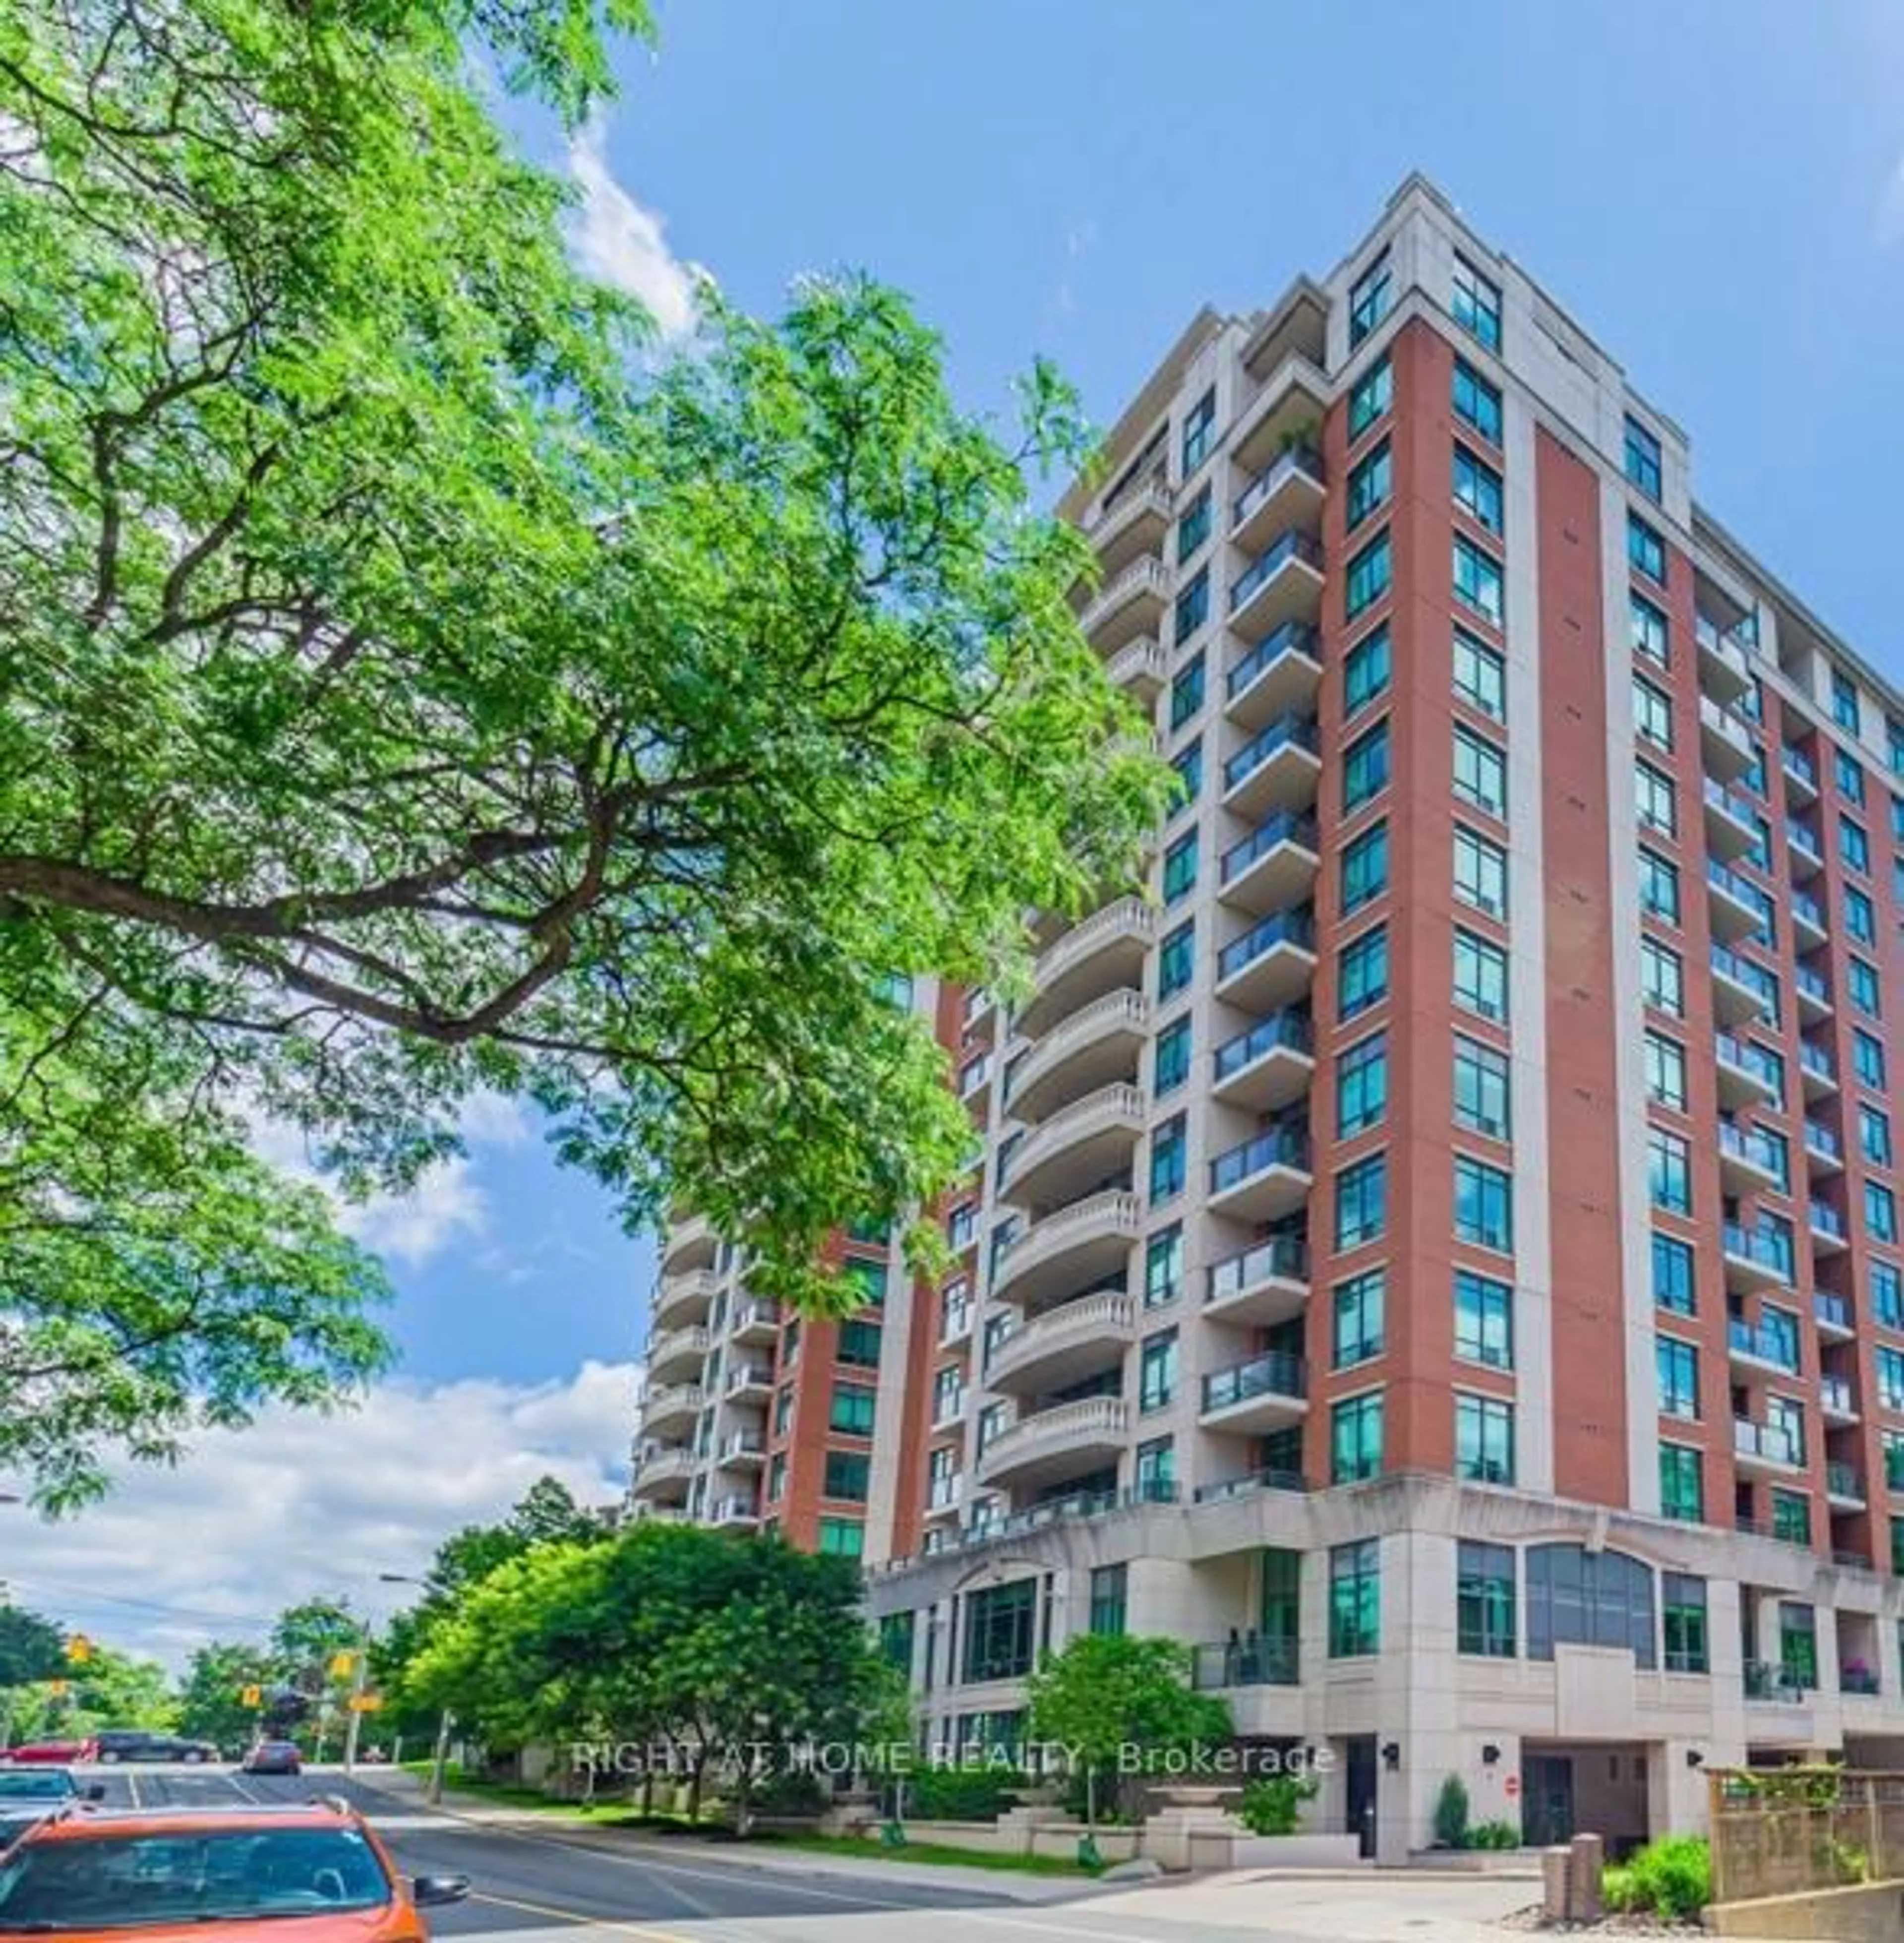
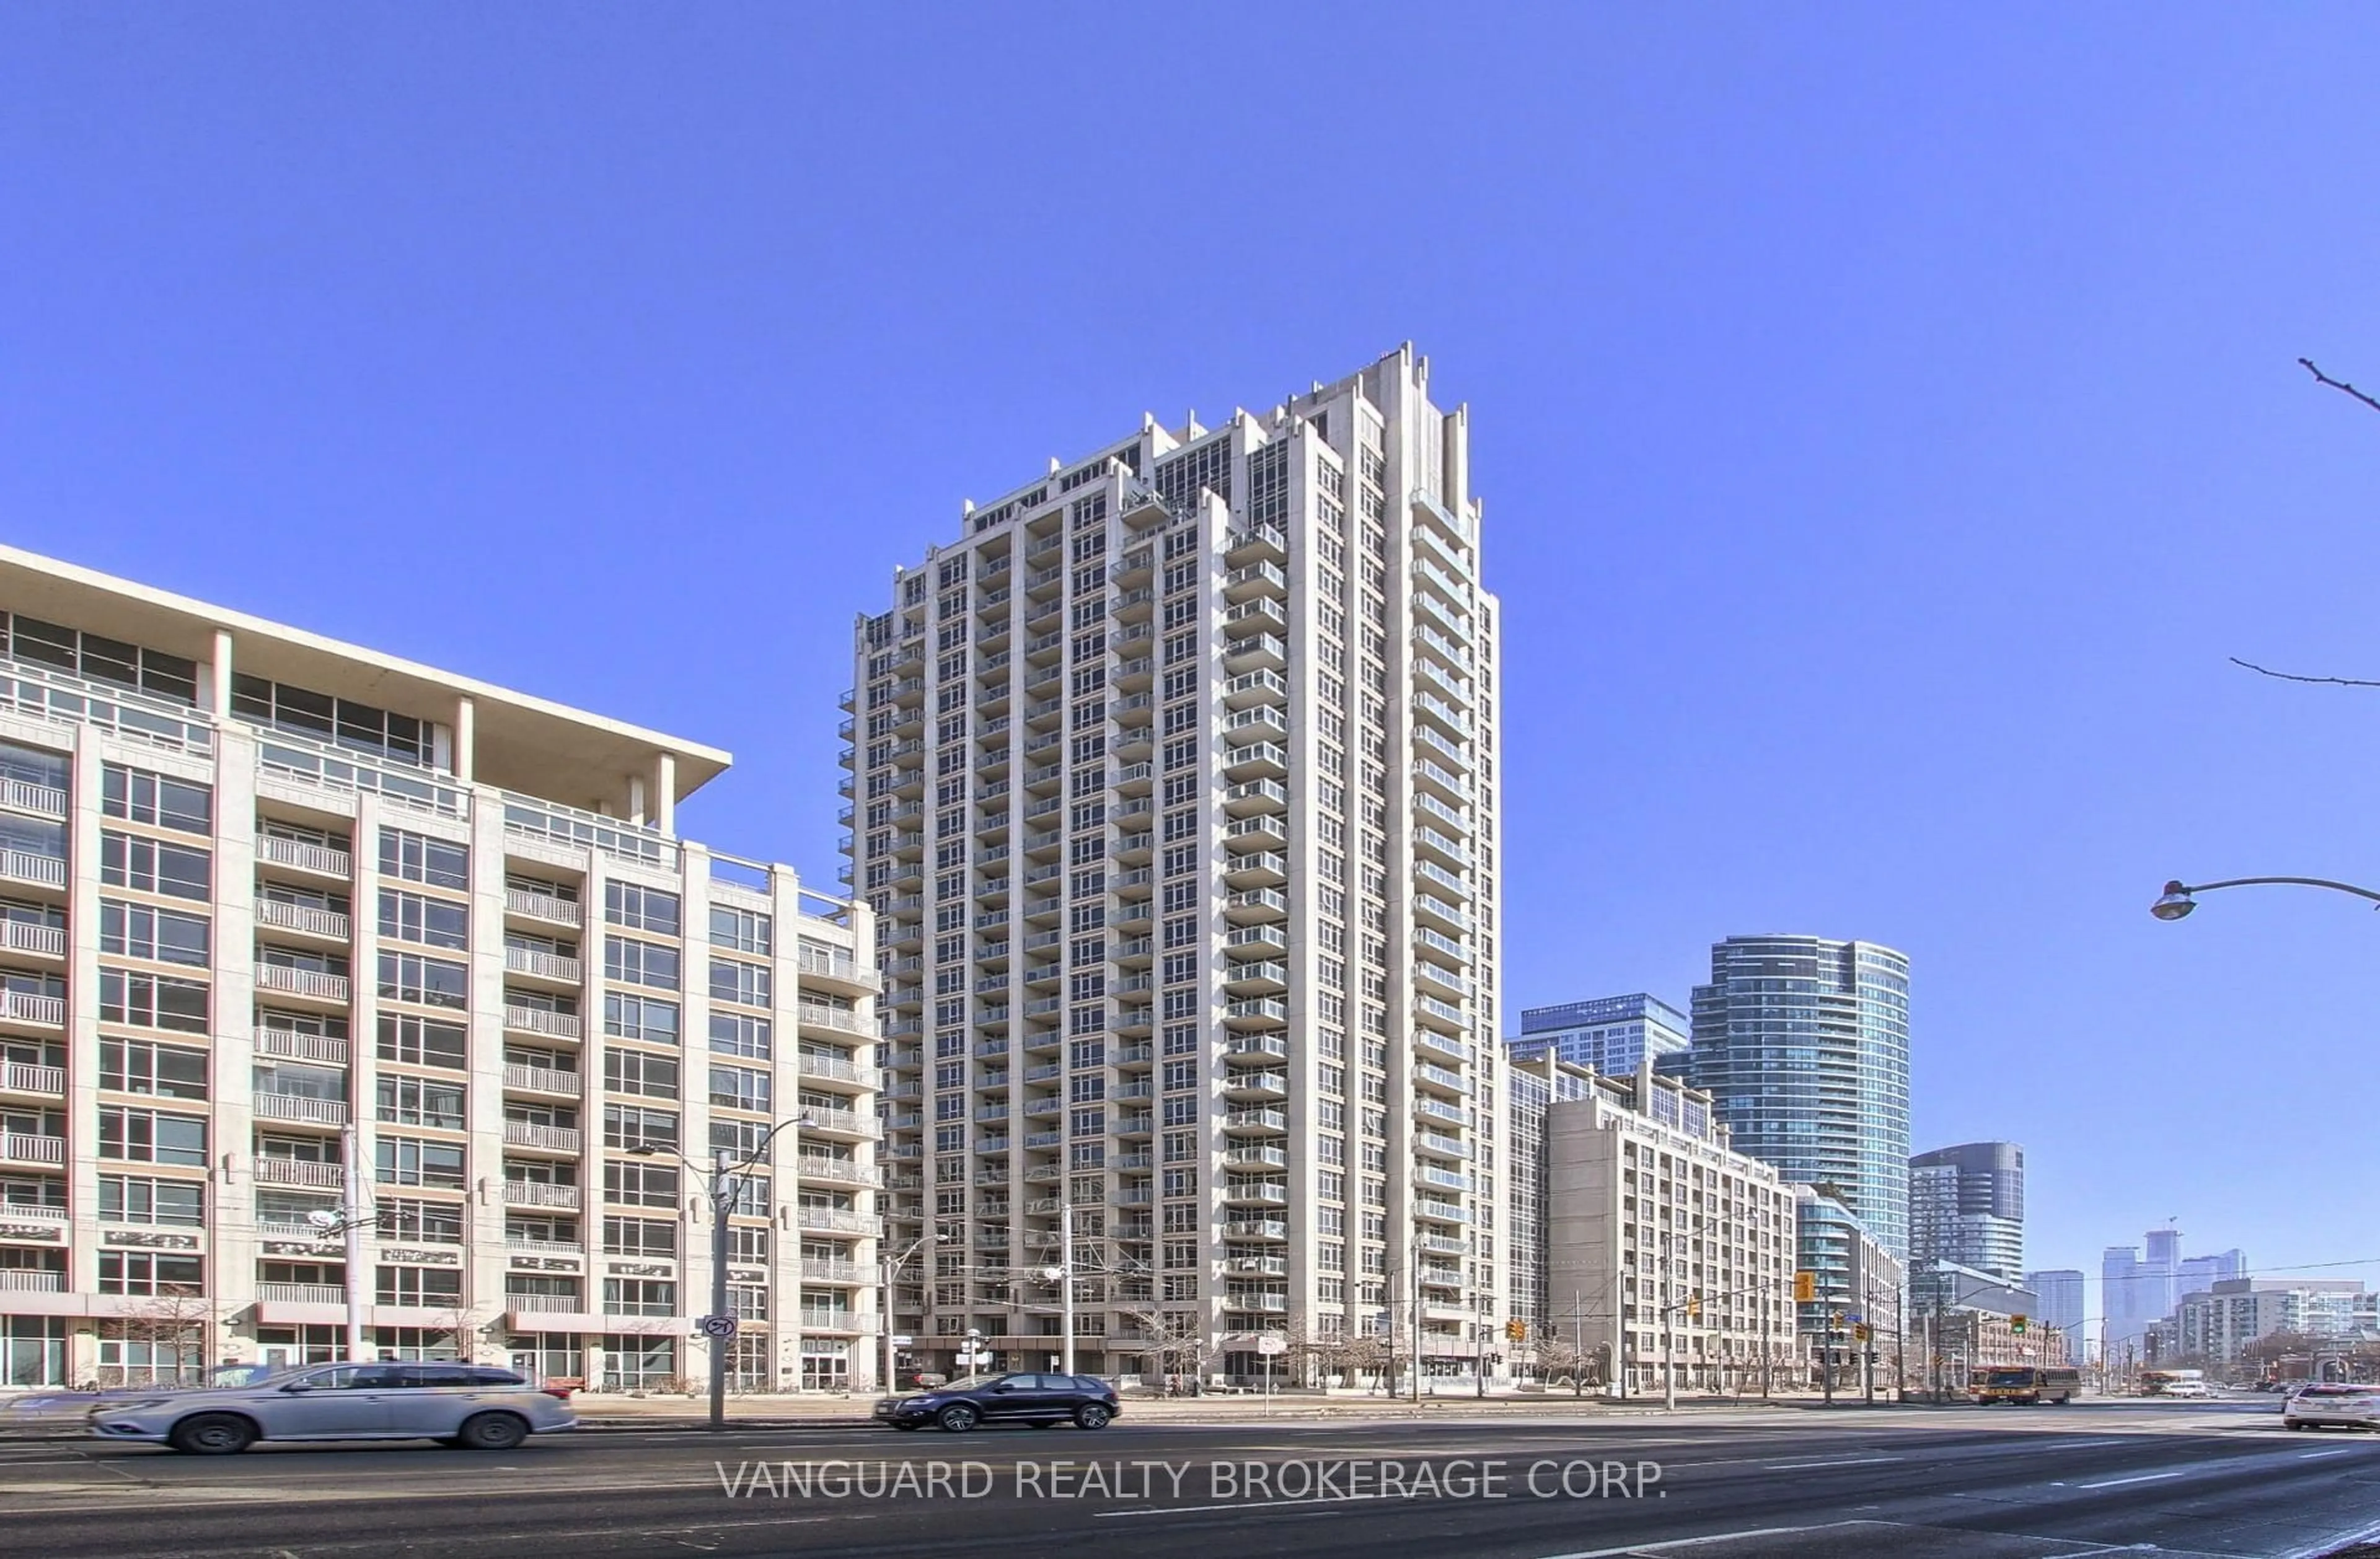
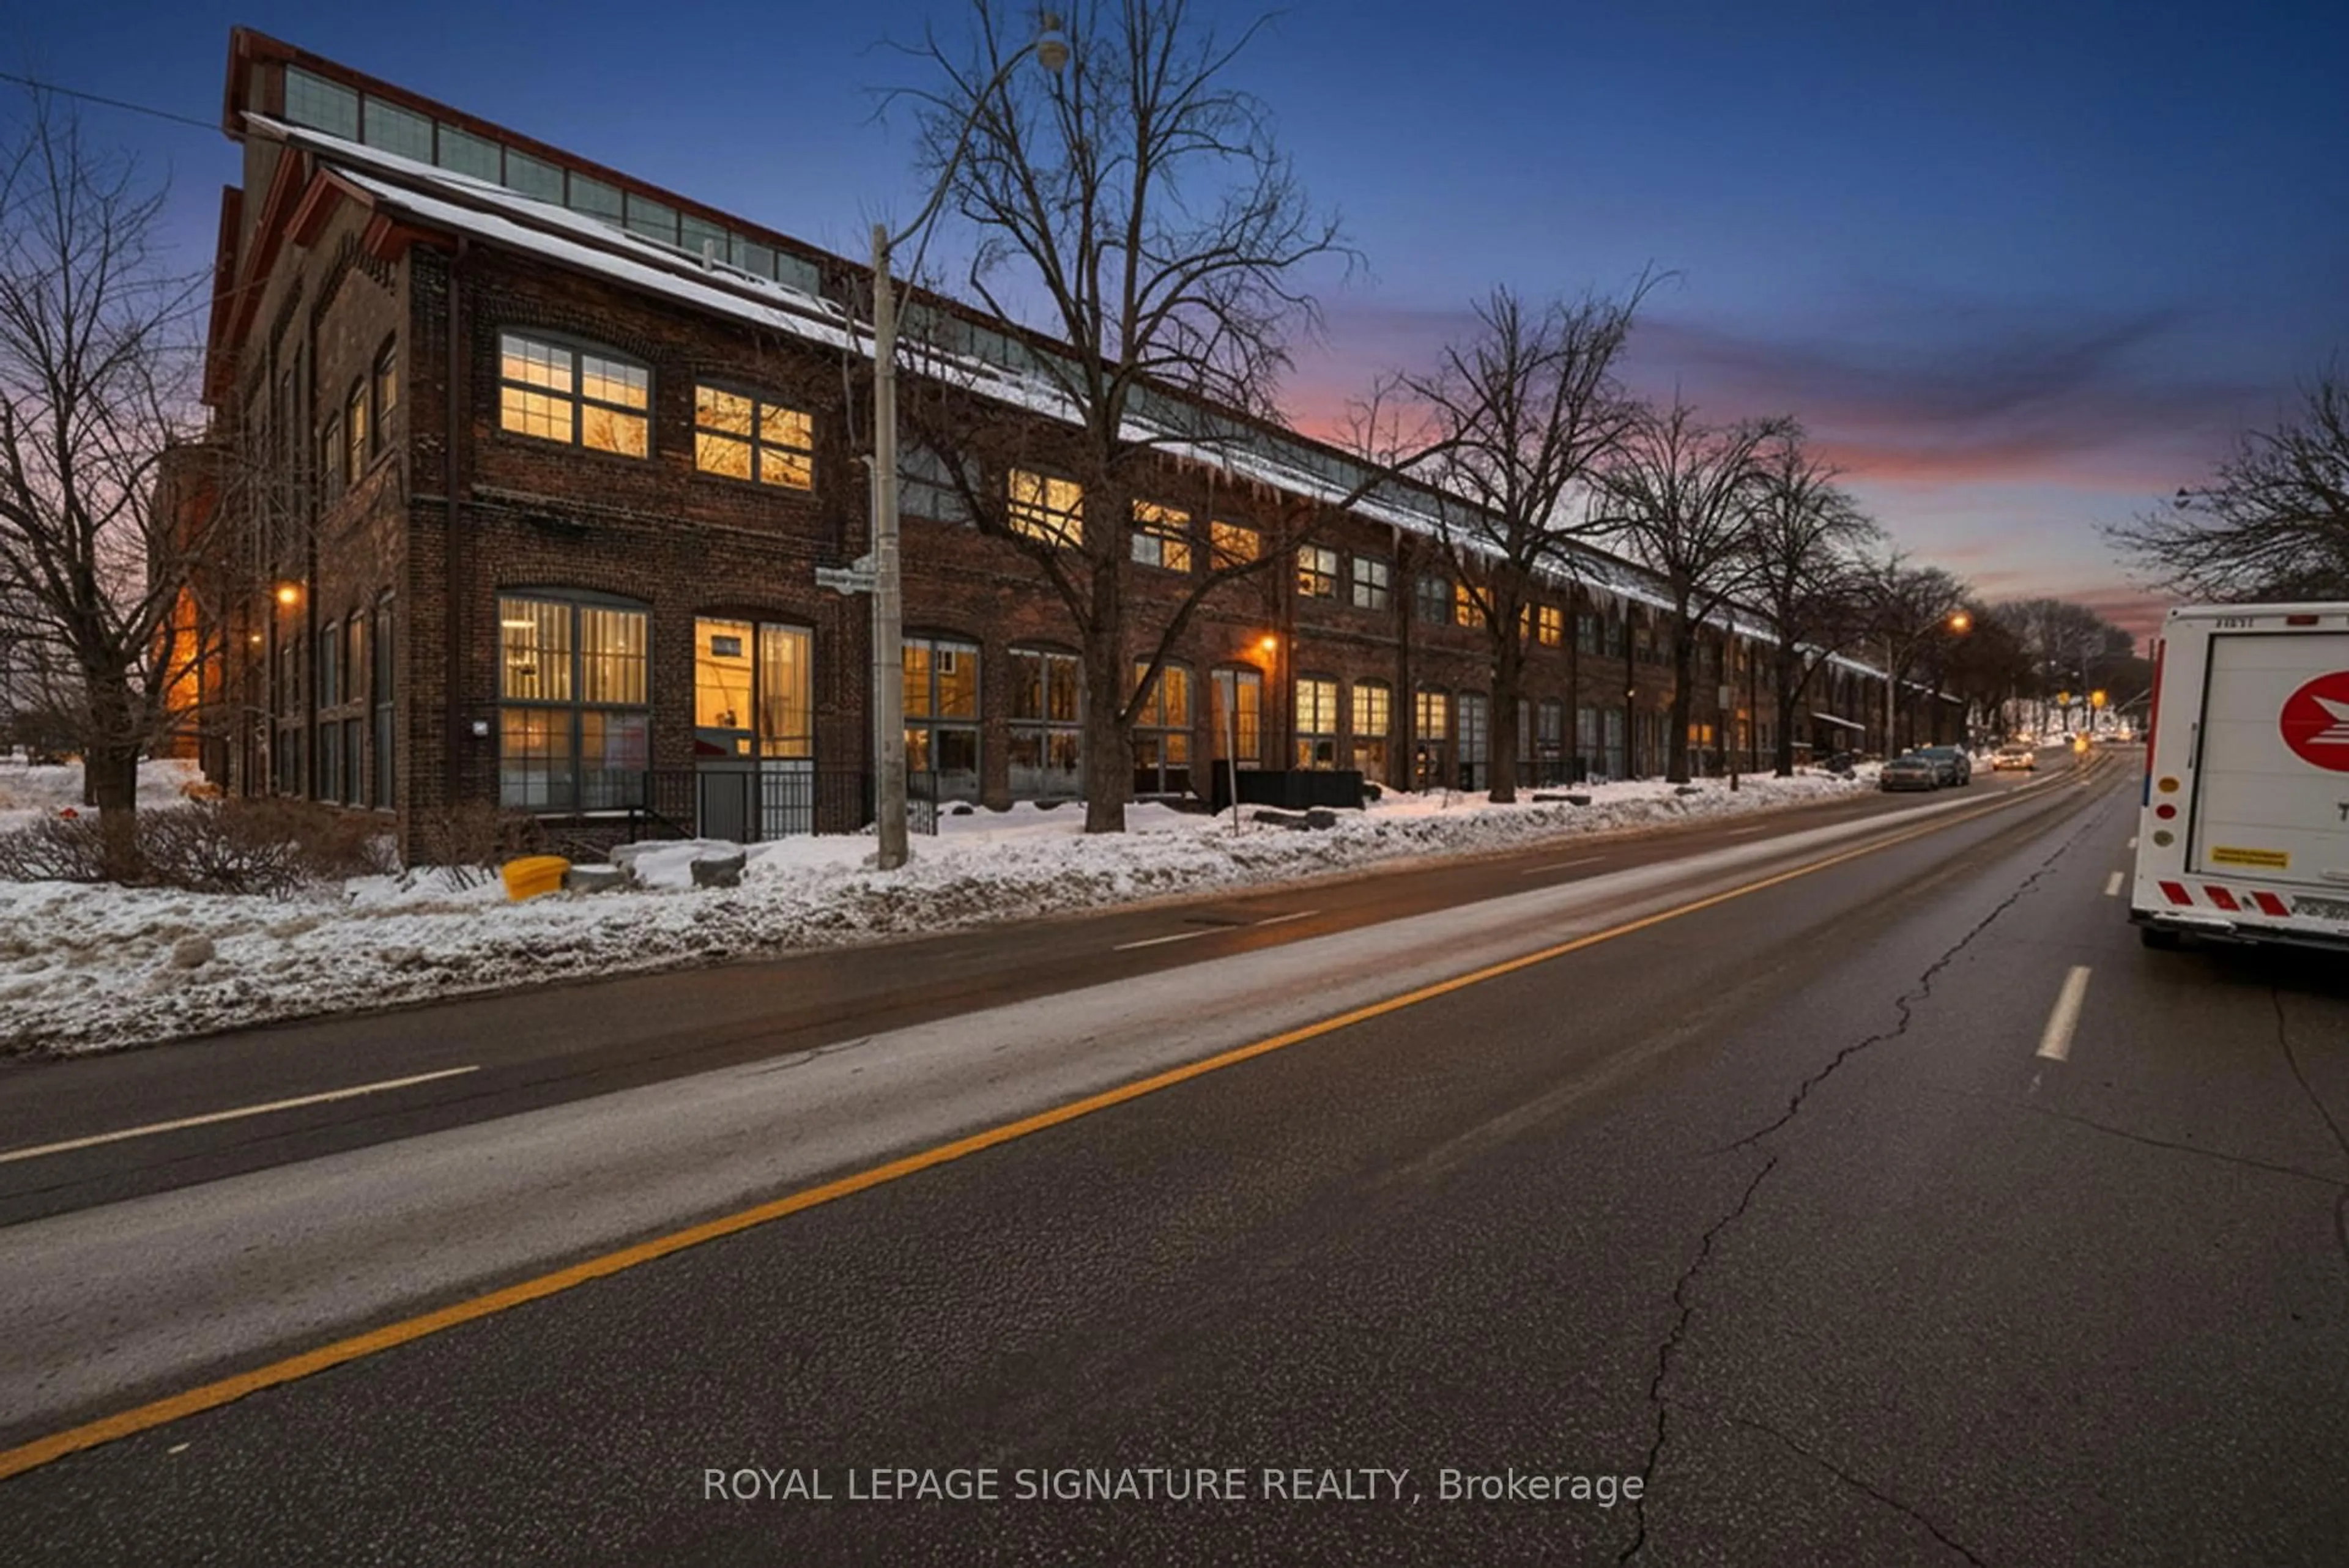
250 Wellington St #428, Toronto, Ontario M5V 2V4

In the same building:
-
Condo
1 + 1
1
~500-599 sqft
$499,900
Get pre-approvedPowered by Rocket Mortgage
Buy with Wahi to get
Up to
$4,999Cashback
Condo
1 + 1
1
~500-599 sqft

Contact us about this property

Call

Highlights

Estimated ValueNot available

Price/Sqft$917/sqft

Est. Mortgage$2,147/mo

Maintenance fees$611/mo

Tax Amount (2024)$2,275/yr

Days On Market5 days


Description

Beautifully renovated 1 bed + den suite featuring new flooring throughout and 588Sq.ft of very livable space in the heart of the entertainment district. Exceptionally well run Tridel built building ( The Icon) featuring a host of amenities. Located steps To The Path, Restaurants, Financial District, Rogers Centre, Cn Tower and the Well for the finest shopping and restaurants. Condo fees include all utilities.


Property Details

StyleApartment
View-
Age of property-
SqFt~500-599 SqFt
Lot Size-
Parking Spaces-
MLS ®NumberC11989685
Community NameEntertainment District
Data SourceTRREB
Listing byRE/MAX REALTY SPECIALISTS INC.

Features

Heating: Forced Air
Cooling: Central Air

Ground Floor

Den

2.51 x 2.39

Hardwood Floor / Open Concept

Living

5.49 x 2.90

Combined W/Dining / Laminate / W/O To Balcony

Dining

5.49 x 2.90

Combined W/Living / Laminate / Breakfast Bar

Kitchen

3.35 x 2.92

Centre Island / Stainless Steel Appl / B/I Microwave


Features

Patio: Open
Balcony: Open

4Story
Elevator
Amenities

Concierge, Gym, Indoor Pool, Party/Meeting Room, Rooftop Deck/Garden, Sauna

Inclusions
Hydro
Water
Parking
Cable
Heat

Property History

Feb 26, 2025
ListedActive
$499,900
5 days on market
history photo preview23
Listing by trreb®
Property listed by RE/MAX REALTY SPECIALISTS INC., Brokerage

Get up to 1% cashback when you buy your dream home with Wahi Cashback

Cashback Banner Image

A new way to buy a home that puts cash back in your pocket.

  • Our in-house Realtors do more deals and bring that negotiating power into your corner
  • We leverage technology to get you more insights, move faster and simplify the process
  • Our digital business model means we pass the savings onto you, with up to 1% cashback on the purchase of your home

Market Data - Entertainment District

Geo Zone Map ThumbnailEntertainment District

Strong Buyer's Market

Condo - for the past 30 days

Buyer's market Seller's market

Avg. Days on Market

Past 30 days

31 days

Compared to

2024

32 days

2023

29 days

2022

11 days

New Listings

Past 30 days

490 listings

Compared to

2024

377 listings

2023

220 listings

2022

108 listings

Units sold

Past 30 days

40 units

Compared to

2024

65 units

2023

78 units

2022

157 units

Median Sold Price

Past 30 days

$700,000

Compared to

2024

$722,000

2023

$688,750

2022

$799,999


Population and Demographics

Overview

Total population 32132
Average household income $172,021

Age (%)

20 to 34
57%
35 to 49
22%
50 to 64
9%
0 to 19
7%
65 and plus
5%

Household composition (%)

Single person
57%
Single family
32%
Multi person
11%
Multi family
0%

Mother tongue (%)

English
63%
Mandarin
10%
Yue (Cantonese)
4%
Spanish
3%
French
3%
Russian
2%
Arabic
2%
Hindi
2%
Korean
1%
Iranian Persian
1%
Others
1%

House tenancy (%)

Renters
61%
Owners
39%

Schools and amenities

Estimated Budget