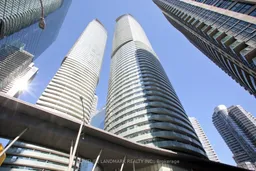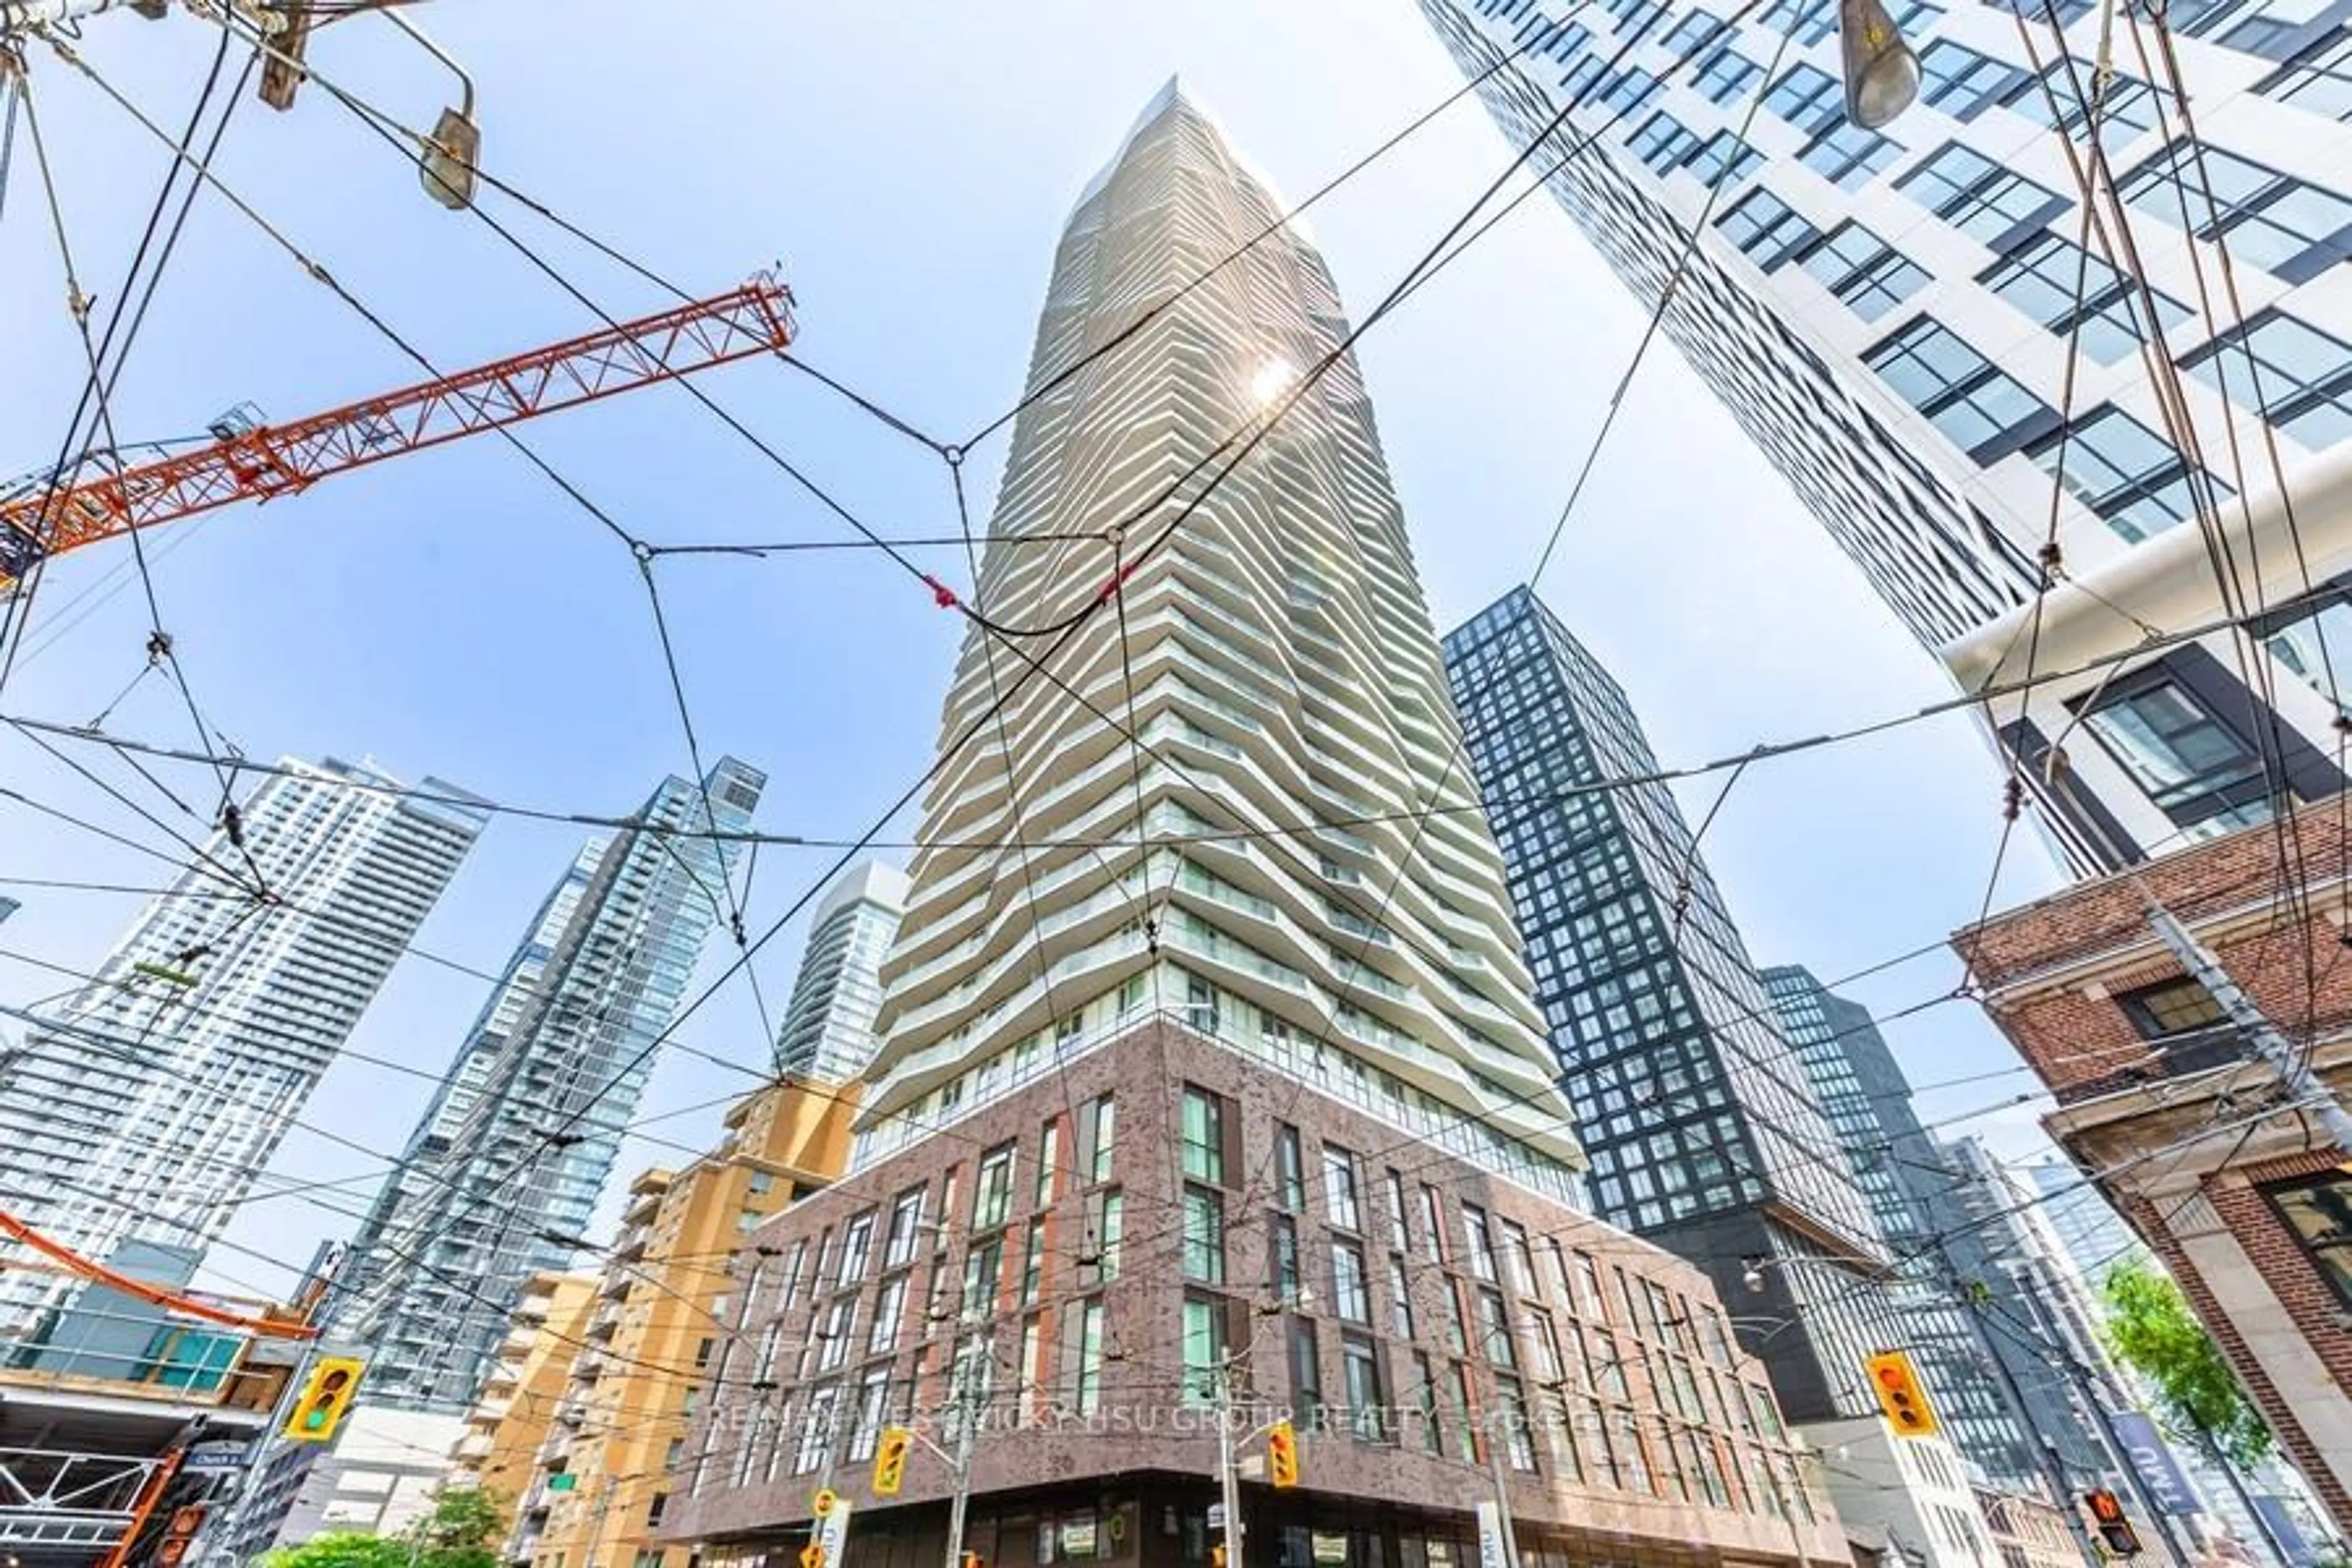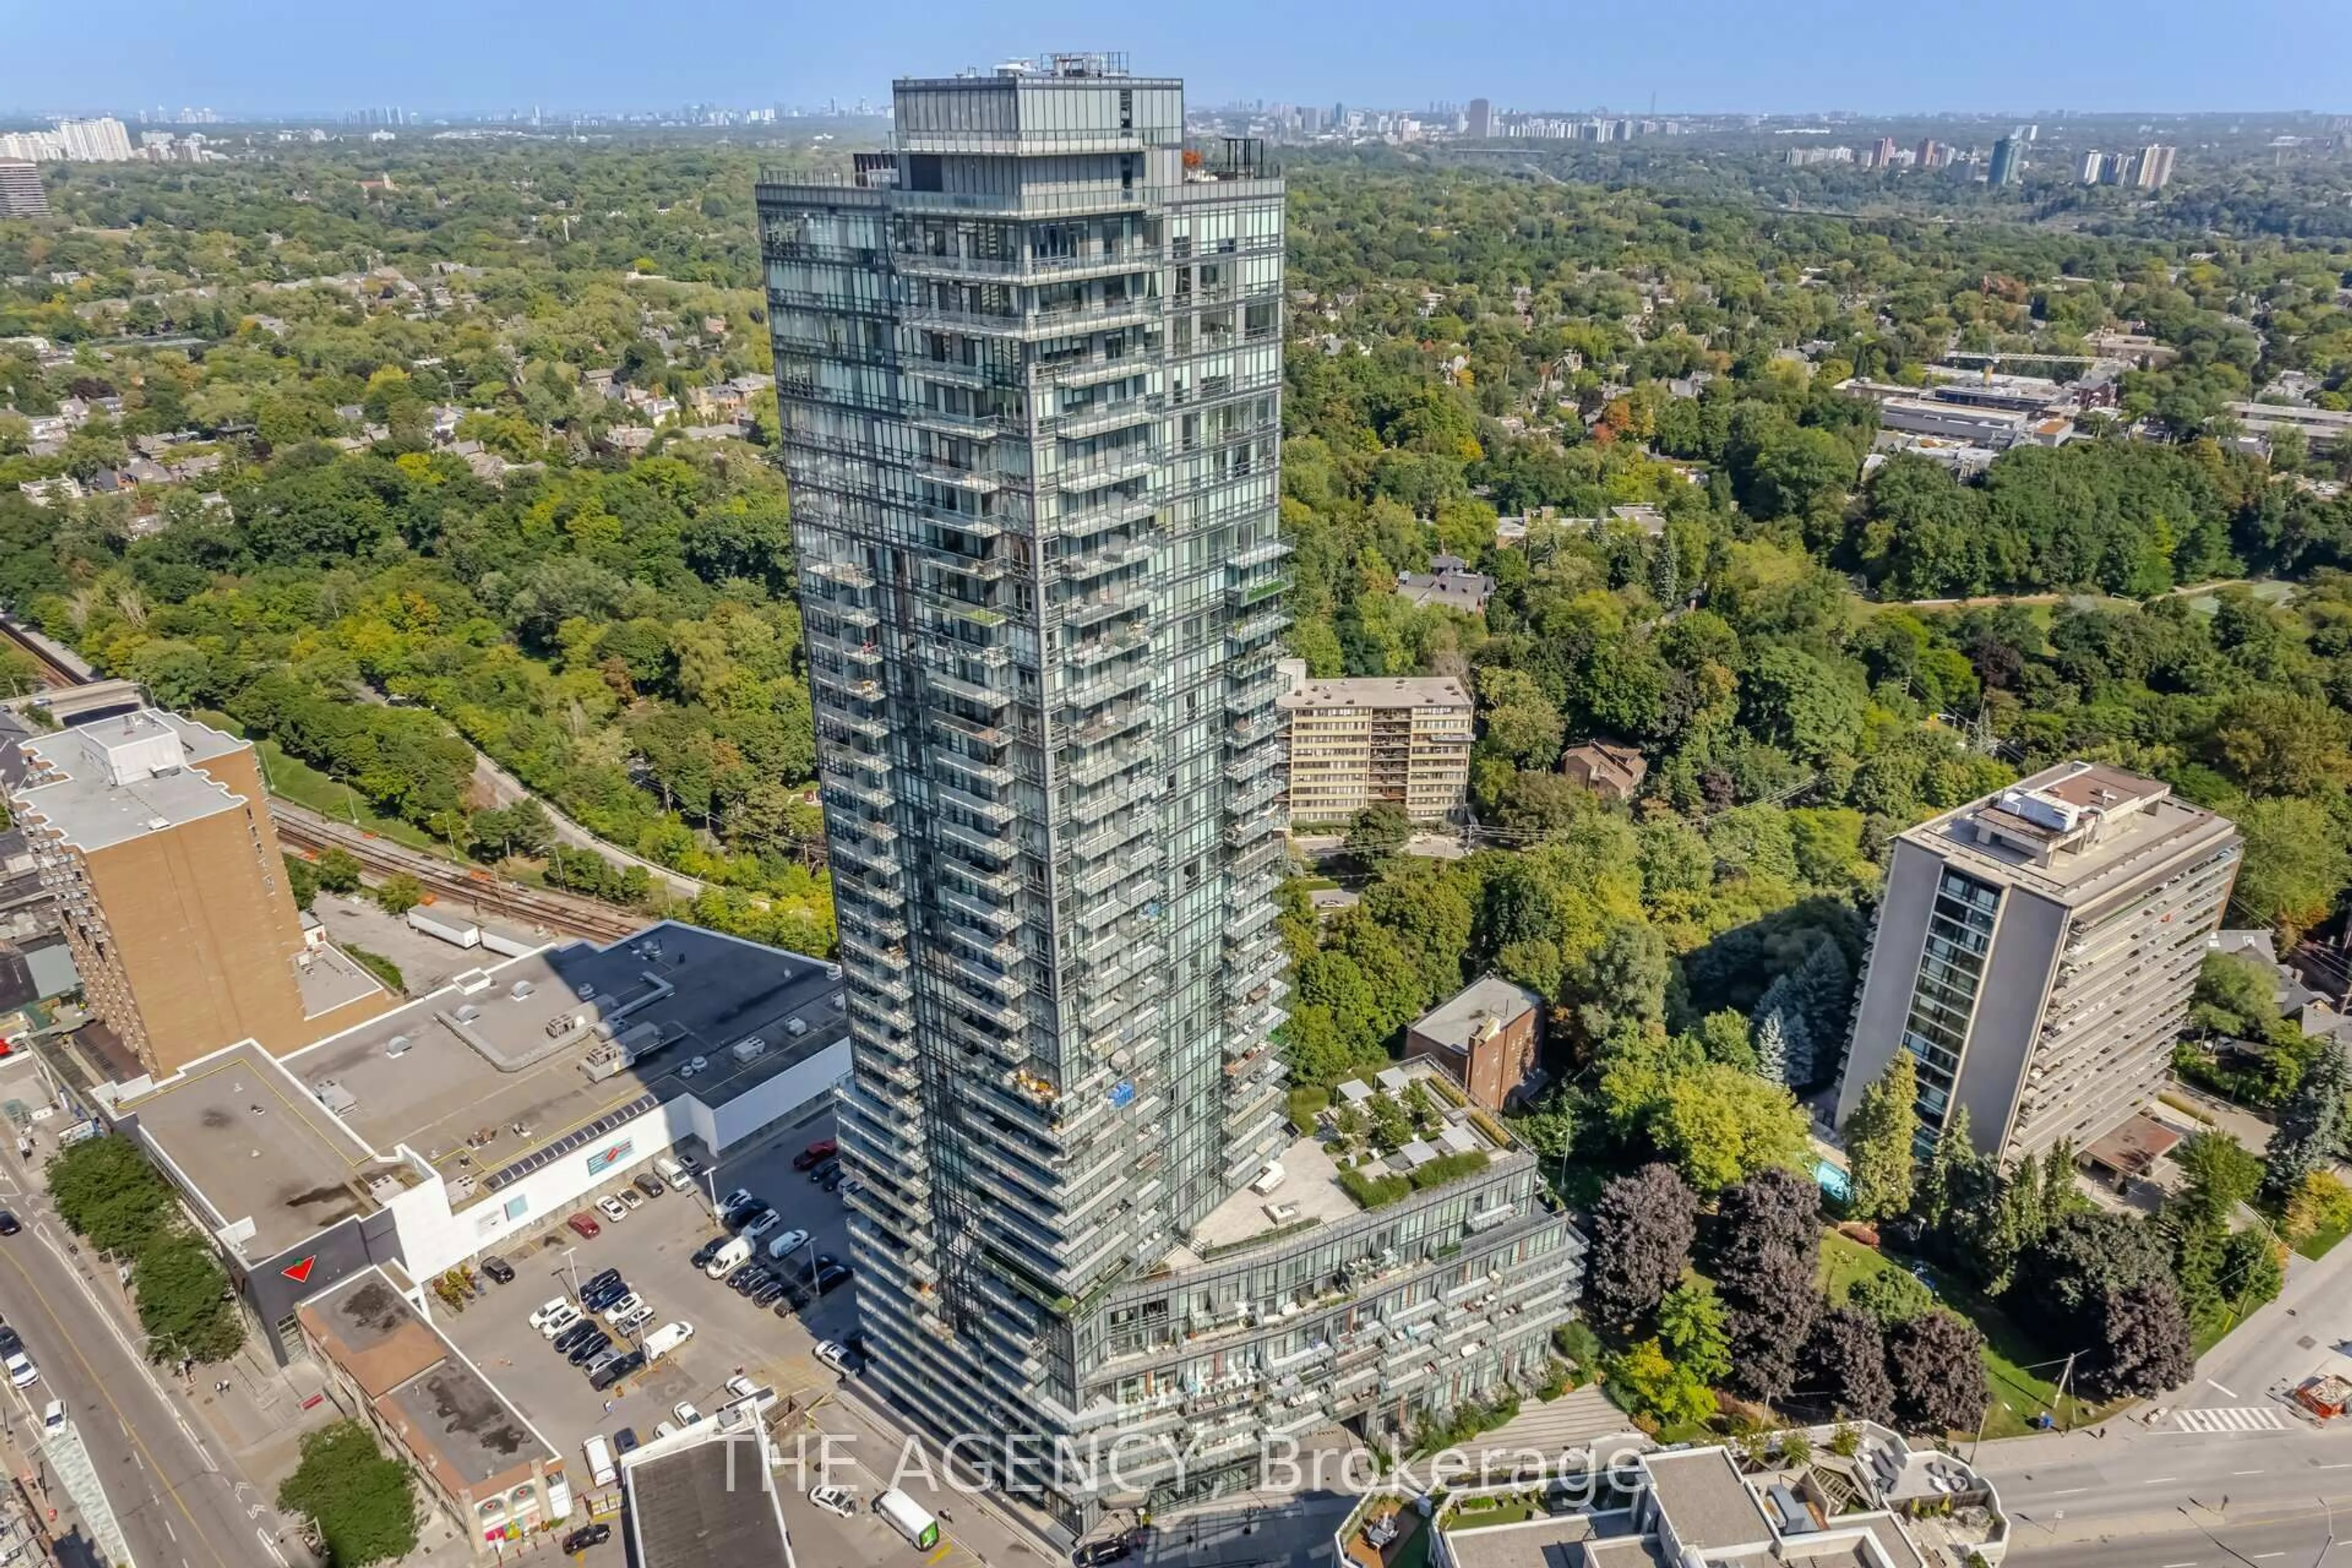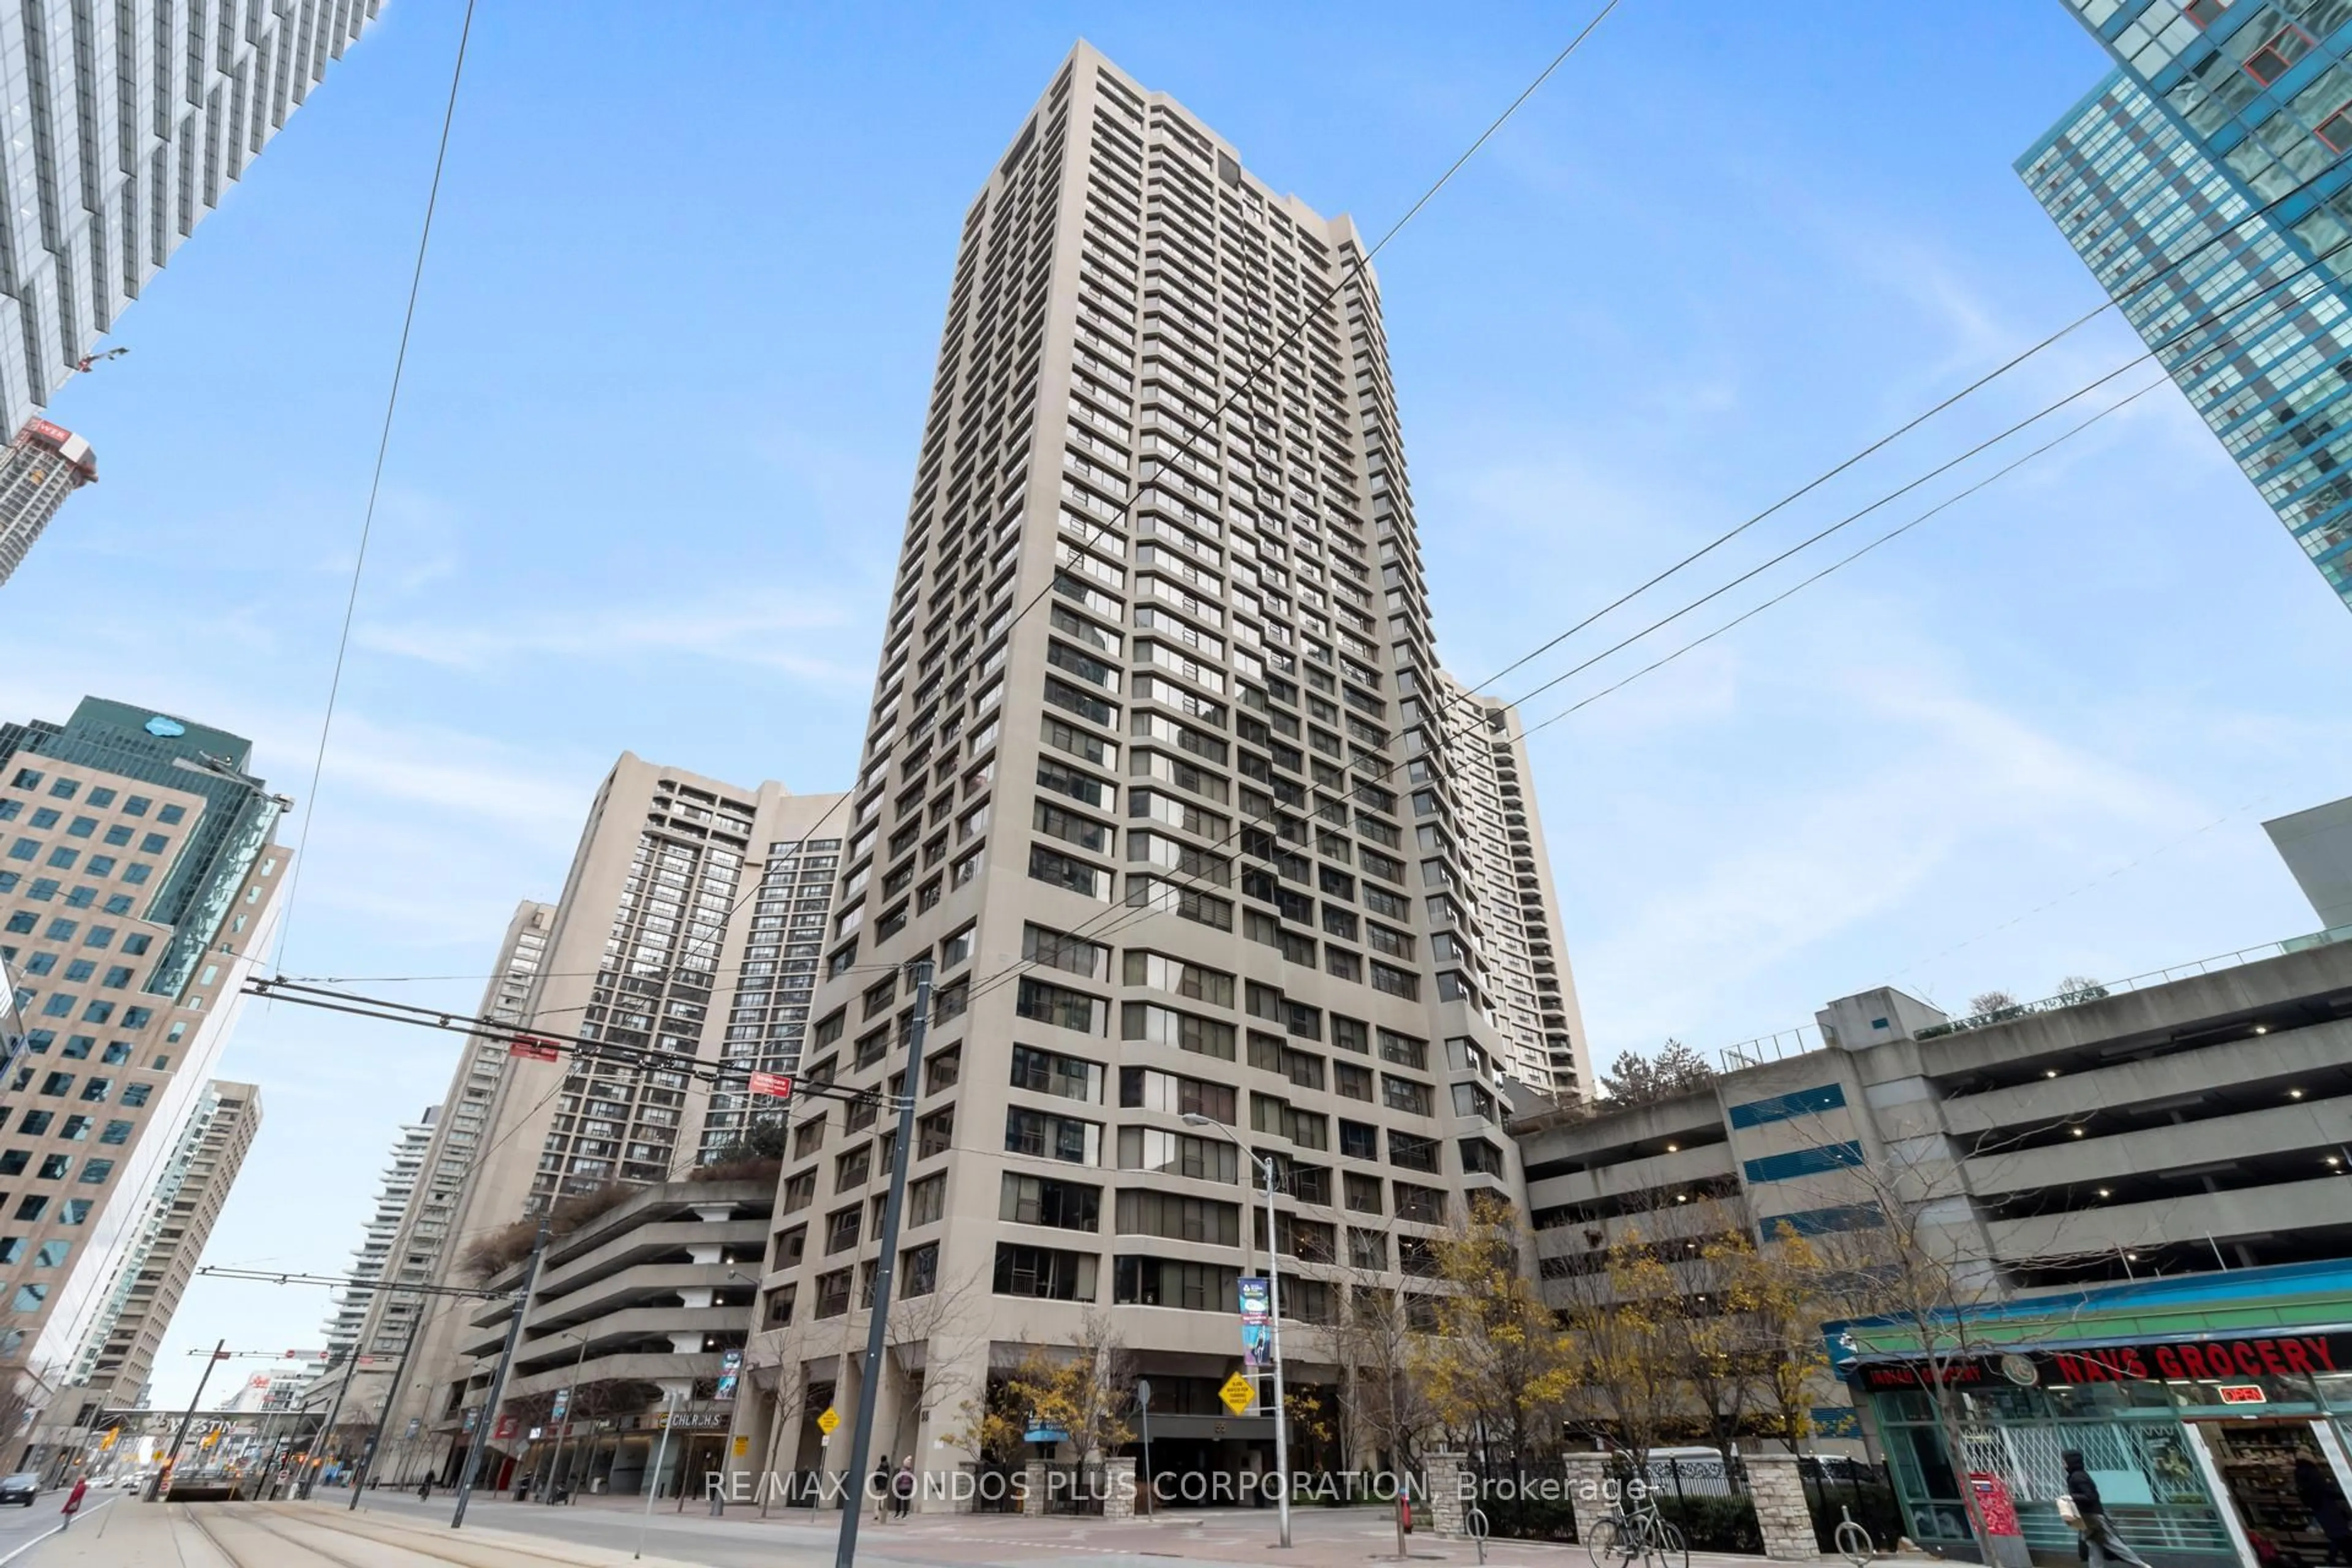
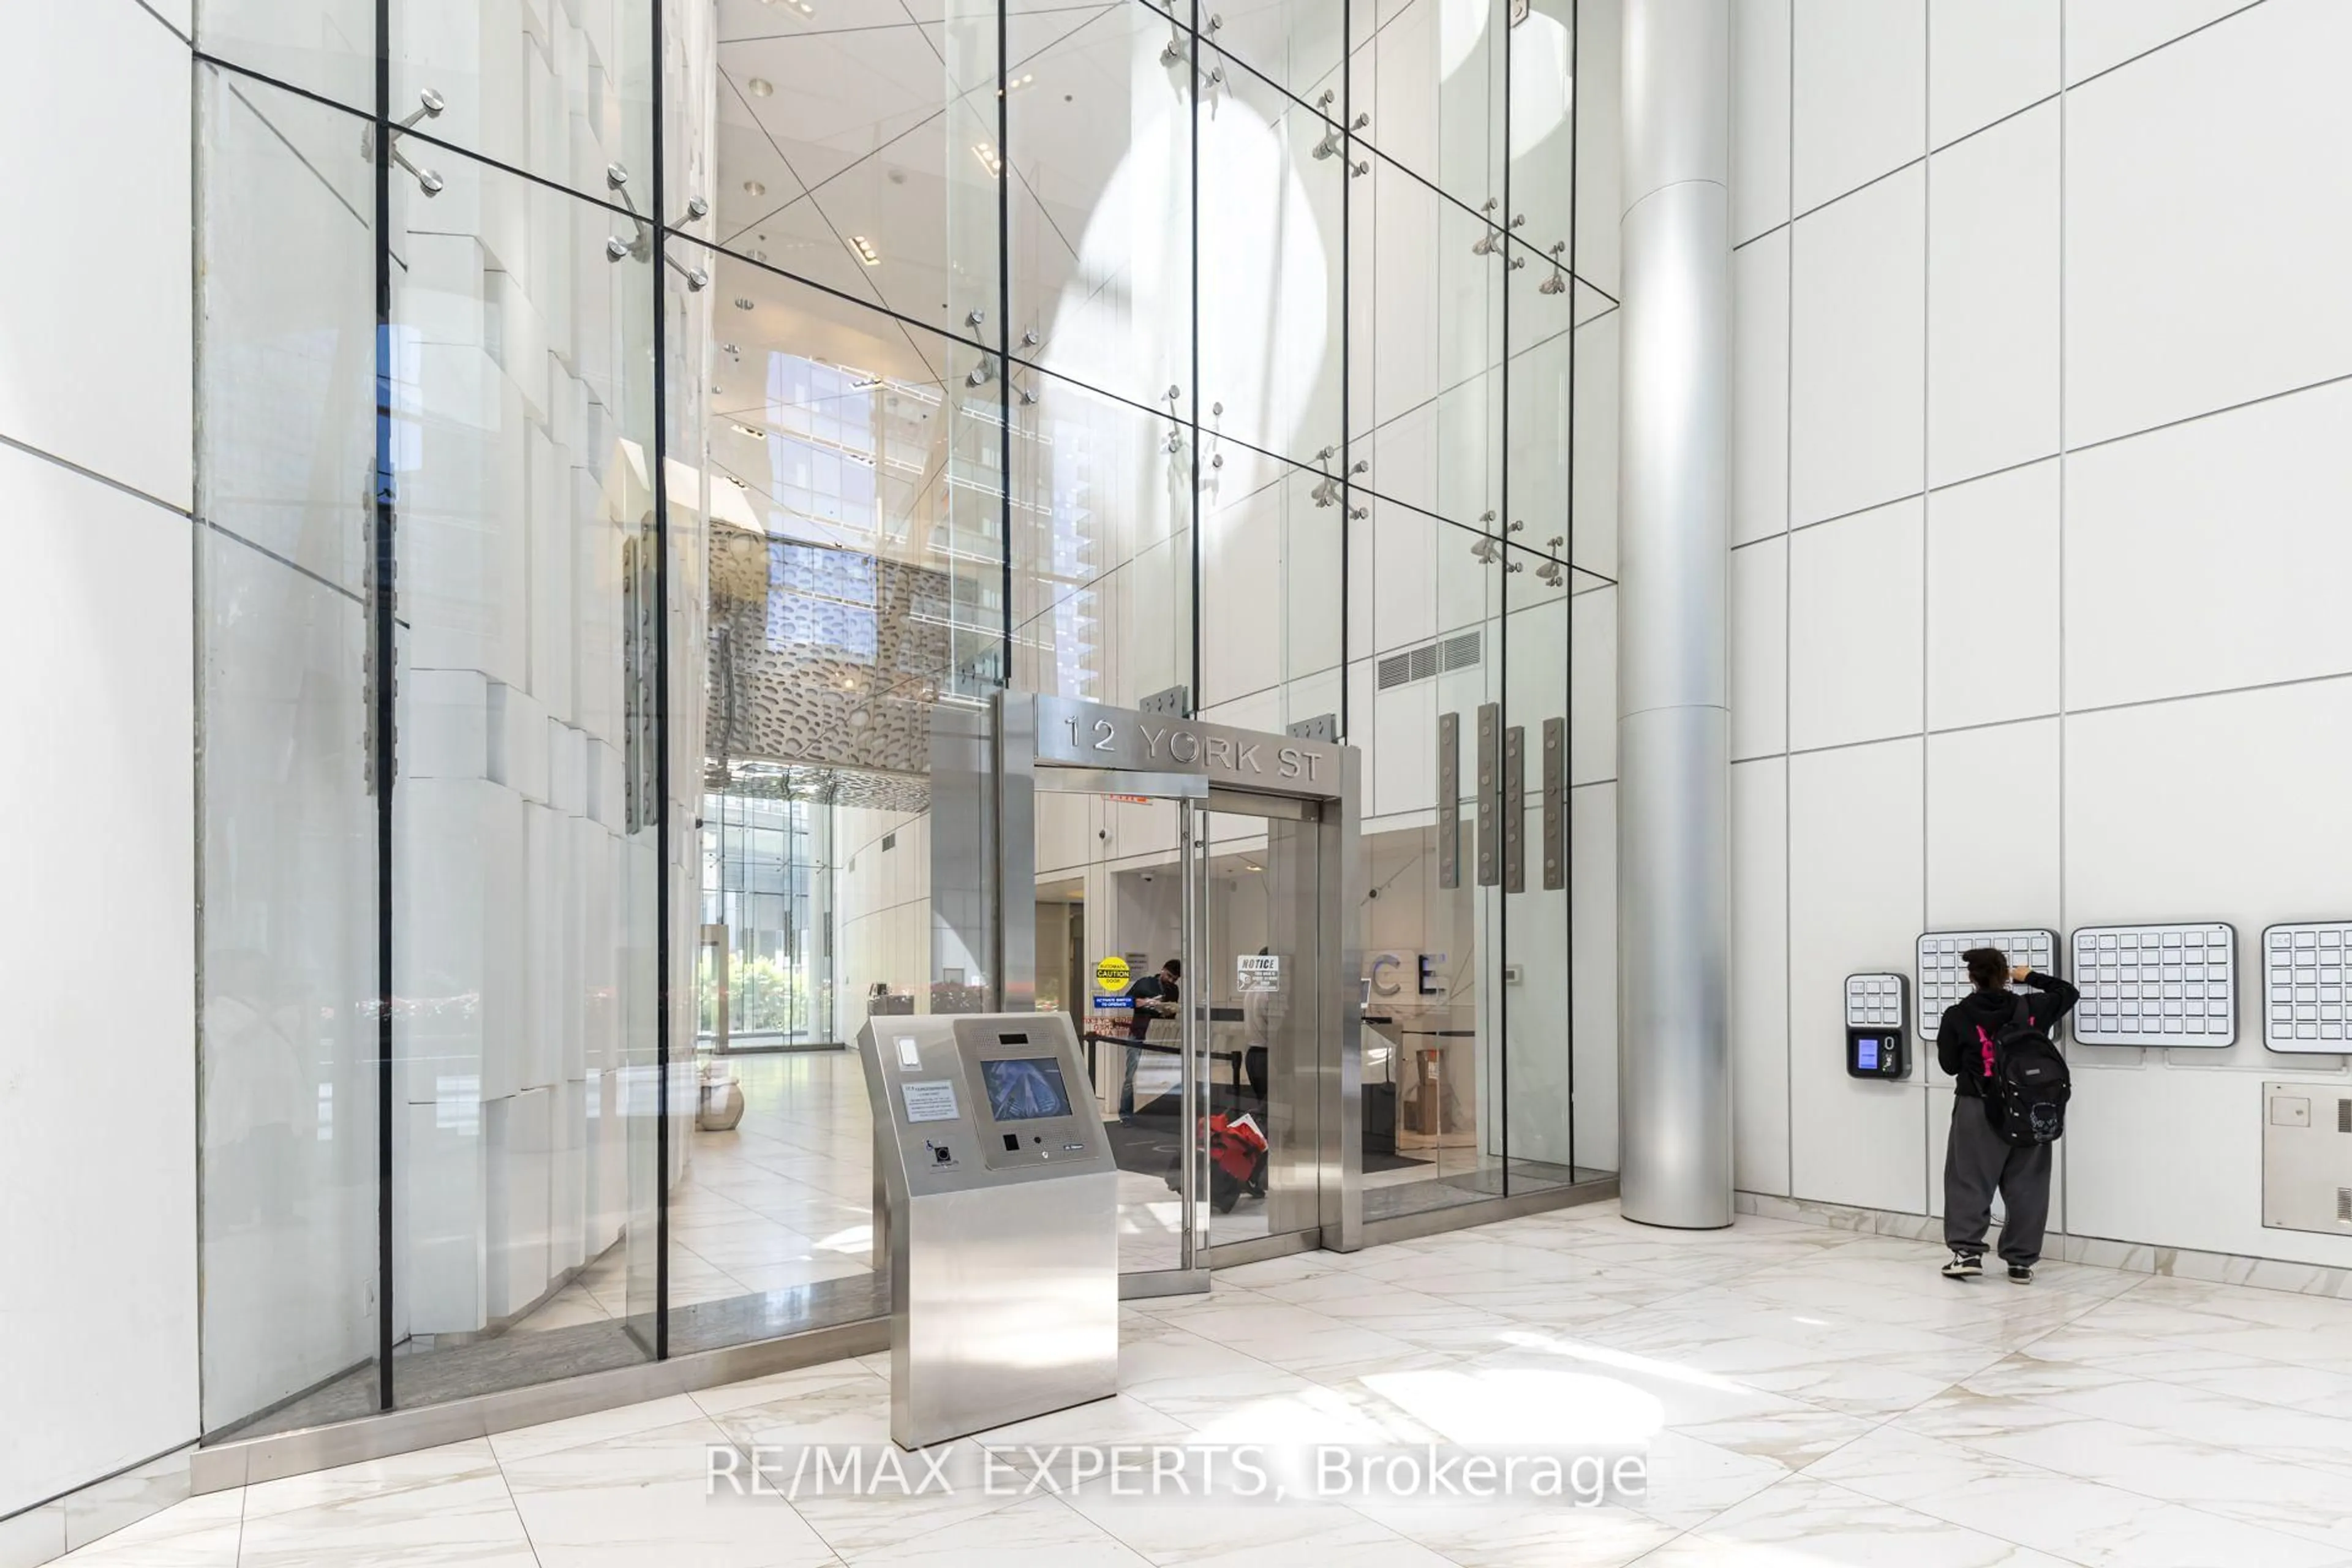
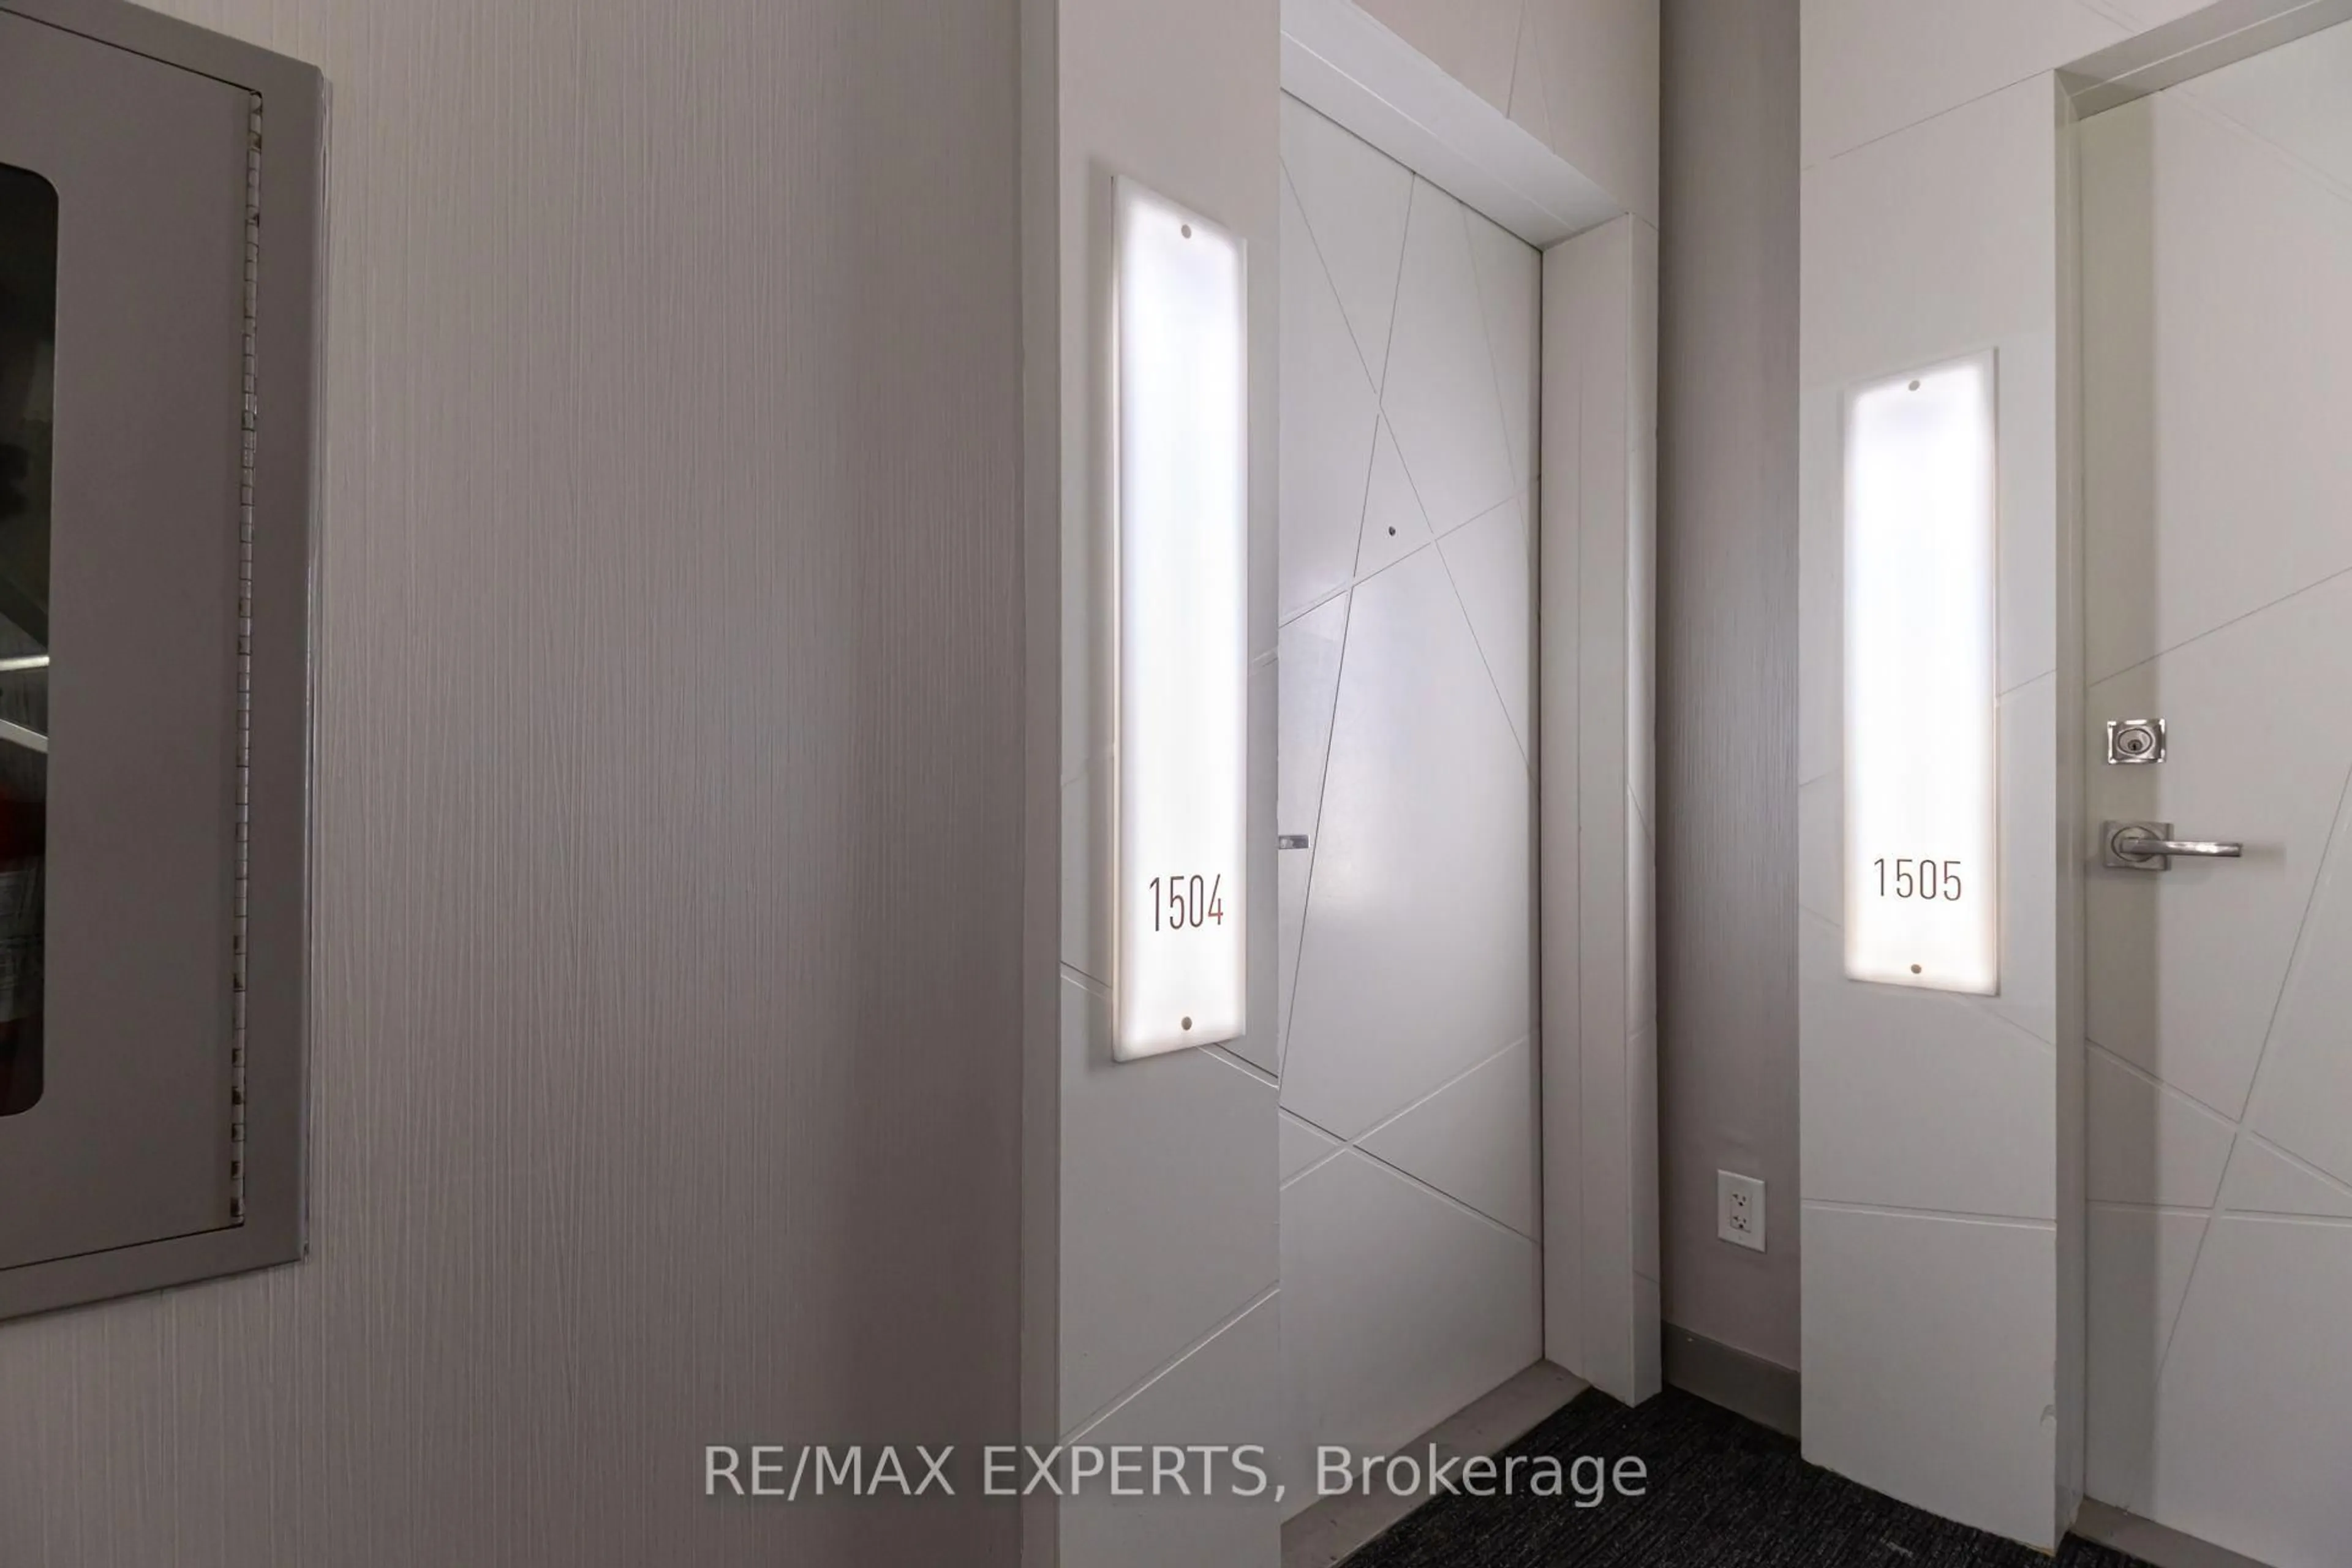
12 York St #1504, Toronto, Ontario M5J 0A9
Contact us about this property
Highlights
Estimated valueThis is the price Wahi expects this property to sell for.
The calculation is powered by our Instant Home Value Estimate, which uses current market and property price trends to estimate your home’s value with a 90% accuracy rate.Not available
Price/Sqft$806/sqft
Monthly cost
Open Calculator
Description
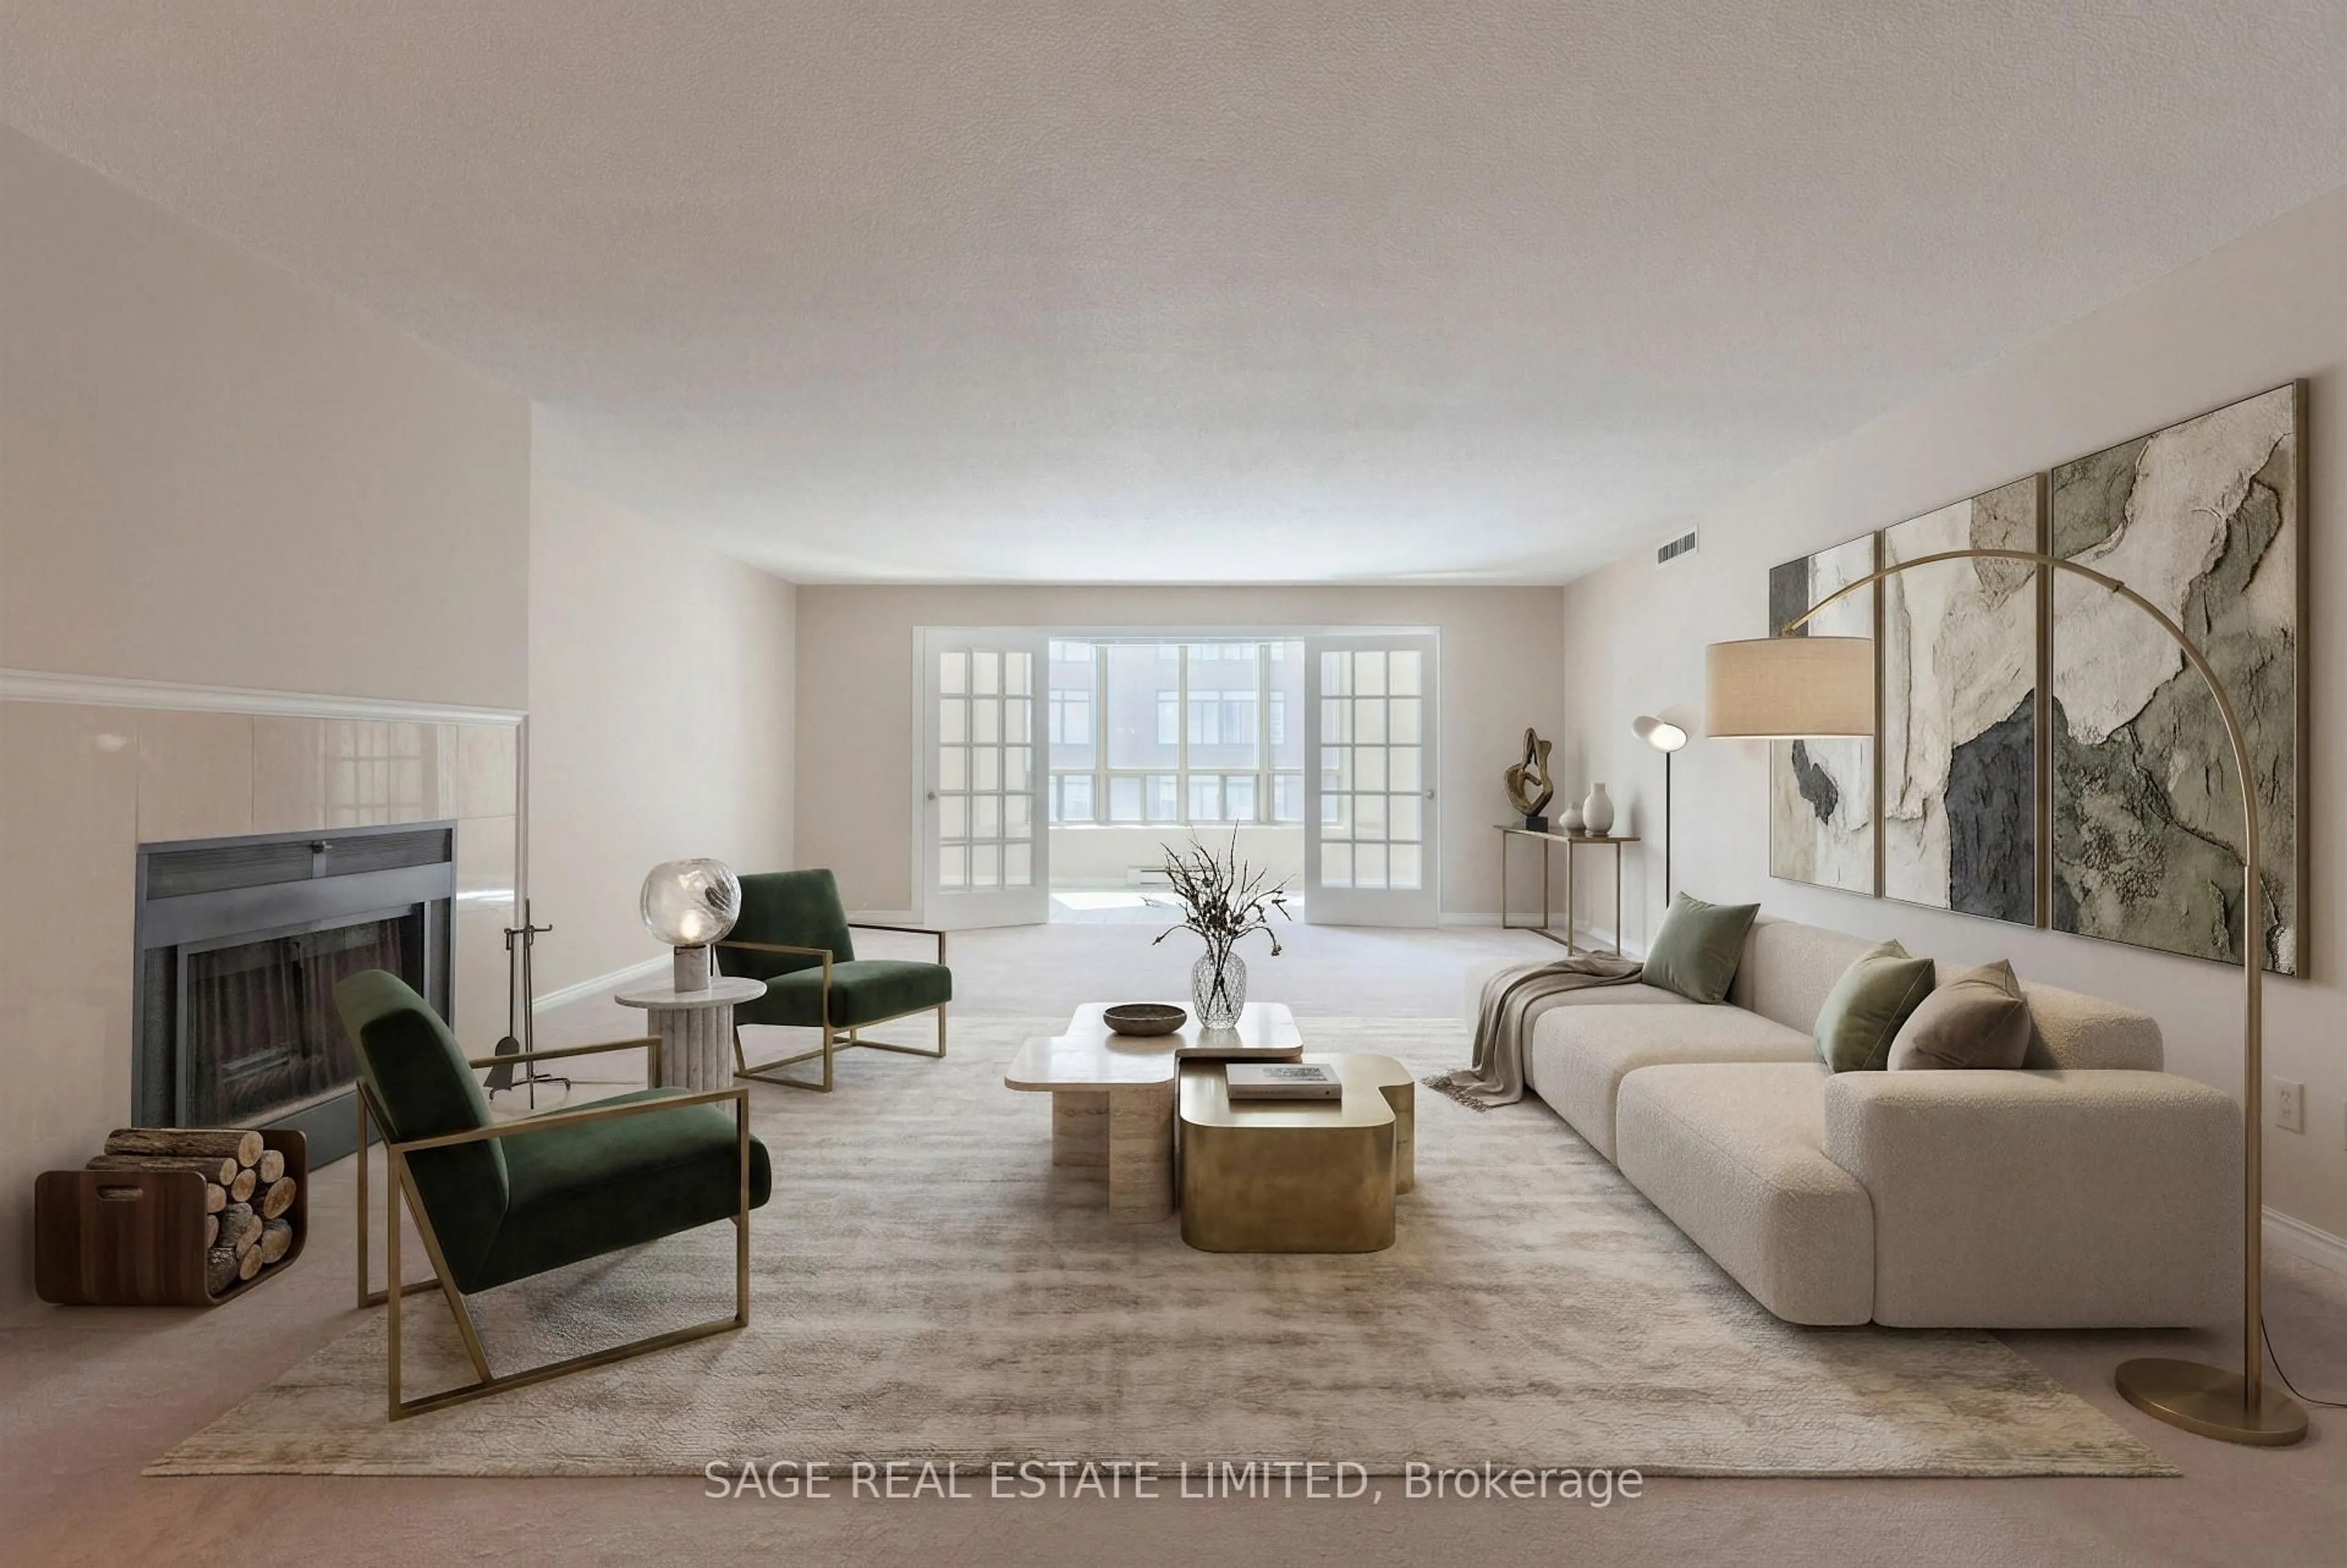
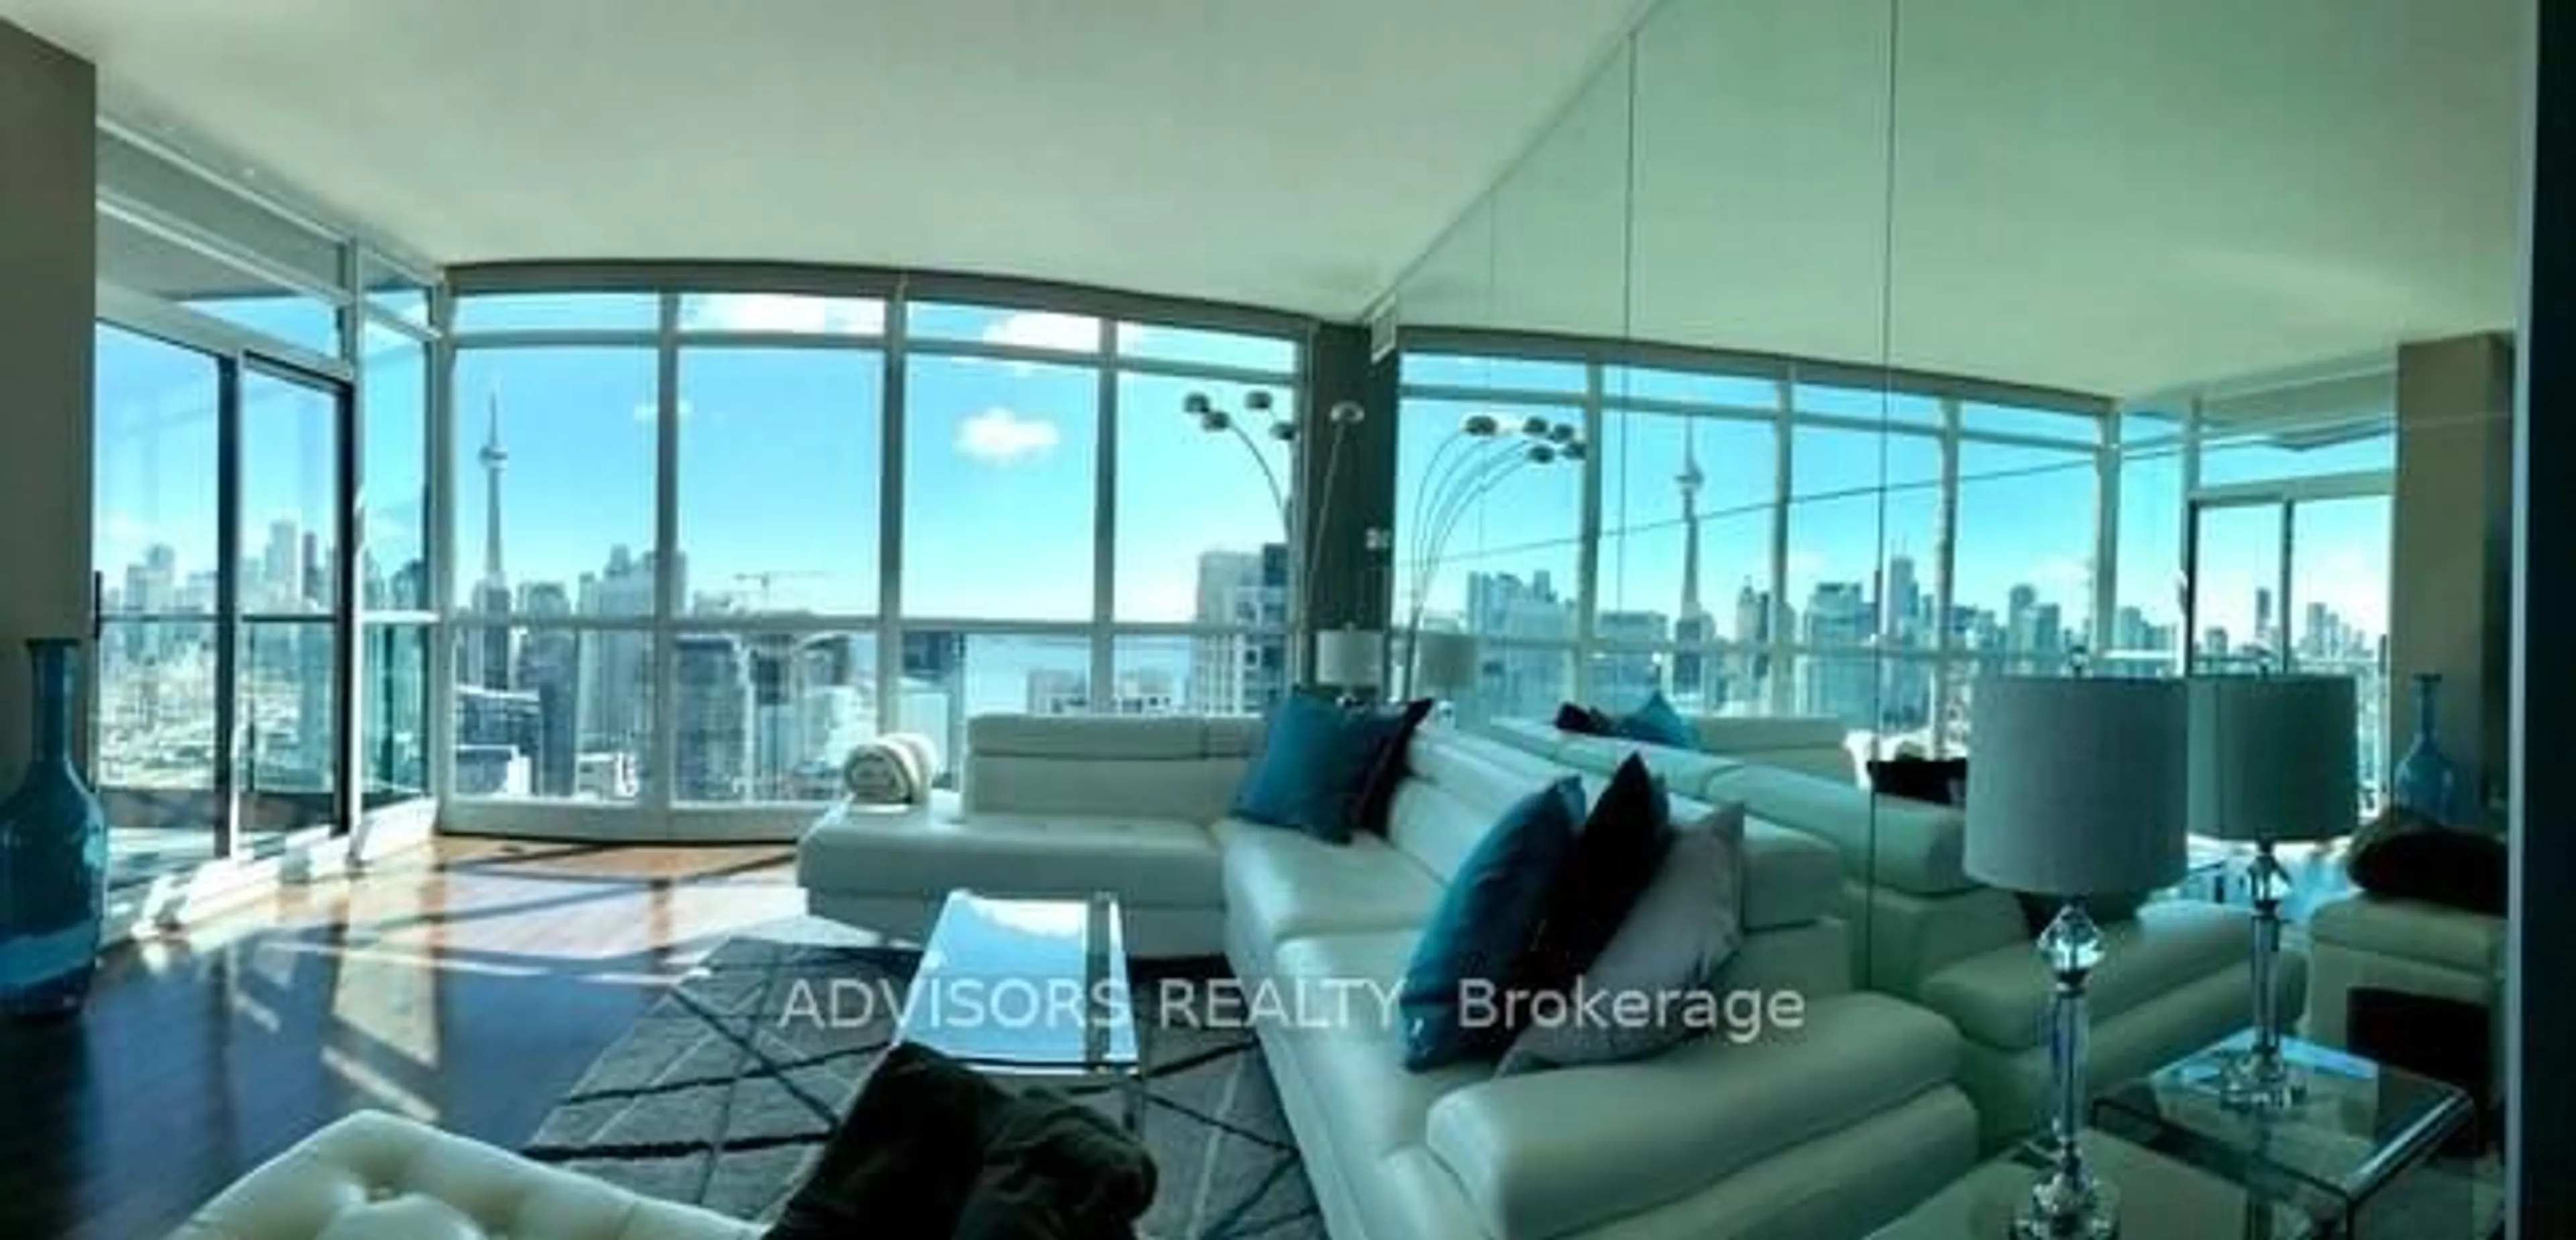
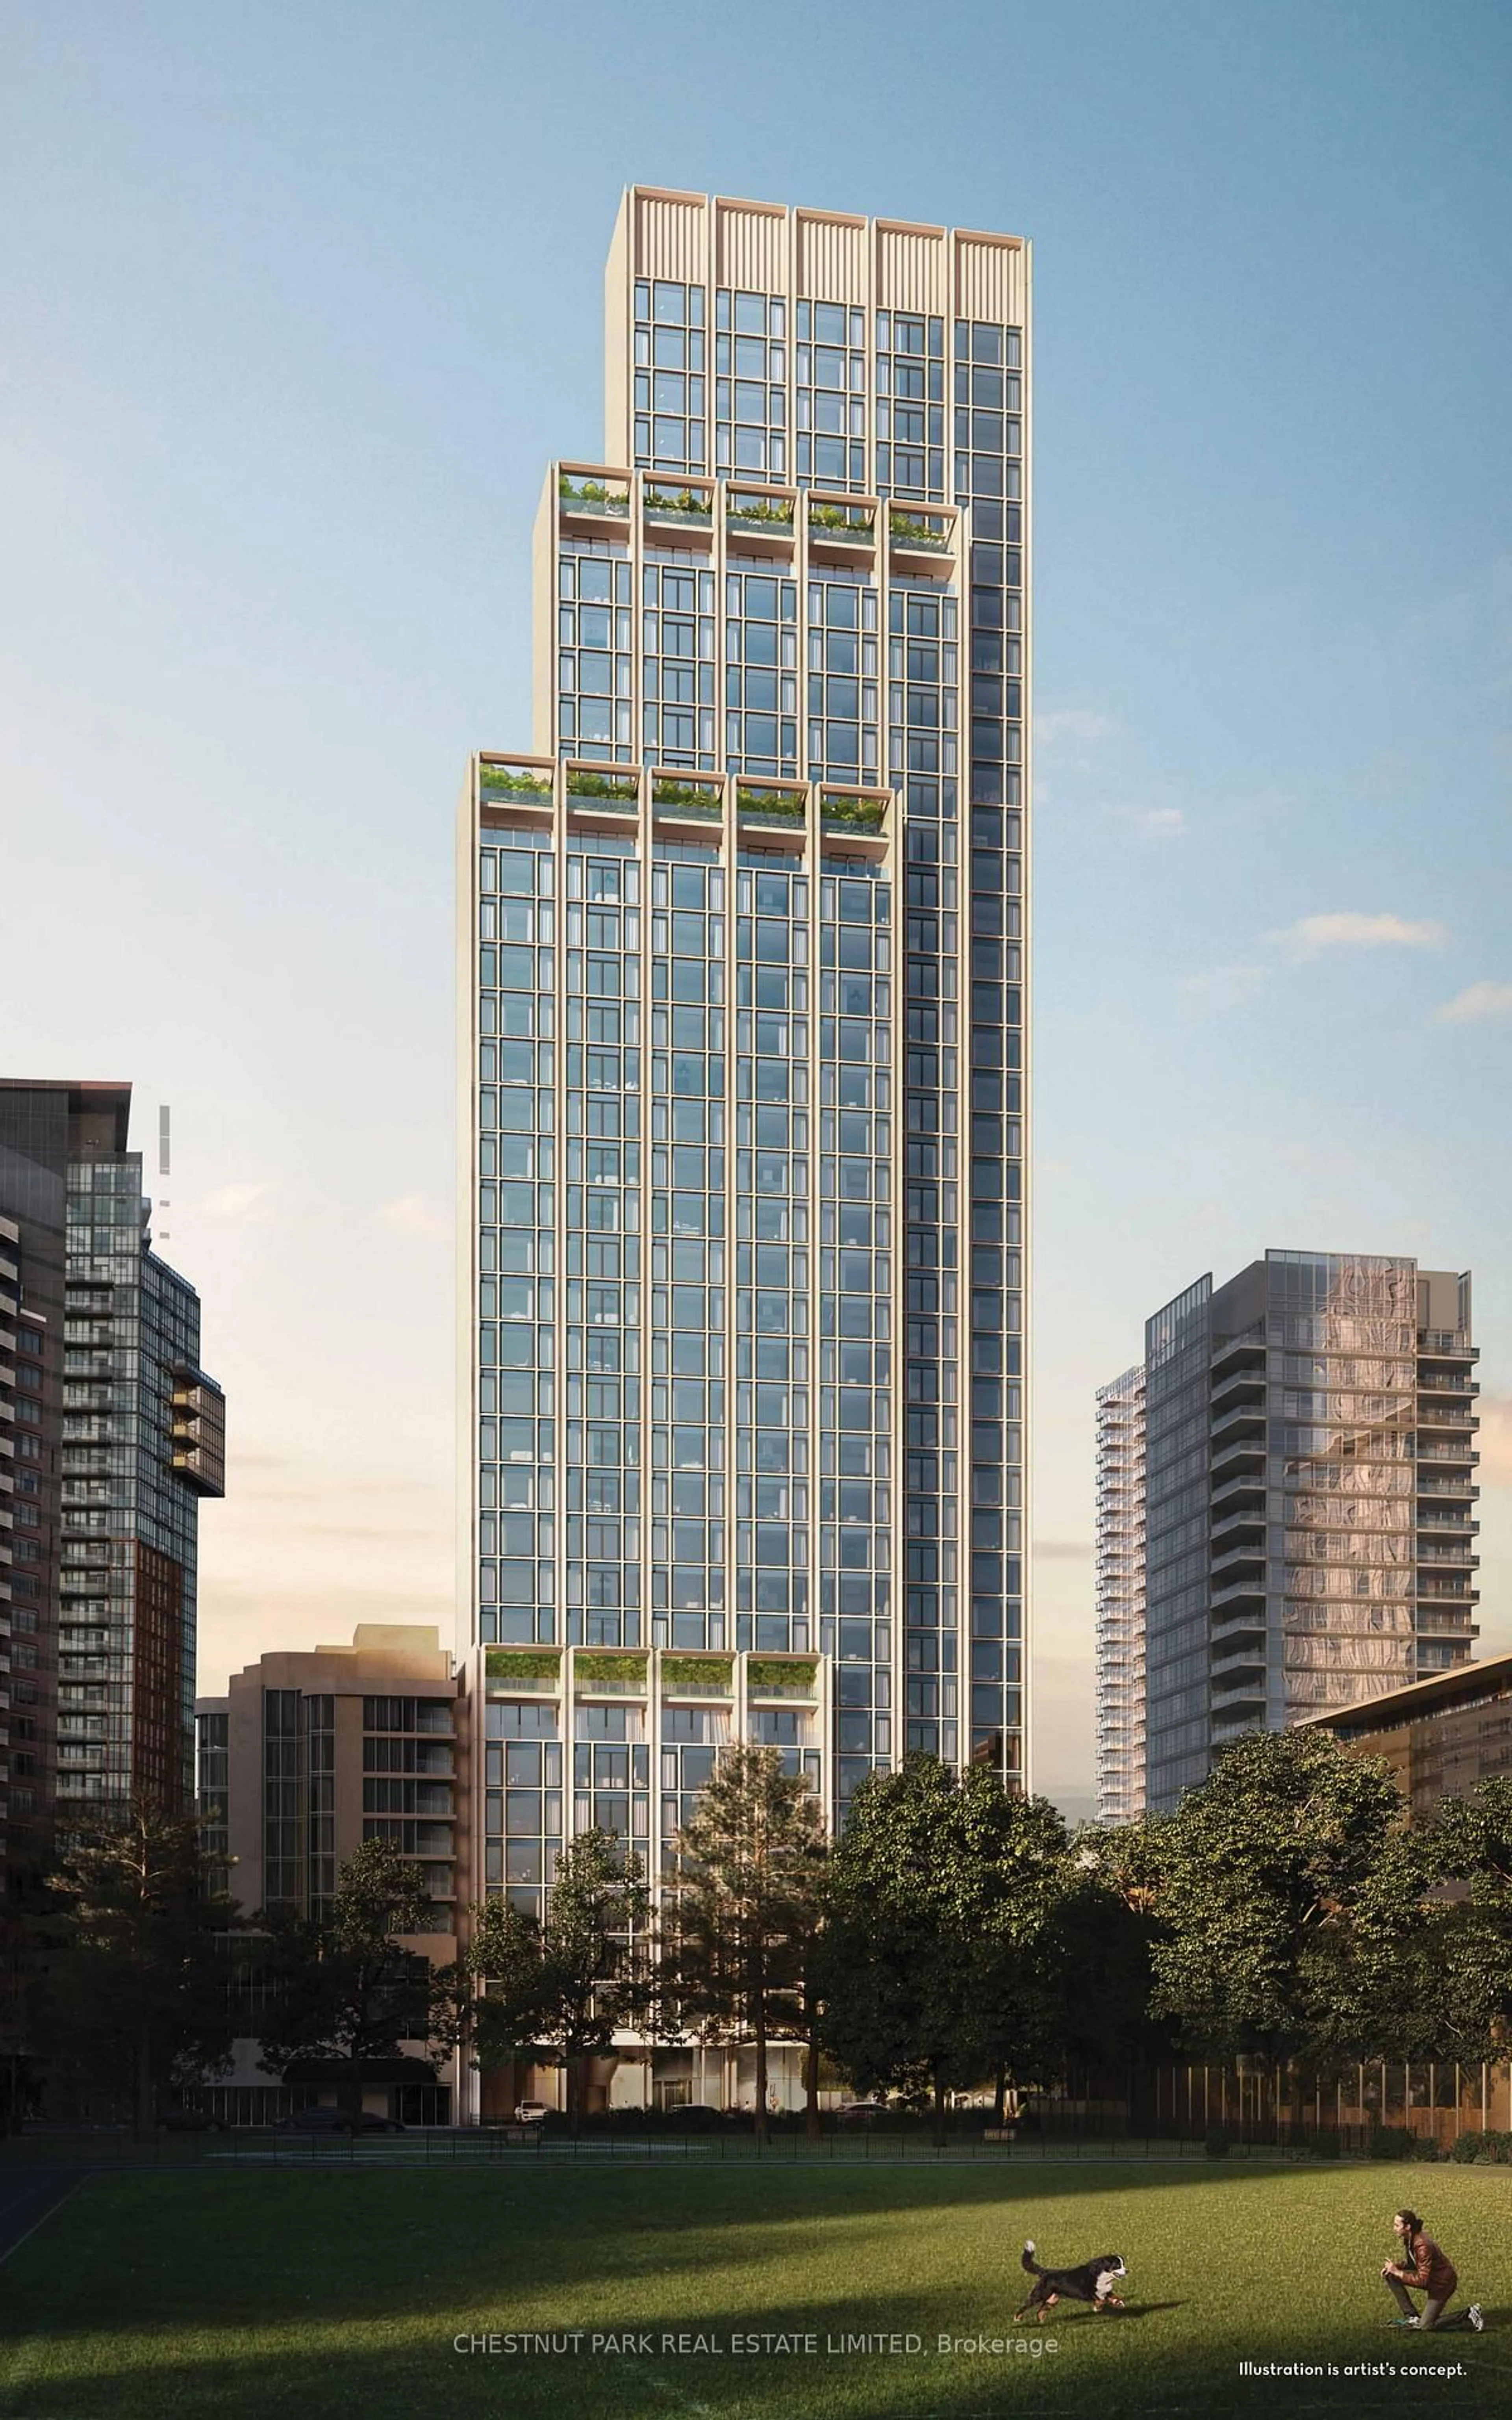
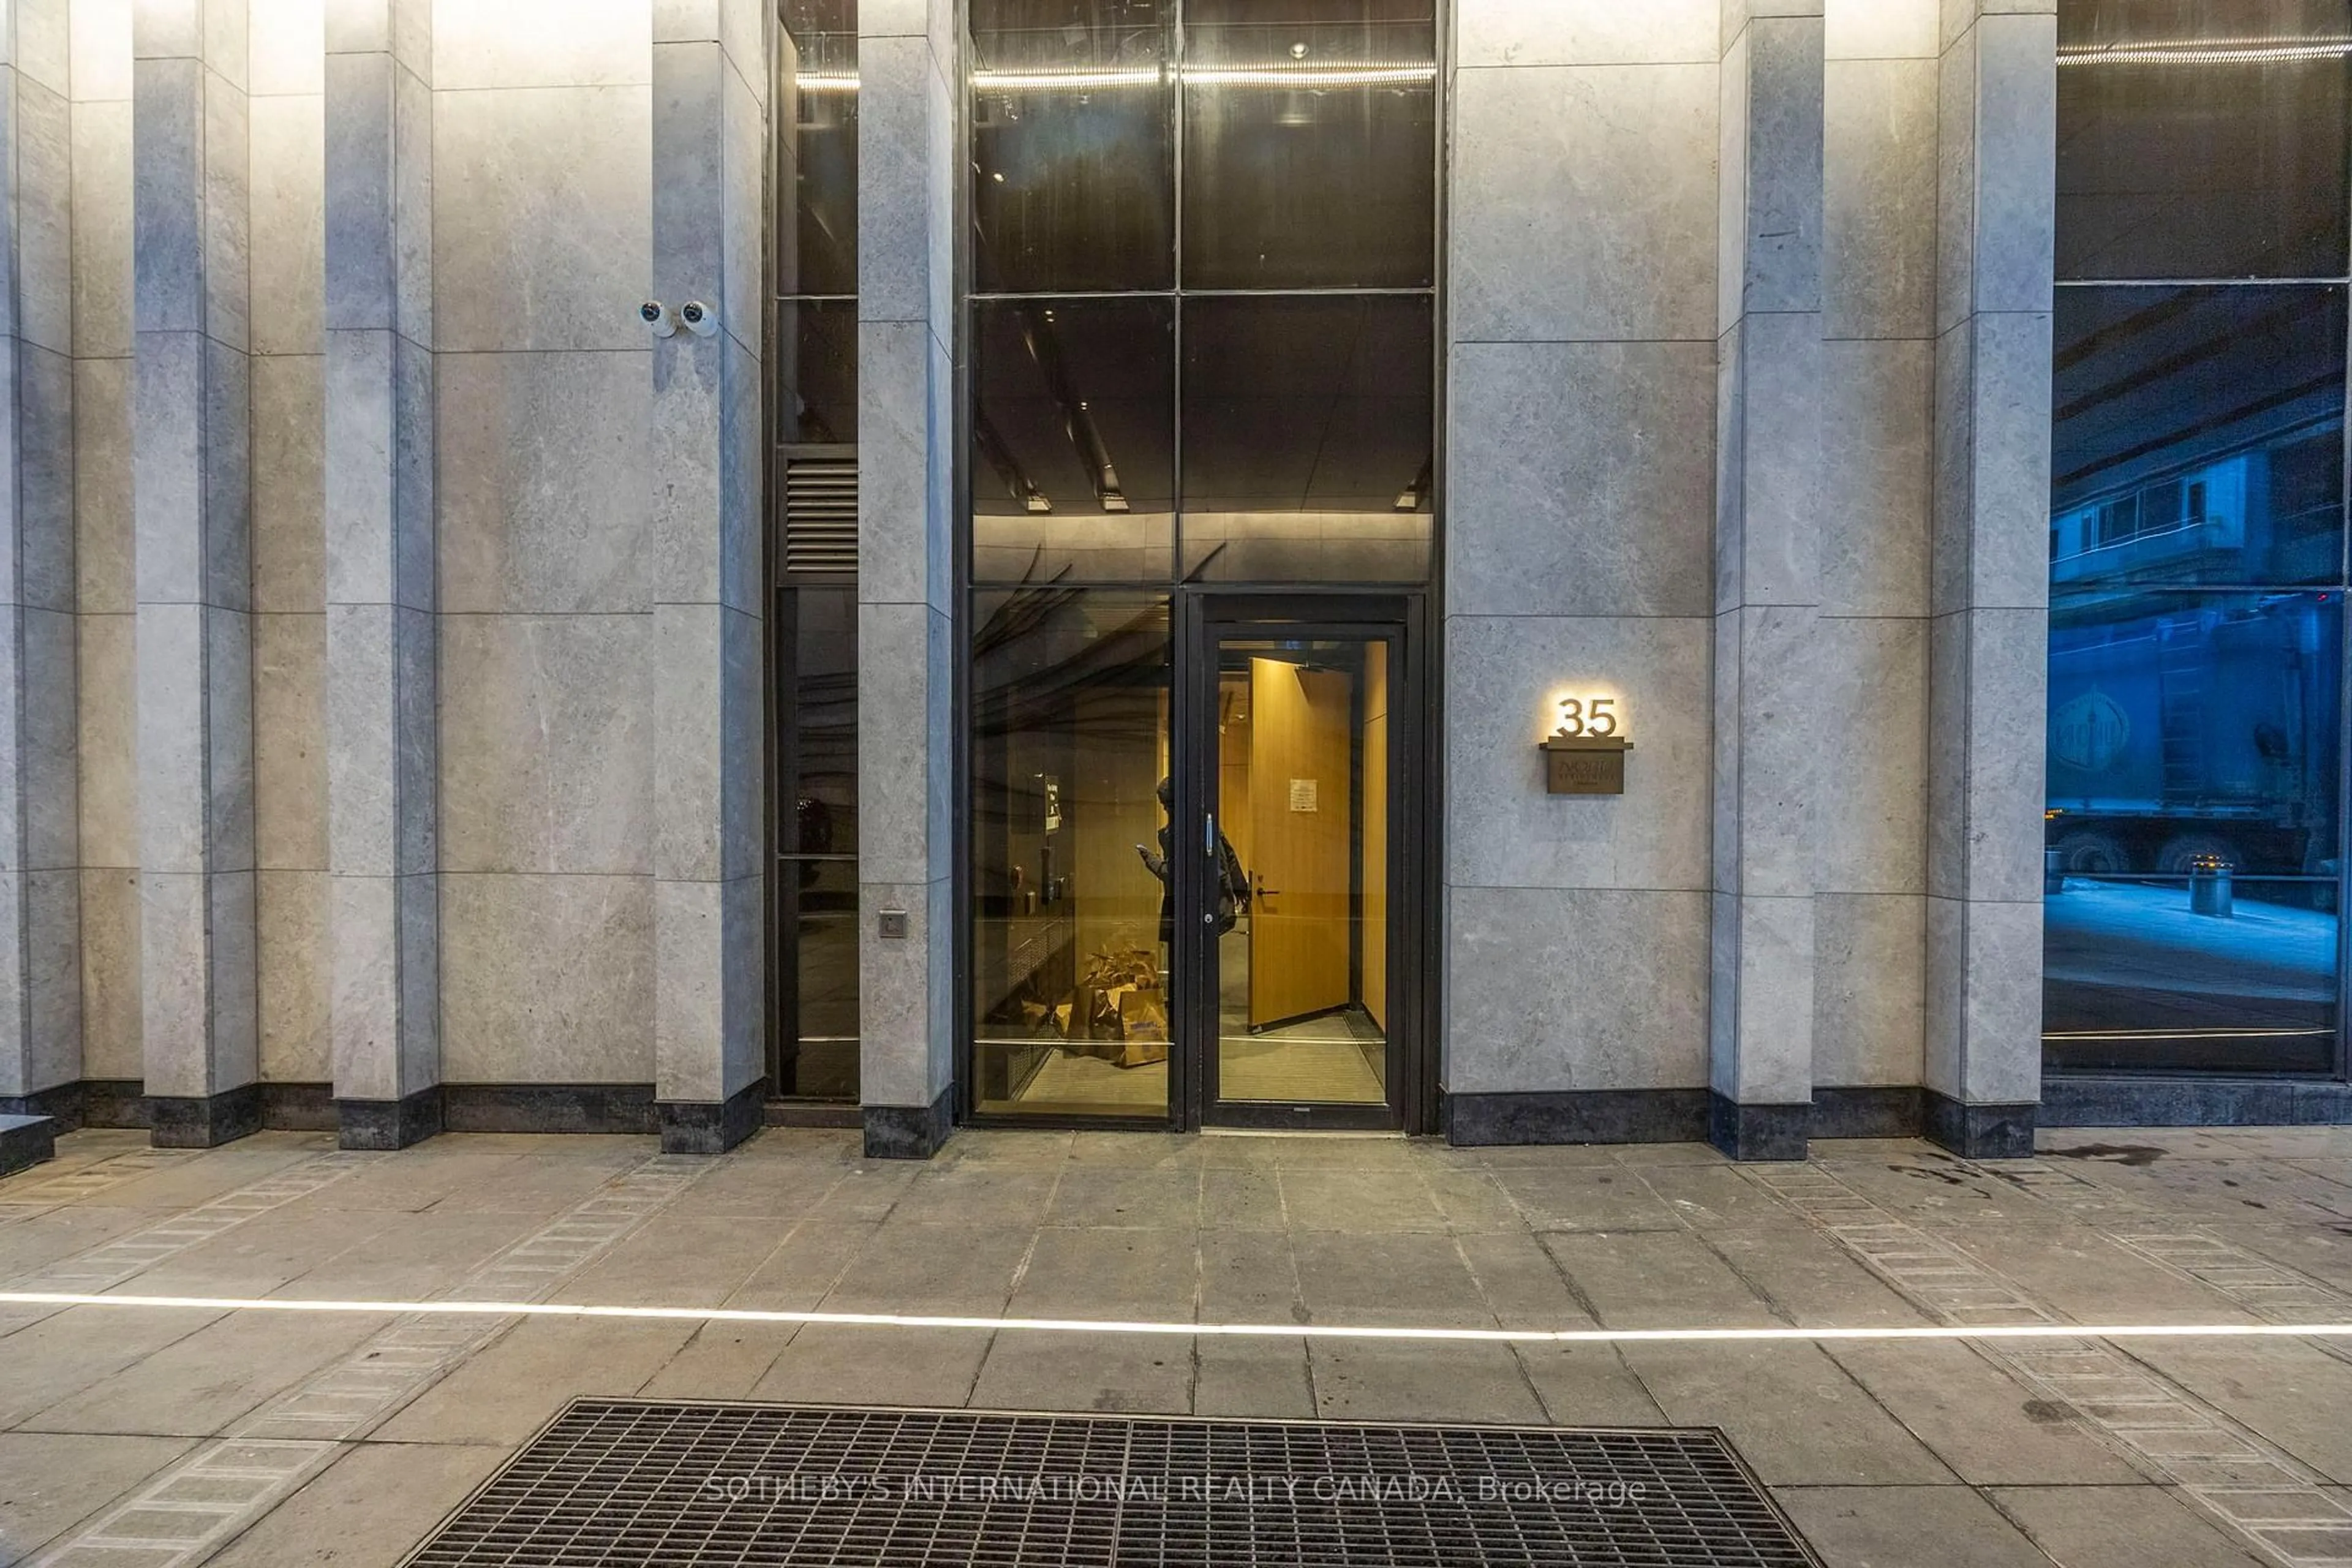
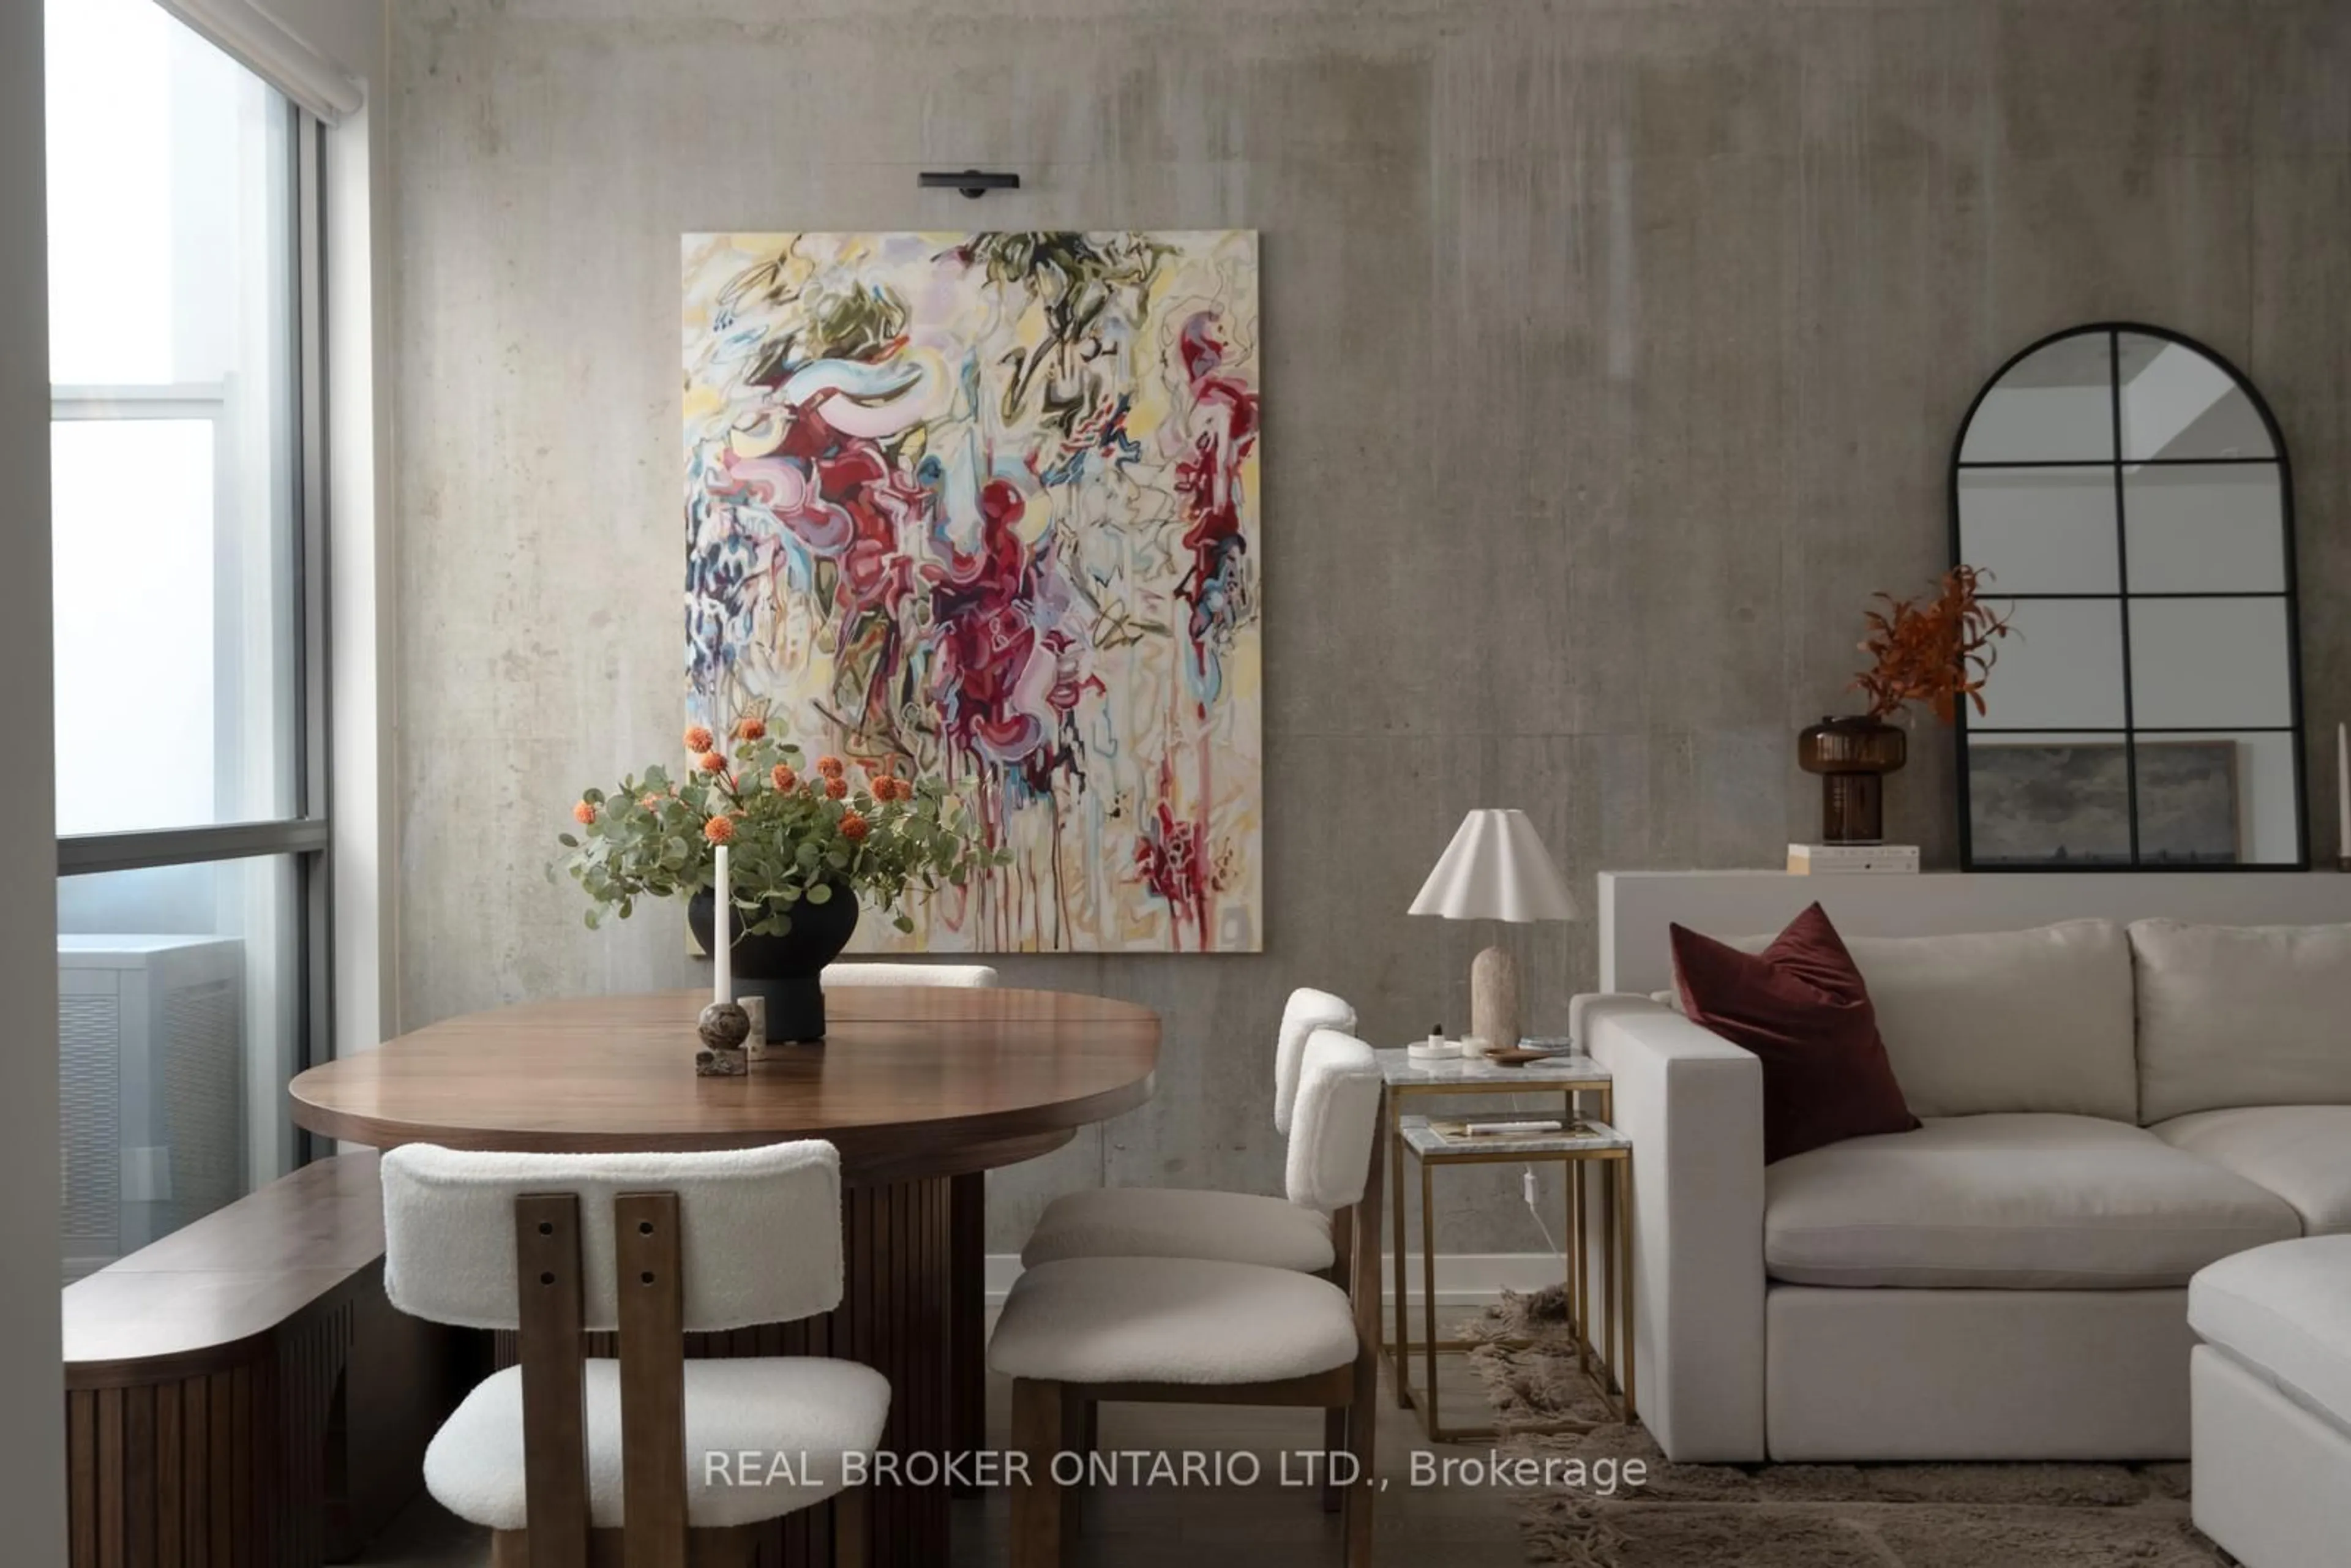
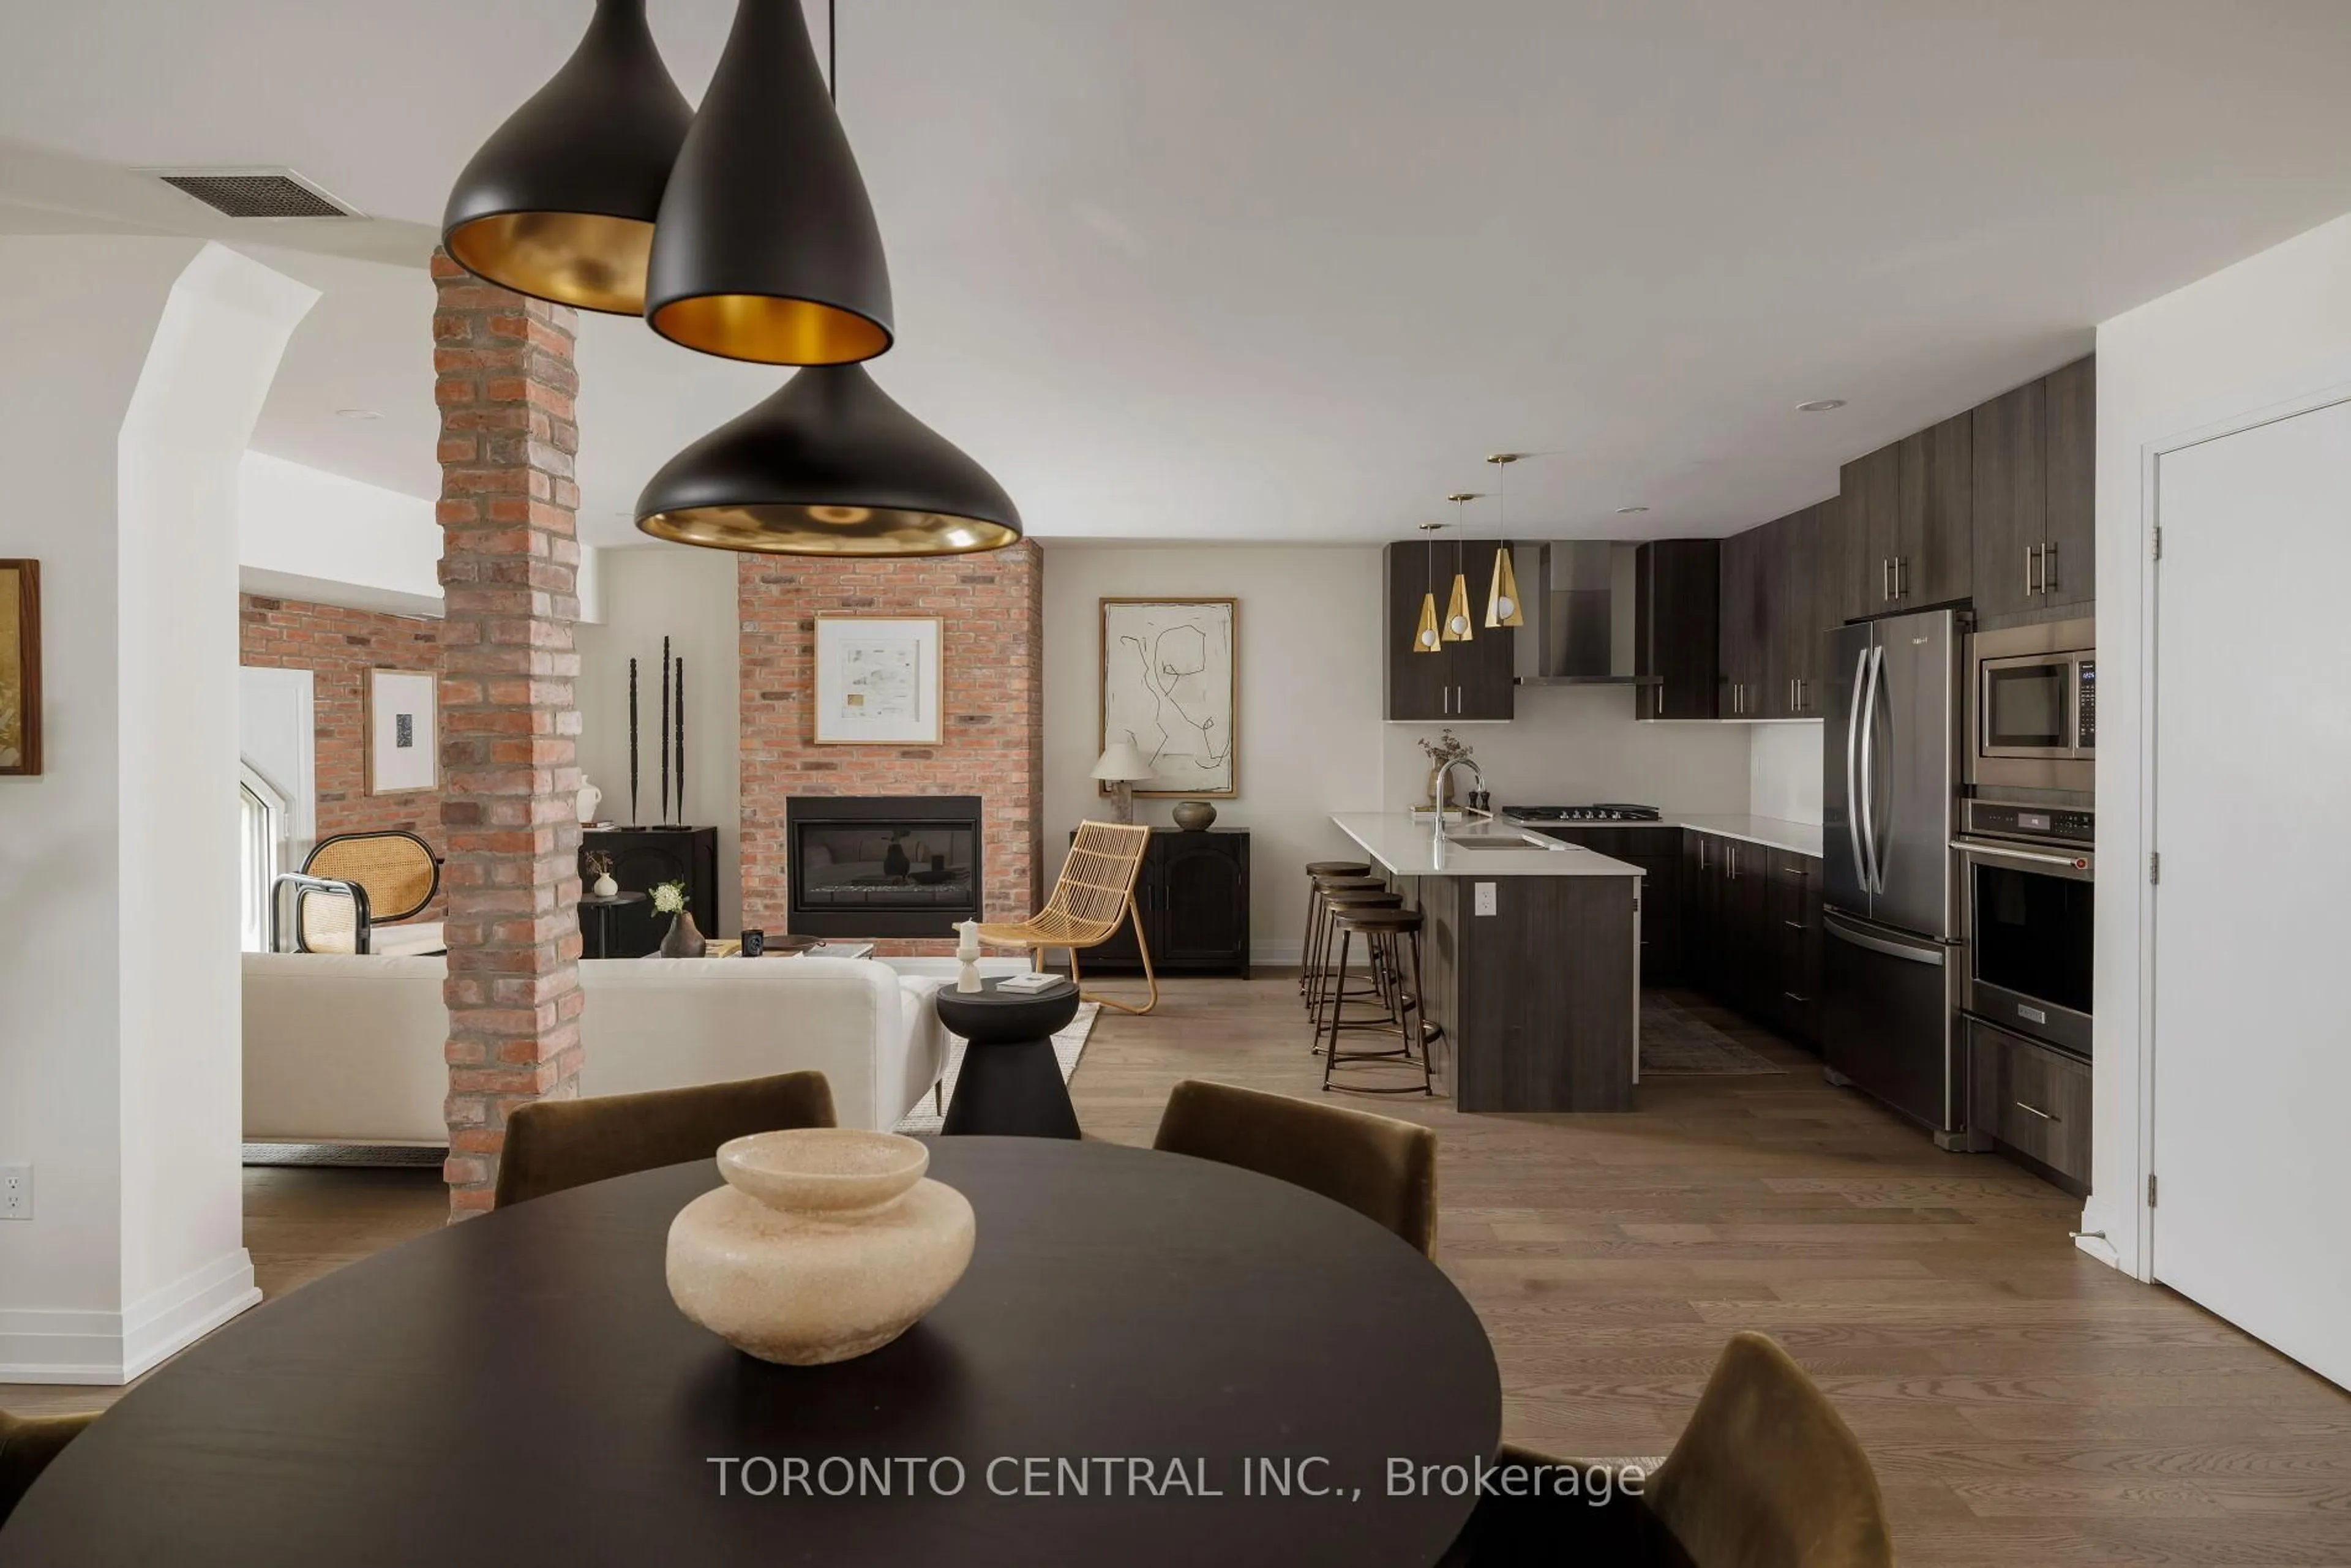
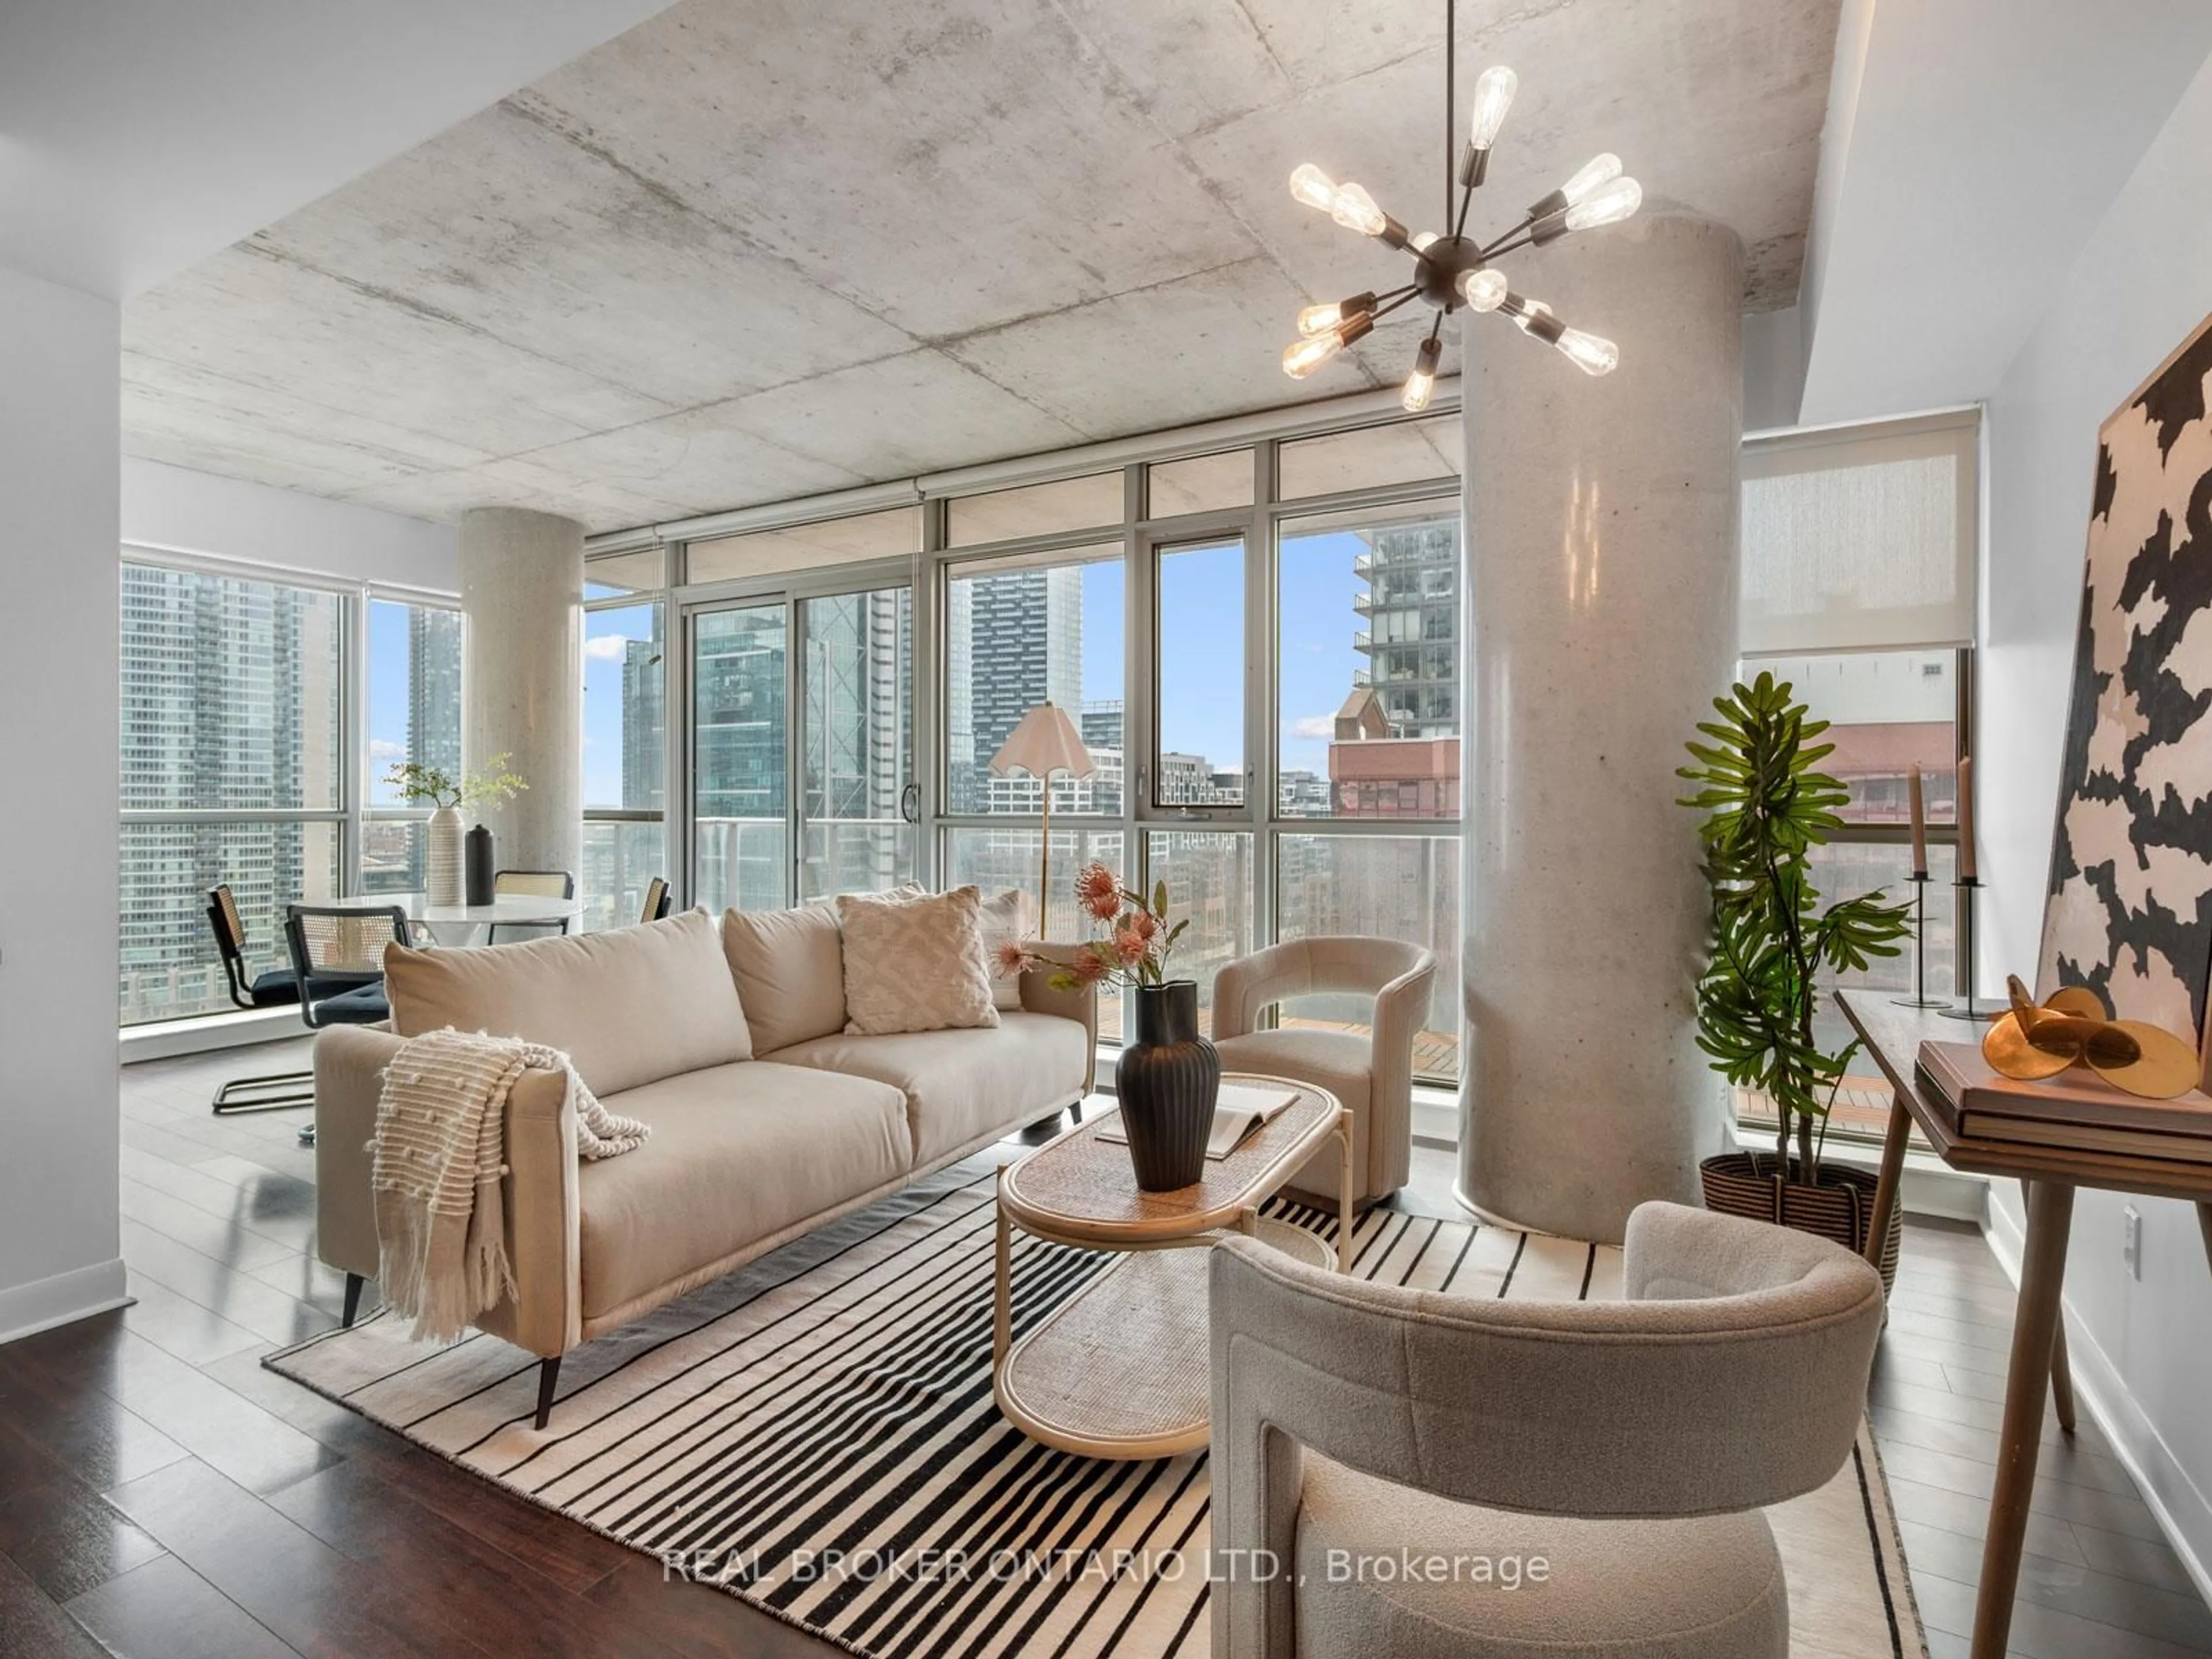
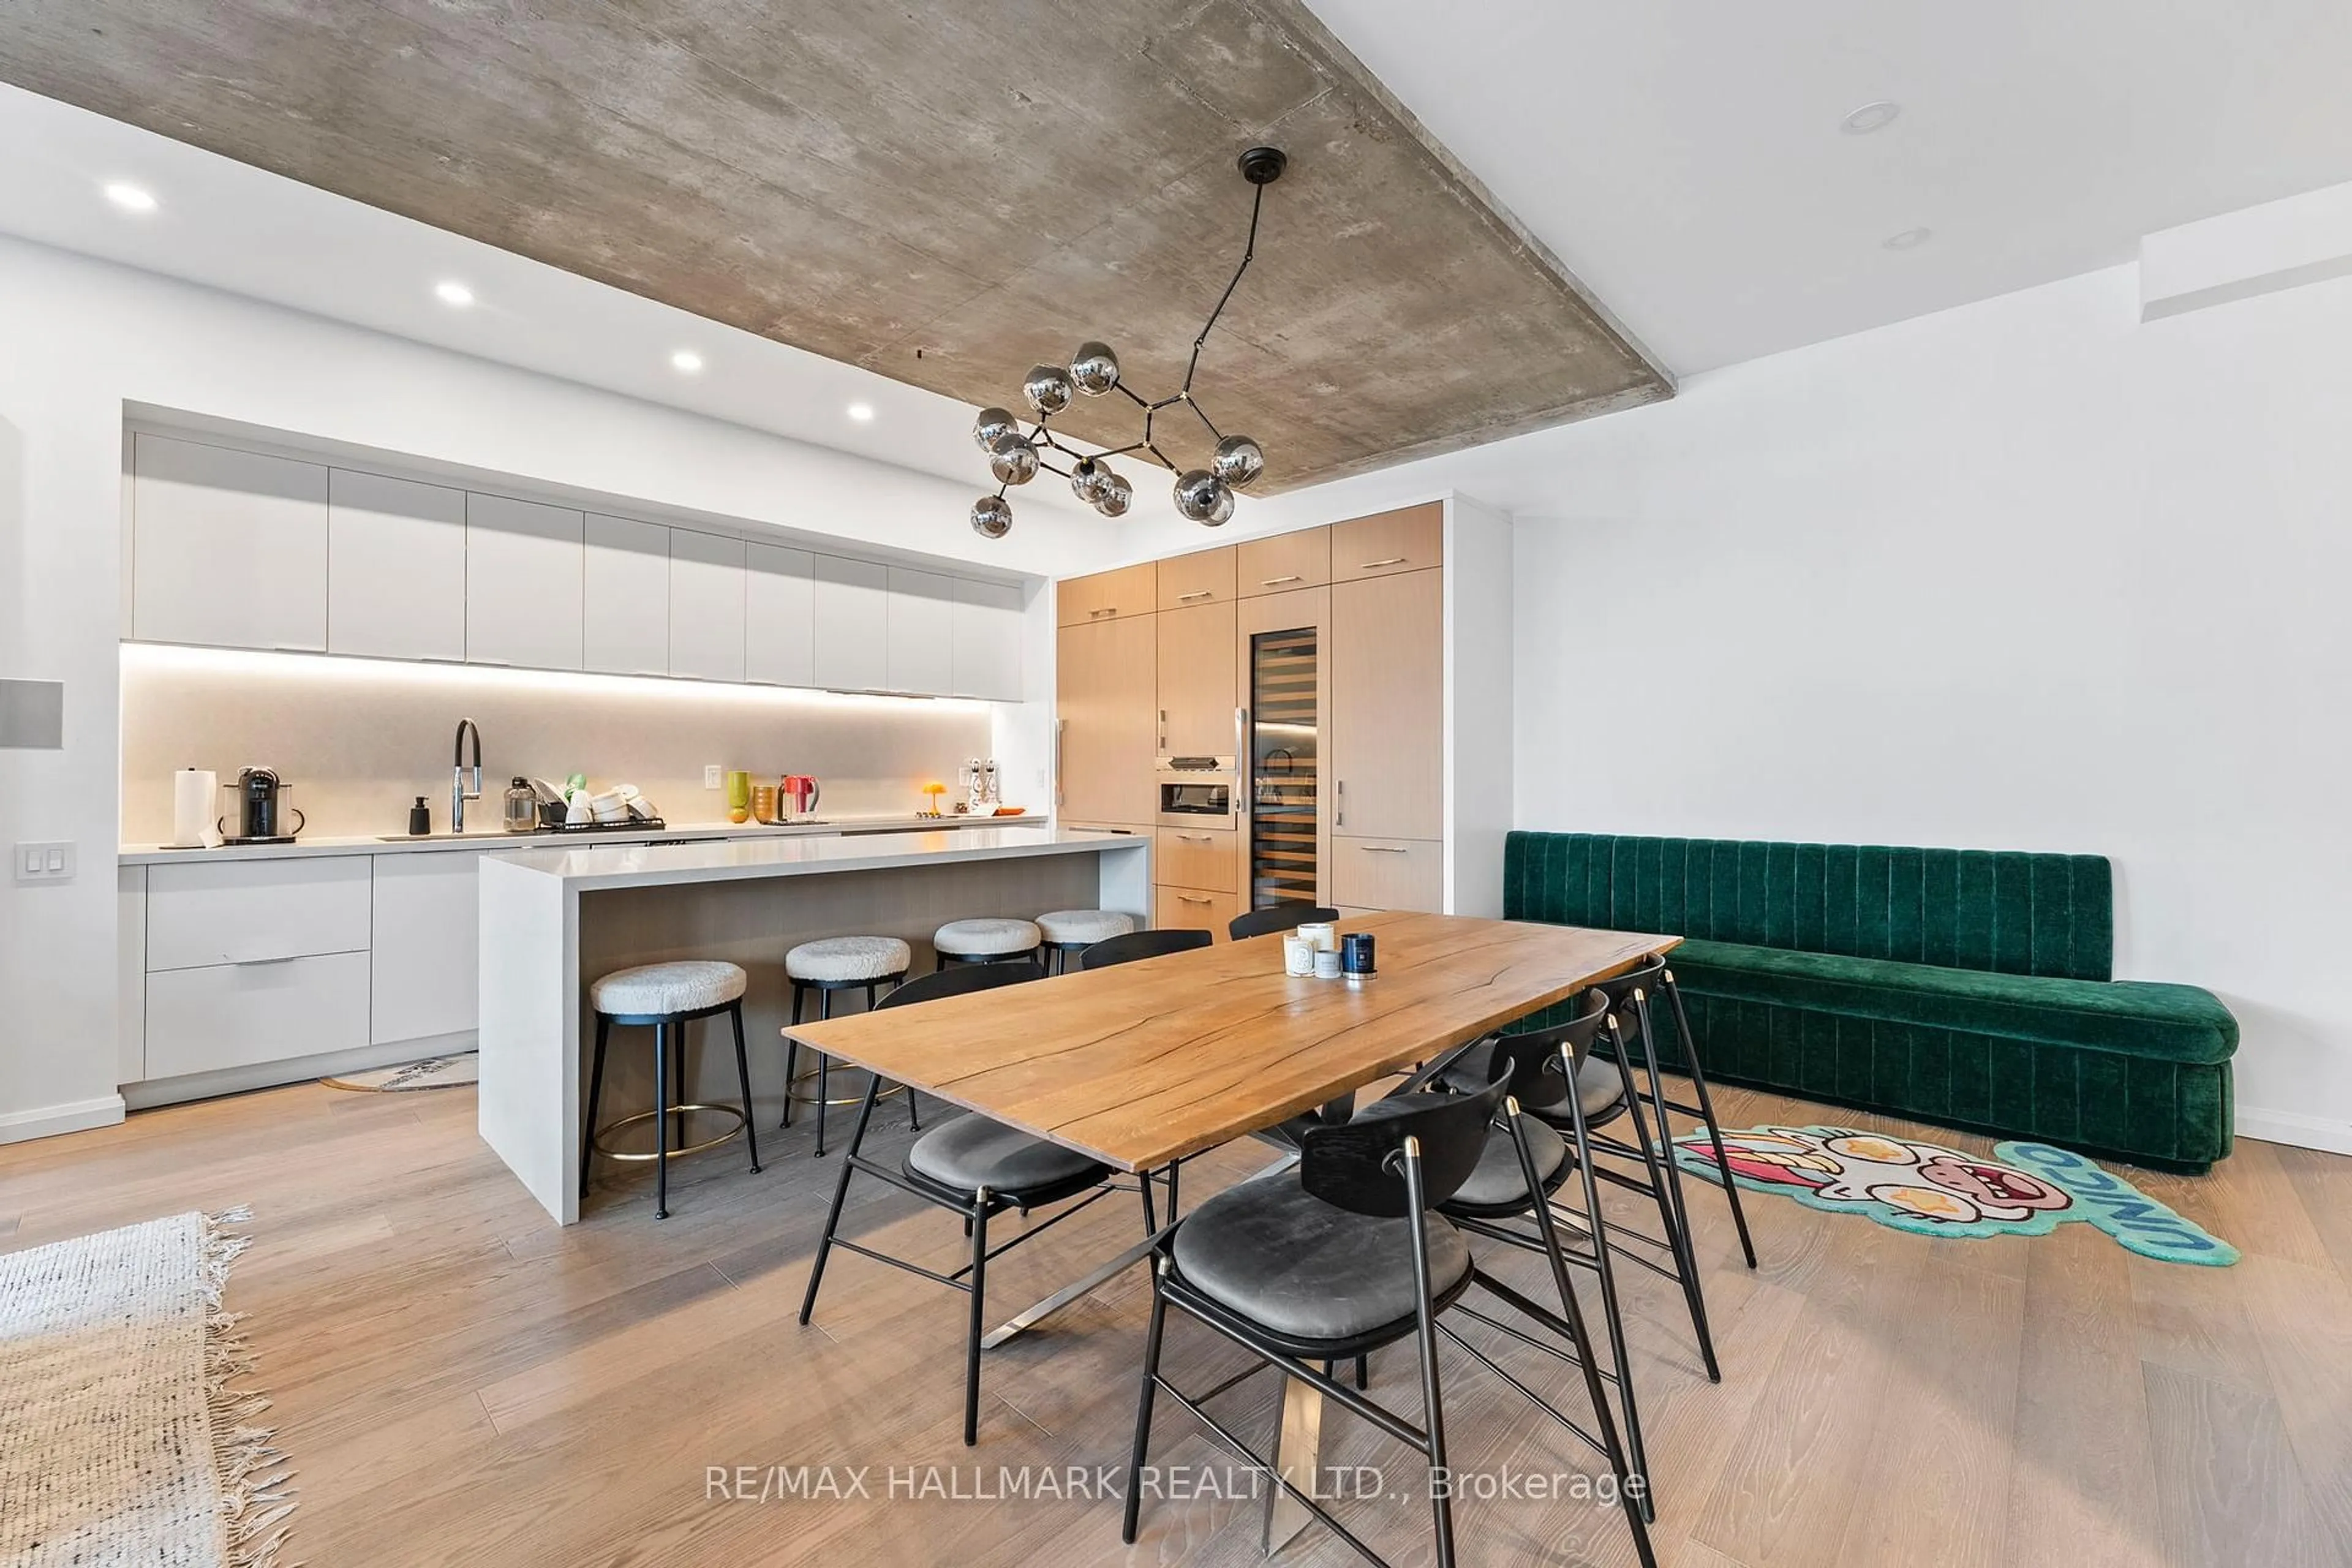
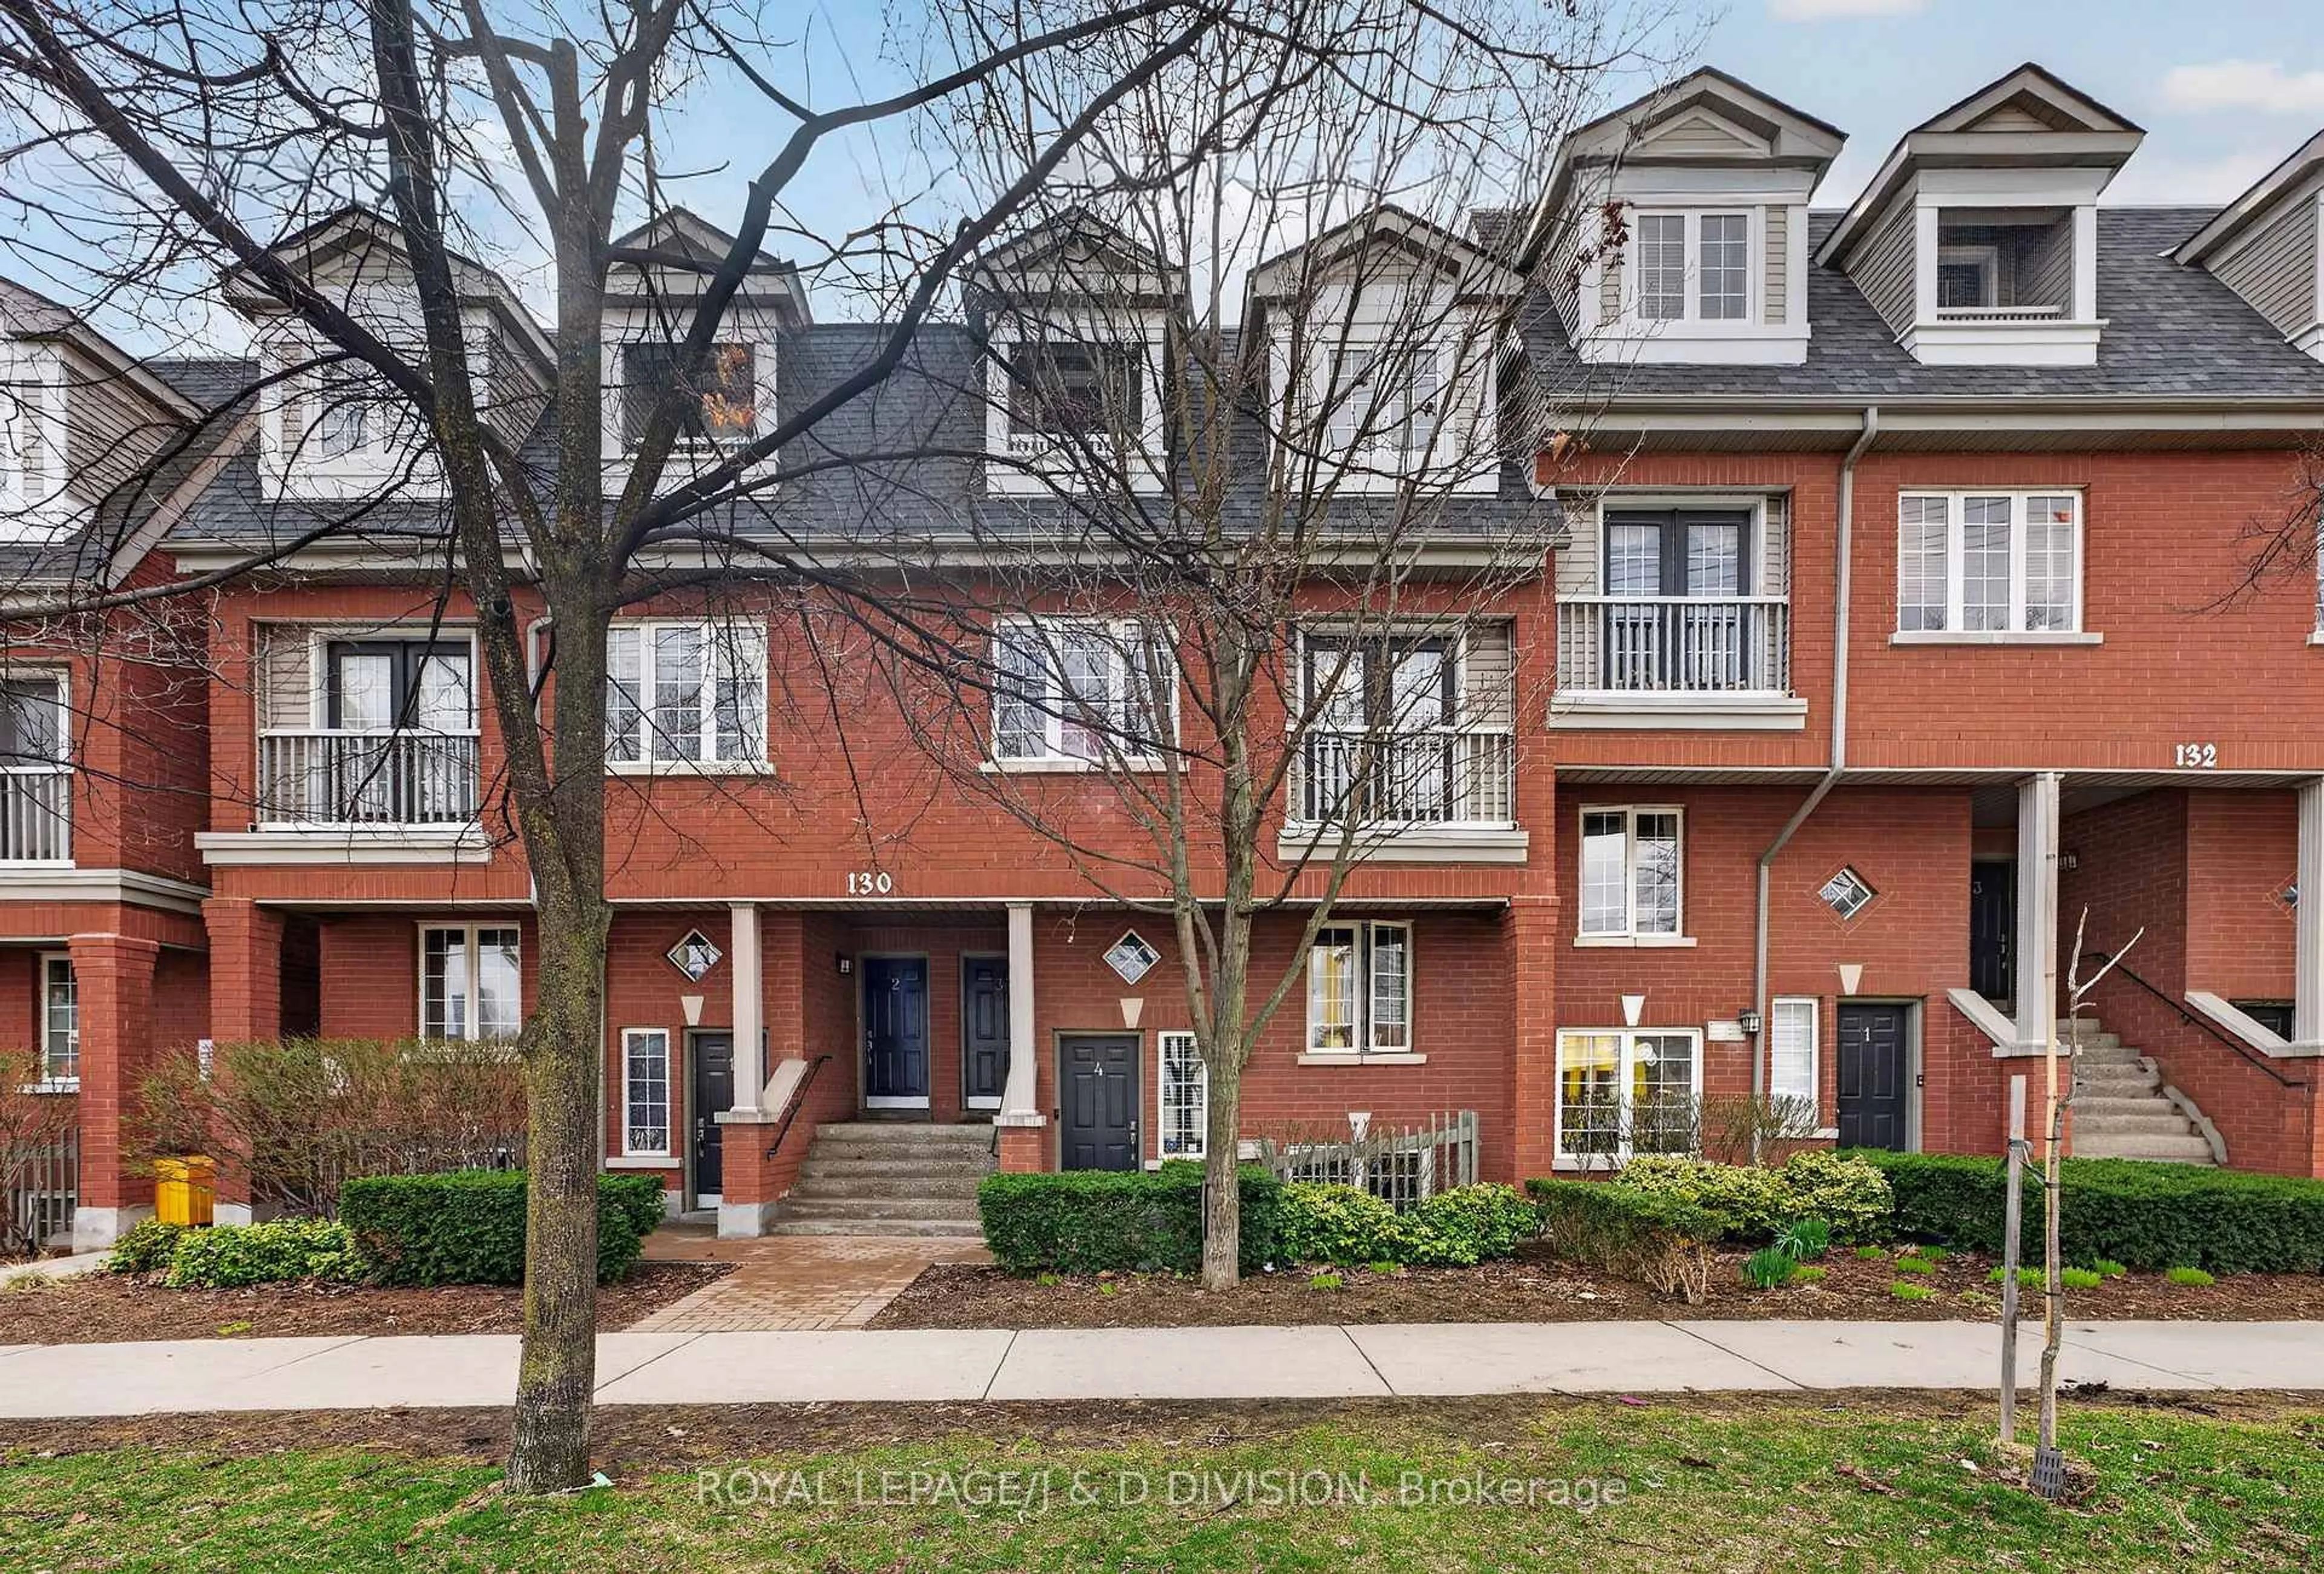
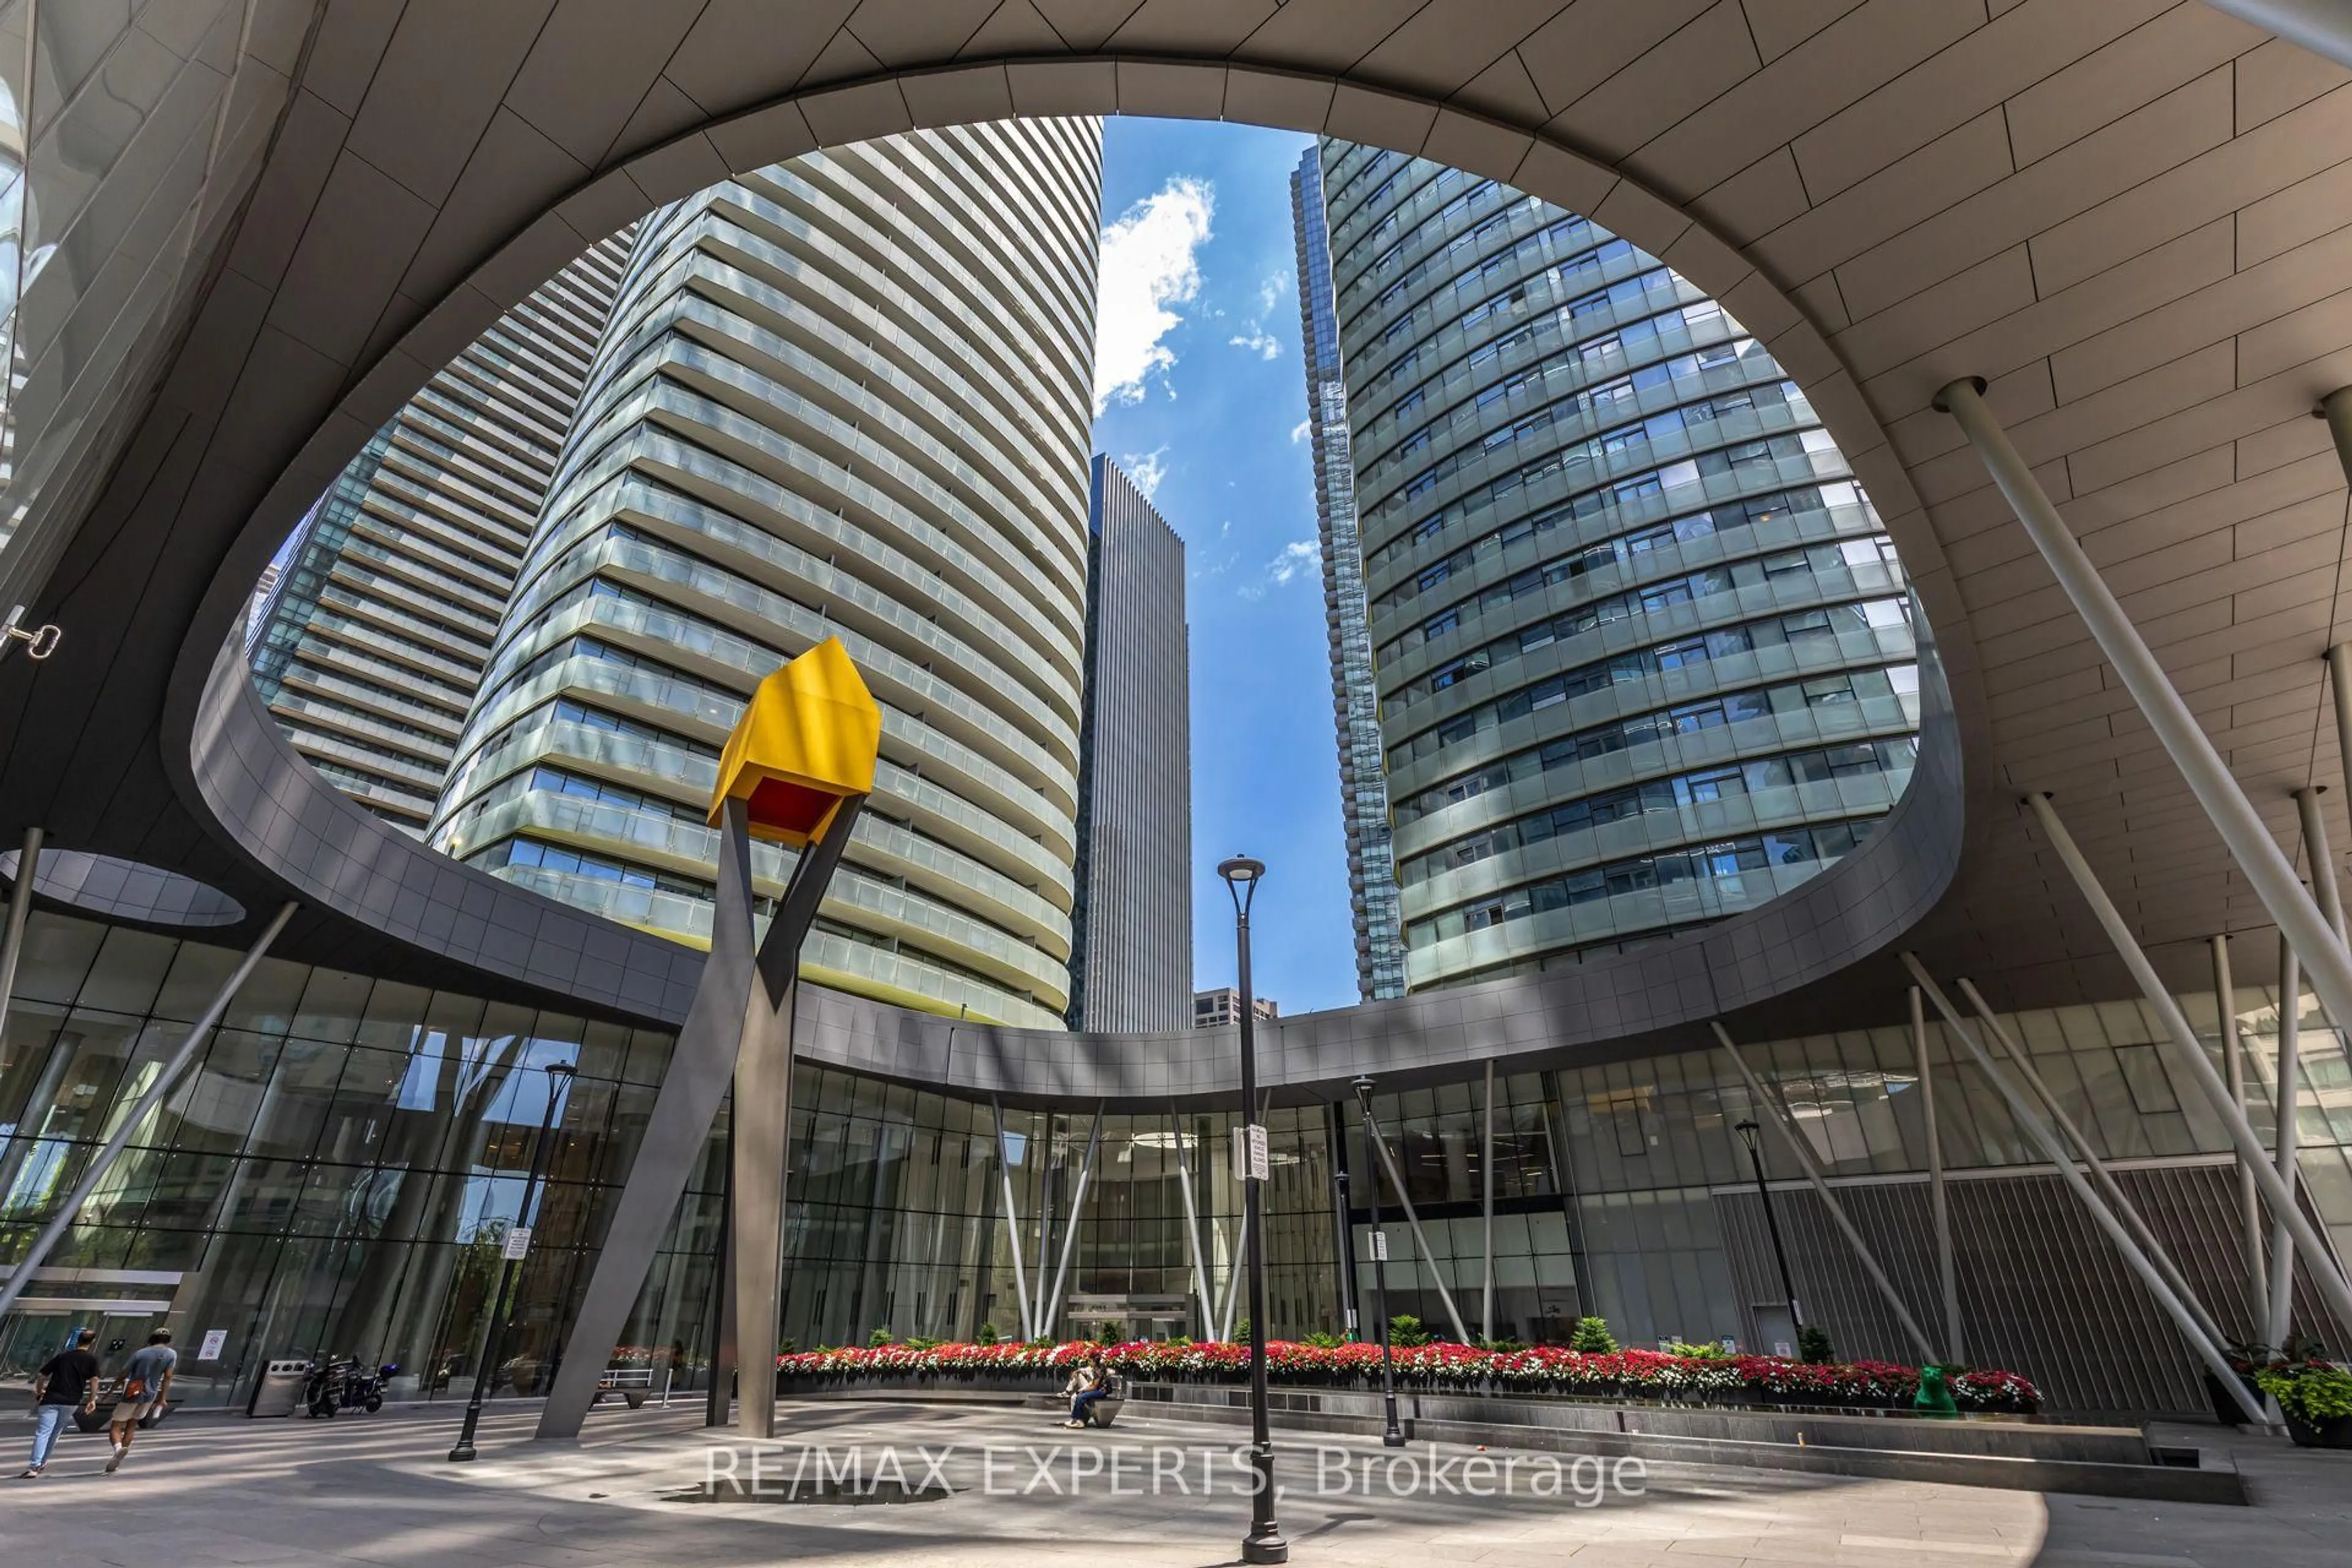
Experience elevated downtown living in this stunning southwest corner 3+1 Bedroom suite. Offering 1,091 sq. ft., this bright and spacious residence features three bedrooms, a versatile den, and floor-to-ceiling windows showcasing panoramic views of Lake Ontario, Toronto Harbour, and the city skyline. The open-concept kitchen features built-in appliances and custom finishes, while the expansive wraparound balcony provides exceptional outdoor space. Enjoy direct indoor access to the PATH and a prime location just steps from Union Station, Scotiabank Arena, the Financial District, and Love Park. Residents enjoy premium amenities, including a 24-hour concierge, indoor pool, fitness centre, and visitor parking. Includes one underground parking space and one owned locker. A must-see!
Property Details
Interior
Features
Ground Floor
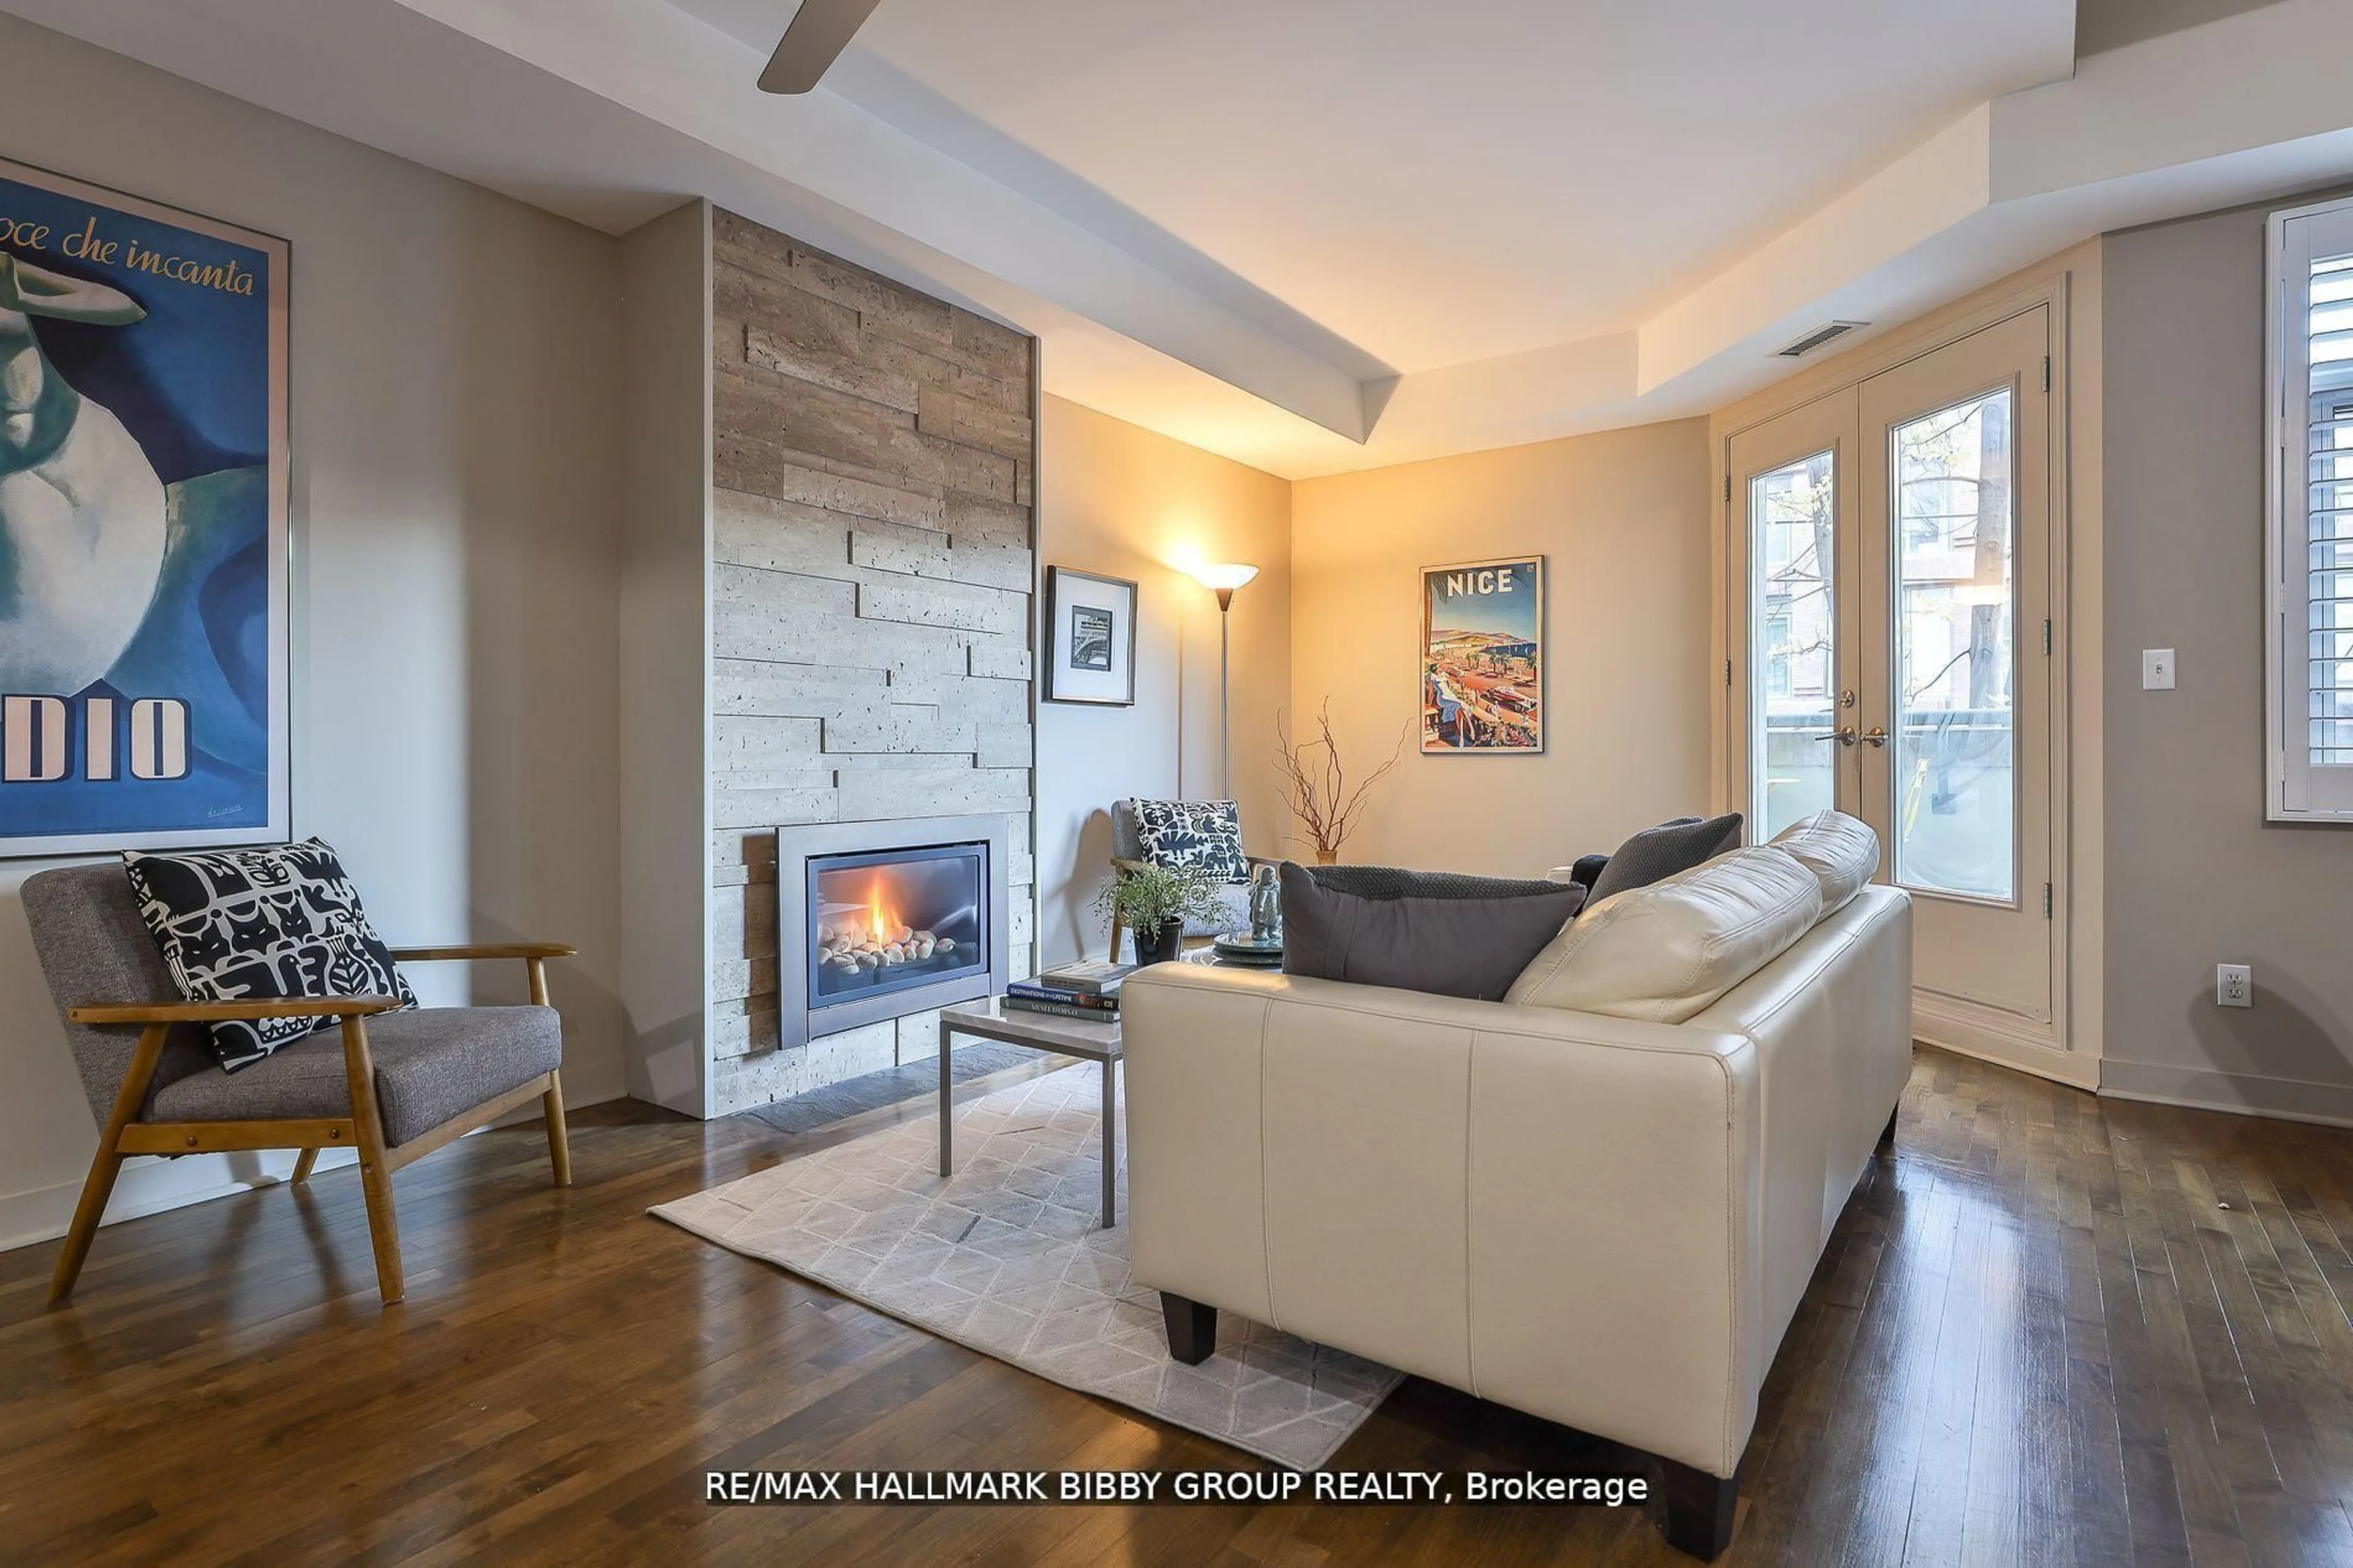
Living
3.65 x 3.35Open Concept / Combined W/Dining / Laminate
Dining
3.65 x 3.35Open Concept / Combined W/Kitchen / Window Flr to Ceil
Kitchen
2.75 x 2.45B/I Appliances / Granite Counter / Open Concept
Primary
3.35 x 3.054 Pc Ensuite / W/O To Balcony / Closet
Exterior
Features
Parking
Garage spaces 1
Garage type Underground
Other parking spaces 0
Total parking spaces 1
Condo Details
Amenities
Exercise Room, Indoor Pool, Party/Meeting Room, Visitor Parking, Concierge, Sauna
Inclusions
Property History
 27
27