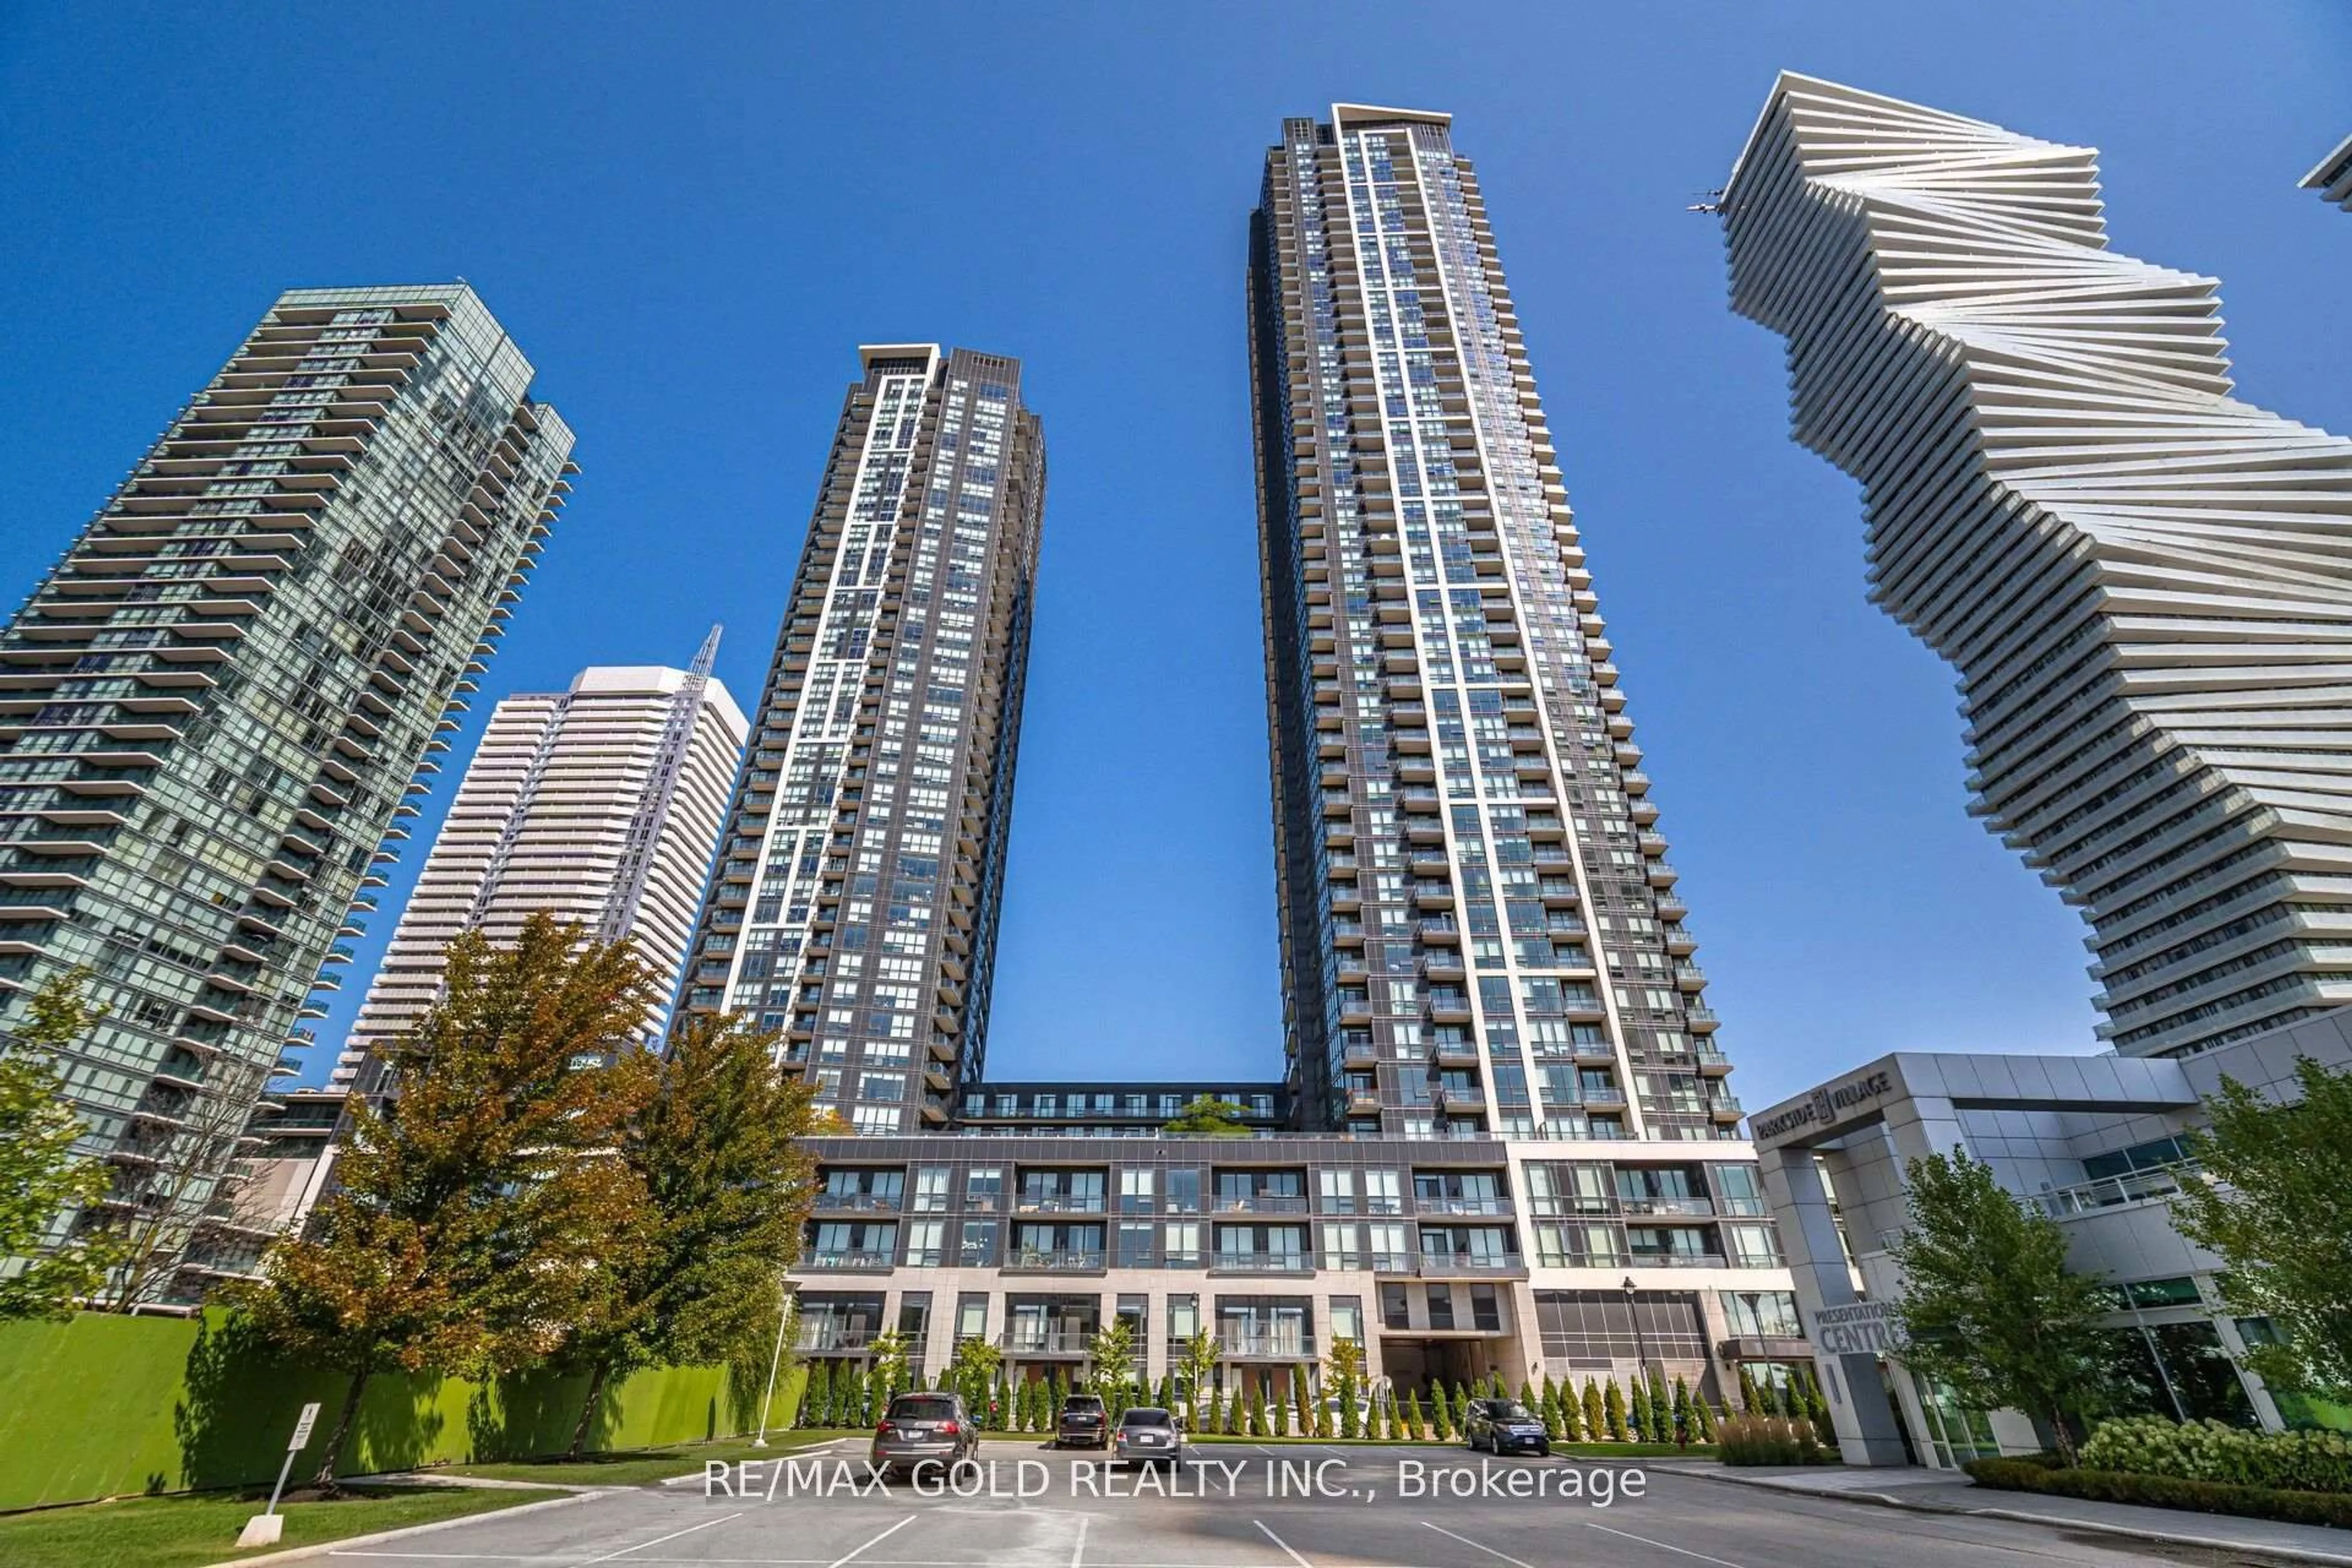
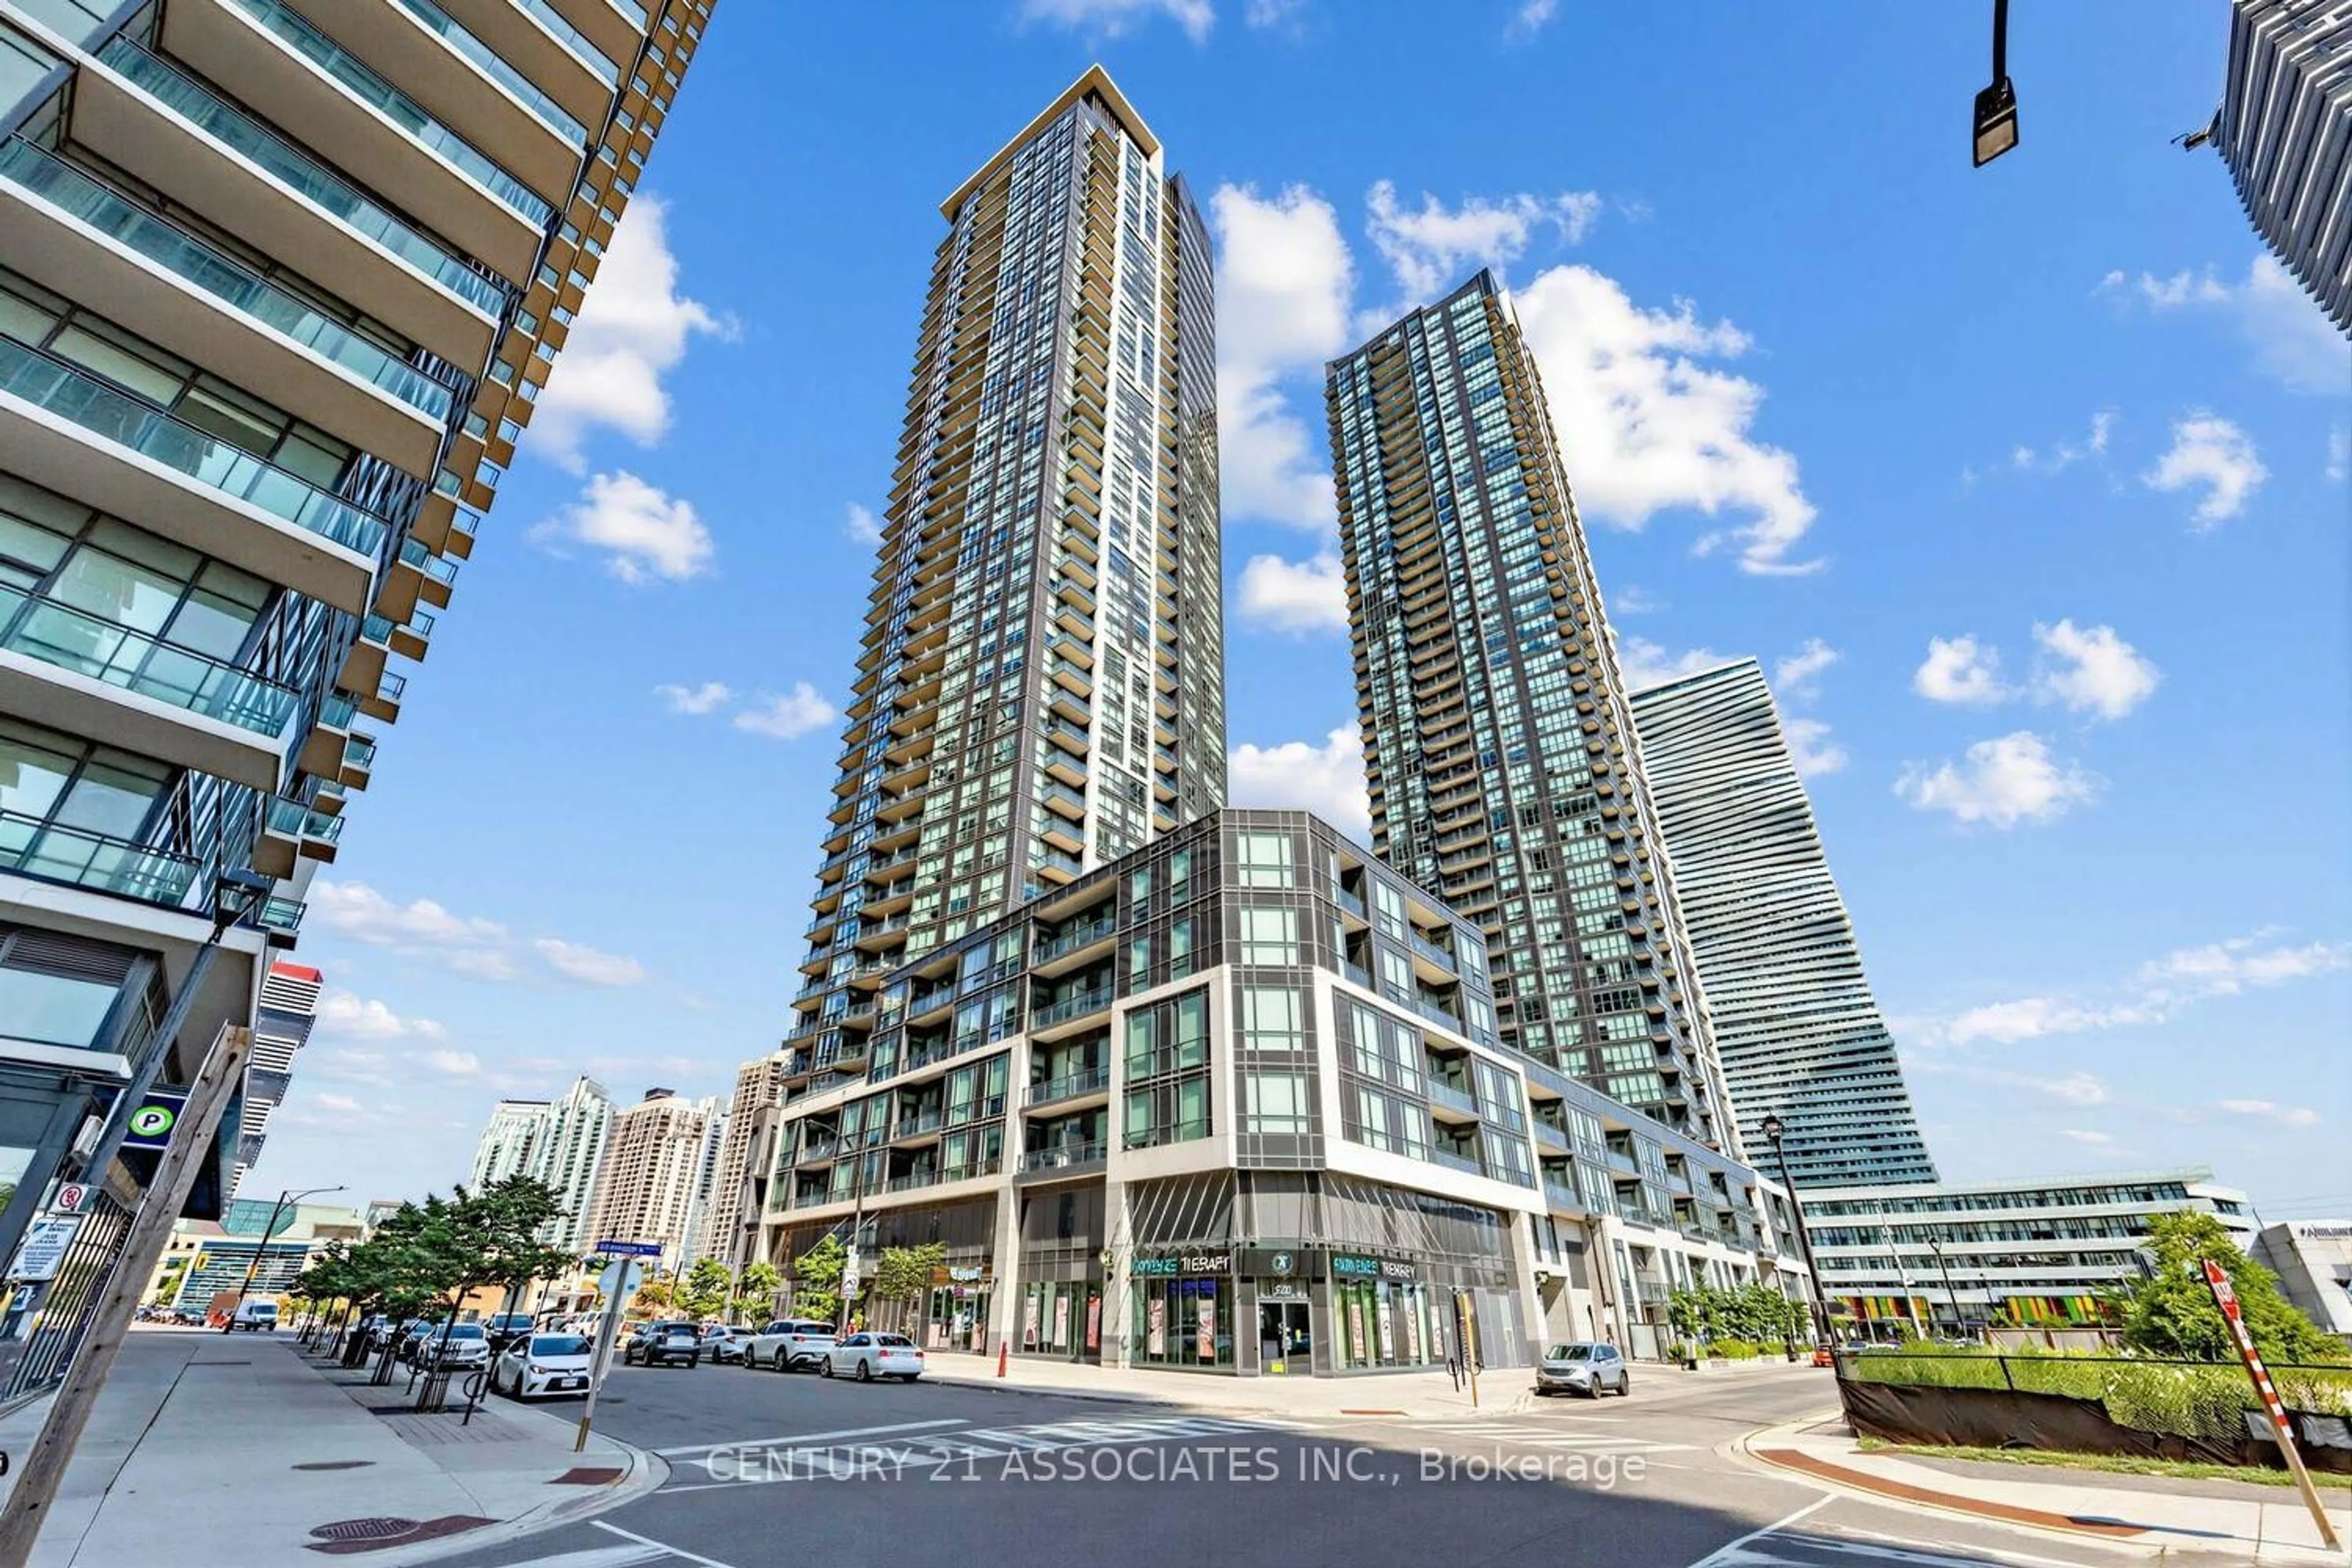
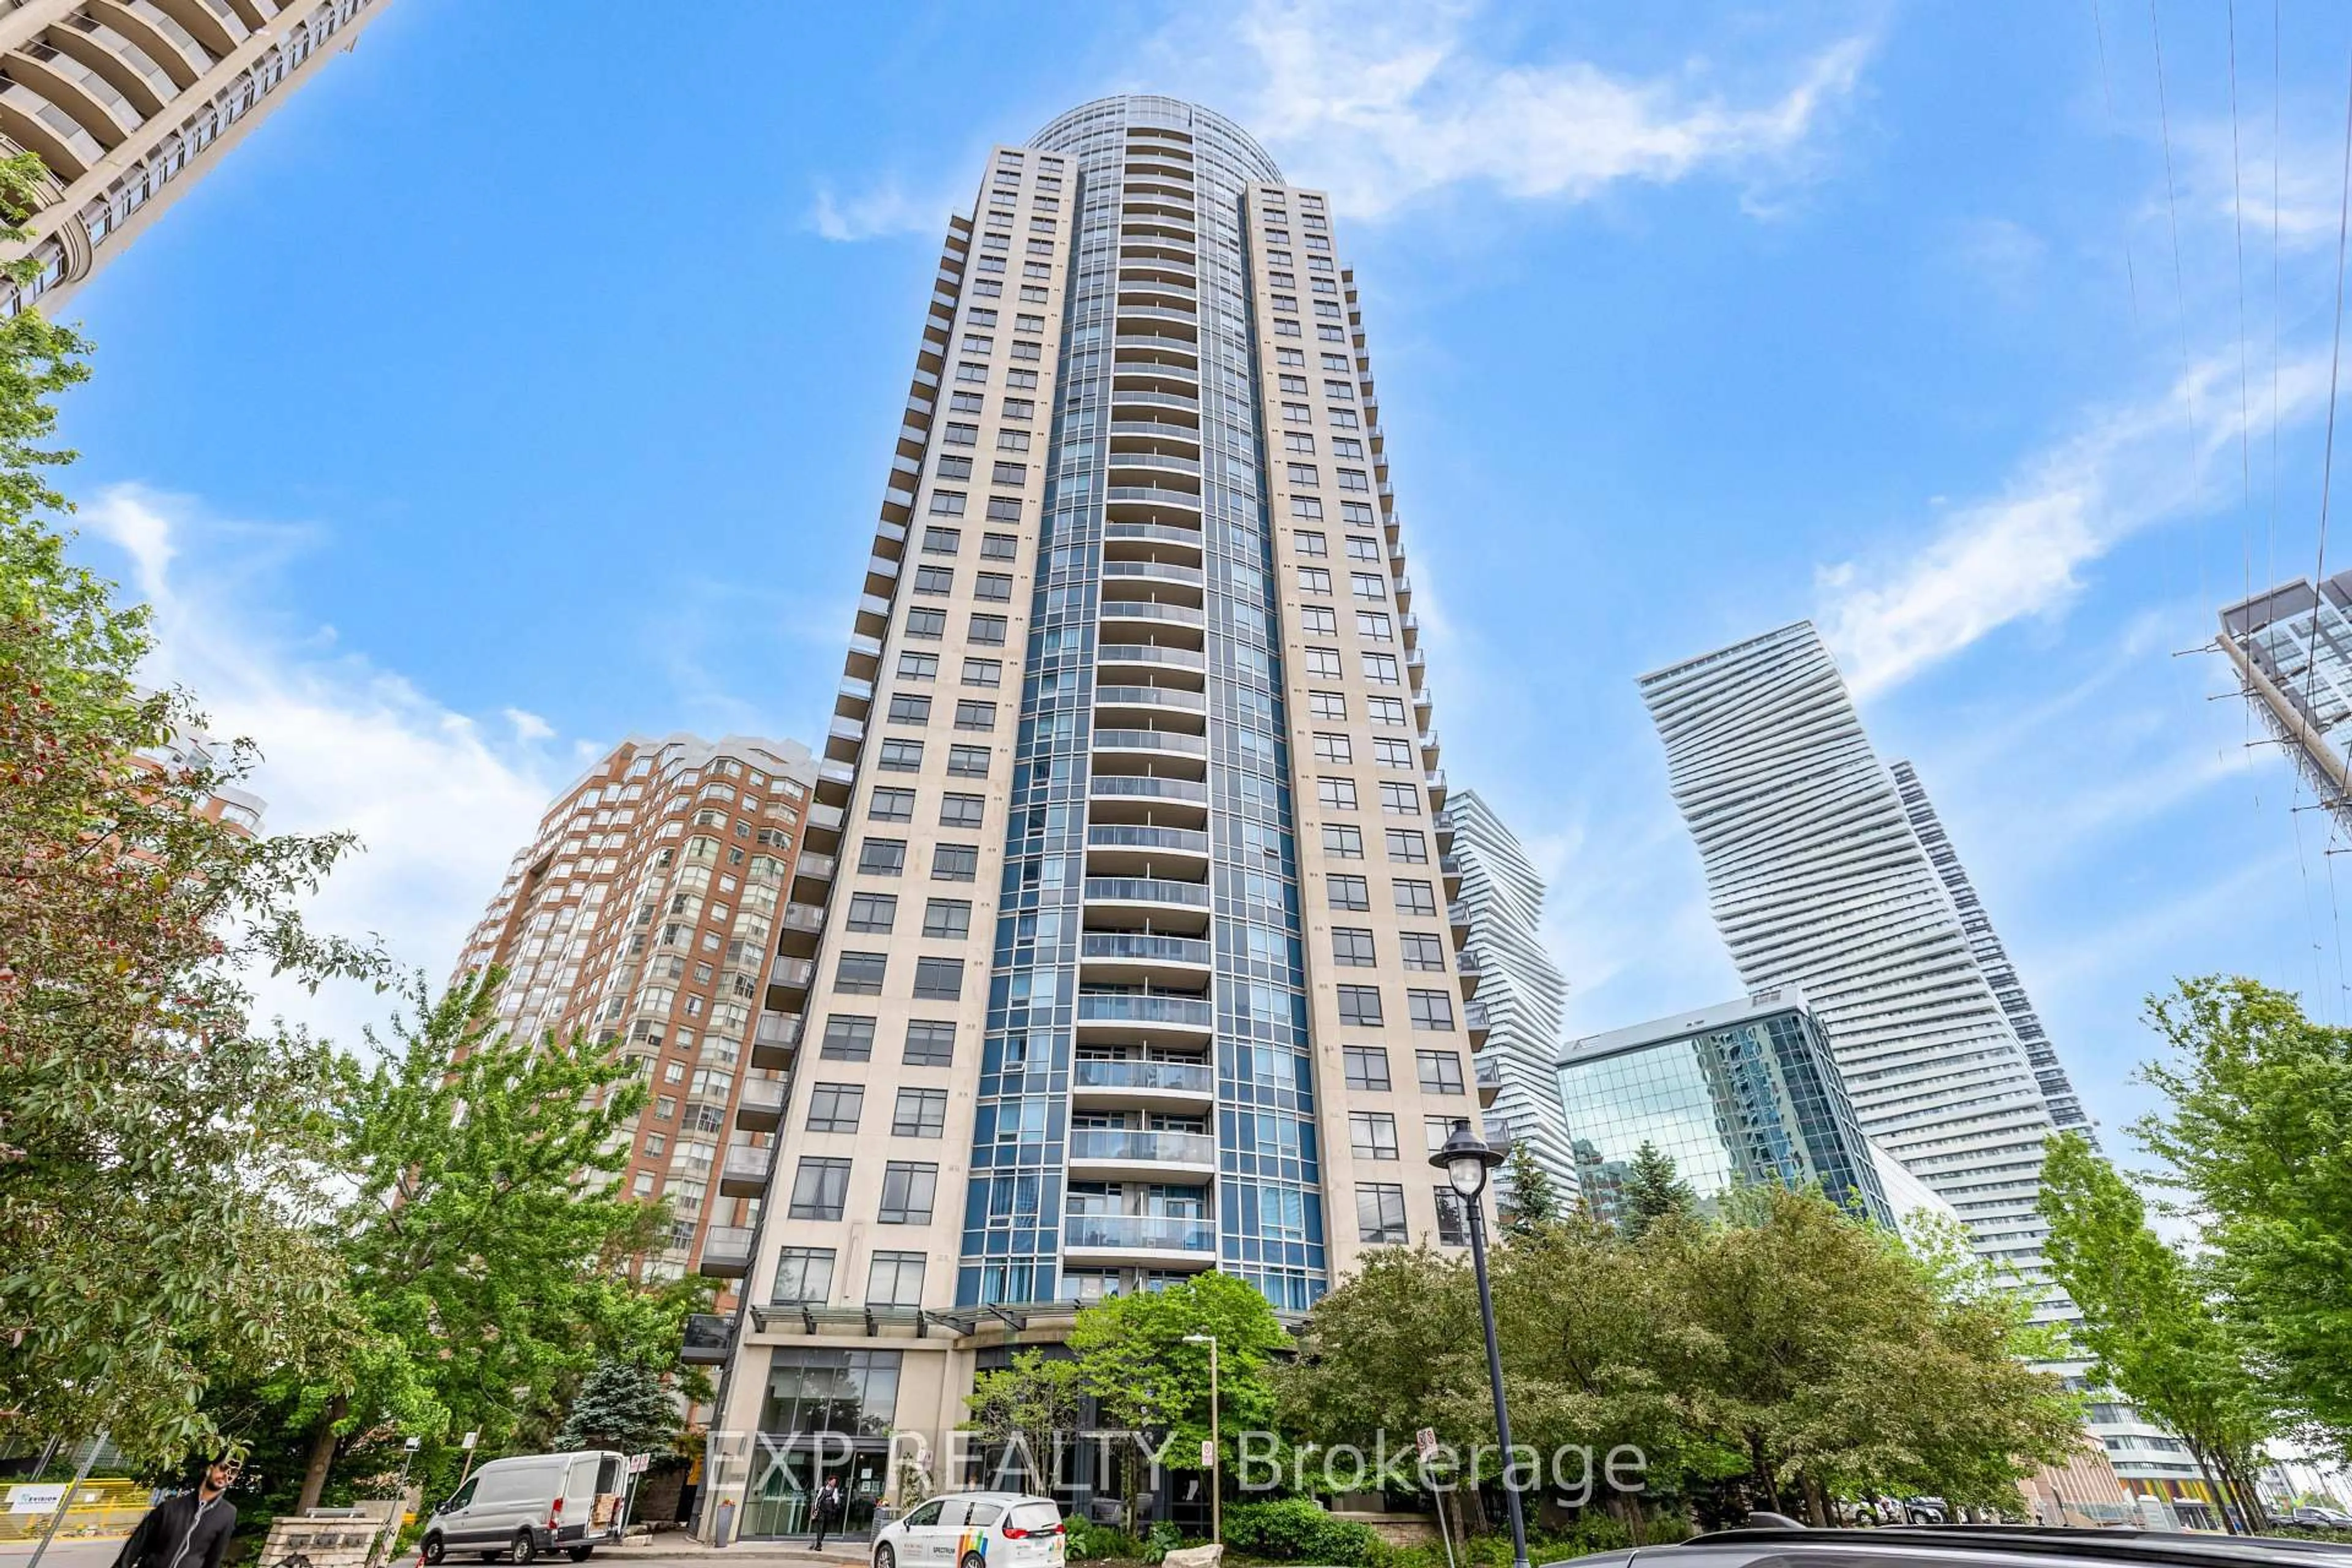
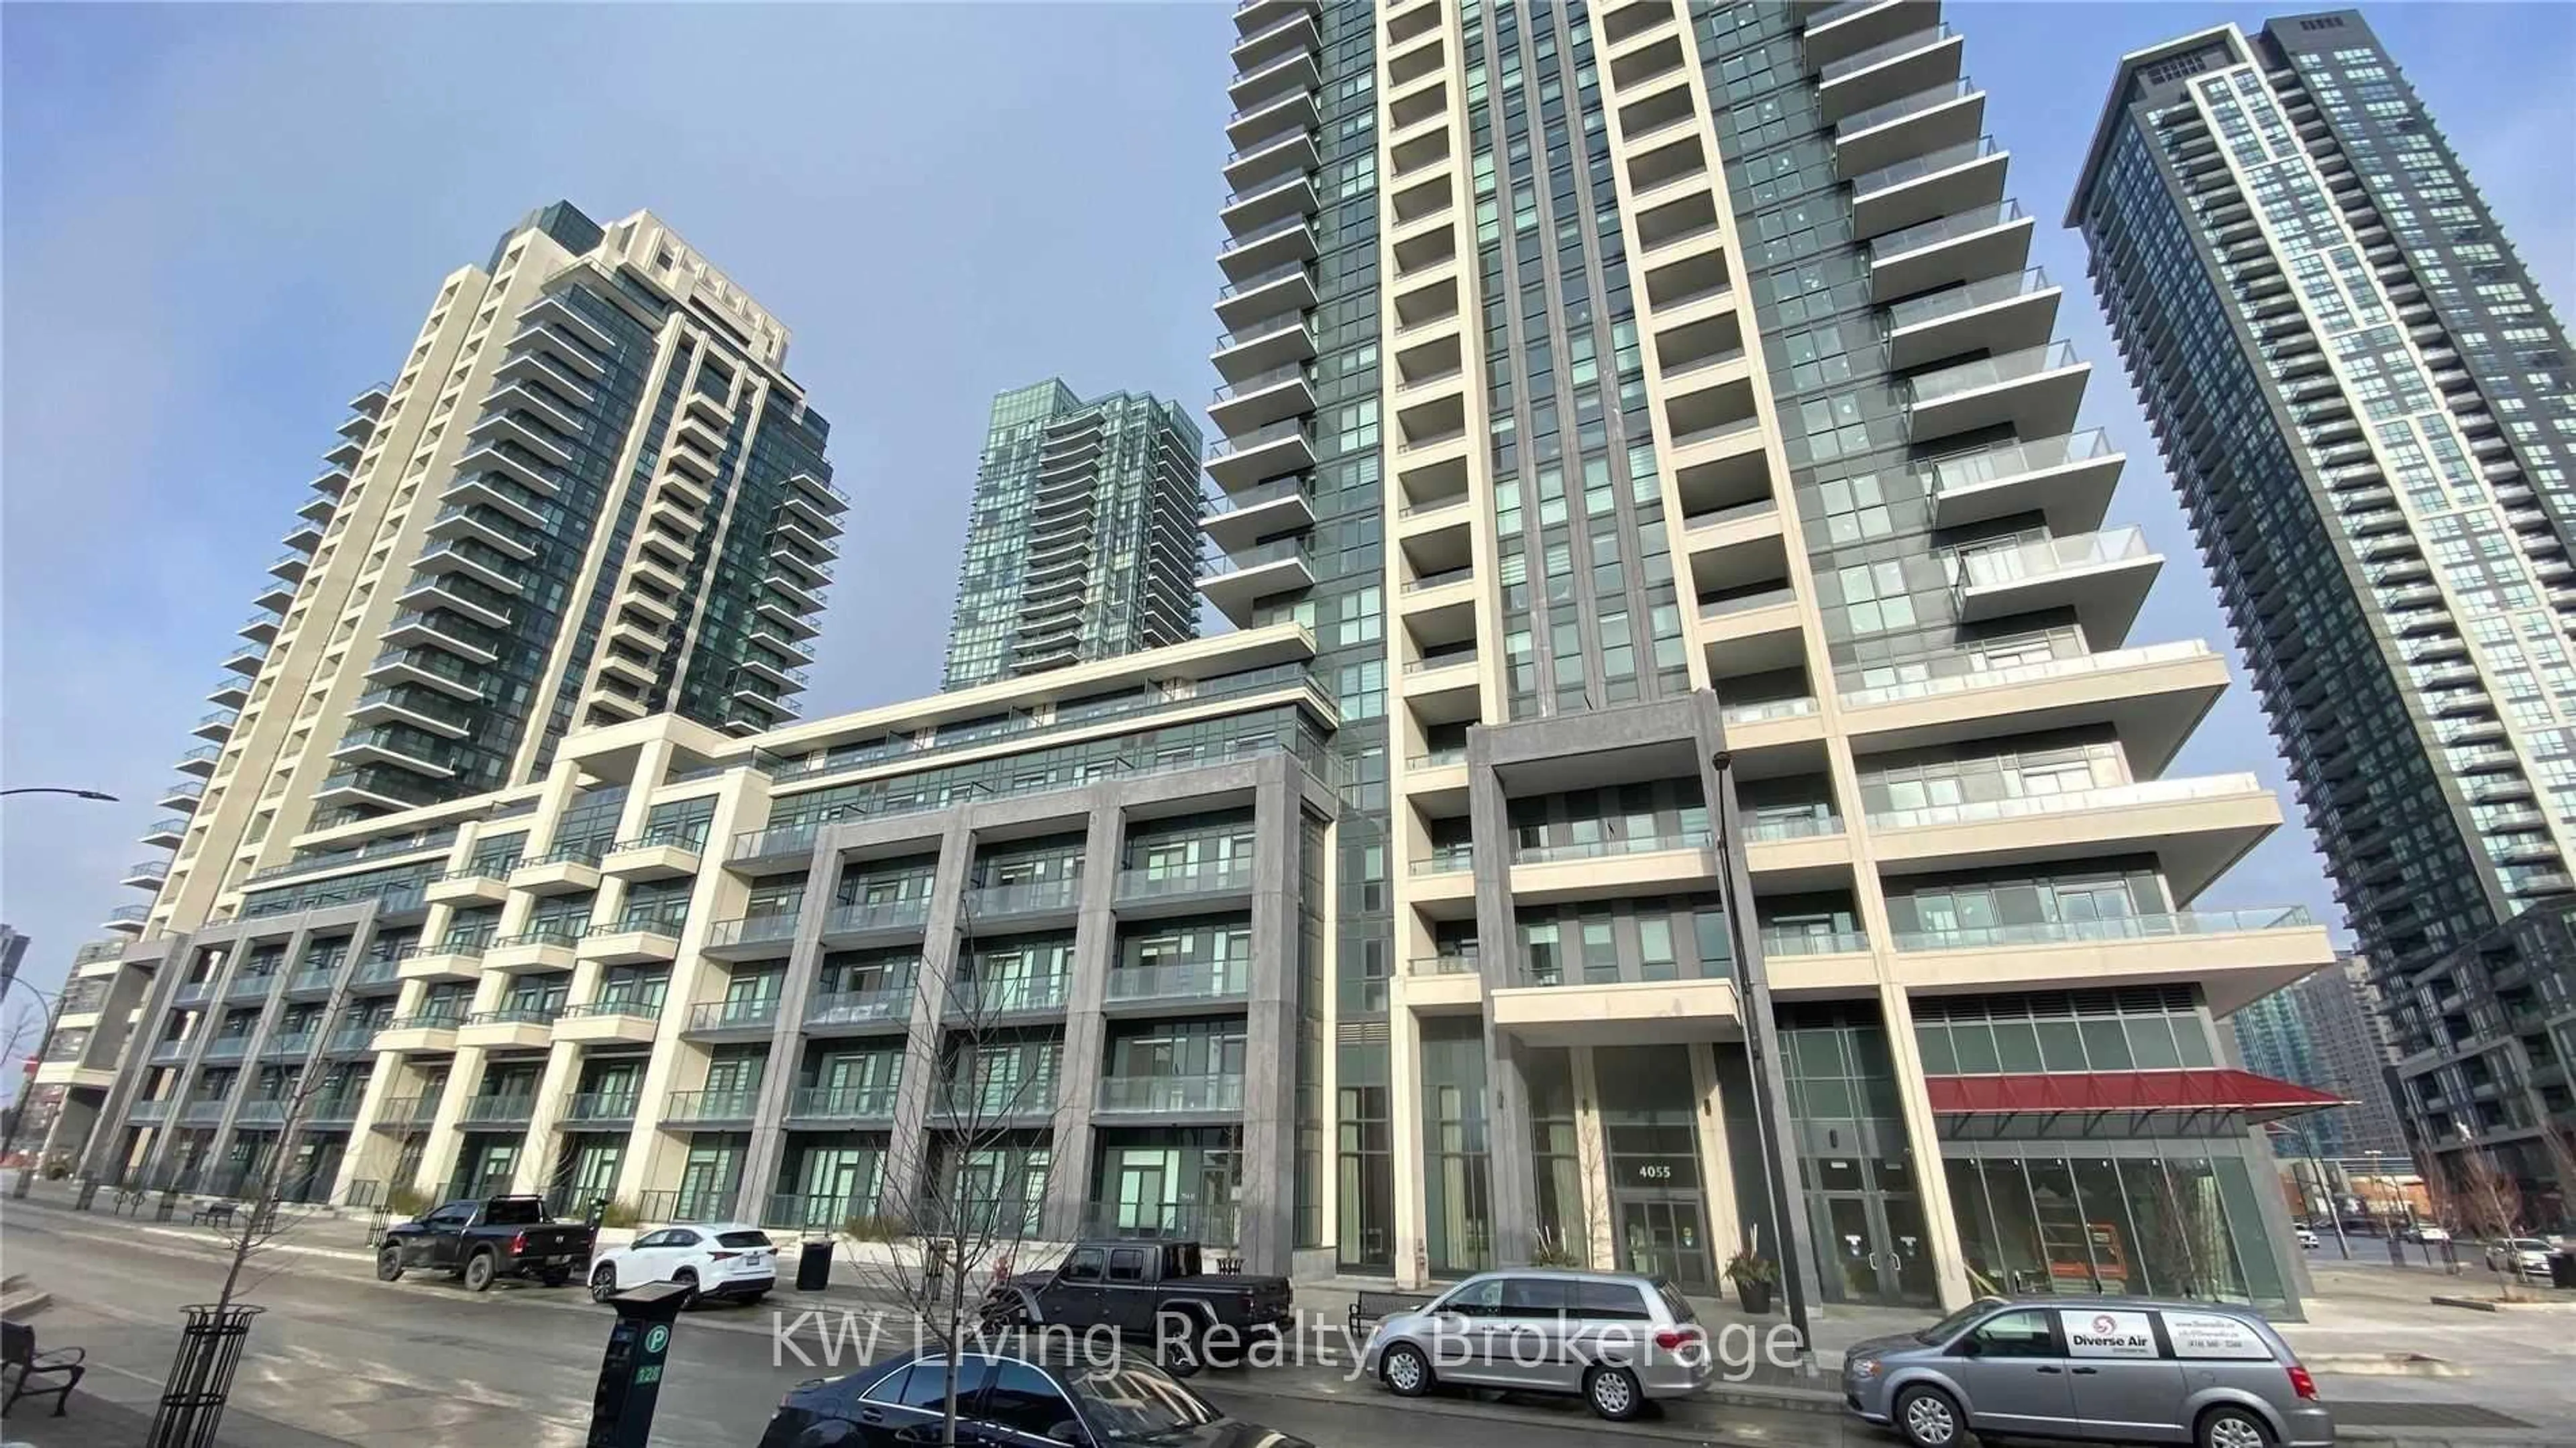
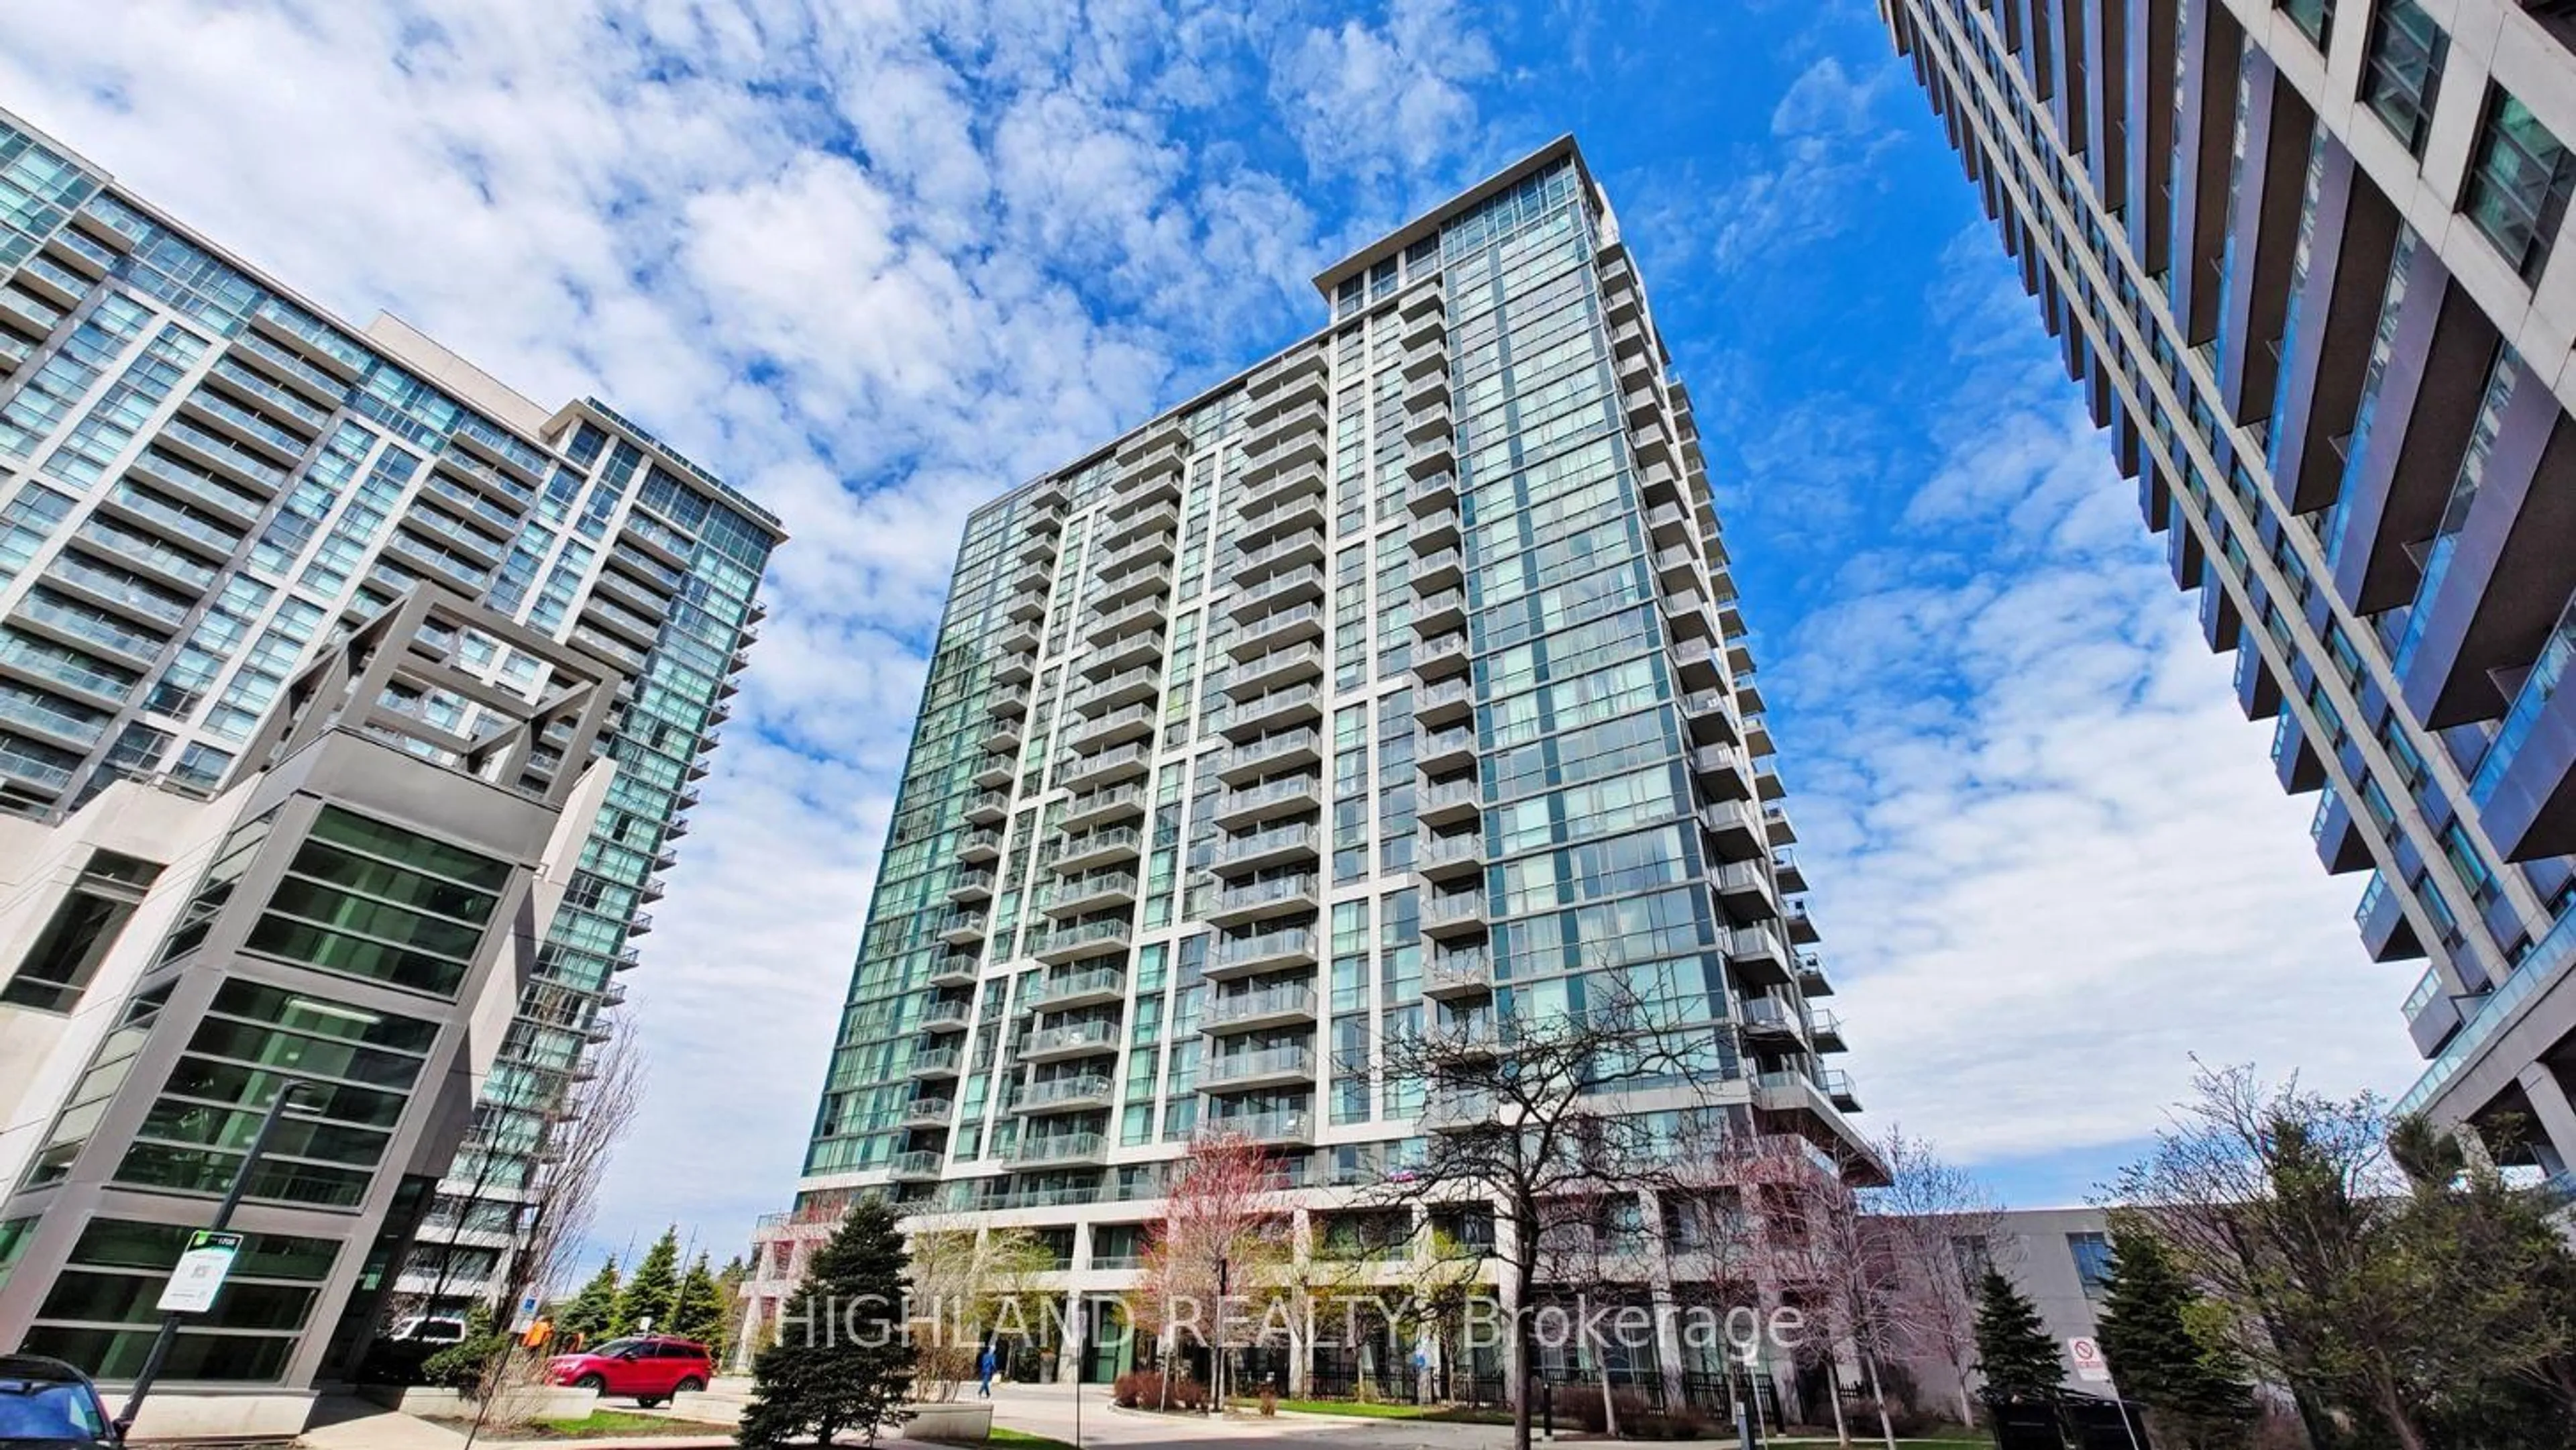
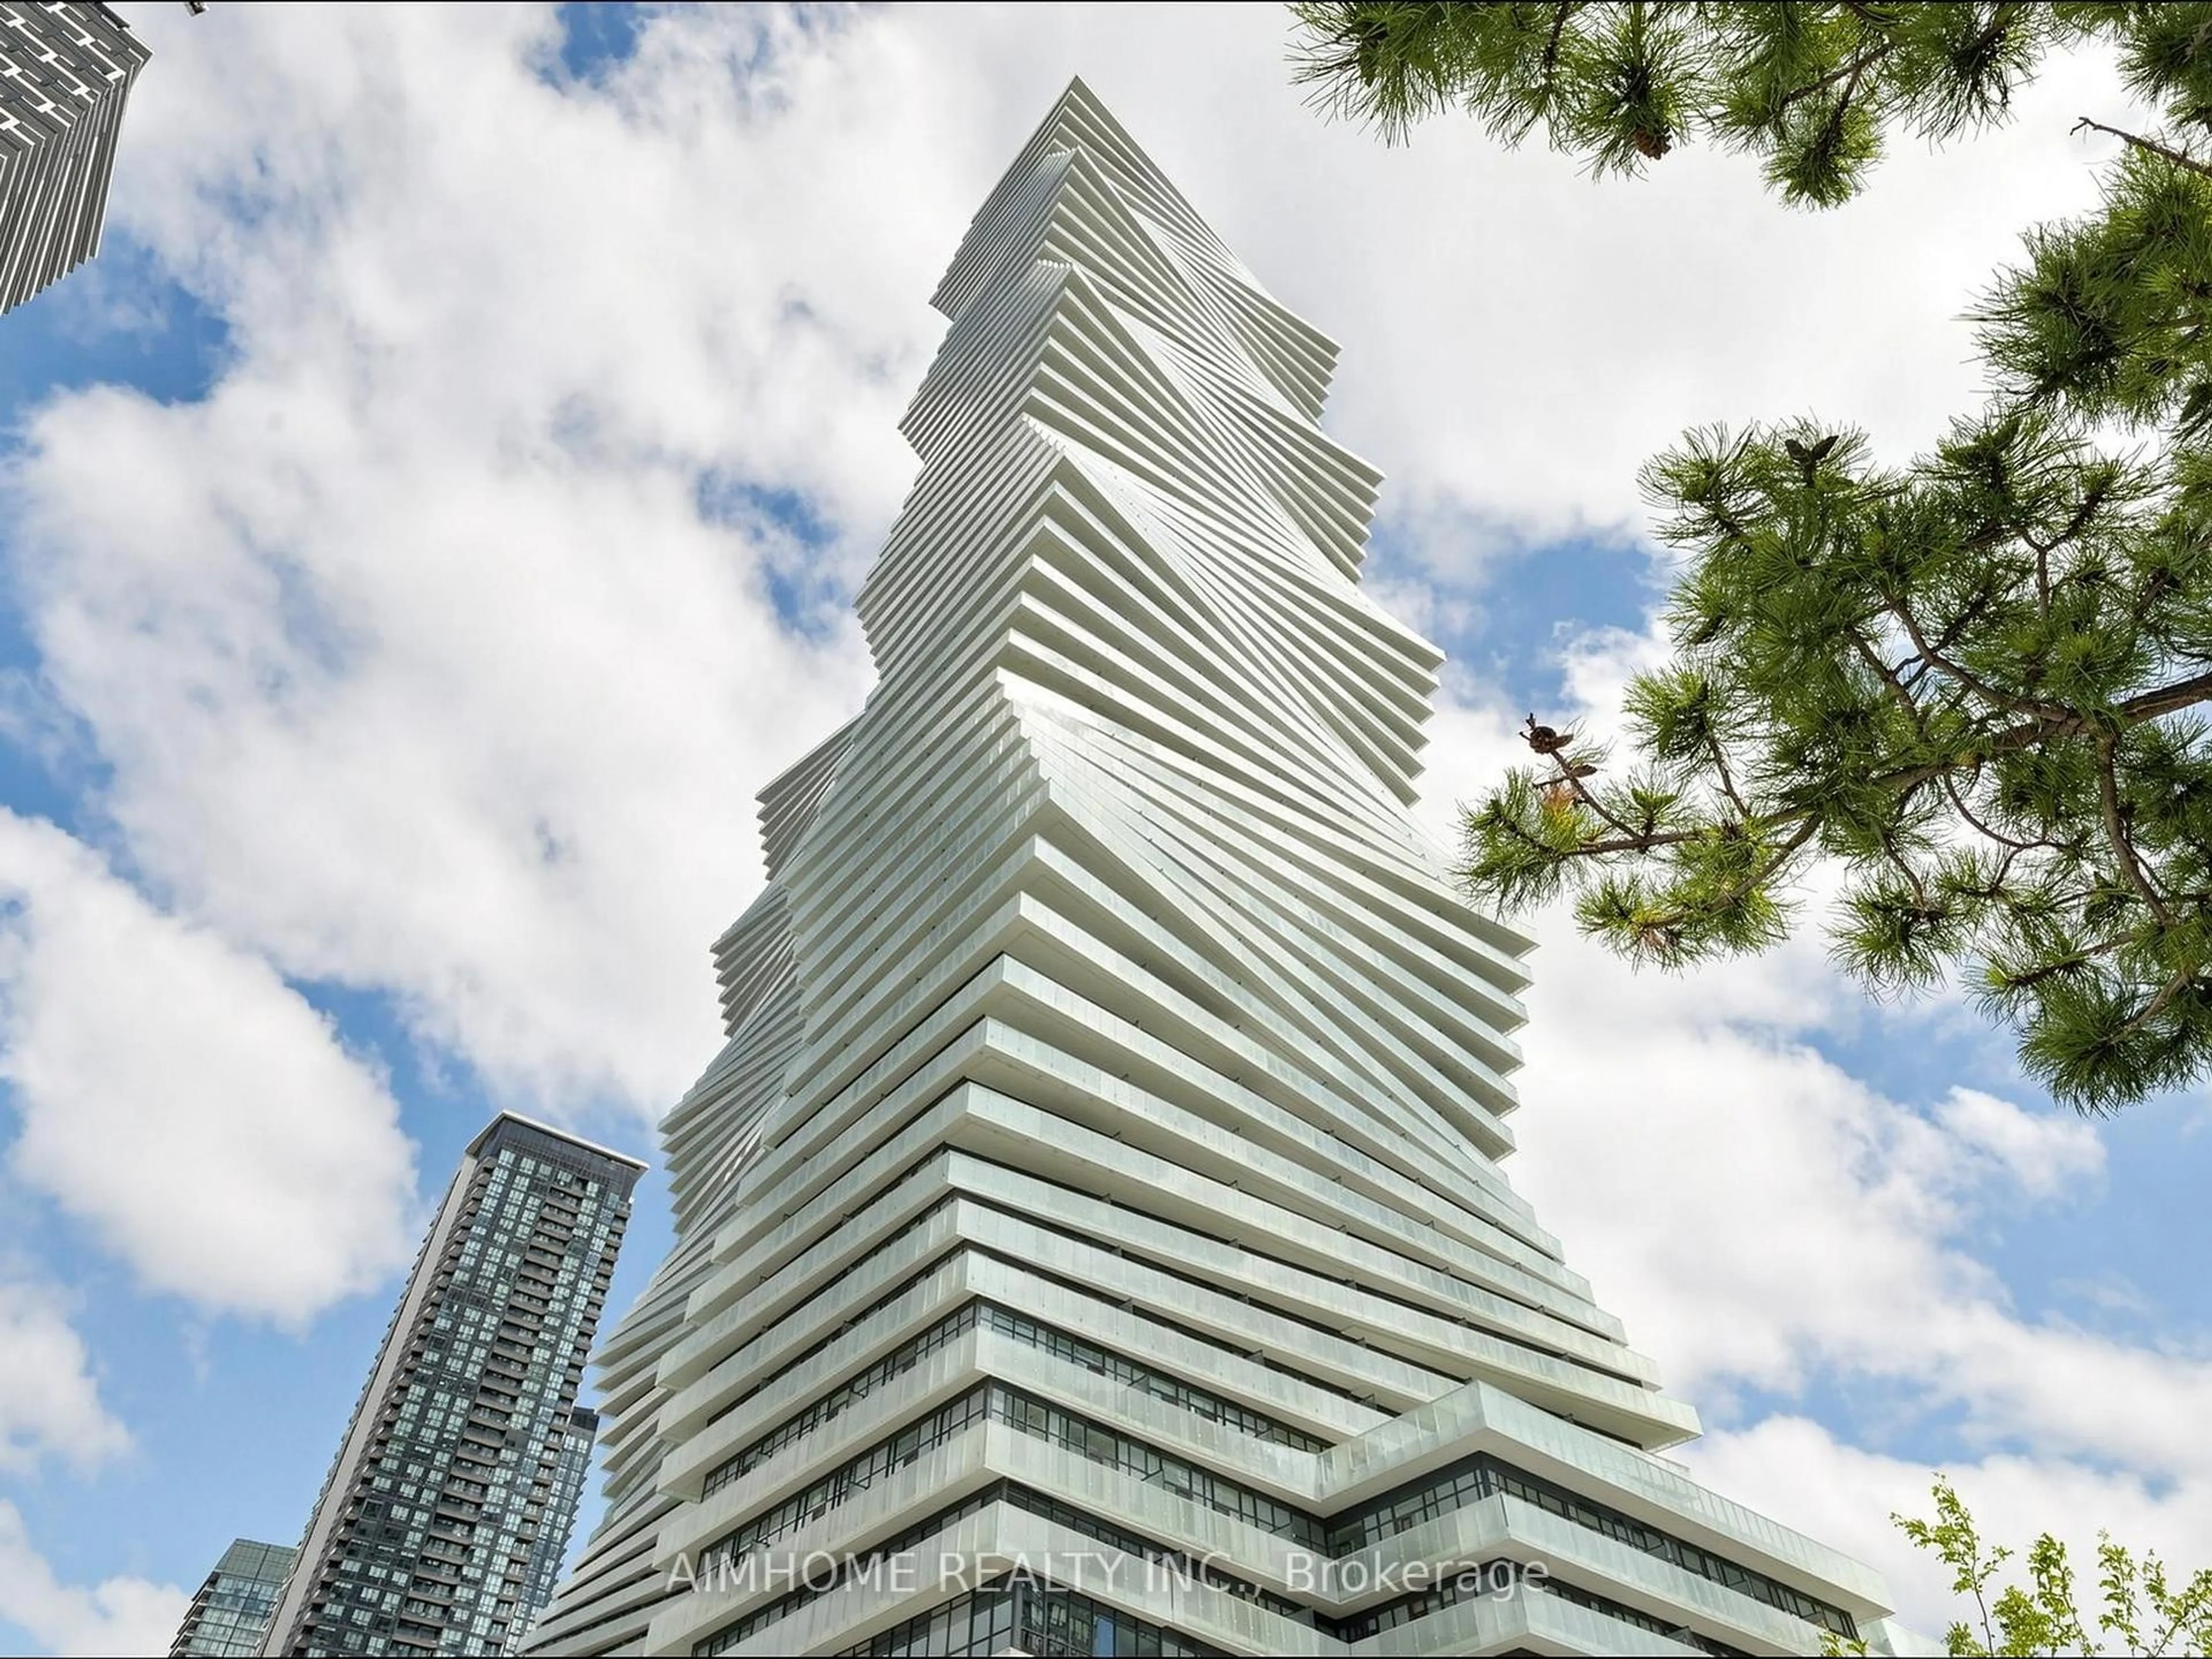
Core Mississauga Housing Market Report
All types - for the month of July
11
38
Total Active Listings*
367 active
New
171(-26.29% YoY)
Relisted
4(-73.33% YoY)
Compared to number of active, same period, in 2025: 480, in 2024: 348, in 2023: 214
Total Sold Listings*
33 sold
Median Sold Price
$490,000
Avg Days on Market
38 days
Median Bidding
-$17,900
Compared to number of sold, same period, in 2025: 71, in 2024: 56, in 2023: 53
*Data is for the month of July
Median Sold Price vs Average Days and Average Total Days on Market - Core Mississauga - All types
Sold vs Active vs New vs Relisted - Core Mississauga - All types
Sold Price Distribution - Core Mississauga - All types
Sold price distribution per the last 3 months's sold listings.
Property Type Distribution - Core Mississauga - All types
Property type distribution based on data from the last 3 months.
Median Price - Core Mississauga - All types
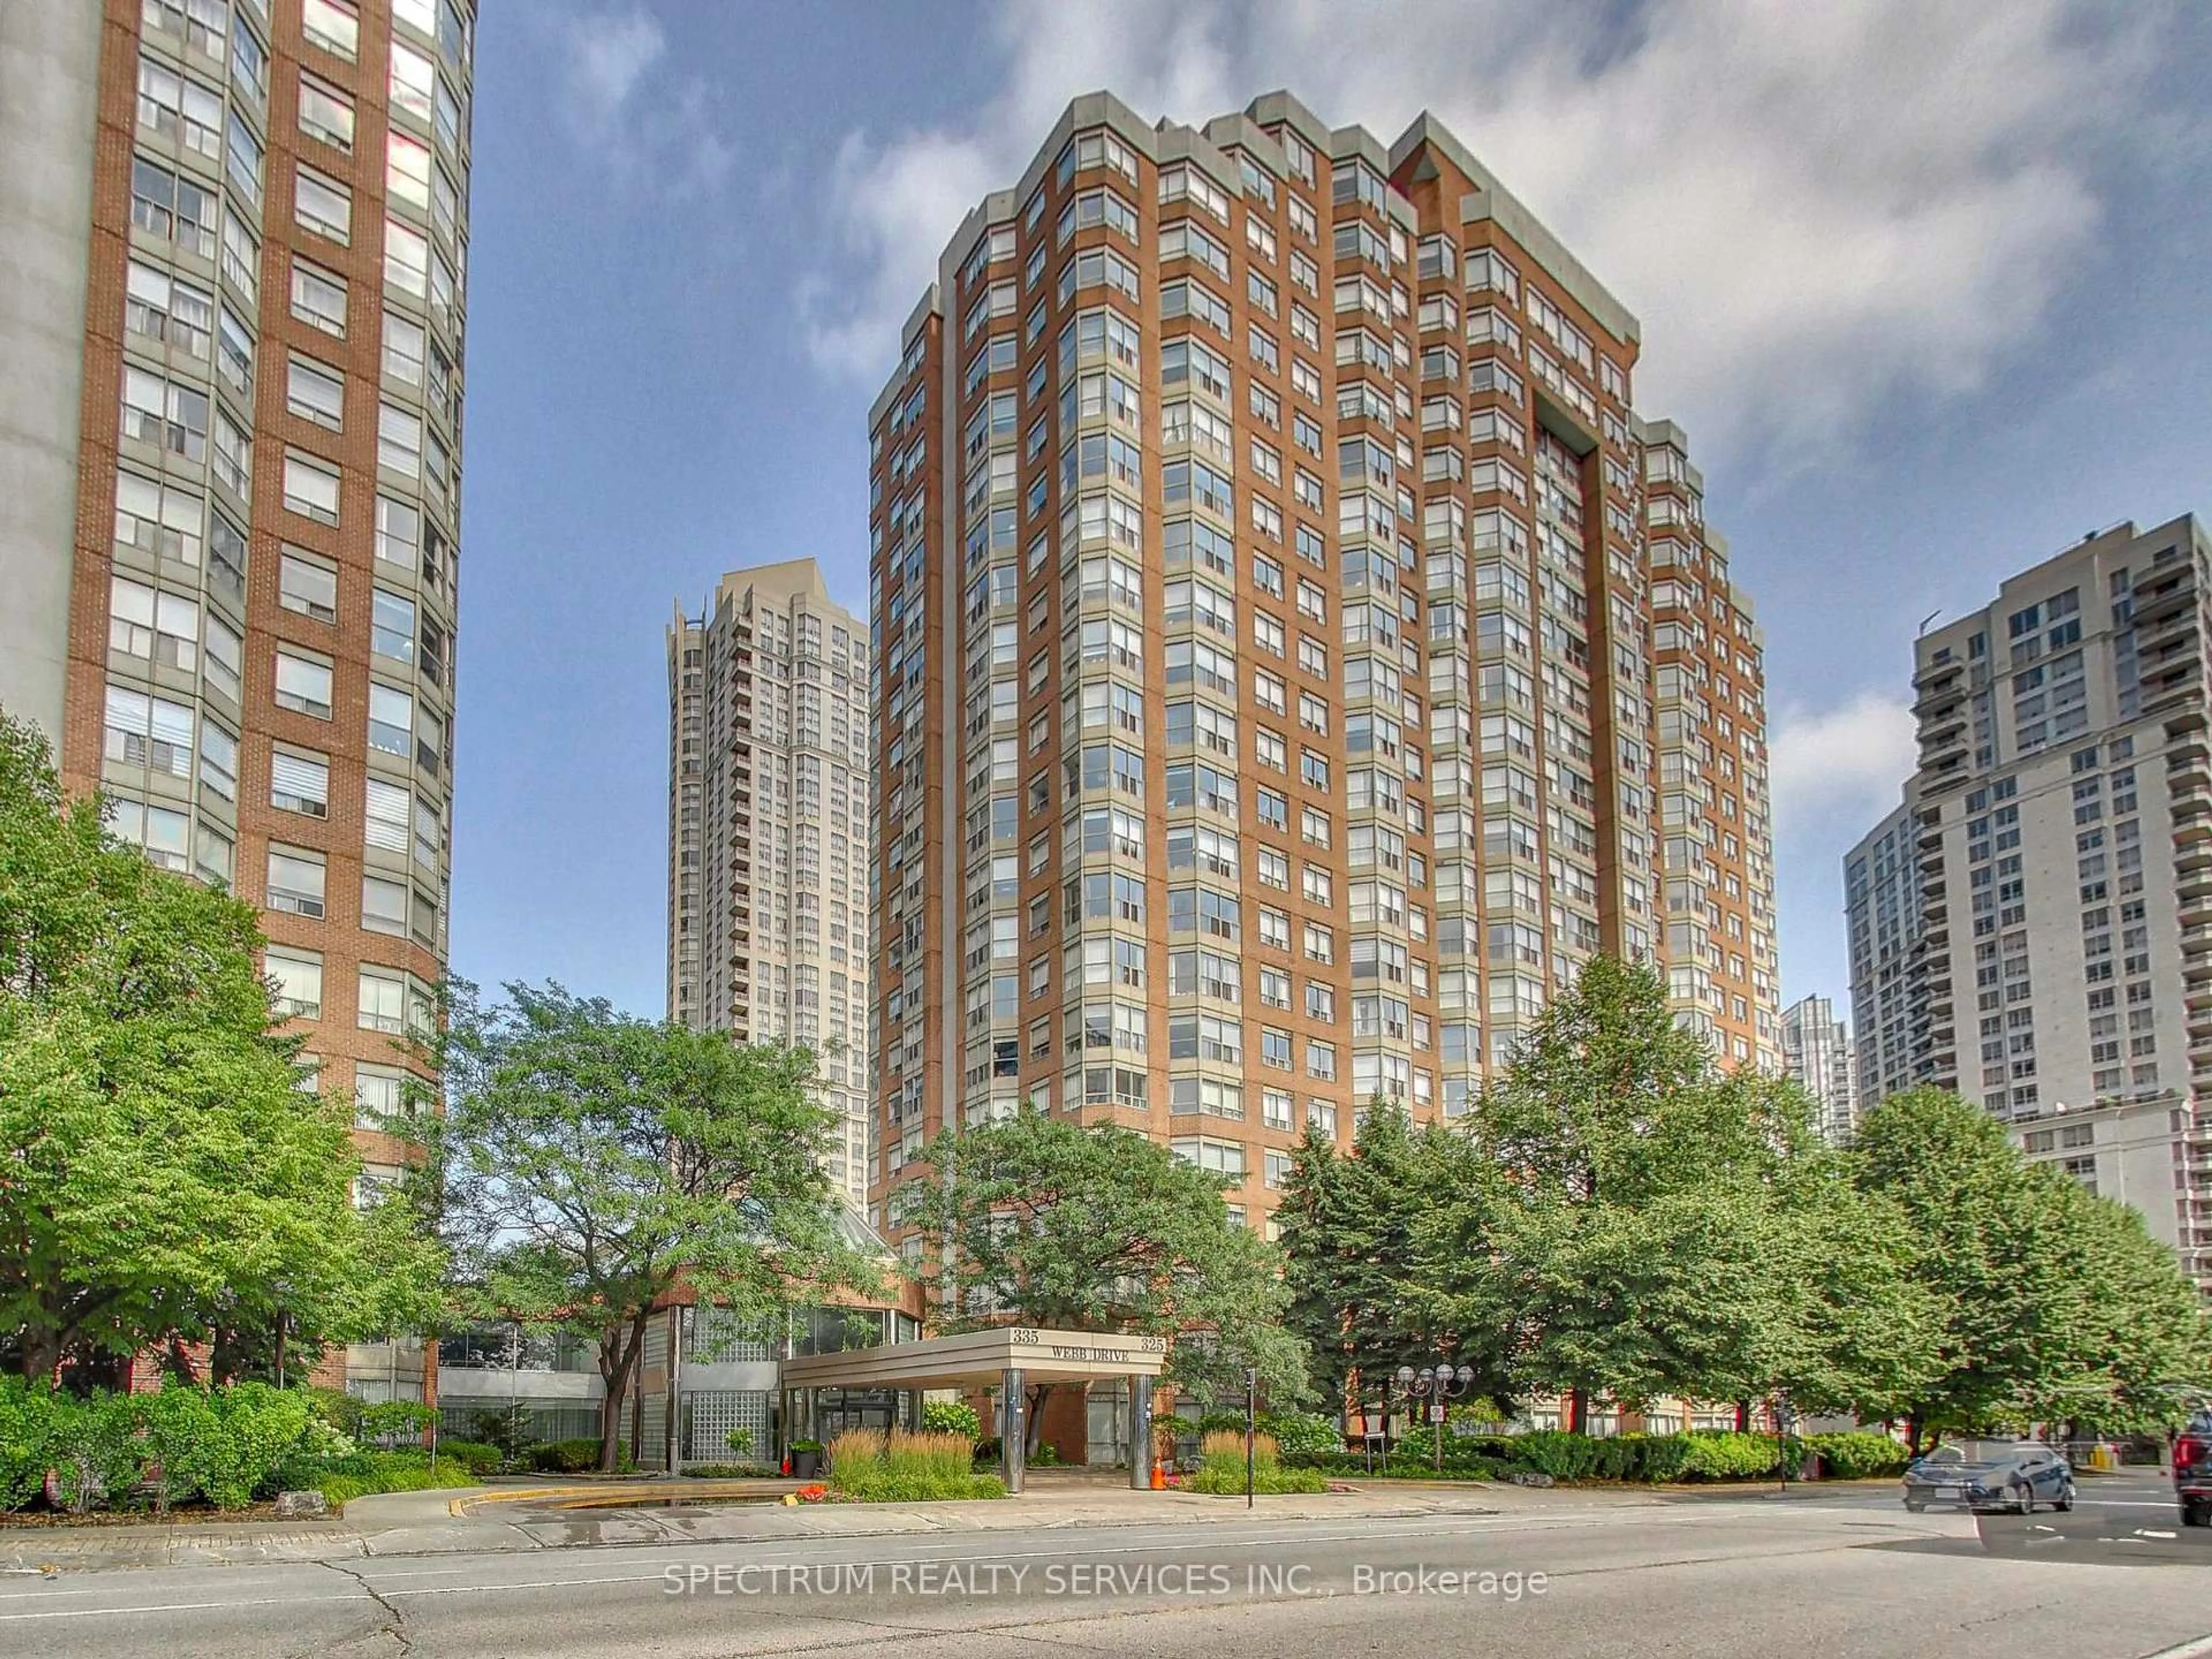
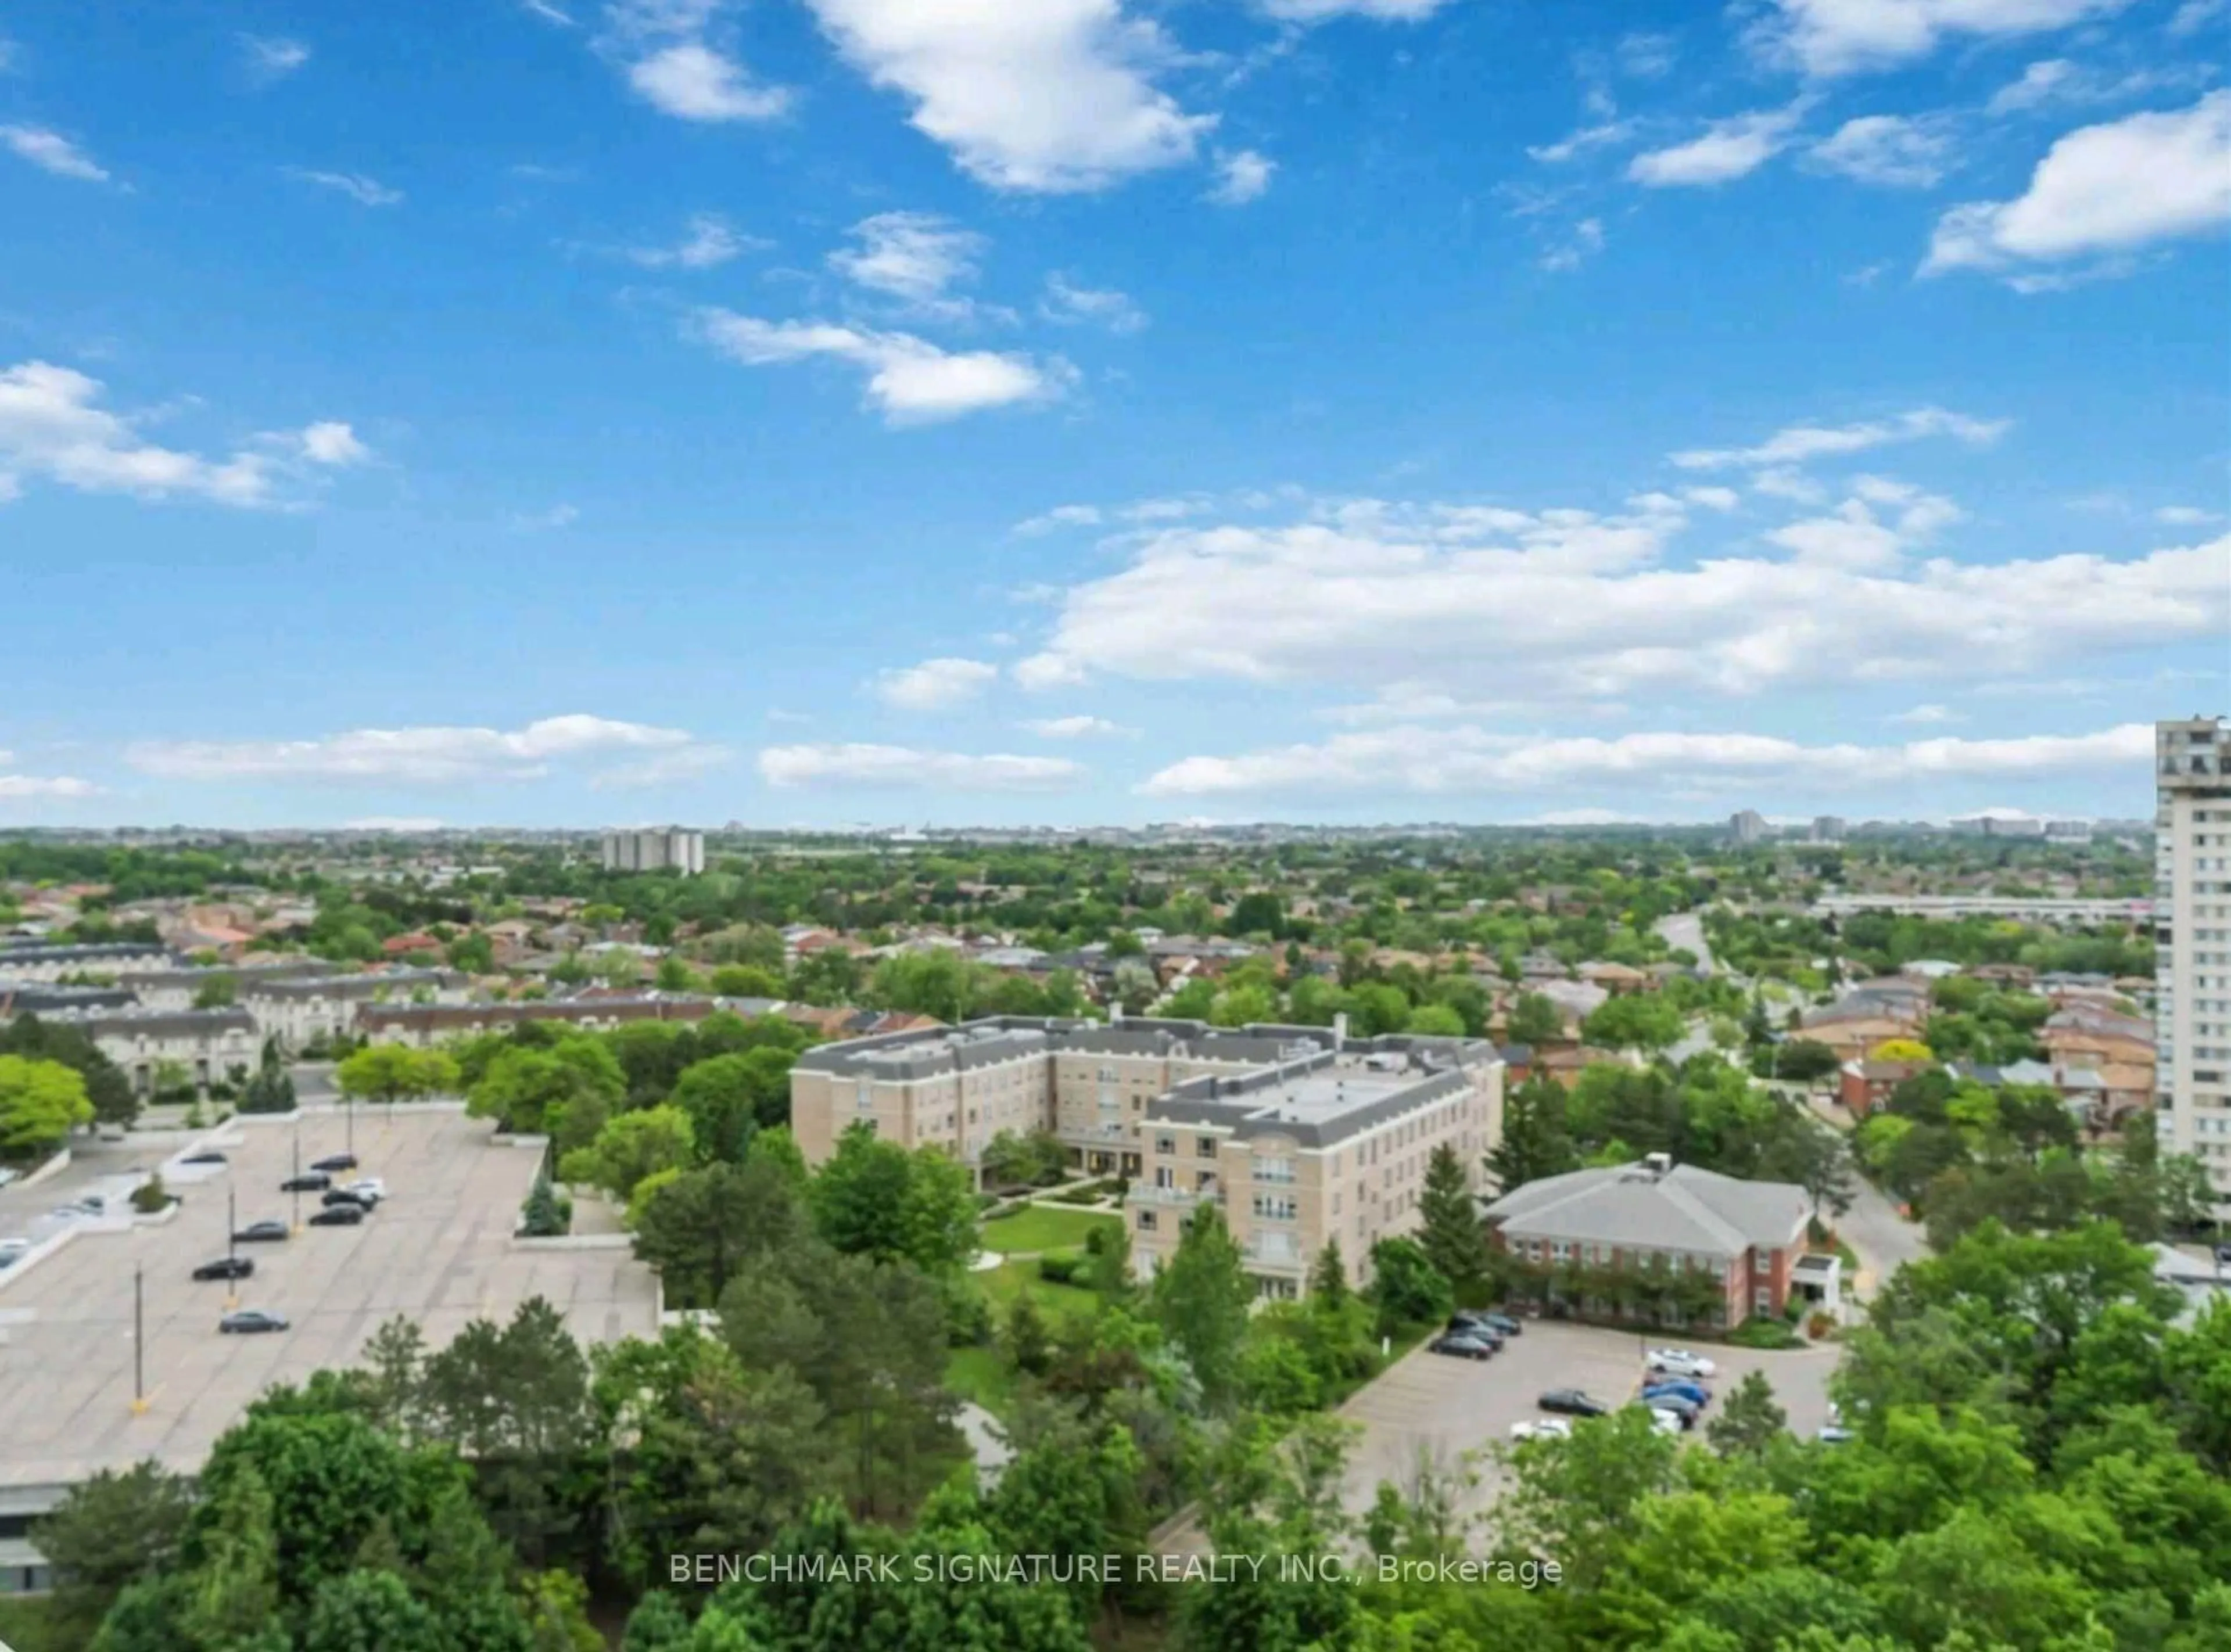
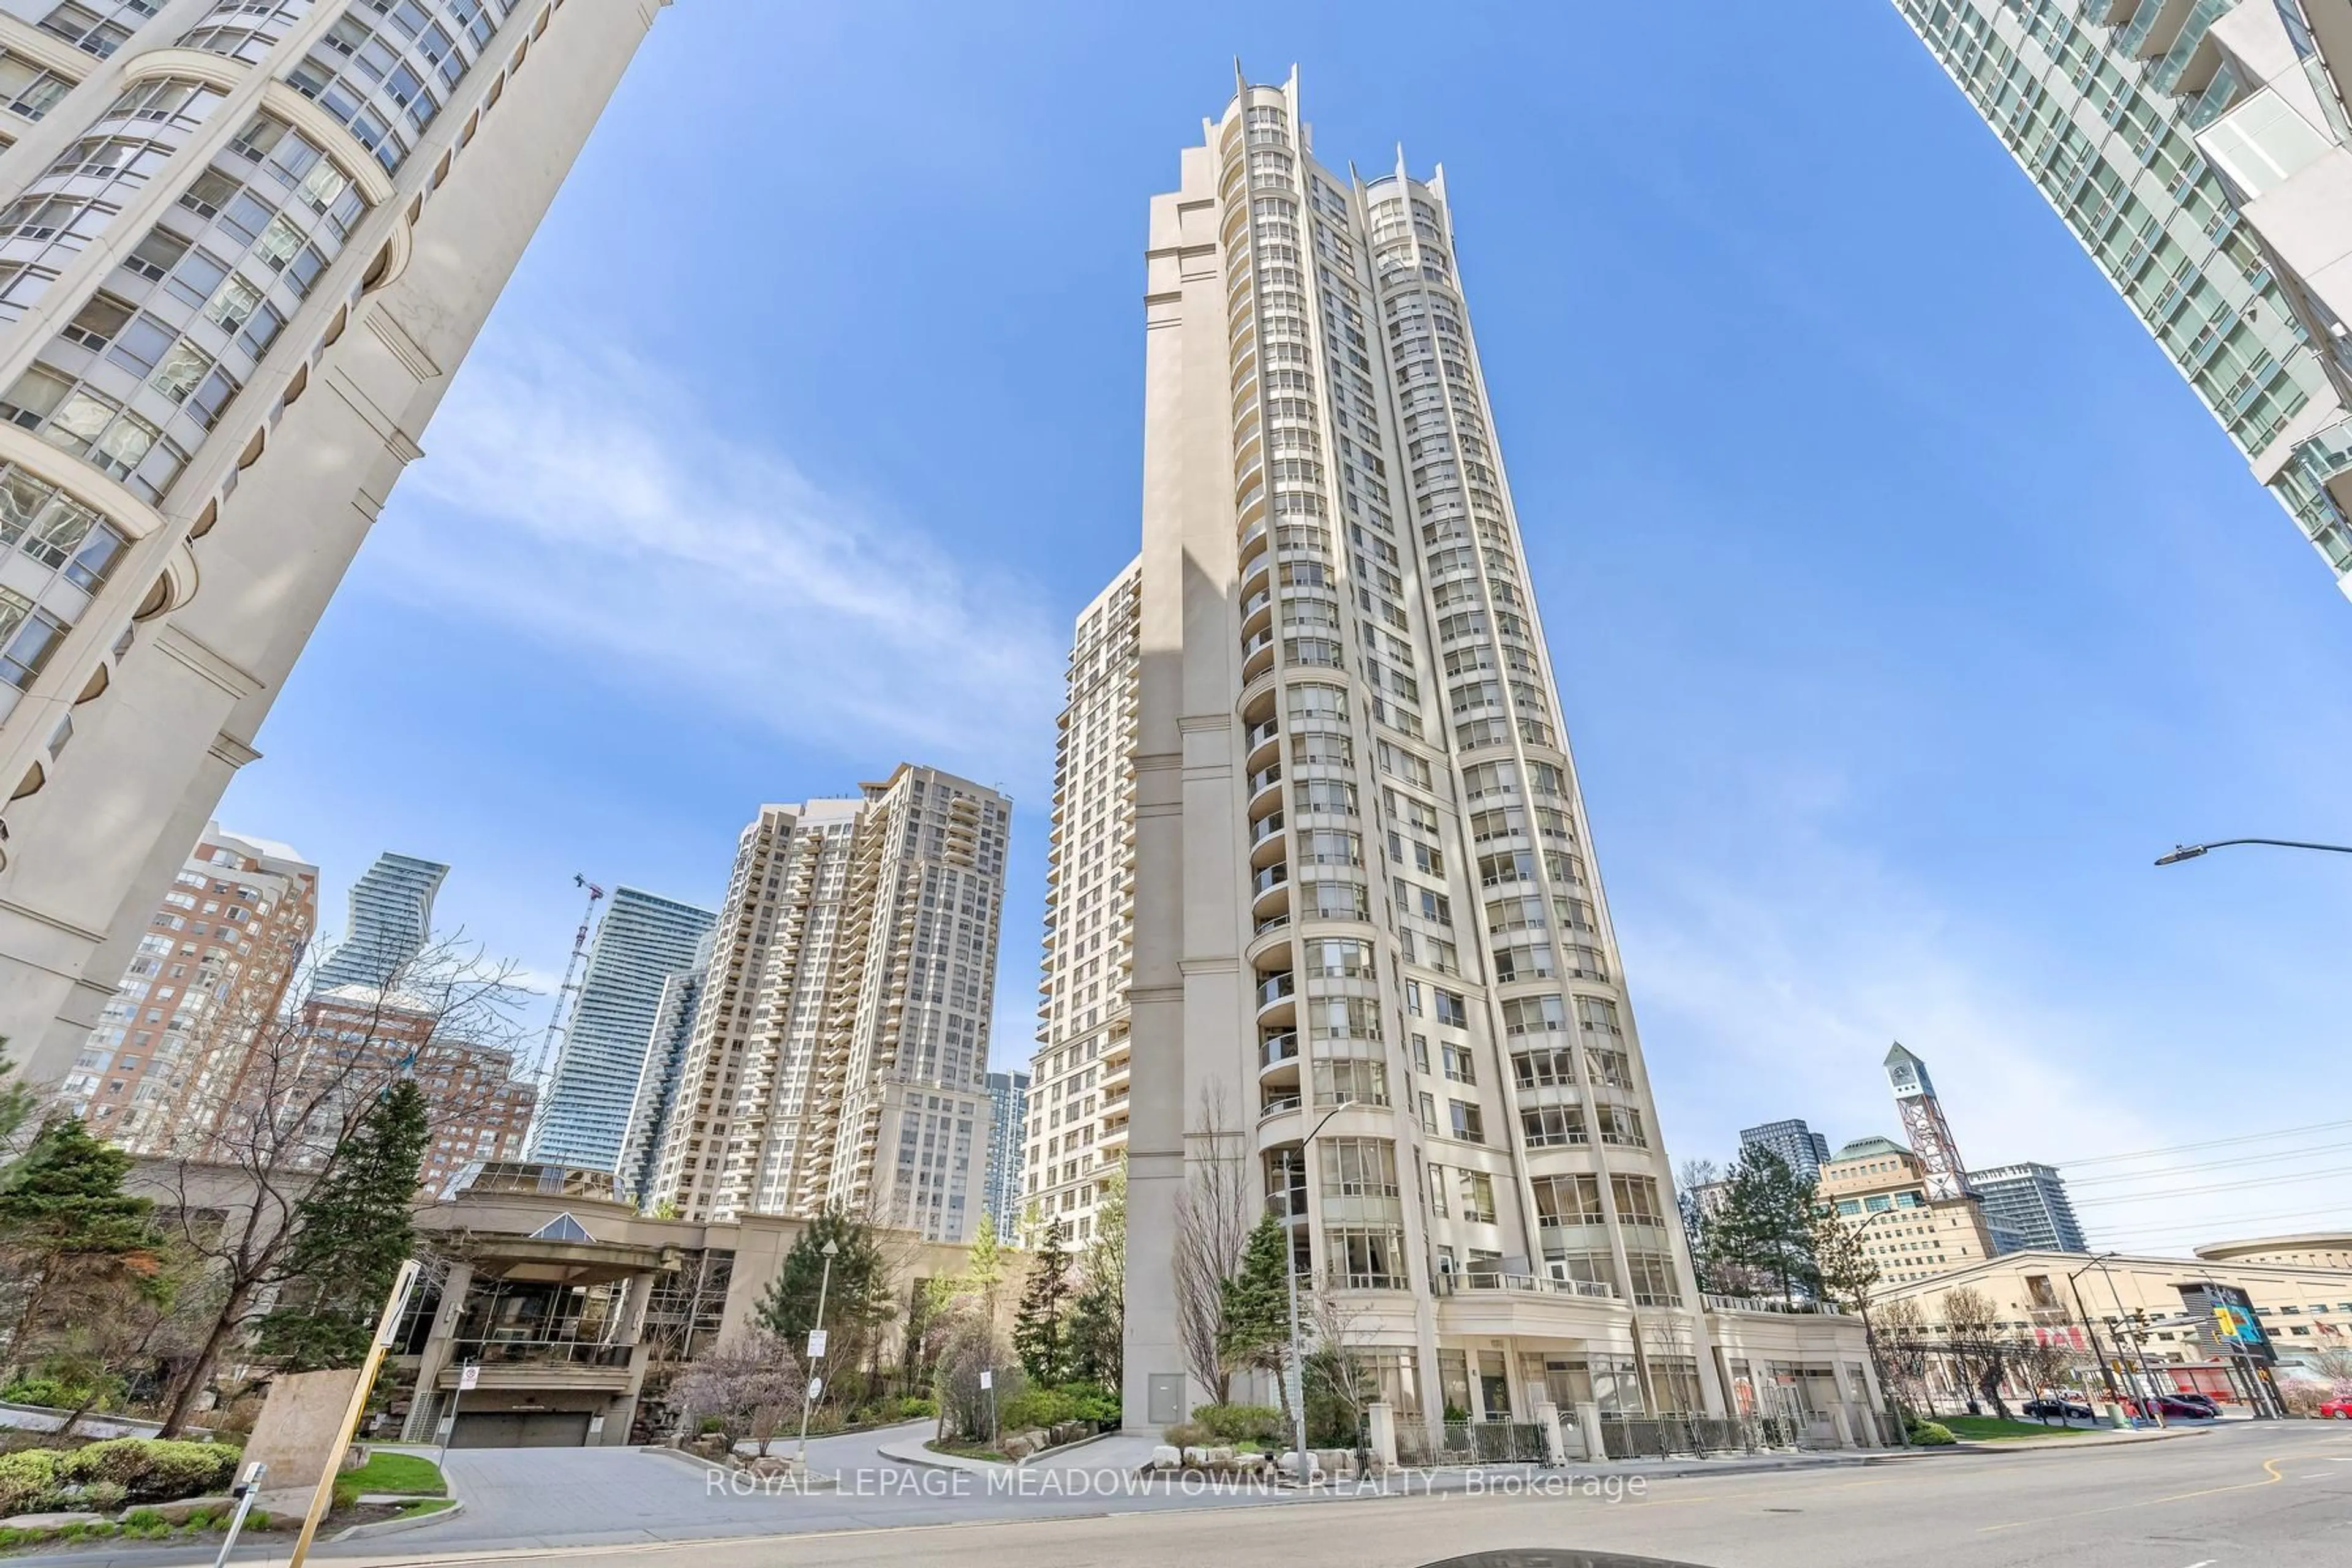
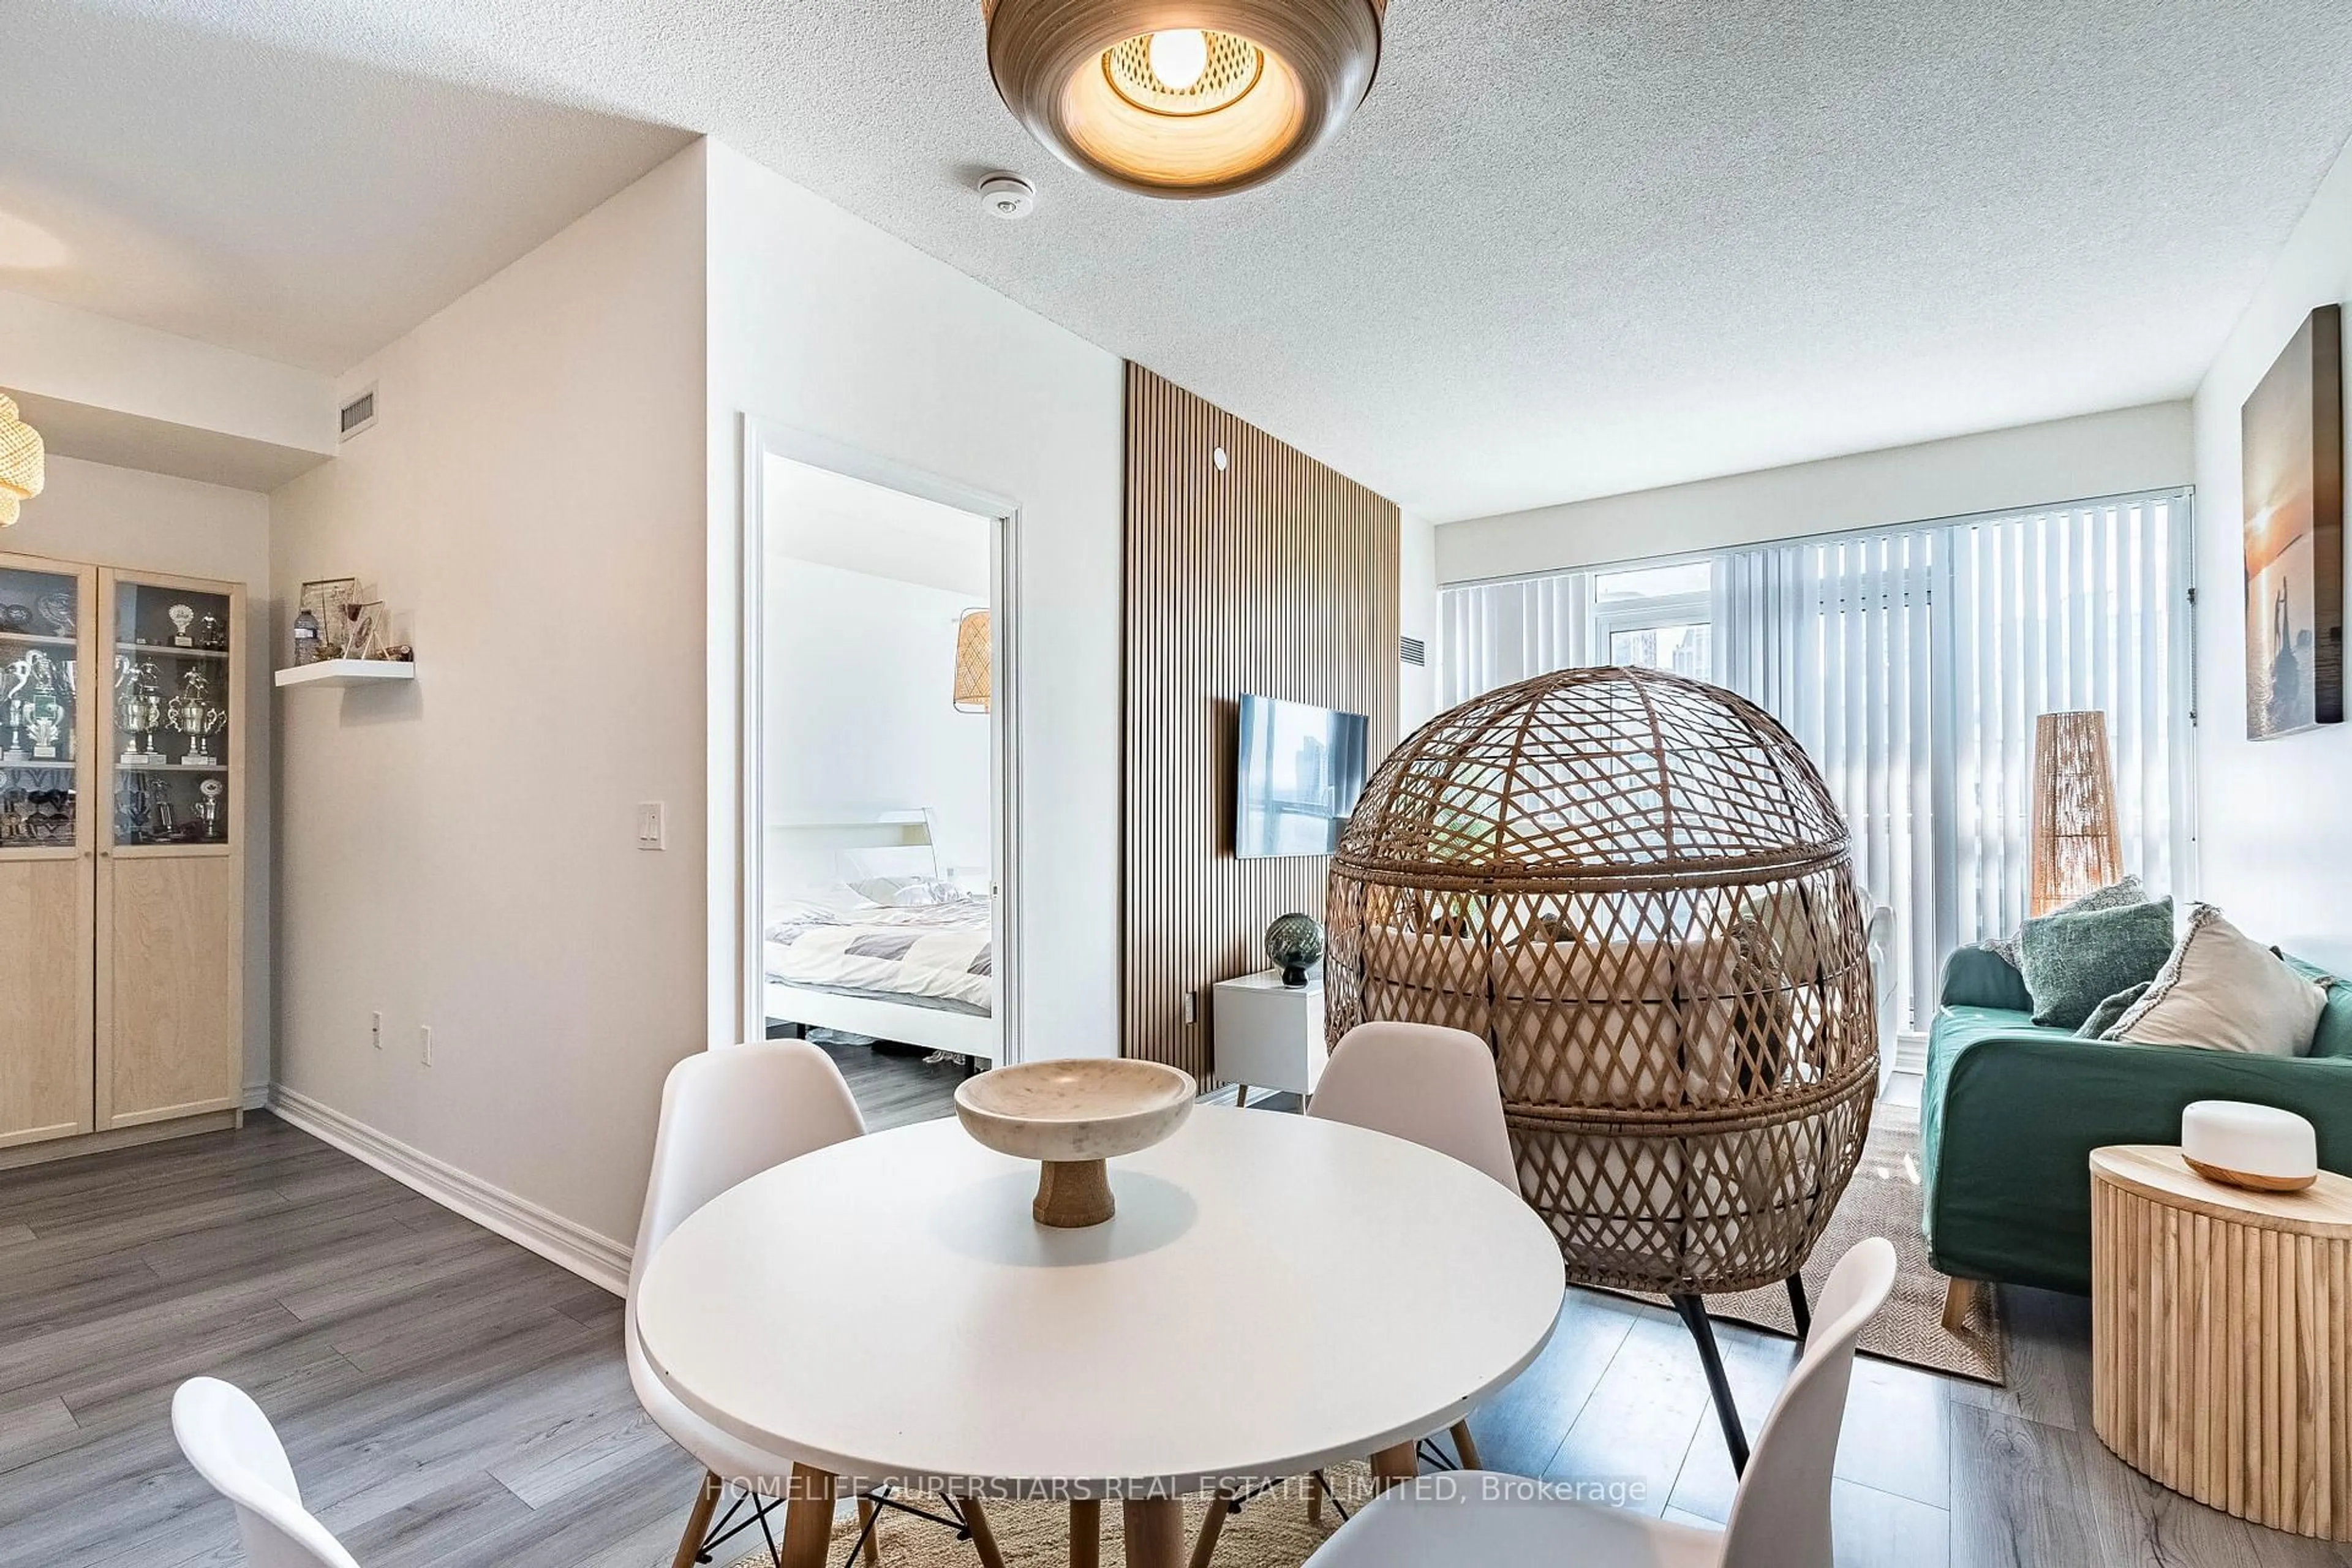
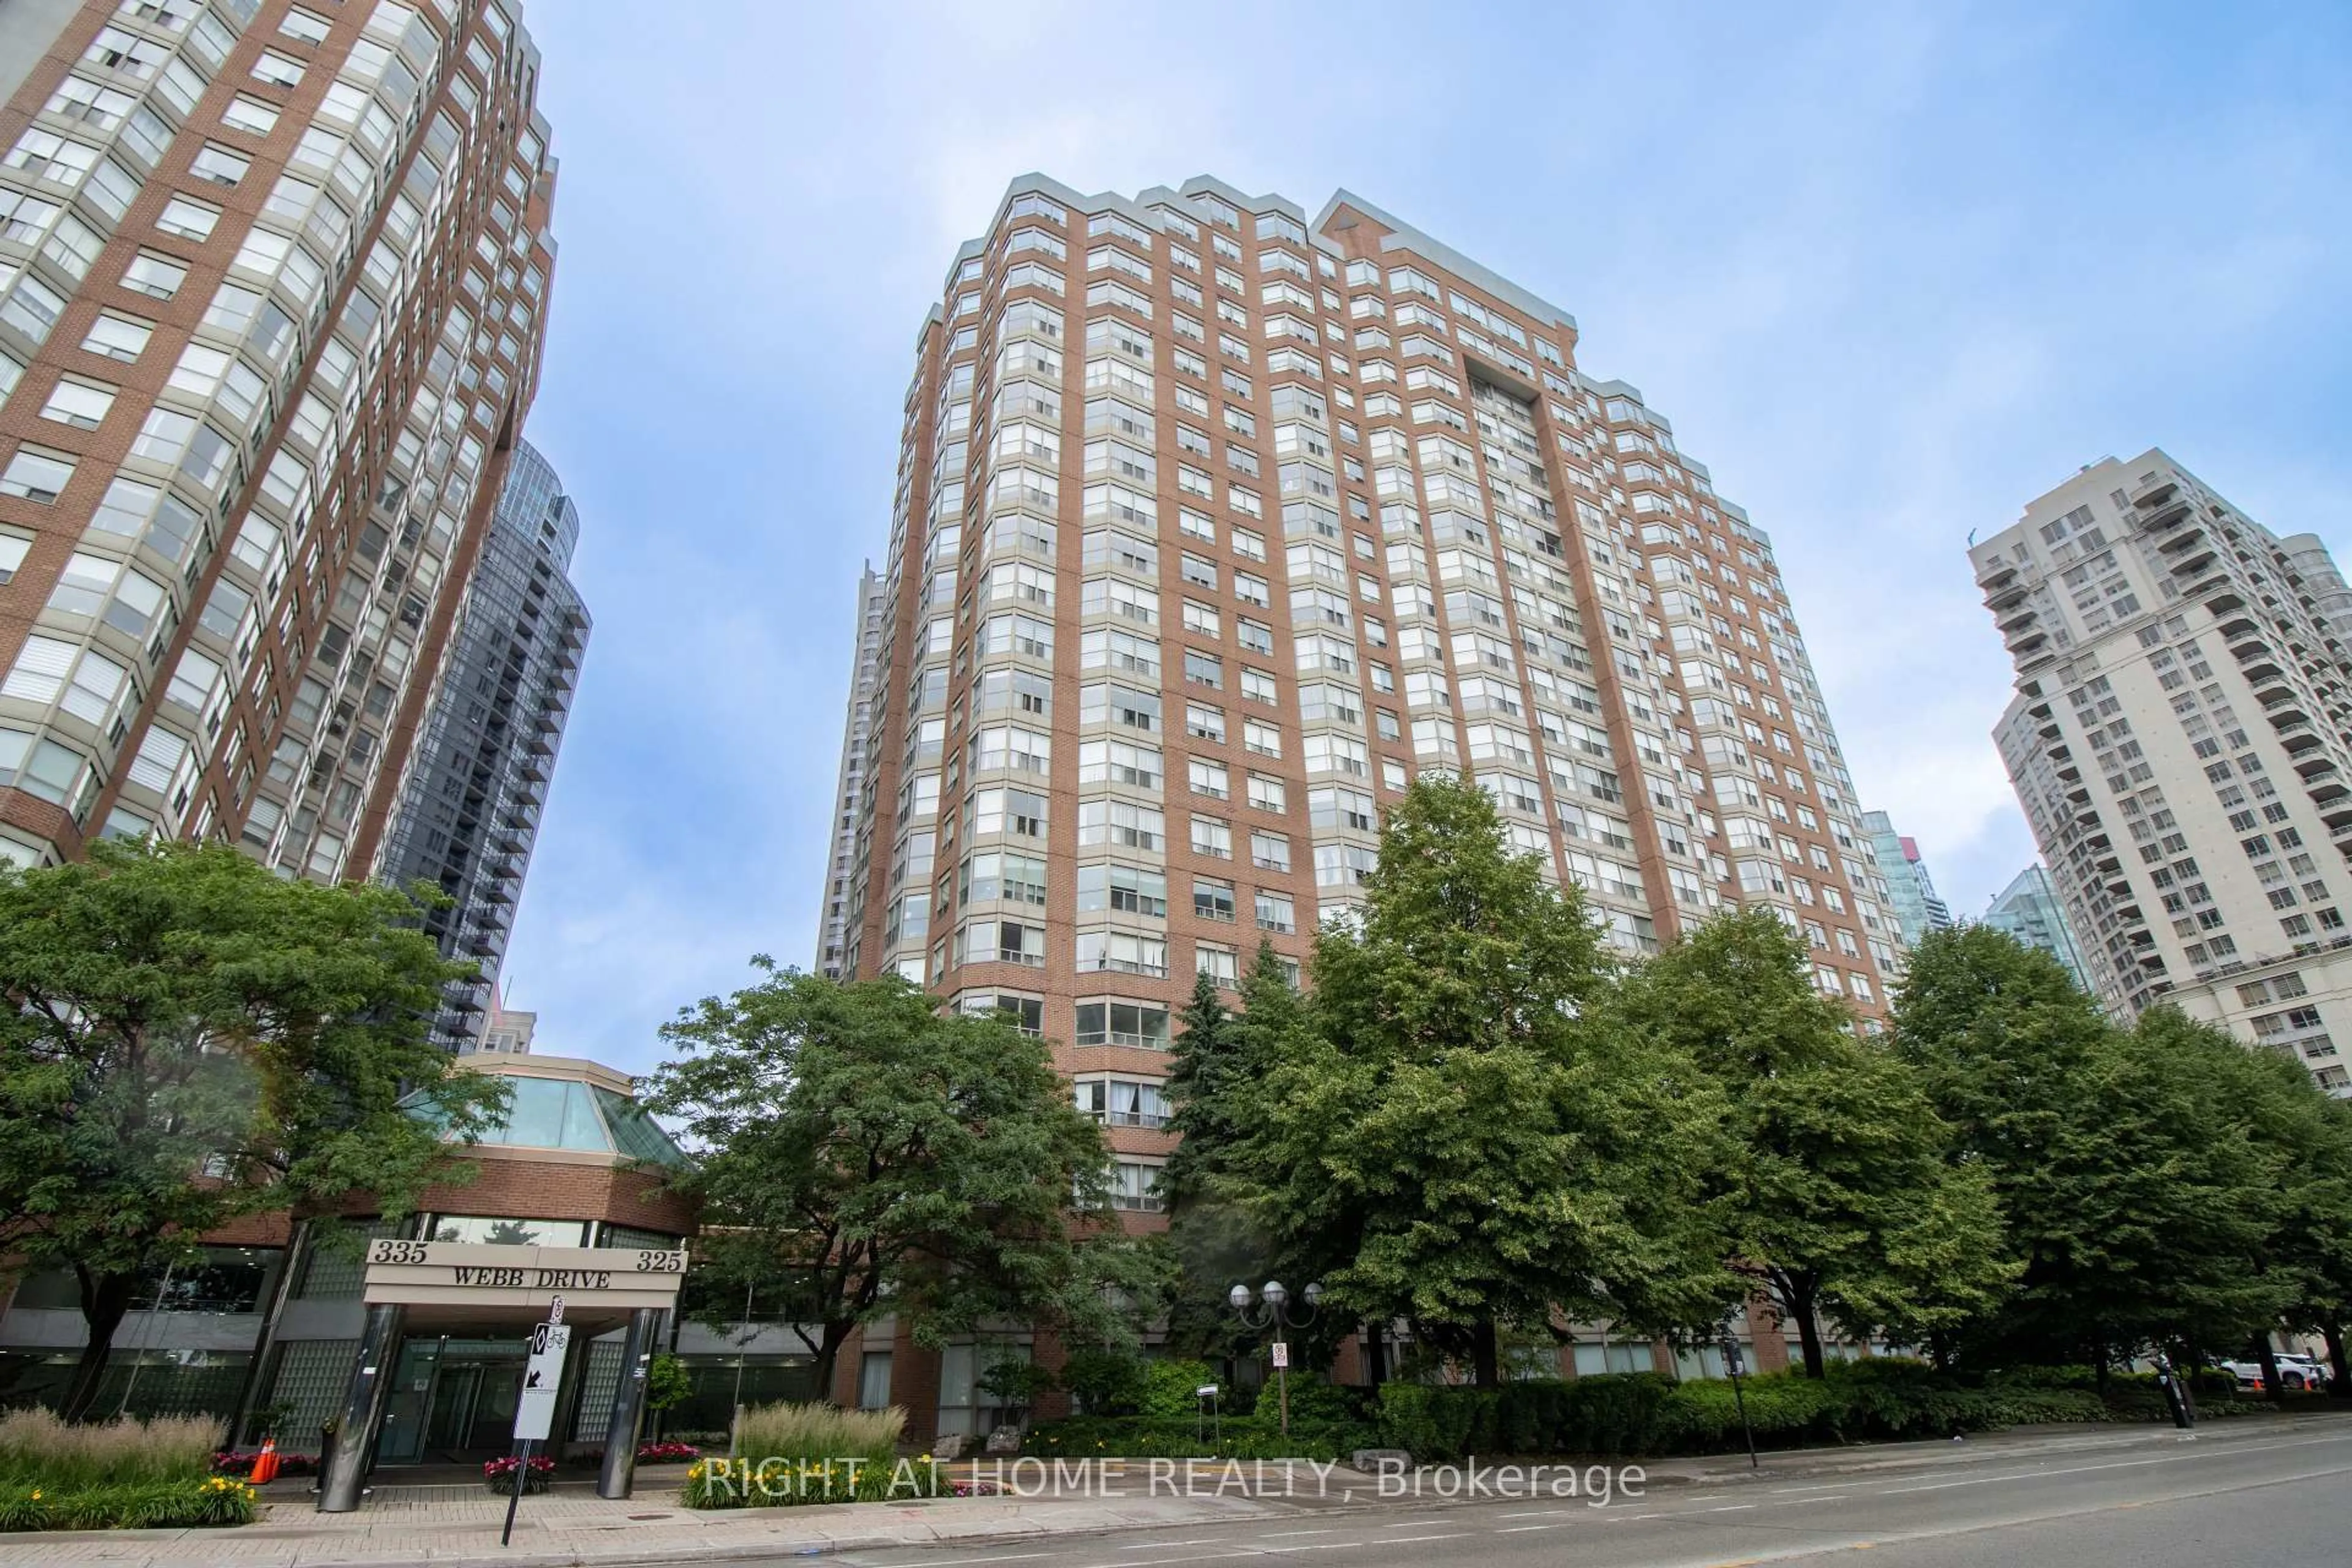
Just listed - Core Mississauga
View all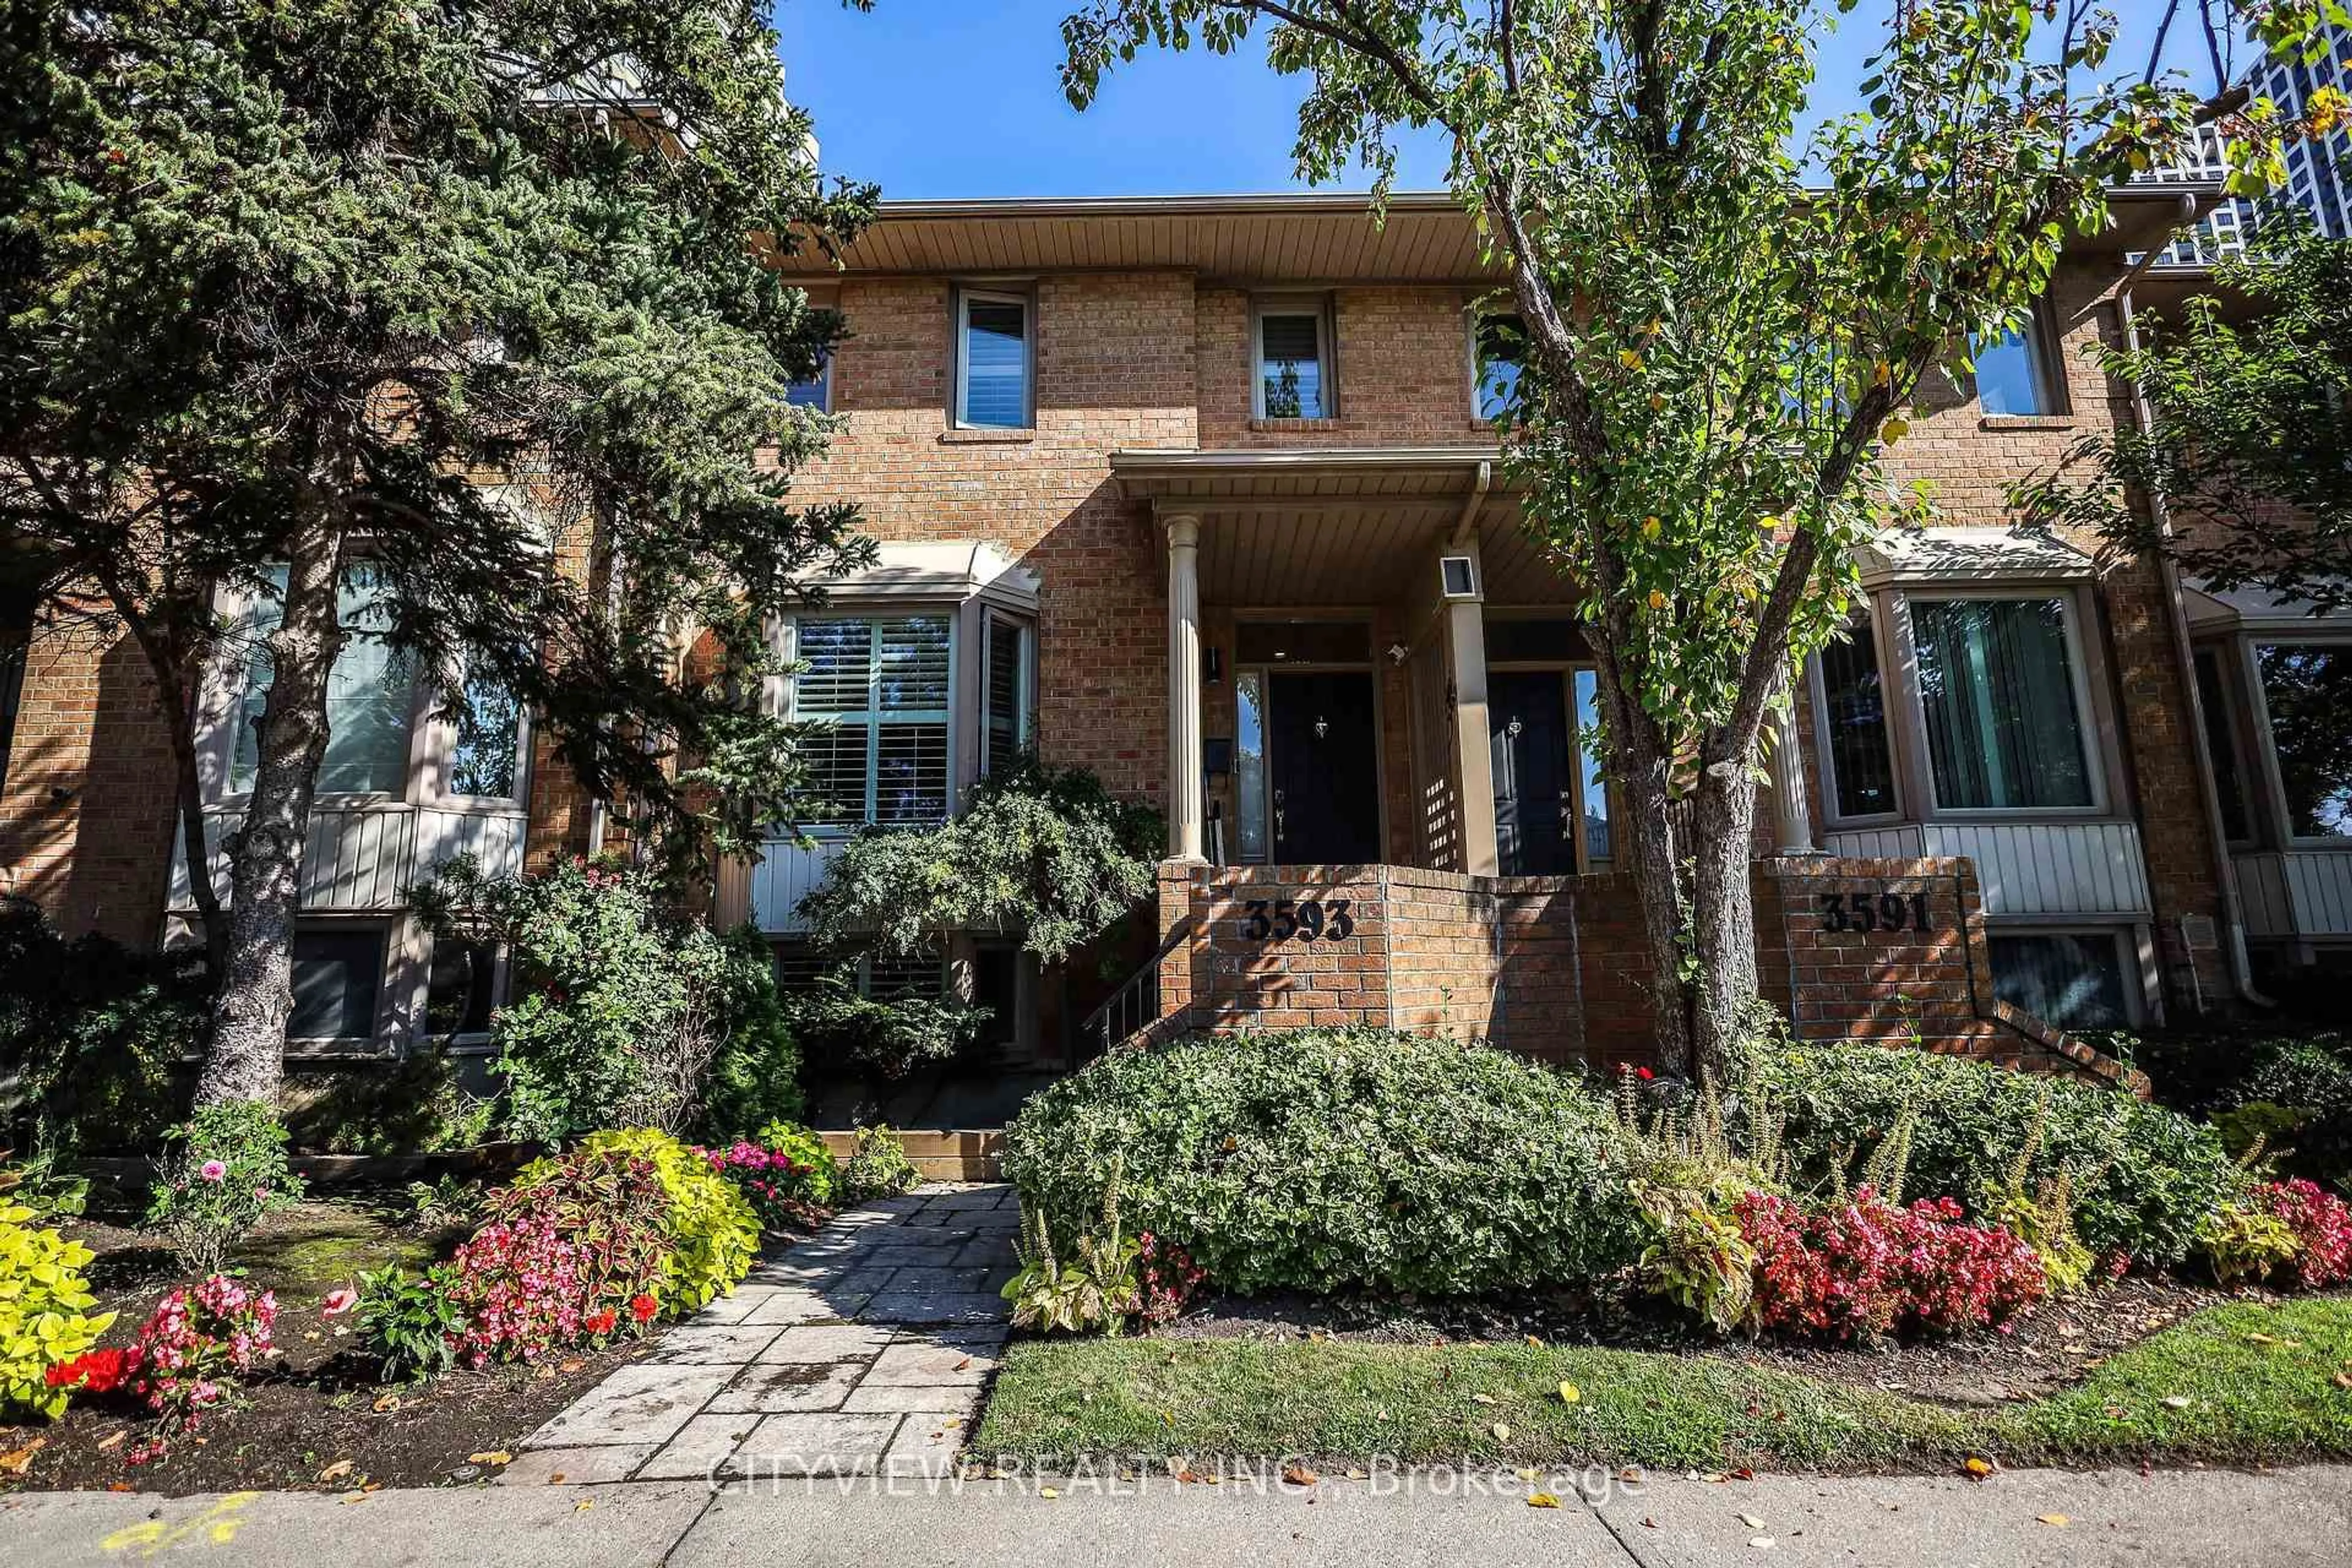

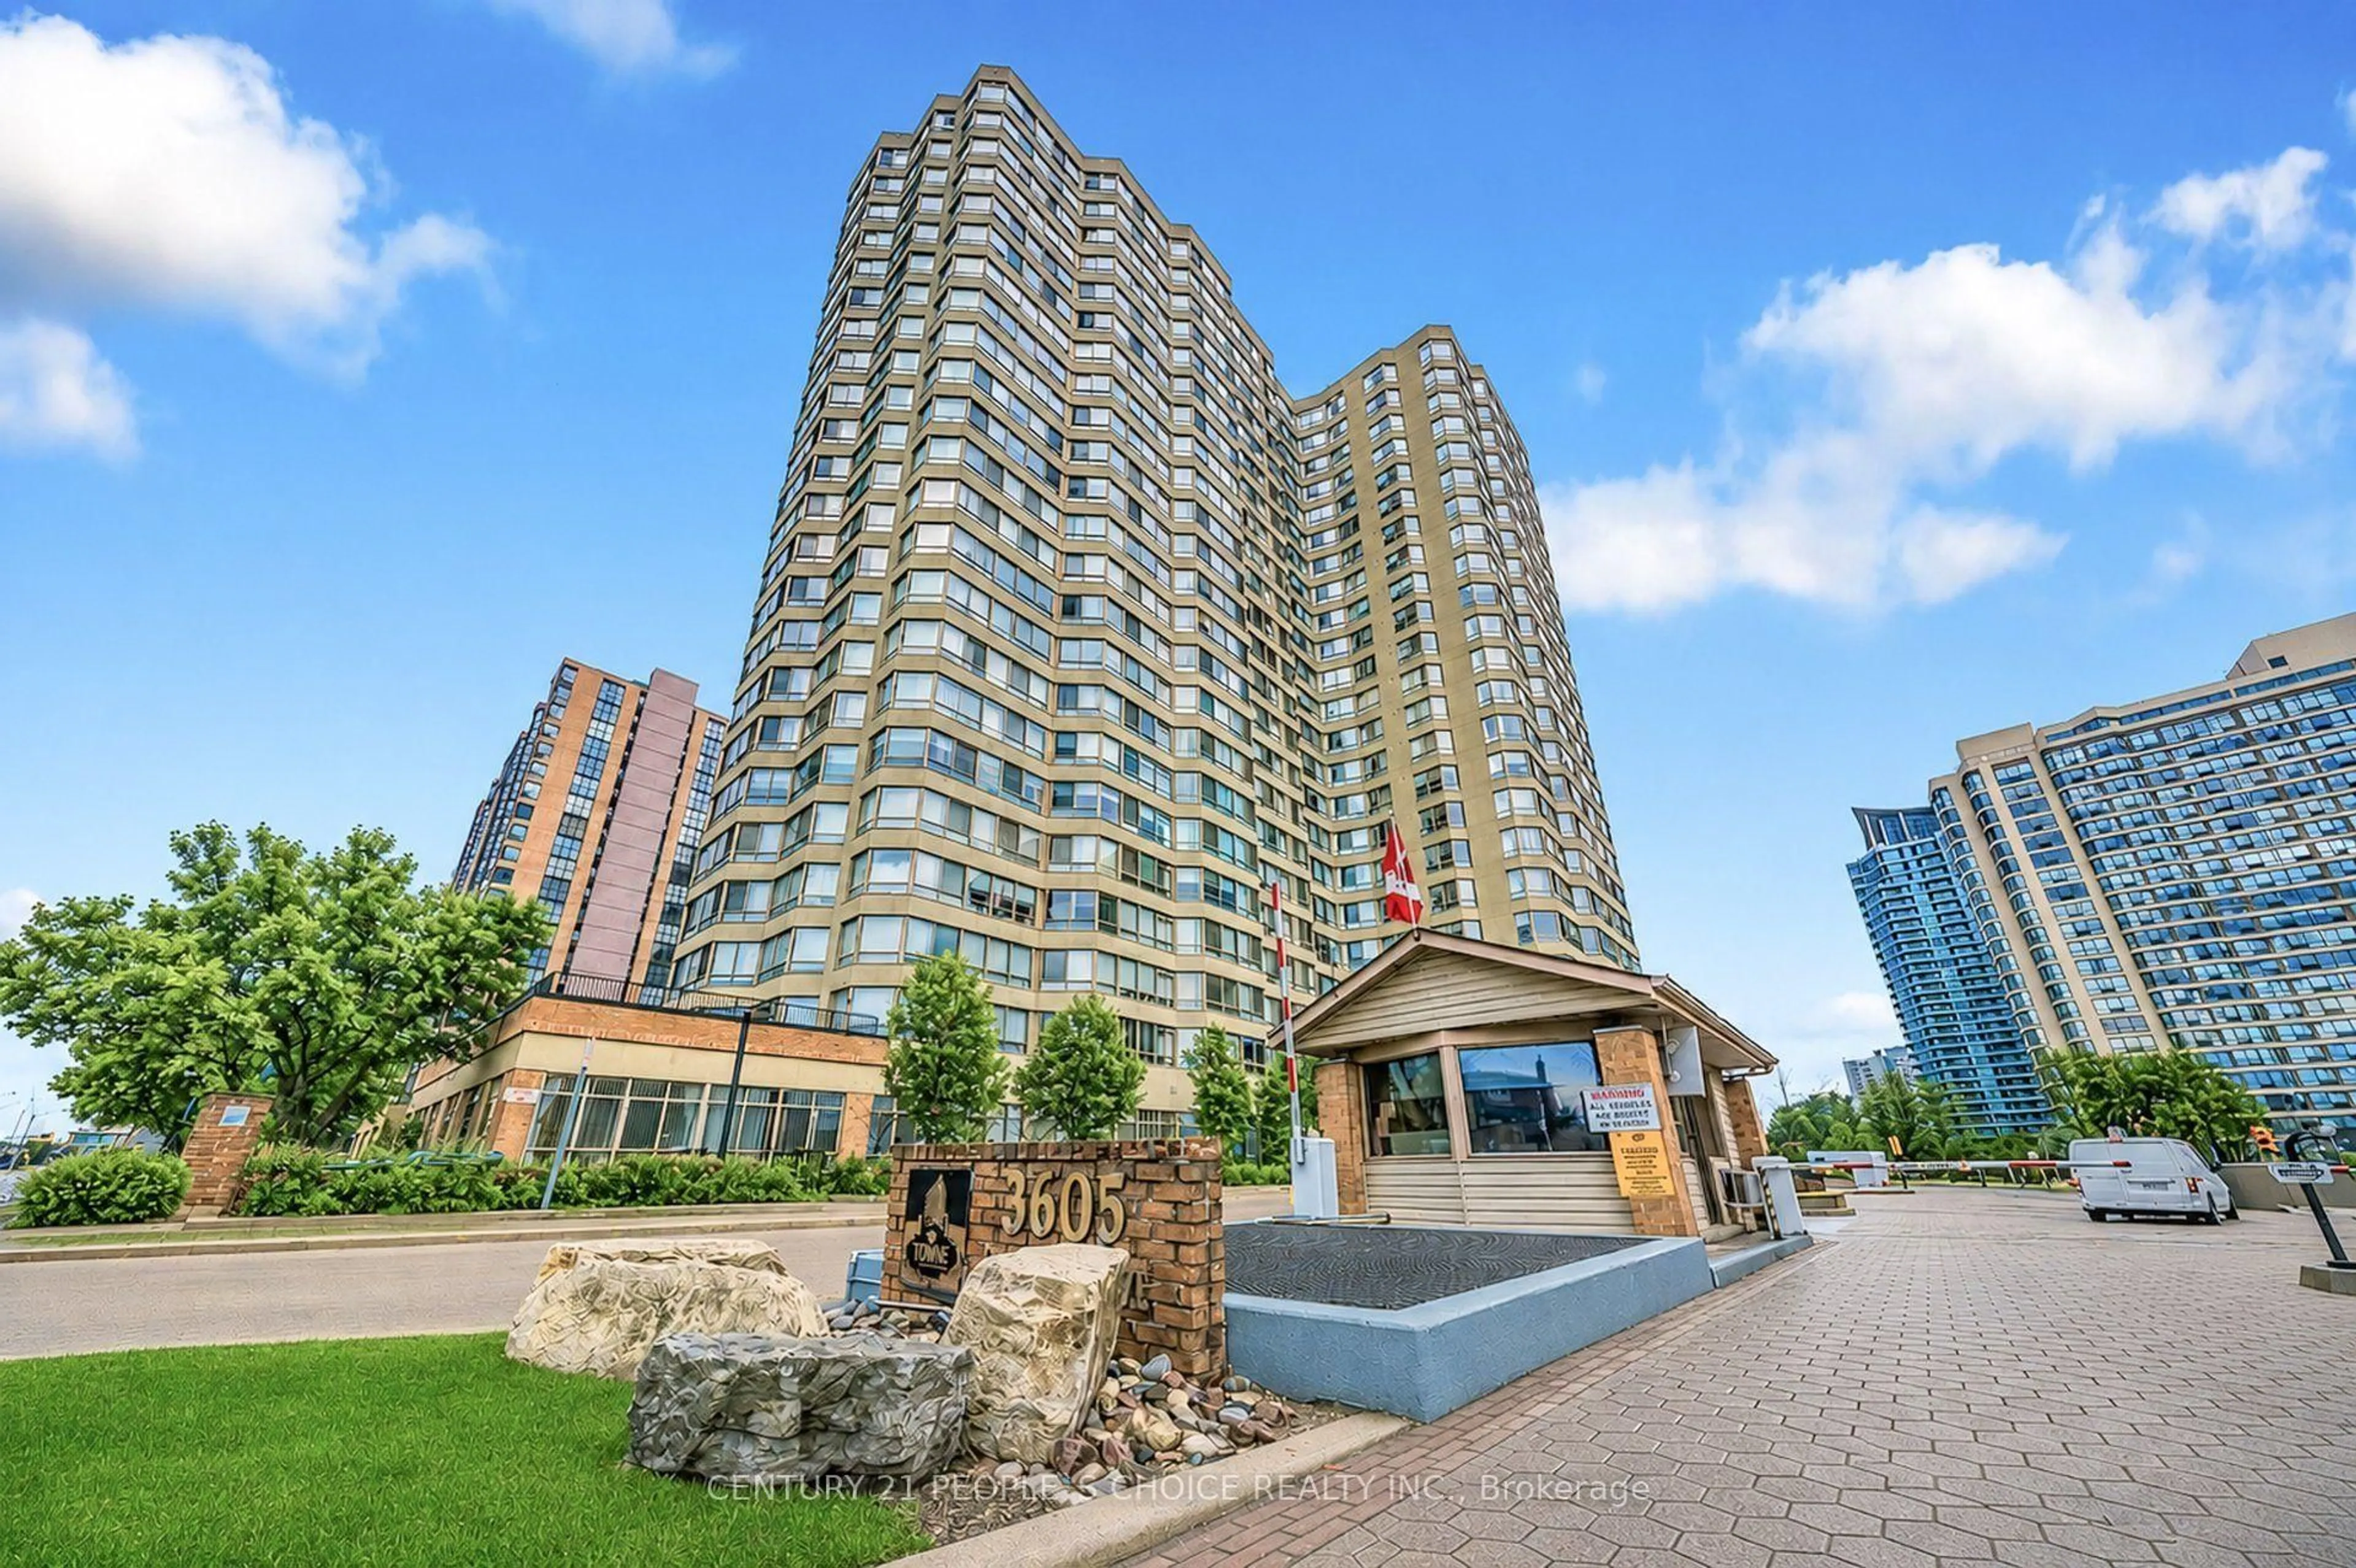
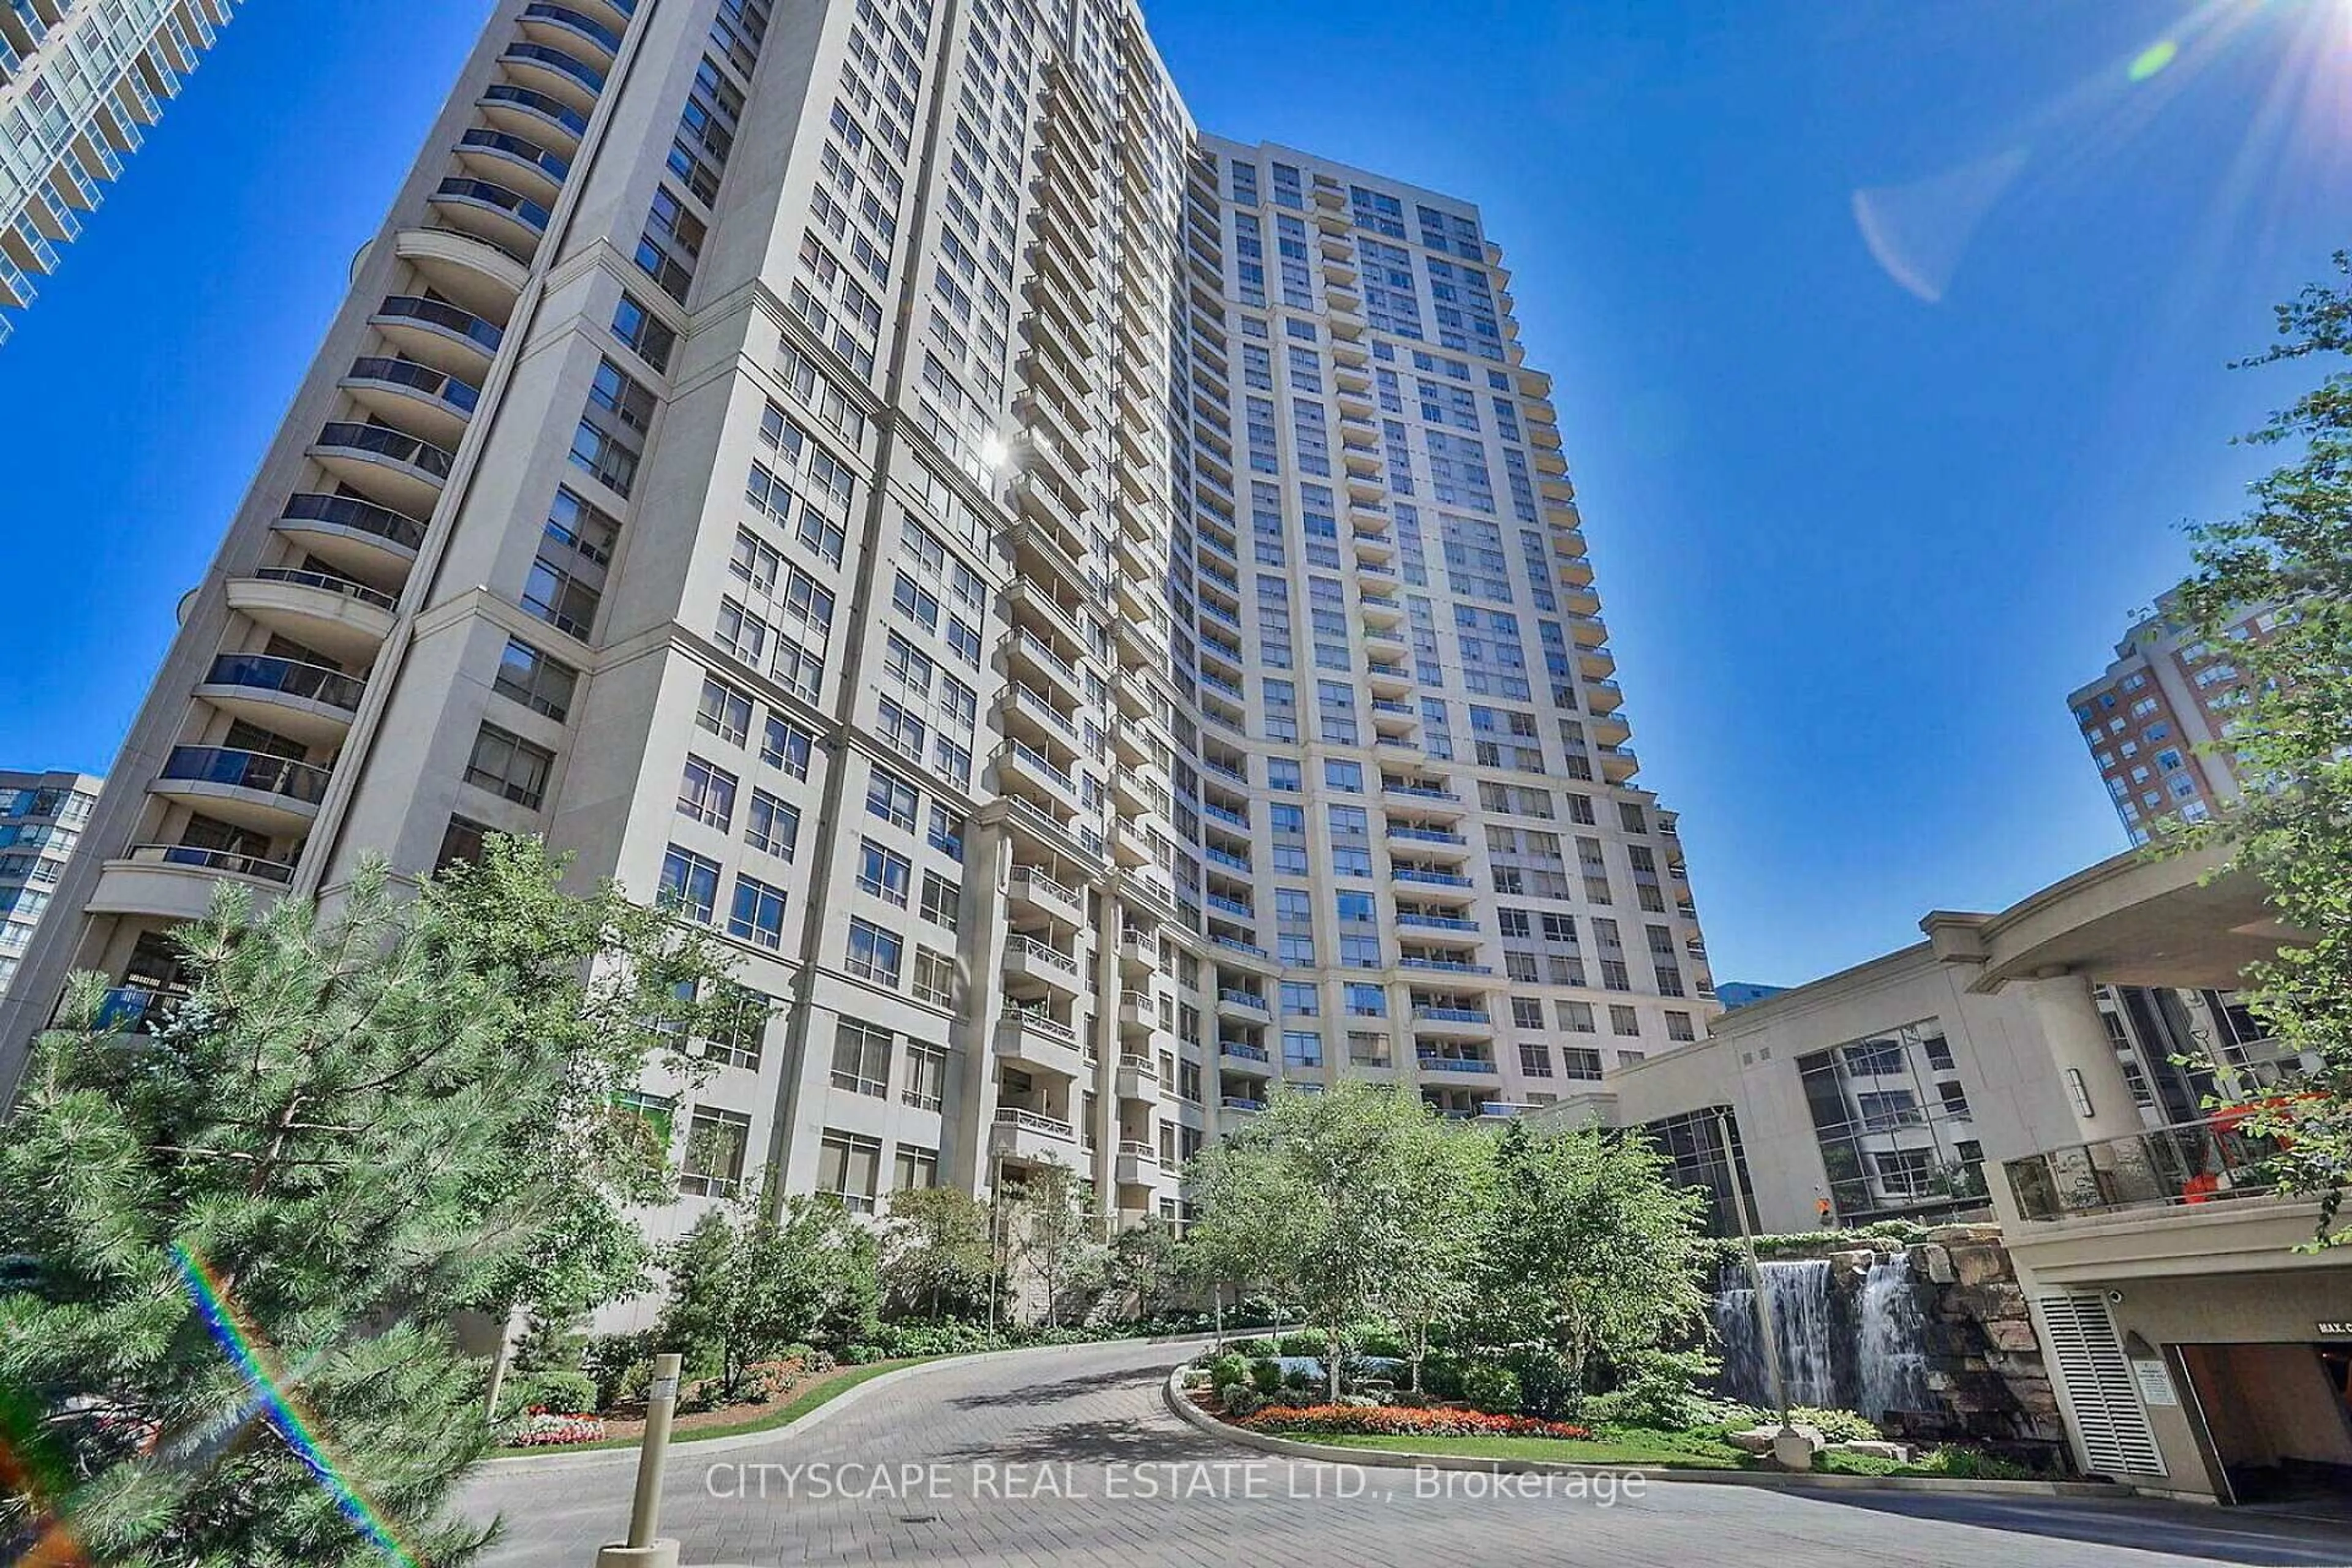
Just sold - Core Mississauga
View all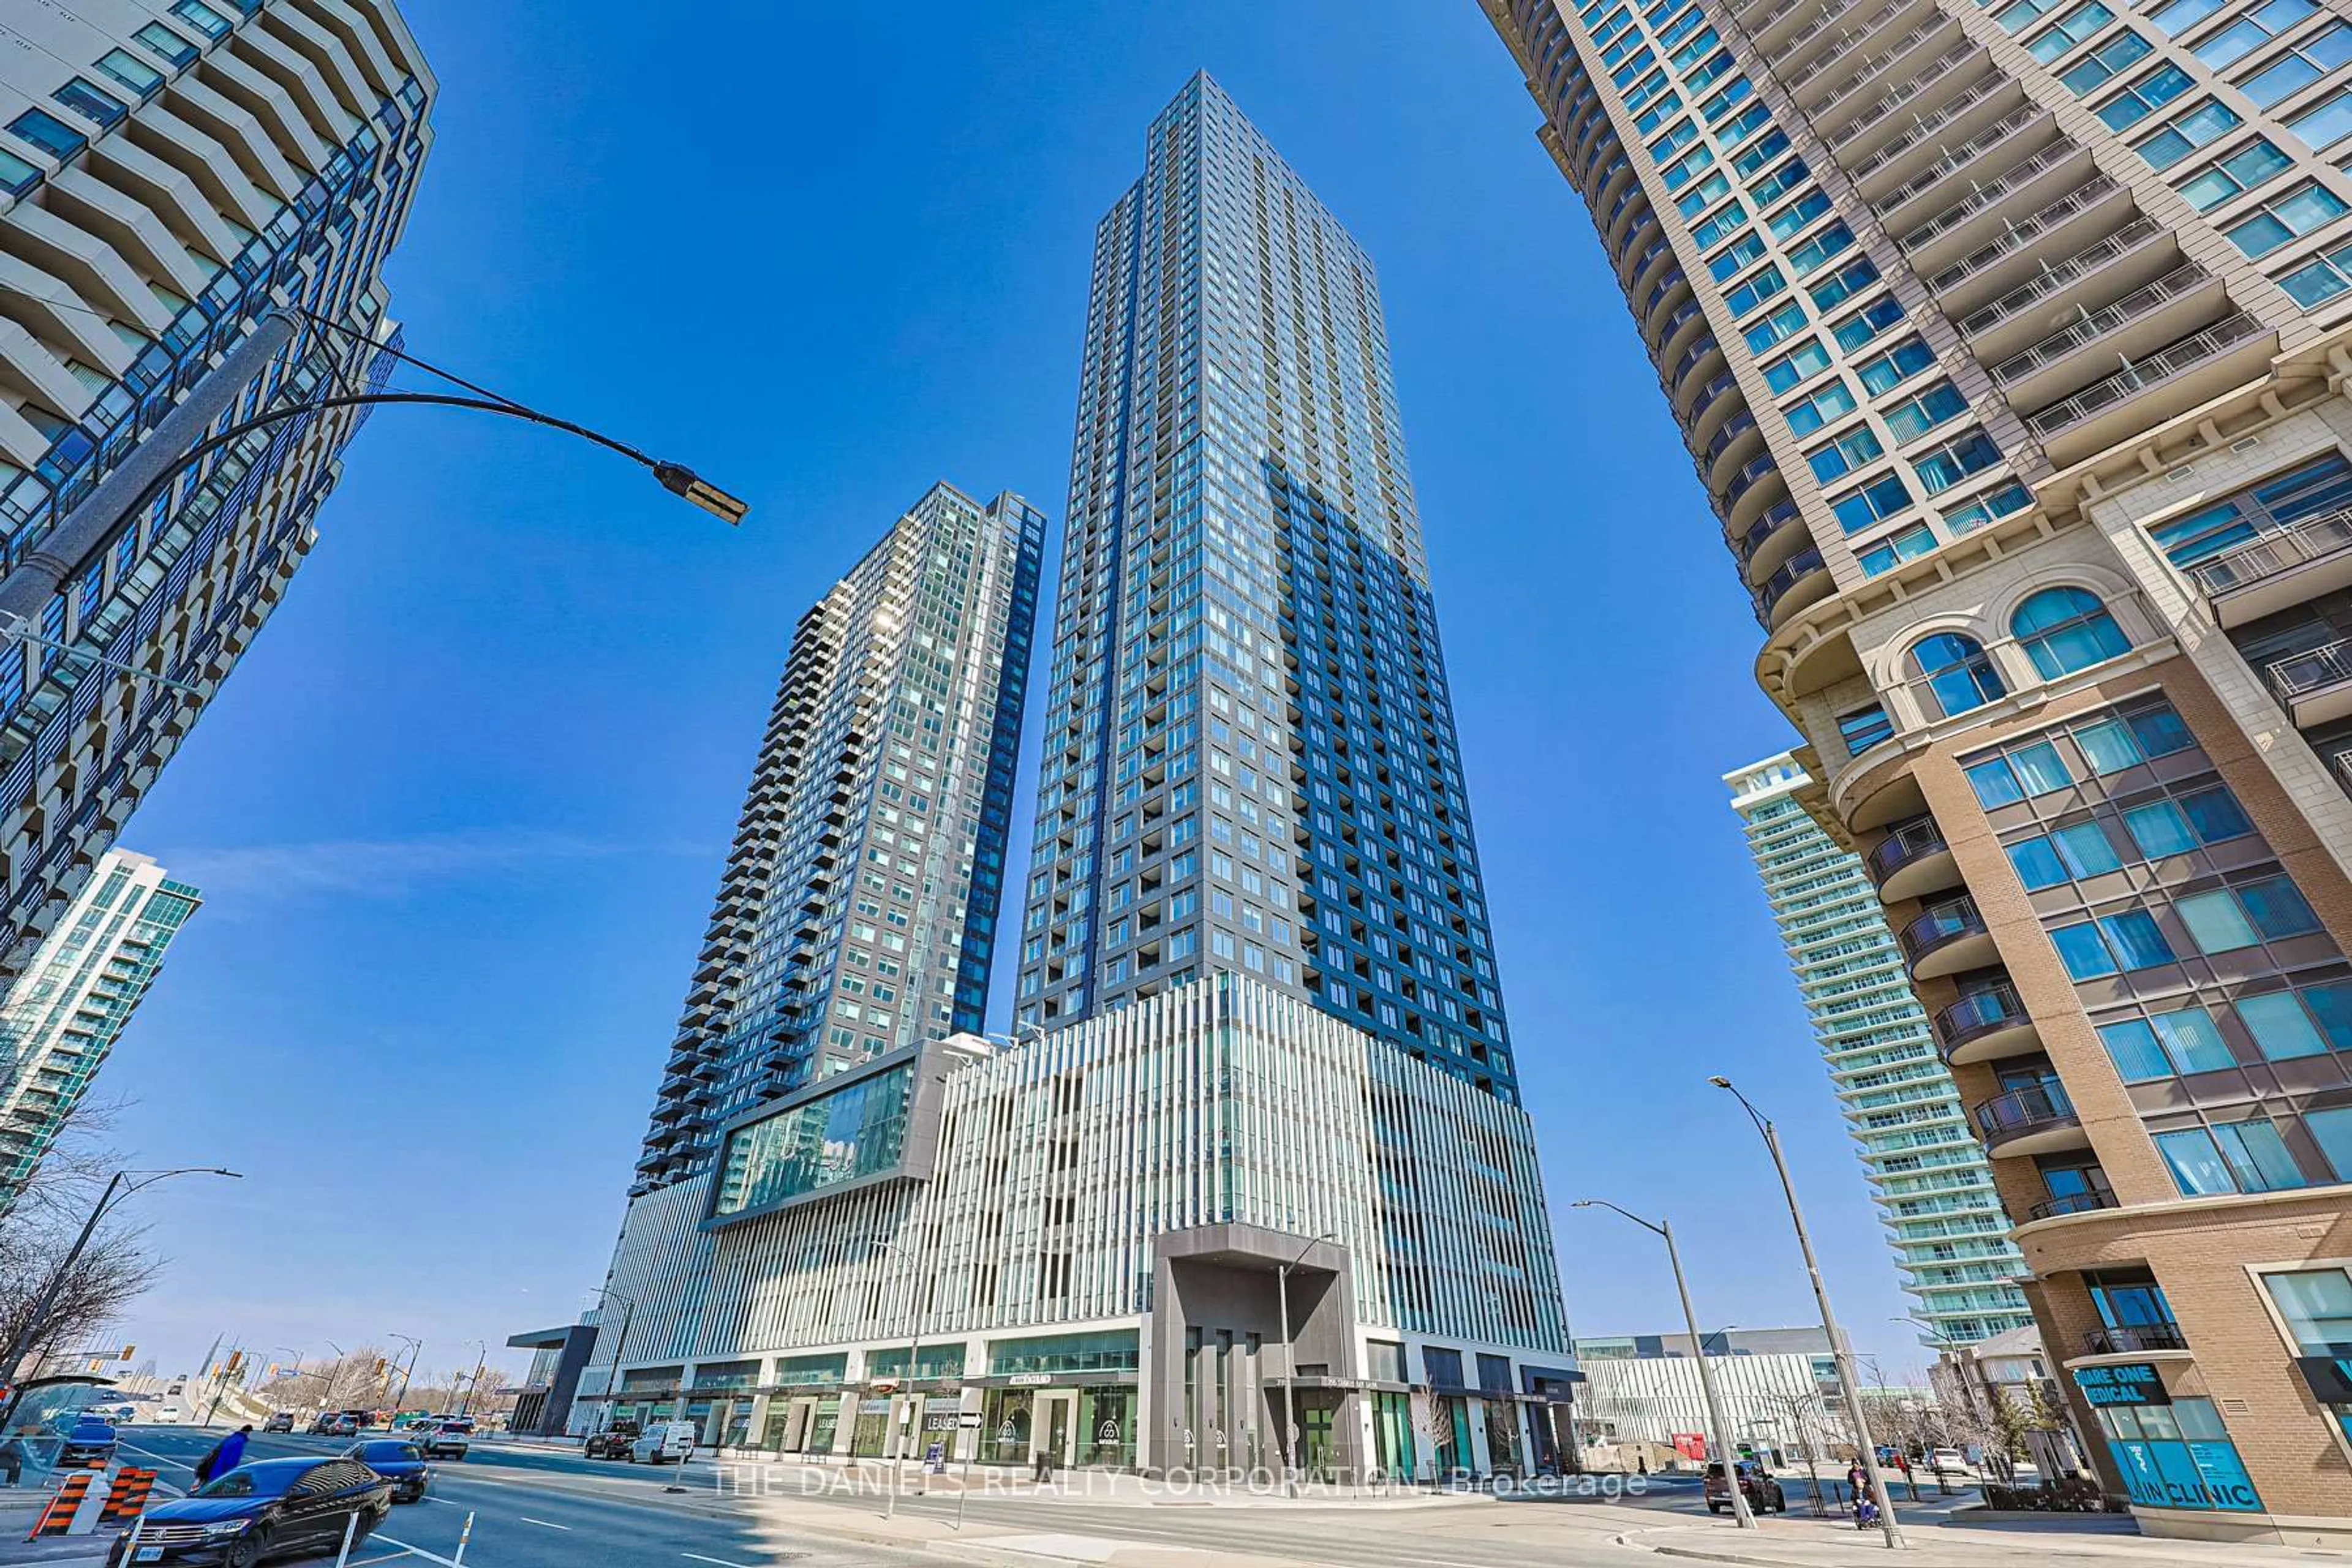
Population and Demographics
Overview
Age (%)
Household composition (%)
Mother tongue (%)
House tenancy (%)
Transportation
Car Friendly
Good access to freeways and major arteries, with a large amount of parking nearby
Pedestrian Friendly
Some day-to-day needs are within walking distance
Transit Friendly
Within walking distance of a subway and frequent bus lines
Shopping, Food and Nightlife
Cafes
Some cafés within walking distance
Groceries
At least one grocery store within a few minutes' walk
Nightlife
Few or no bars within walking distance
Shopping
Variety of shops within a few minutes' walk
Restaurants
Variety of restaurants within walking distance