The Smarter, Faster, Dreamier Home Search.
With Wahi, your perfect home finds you.
Property type
Bedrooms
Bathrooms
Great REALTORS®. Modern Tools. A Smarter Experience.
Get full-service support from a Wahi Select Realtor in your area — powered by data, driven by results.
As Featured In:


Homes for Sale
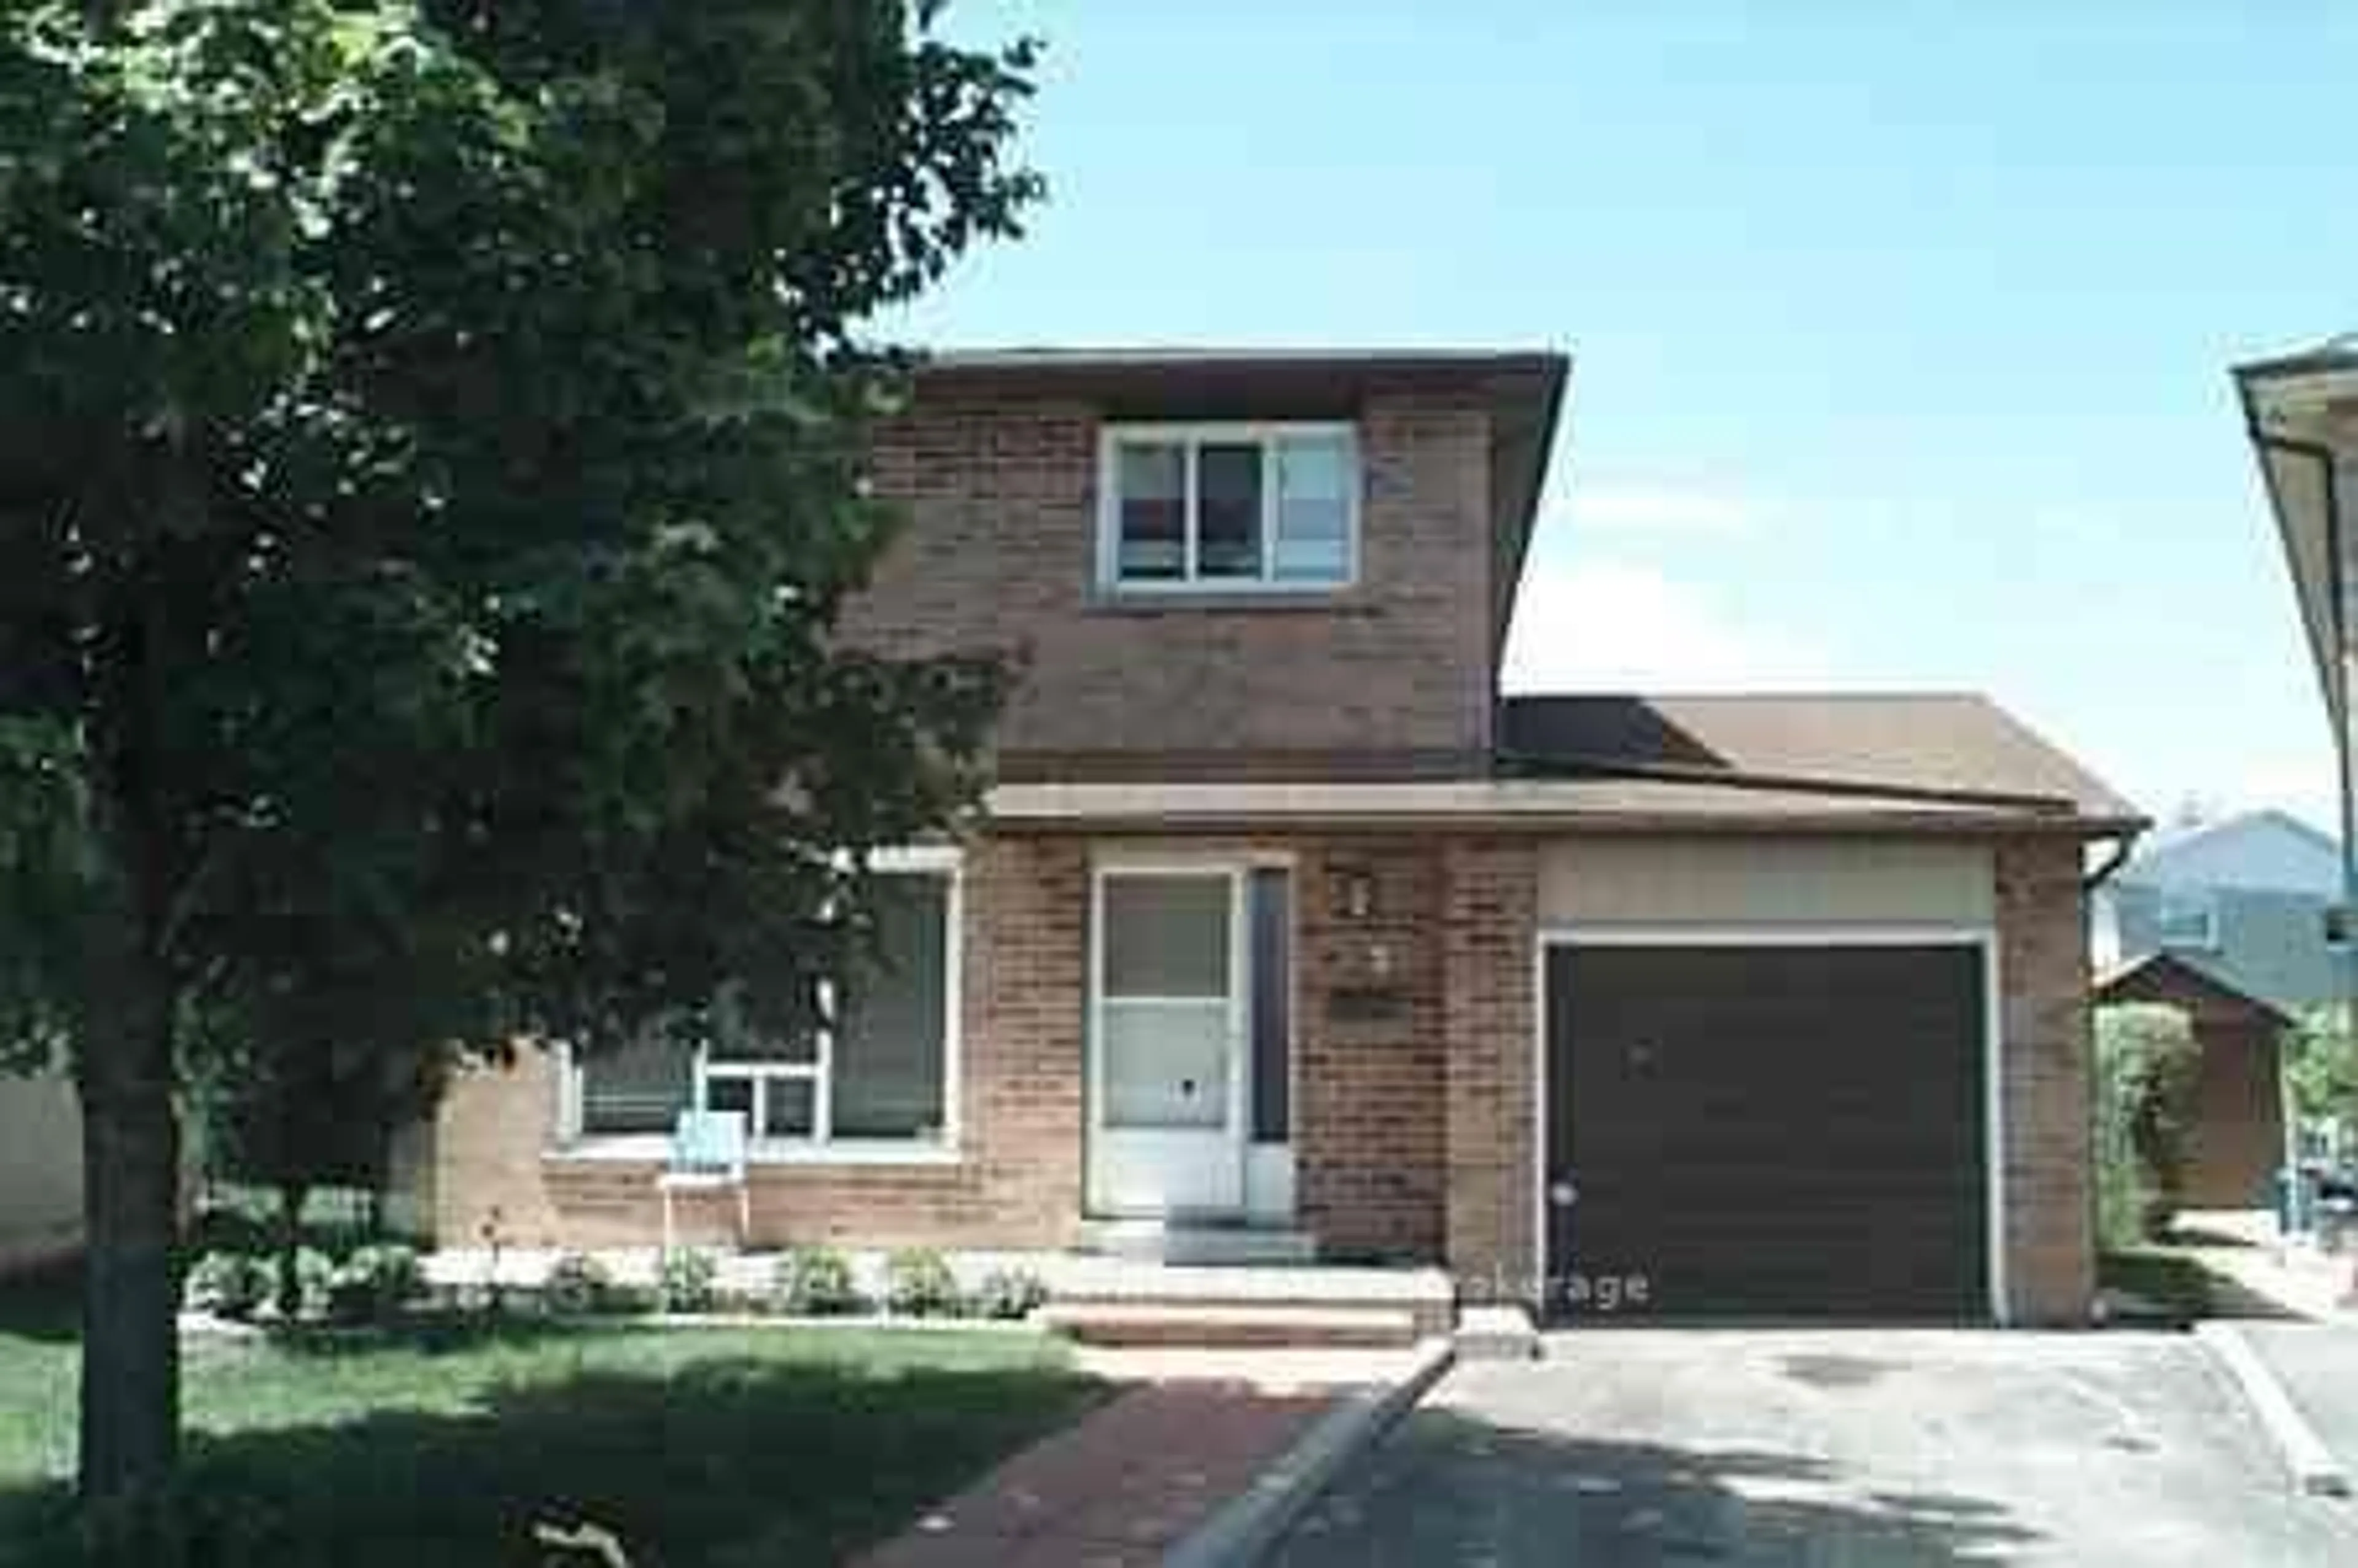
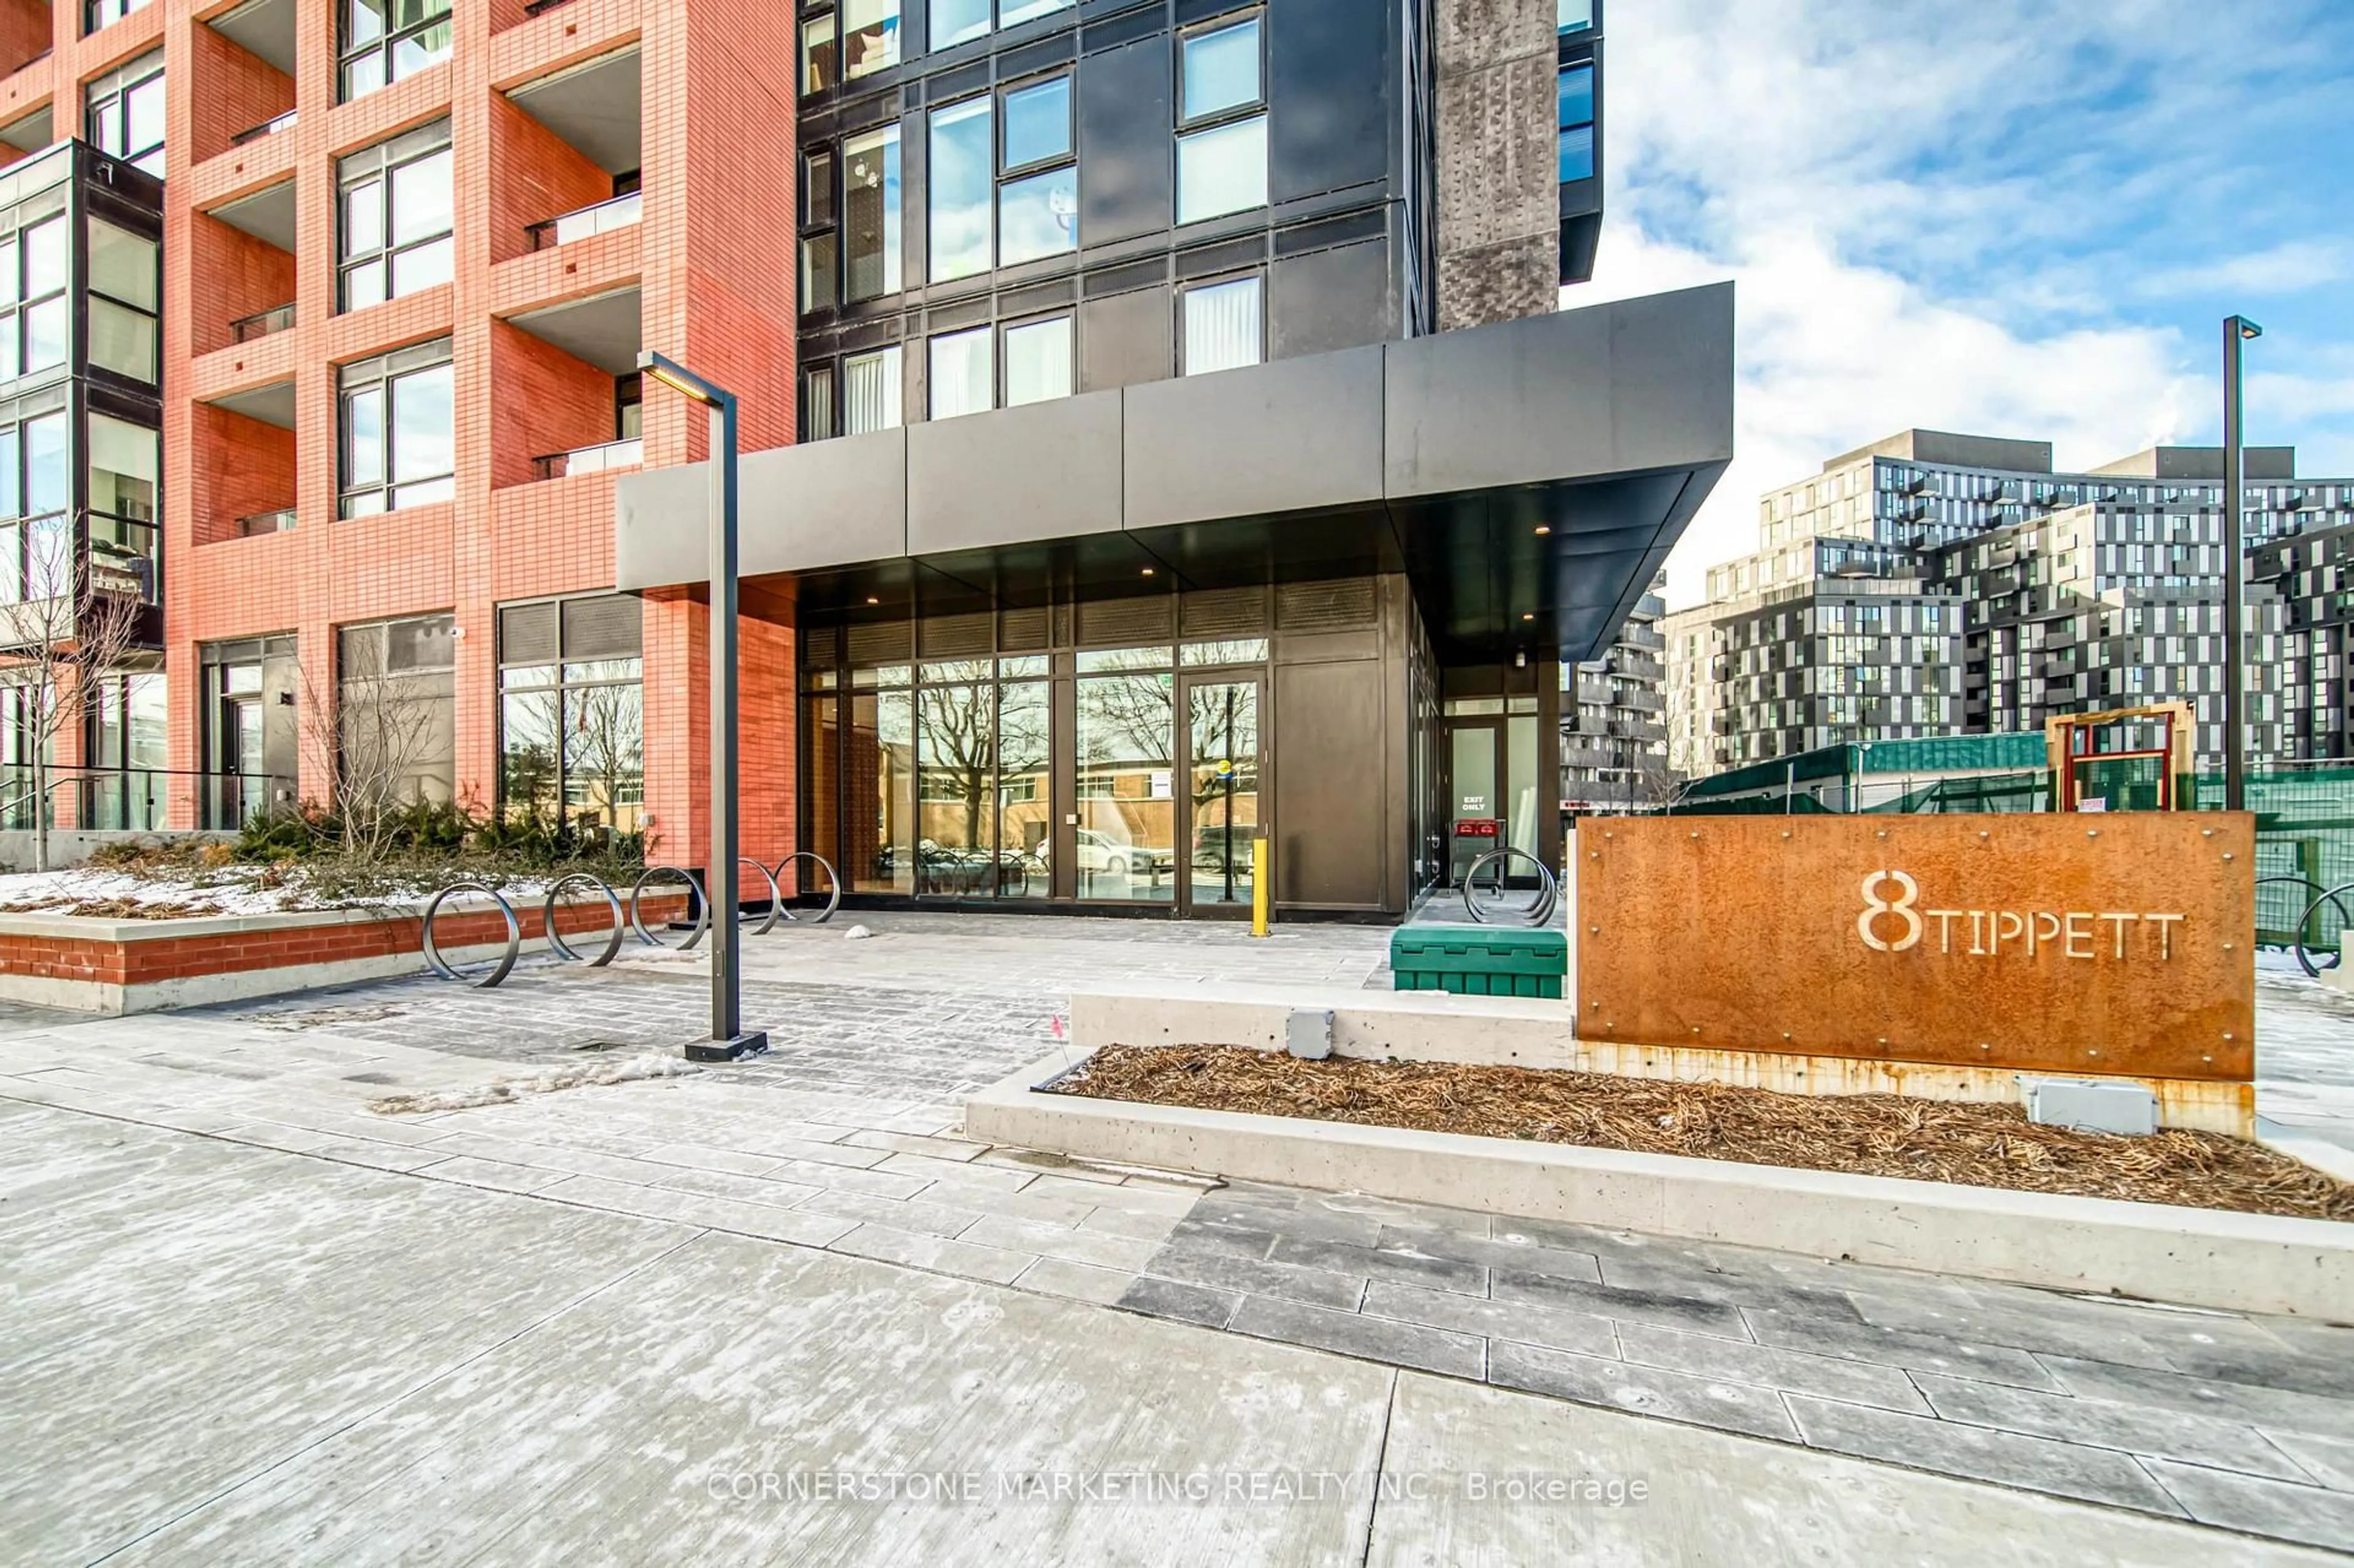
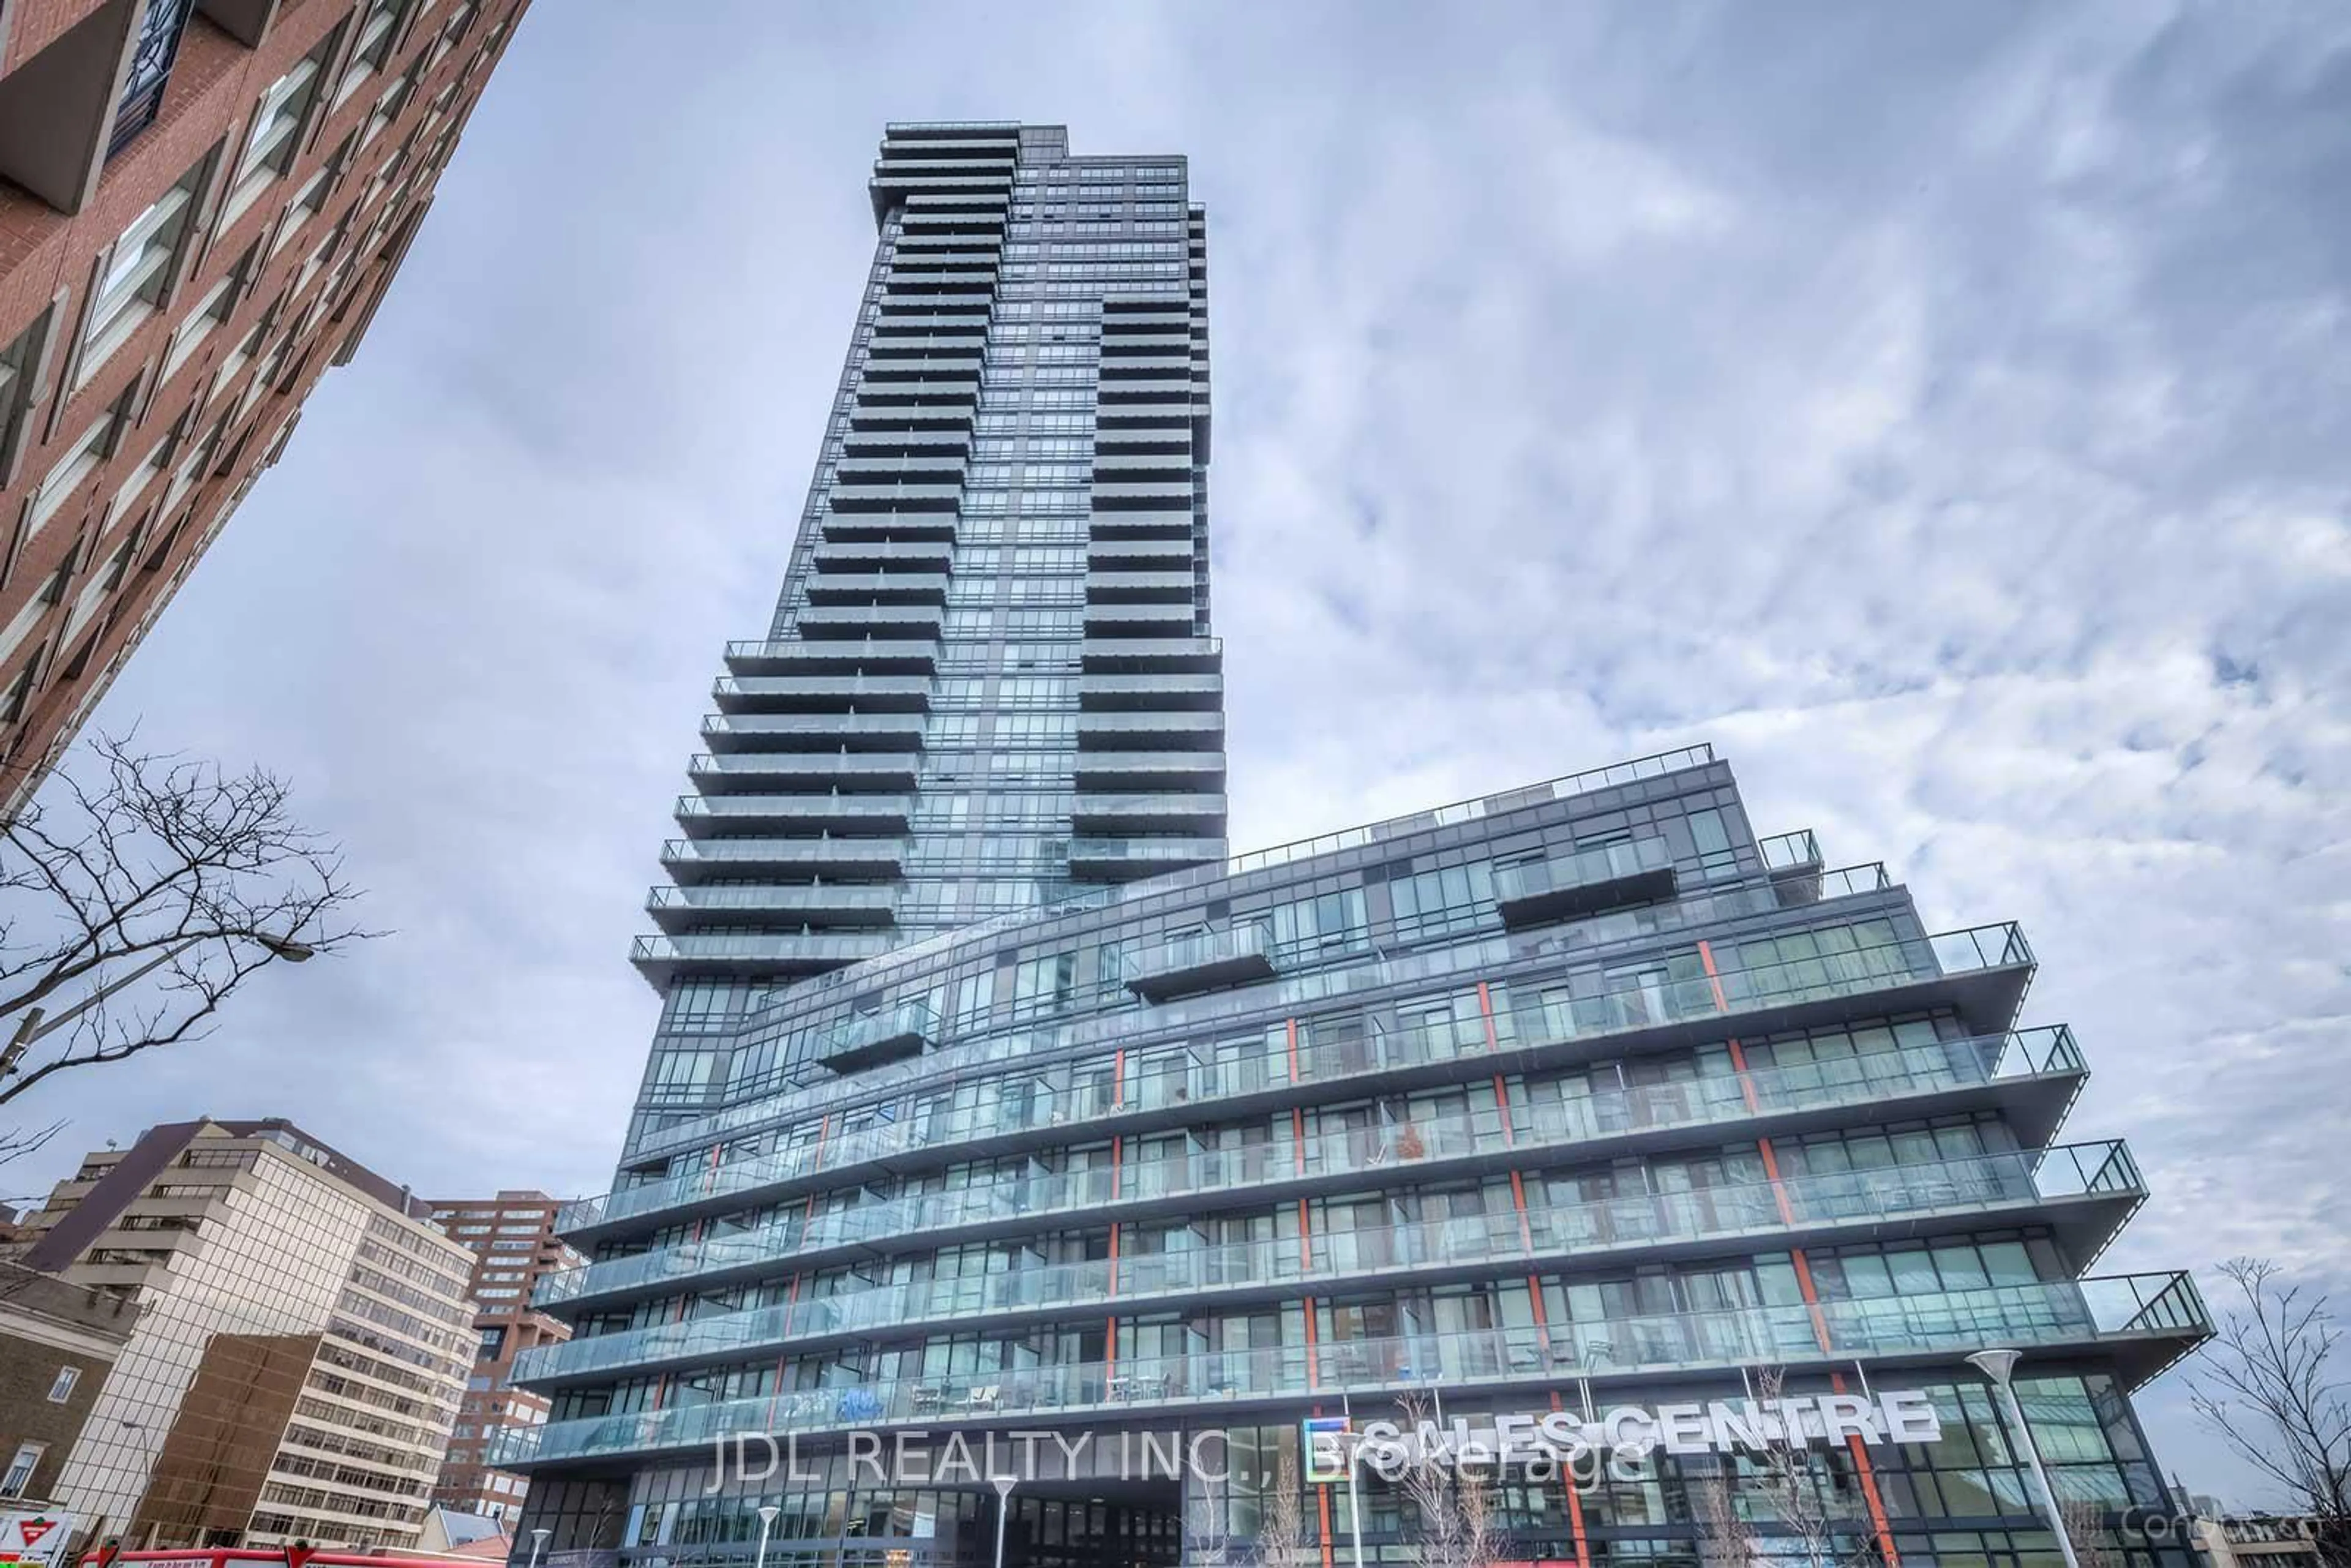
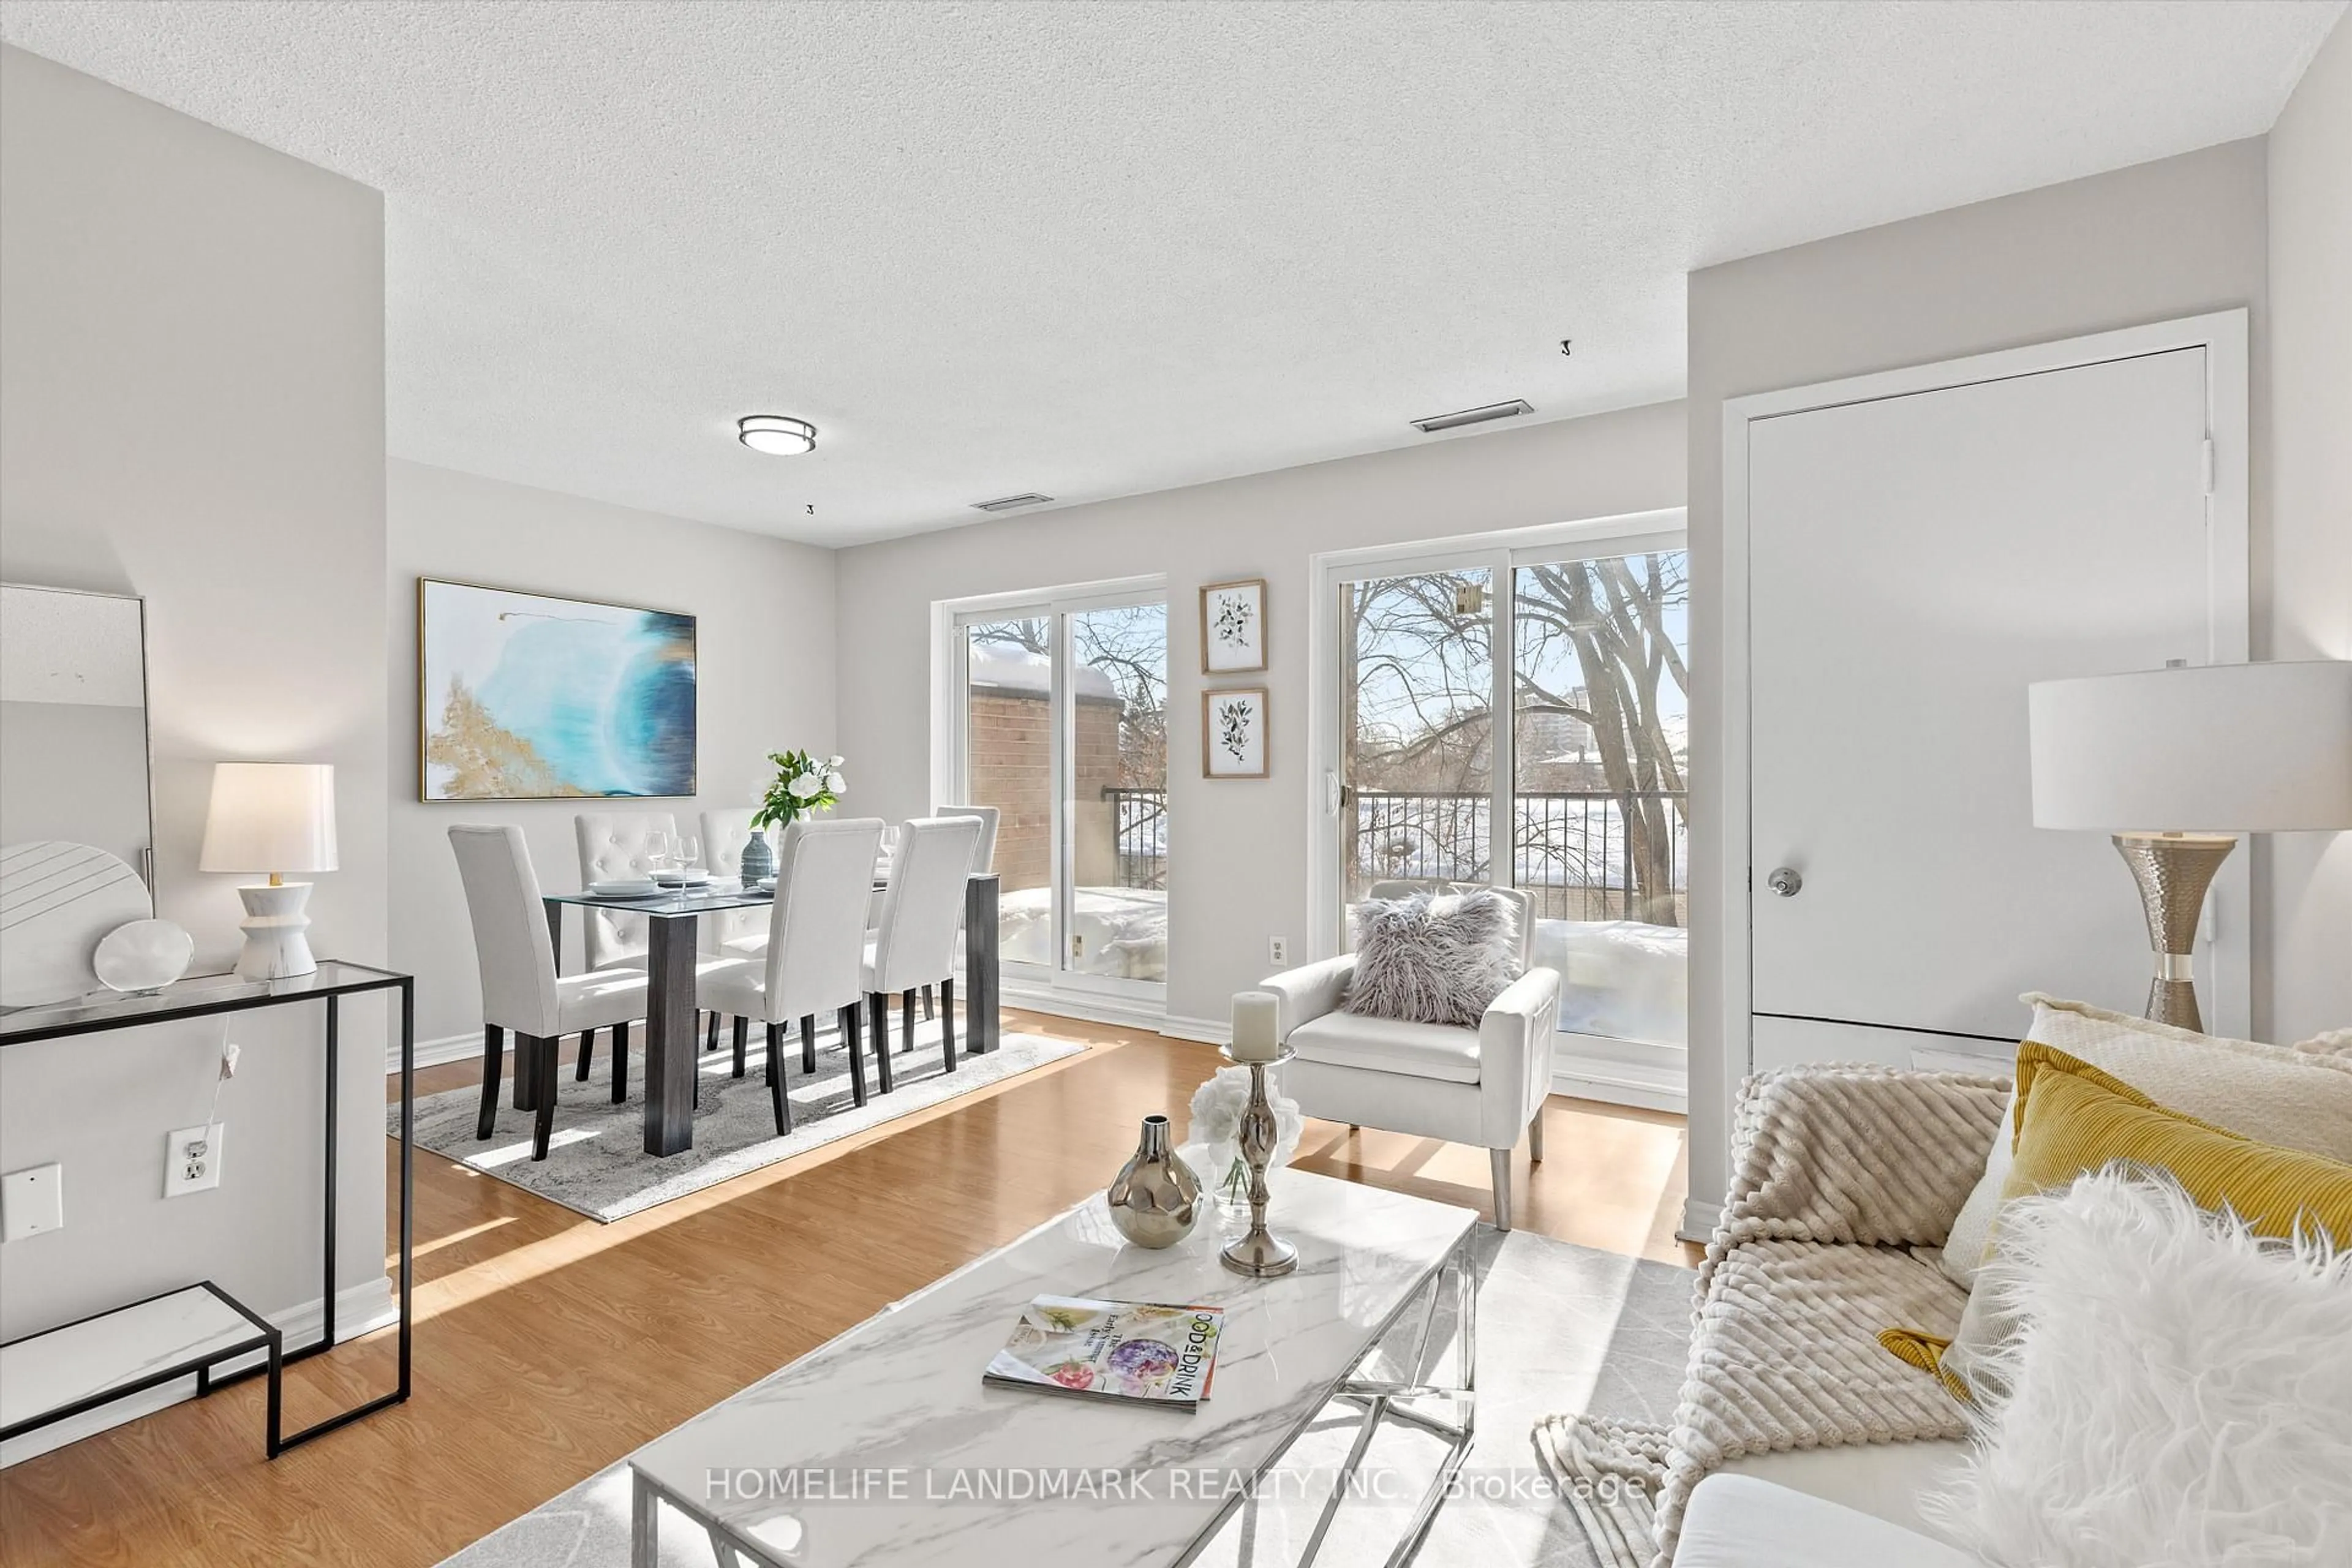
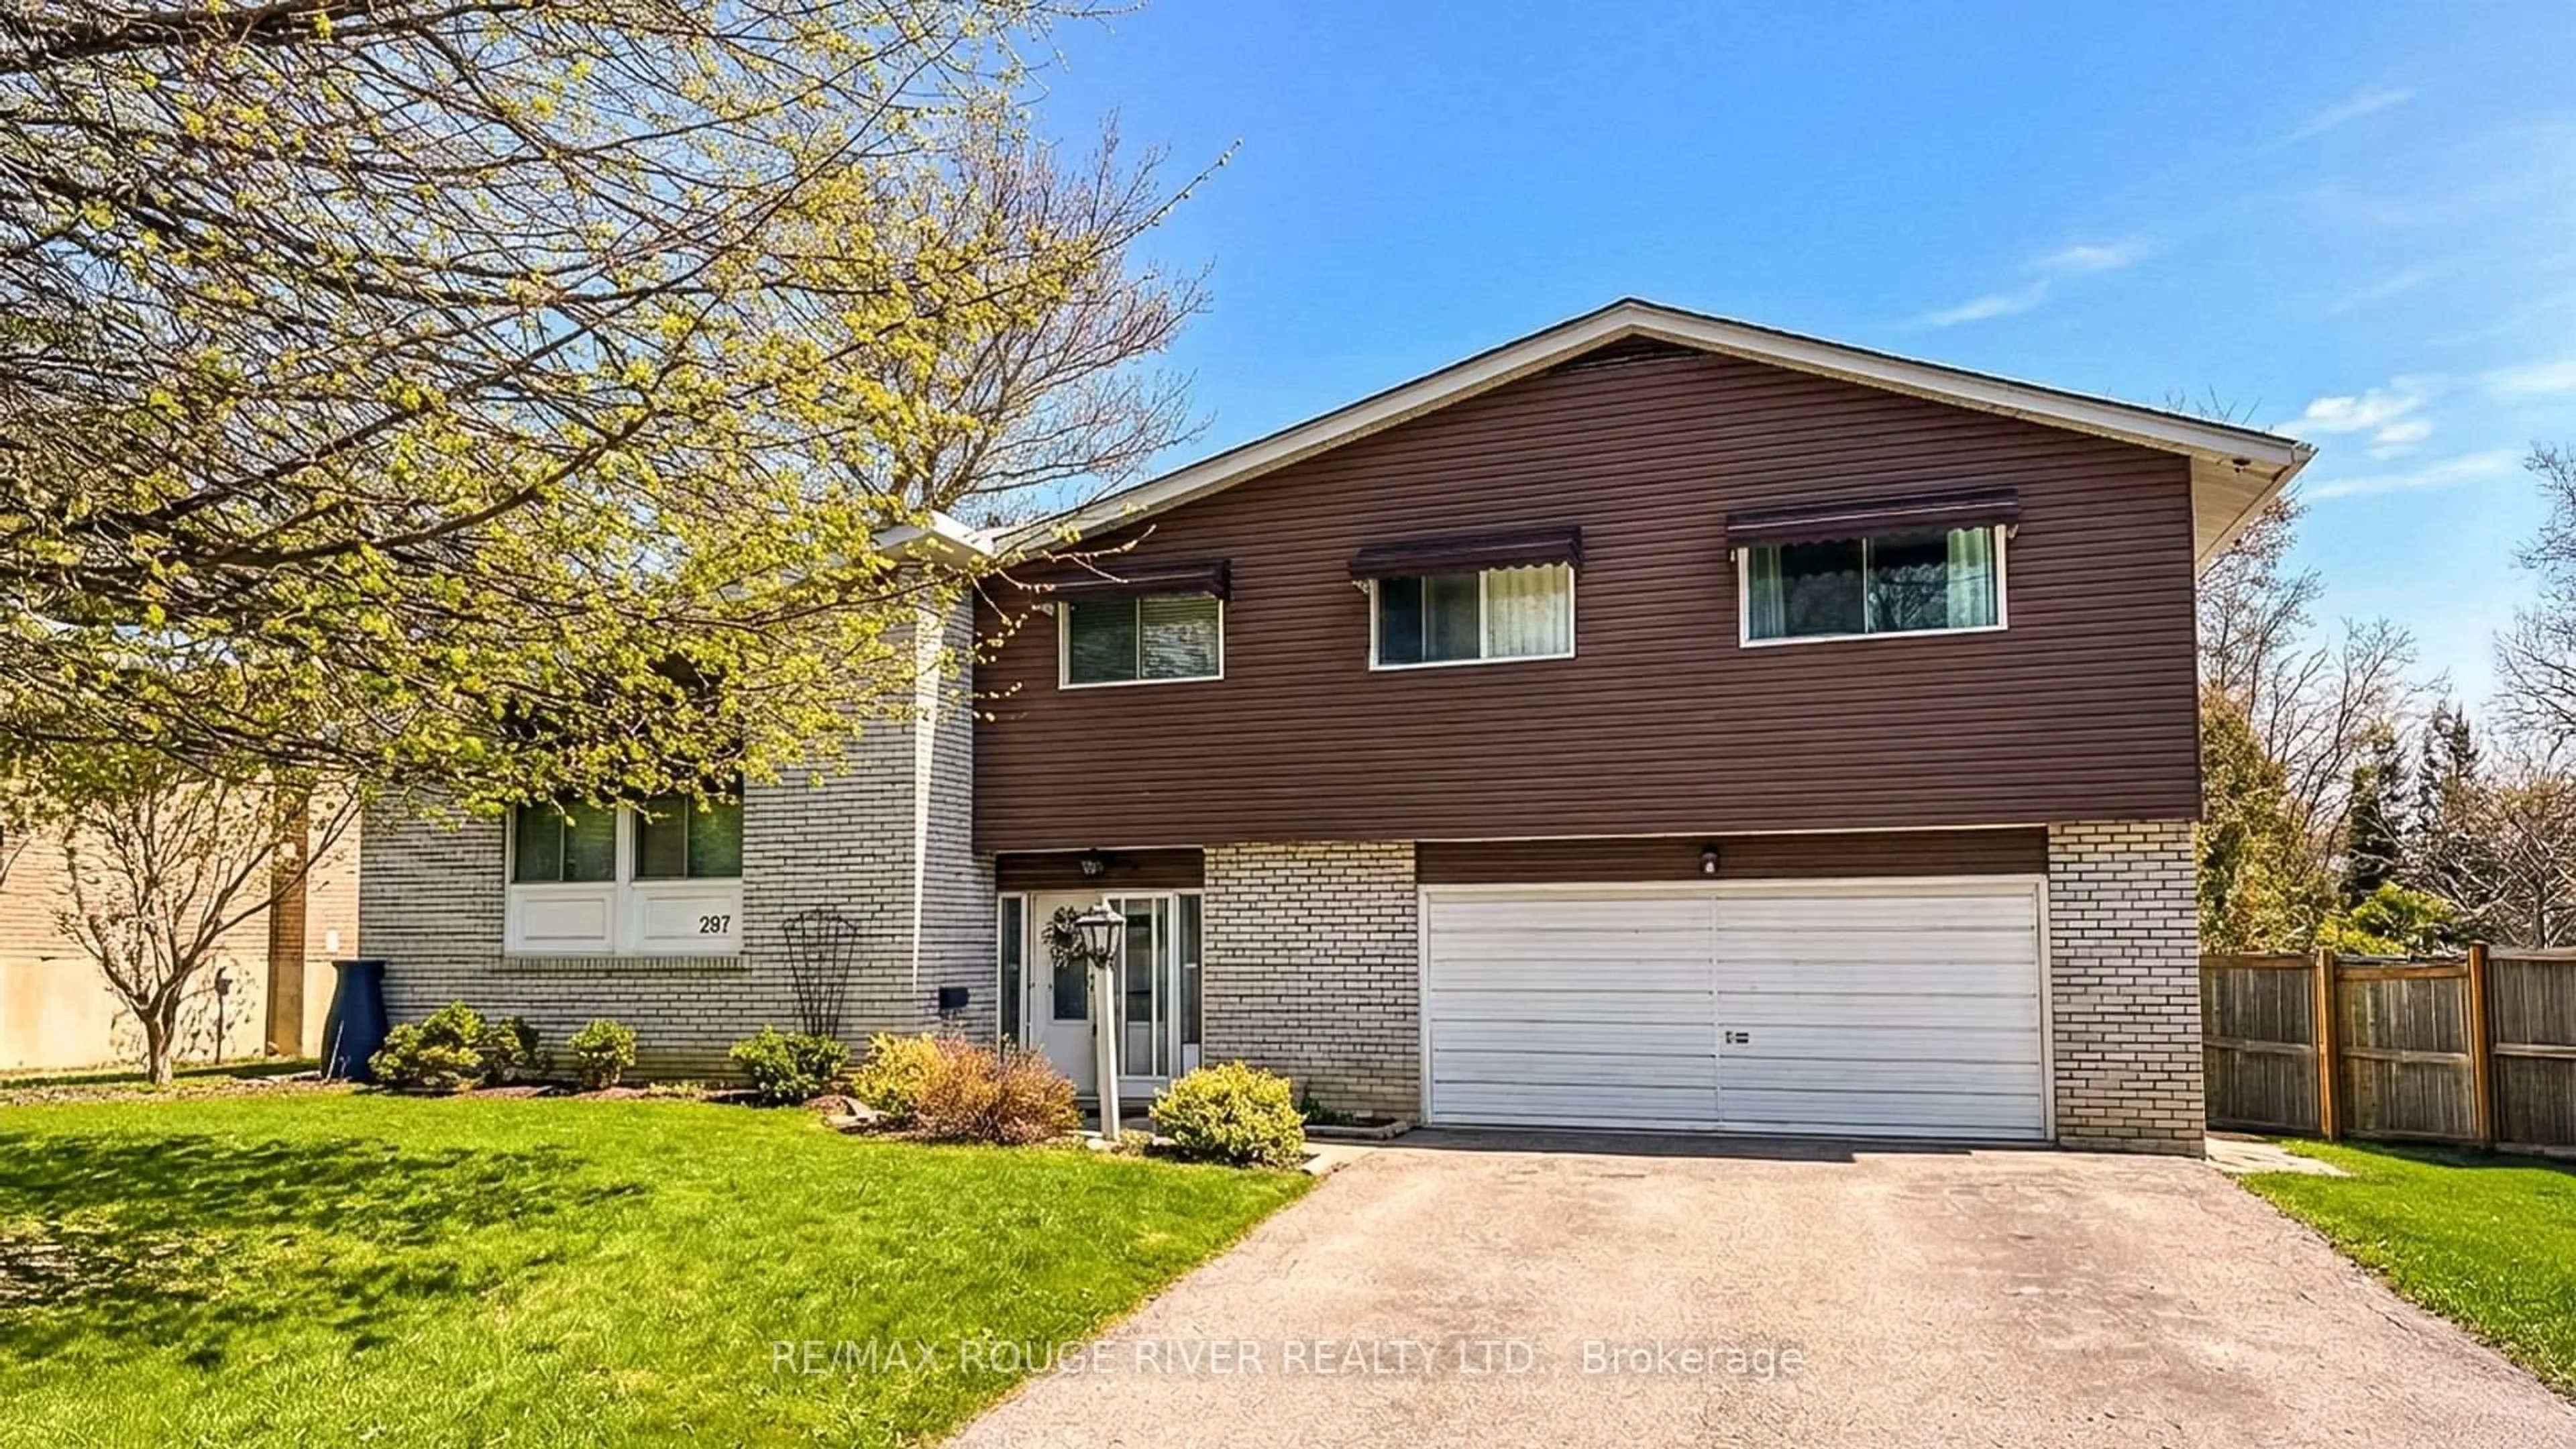
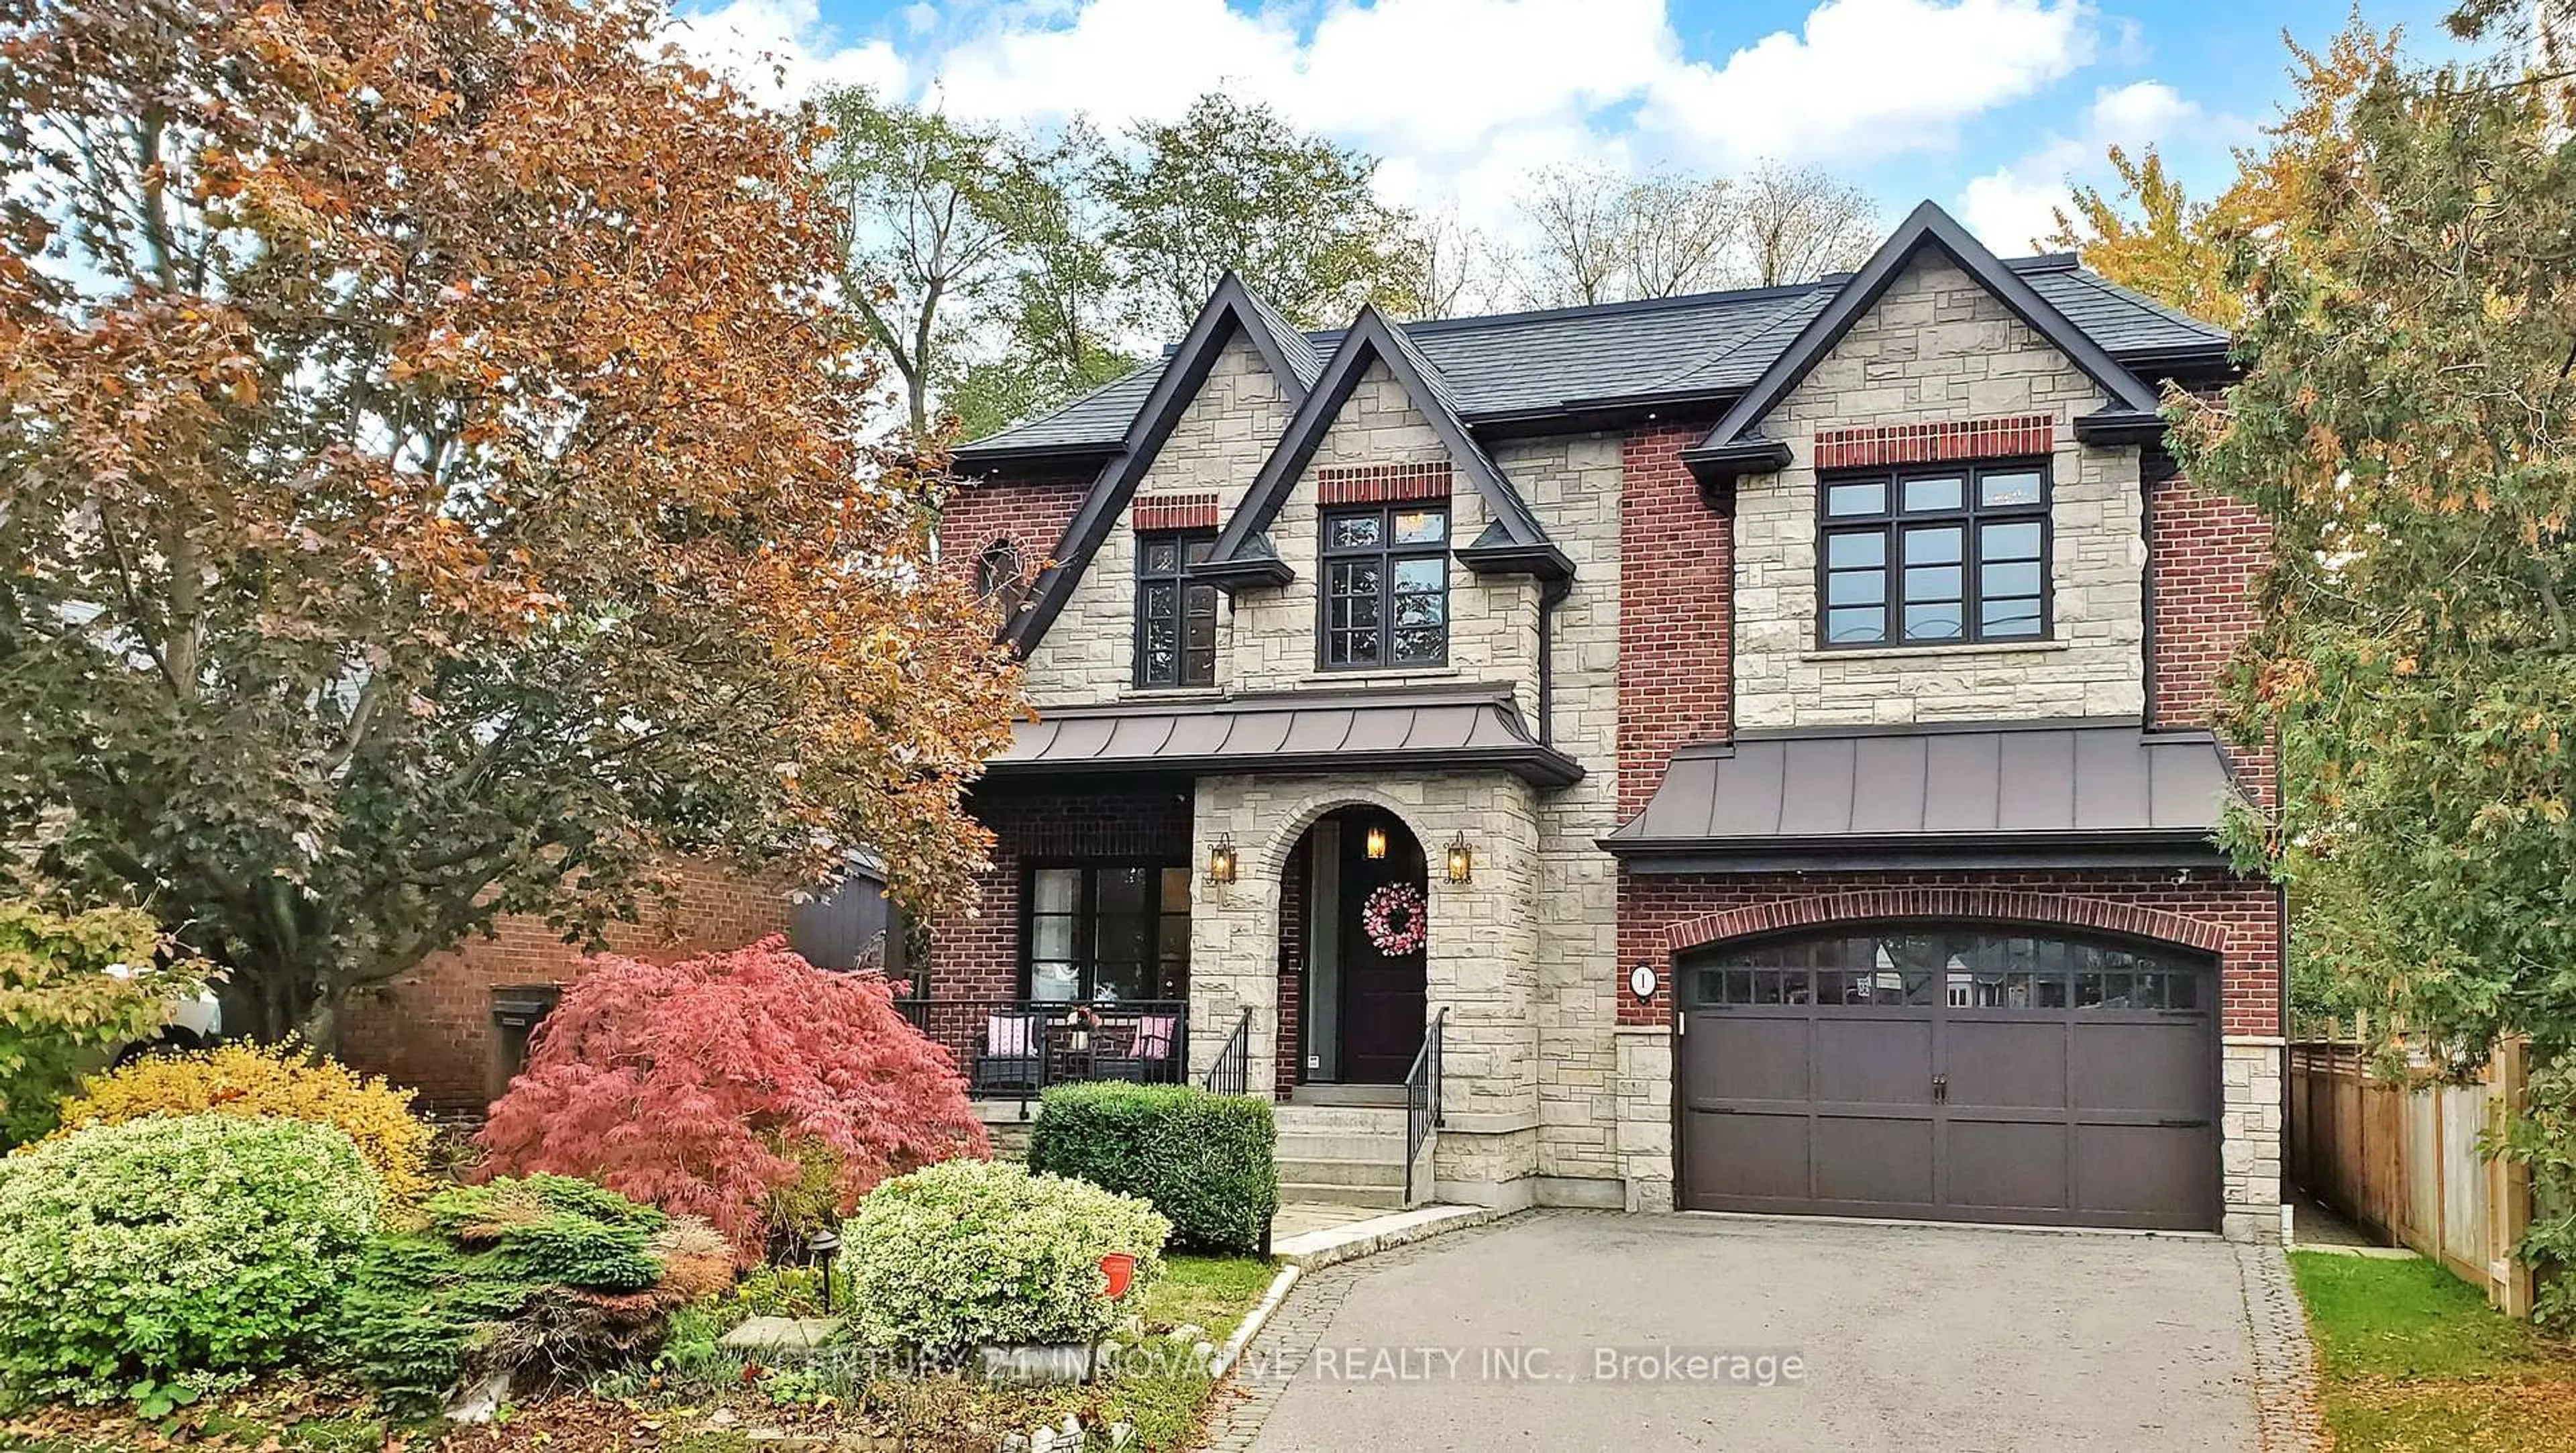
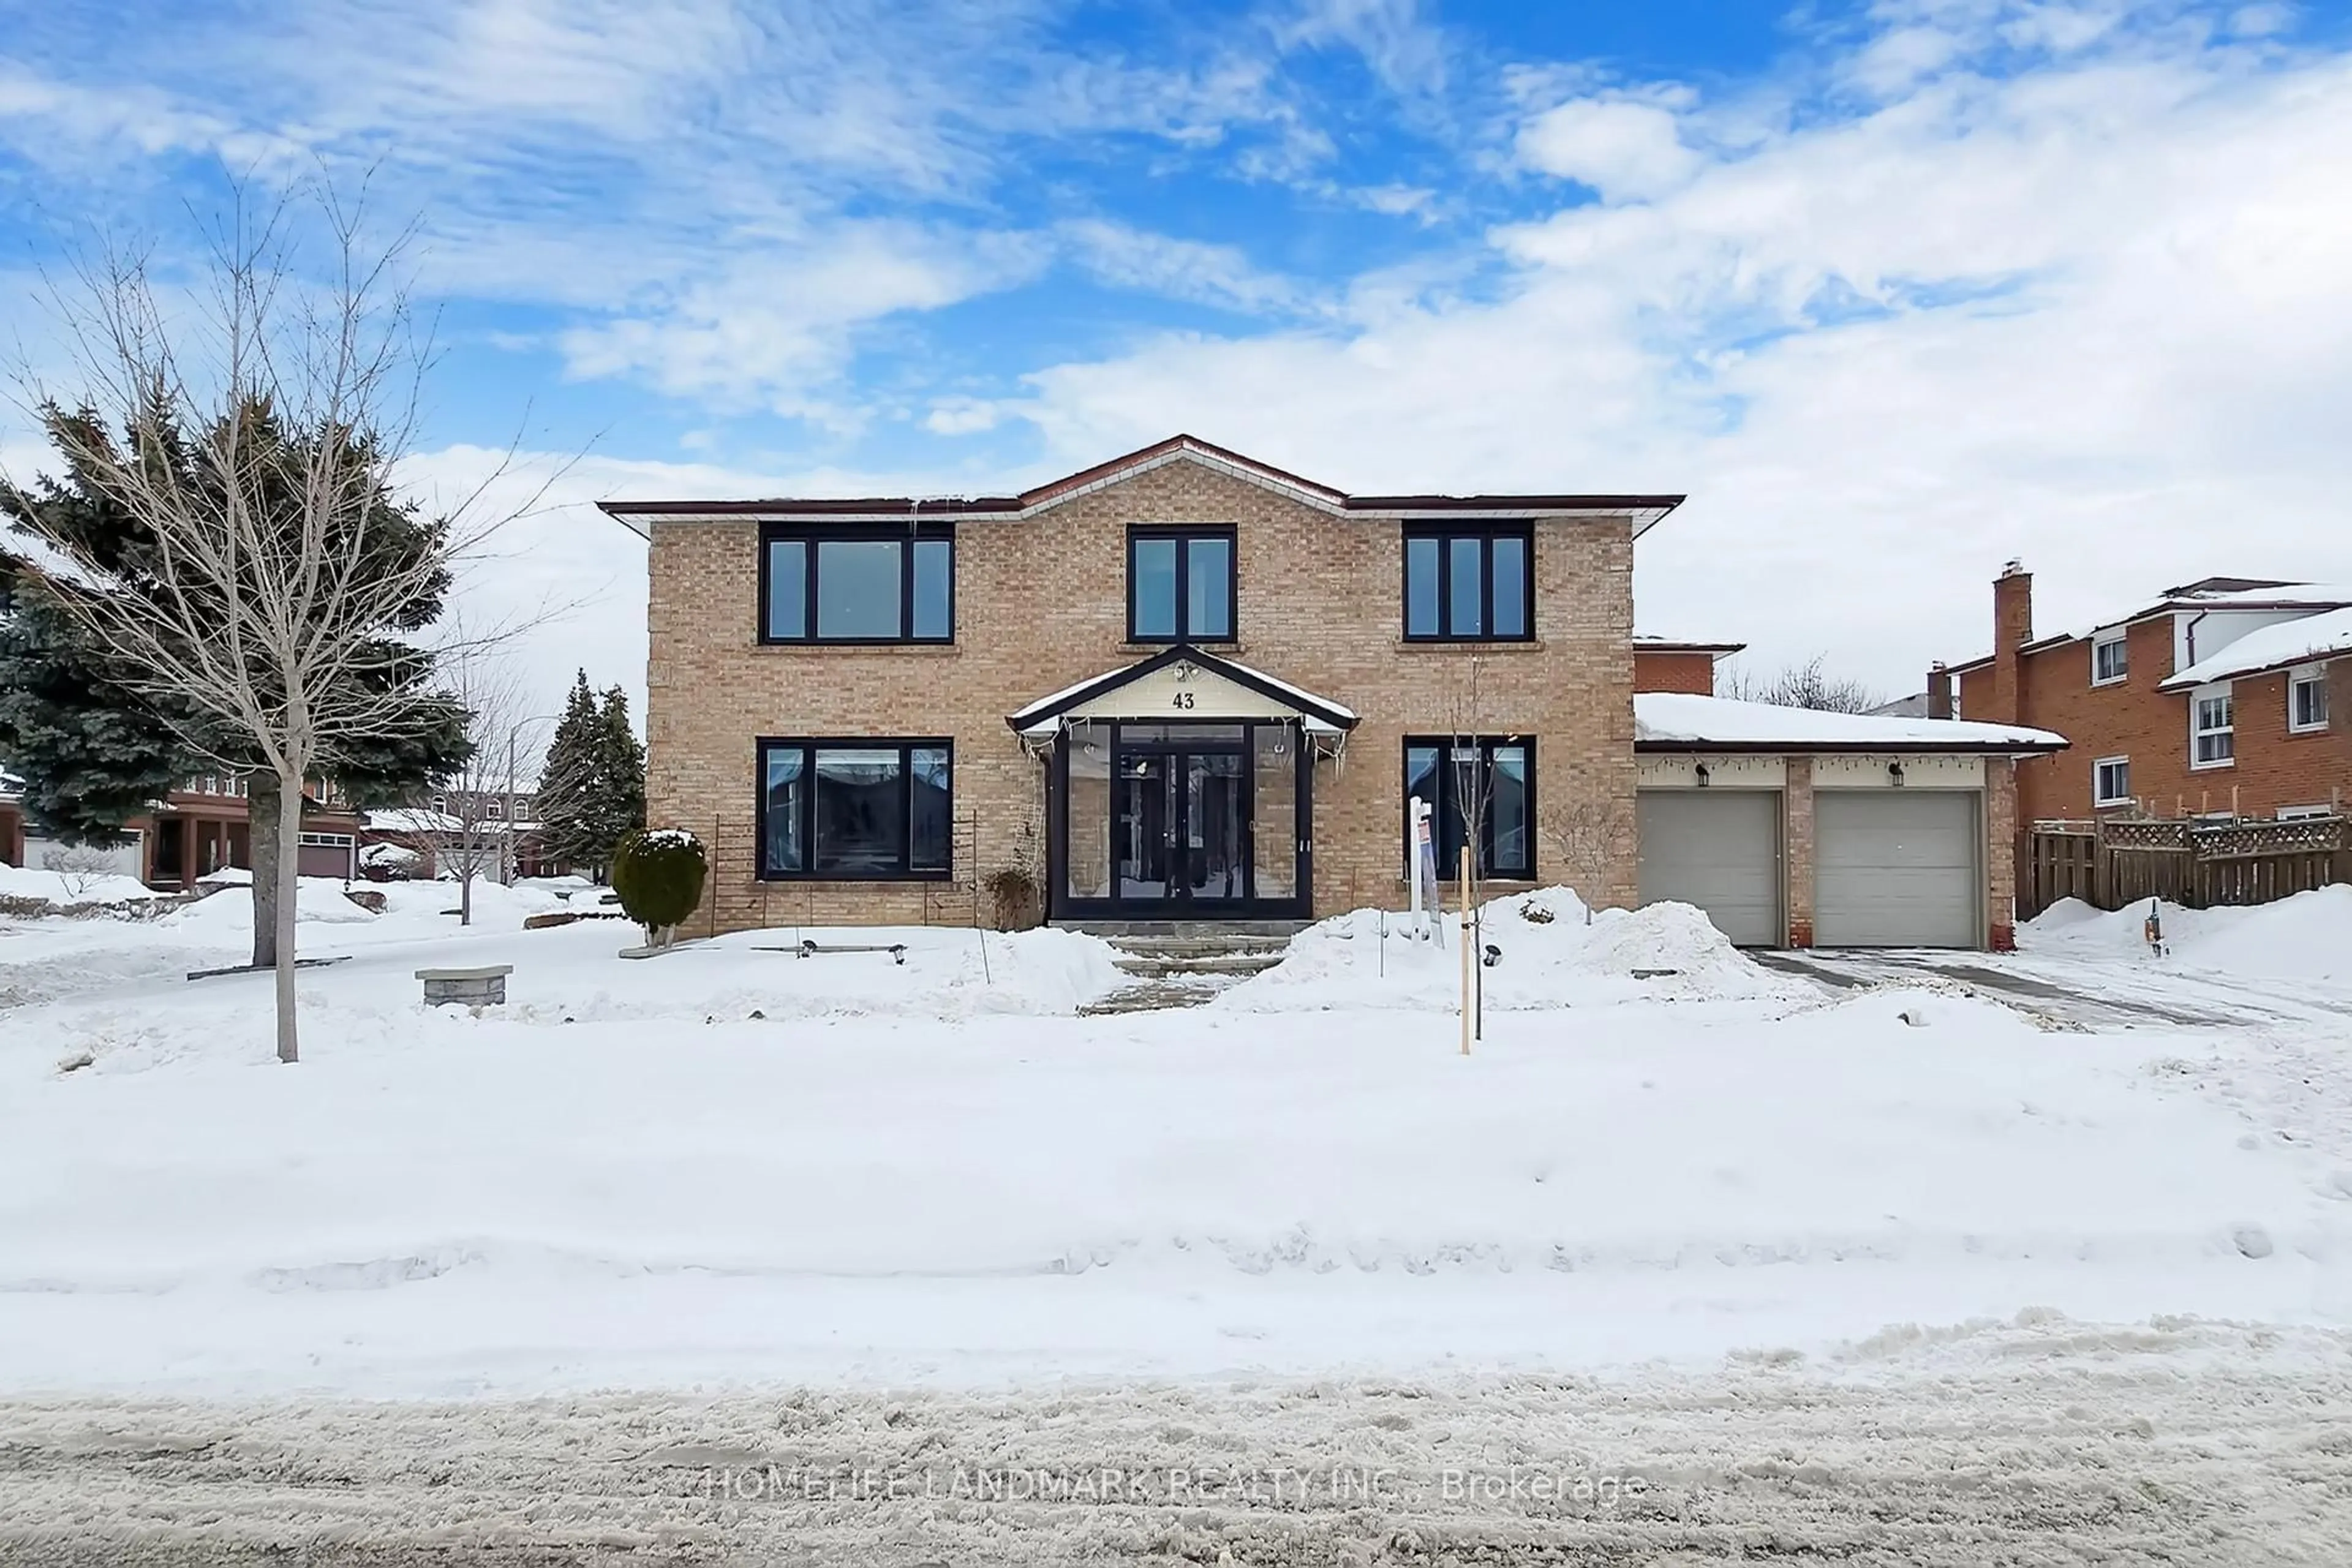
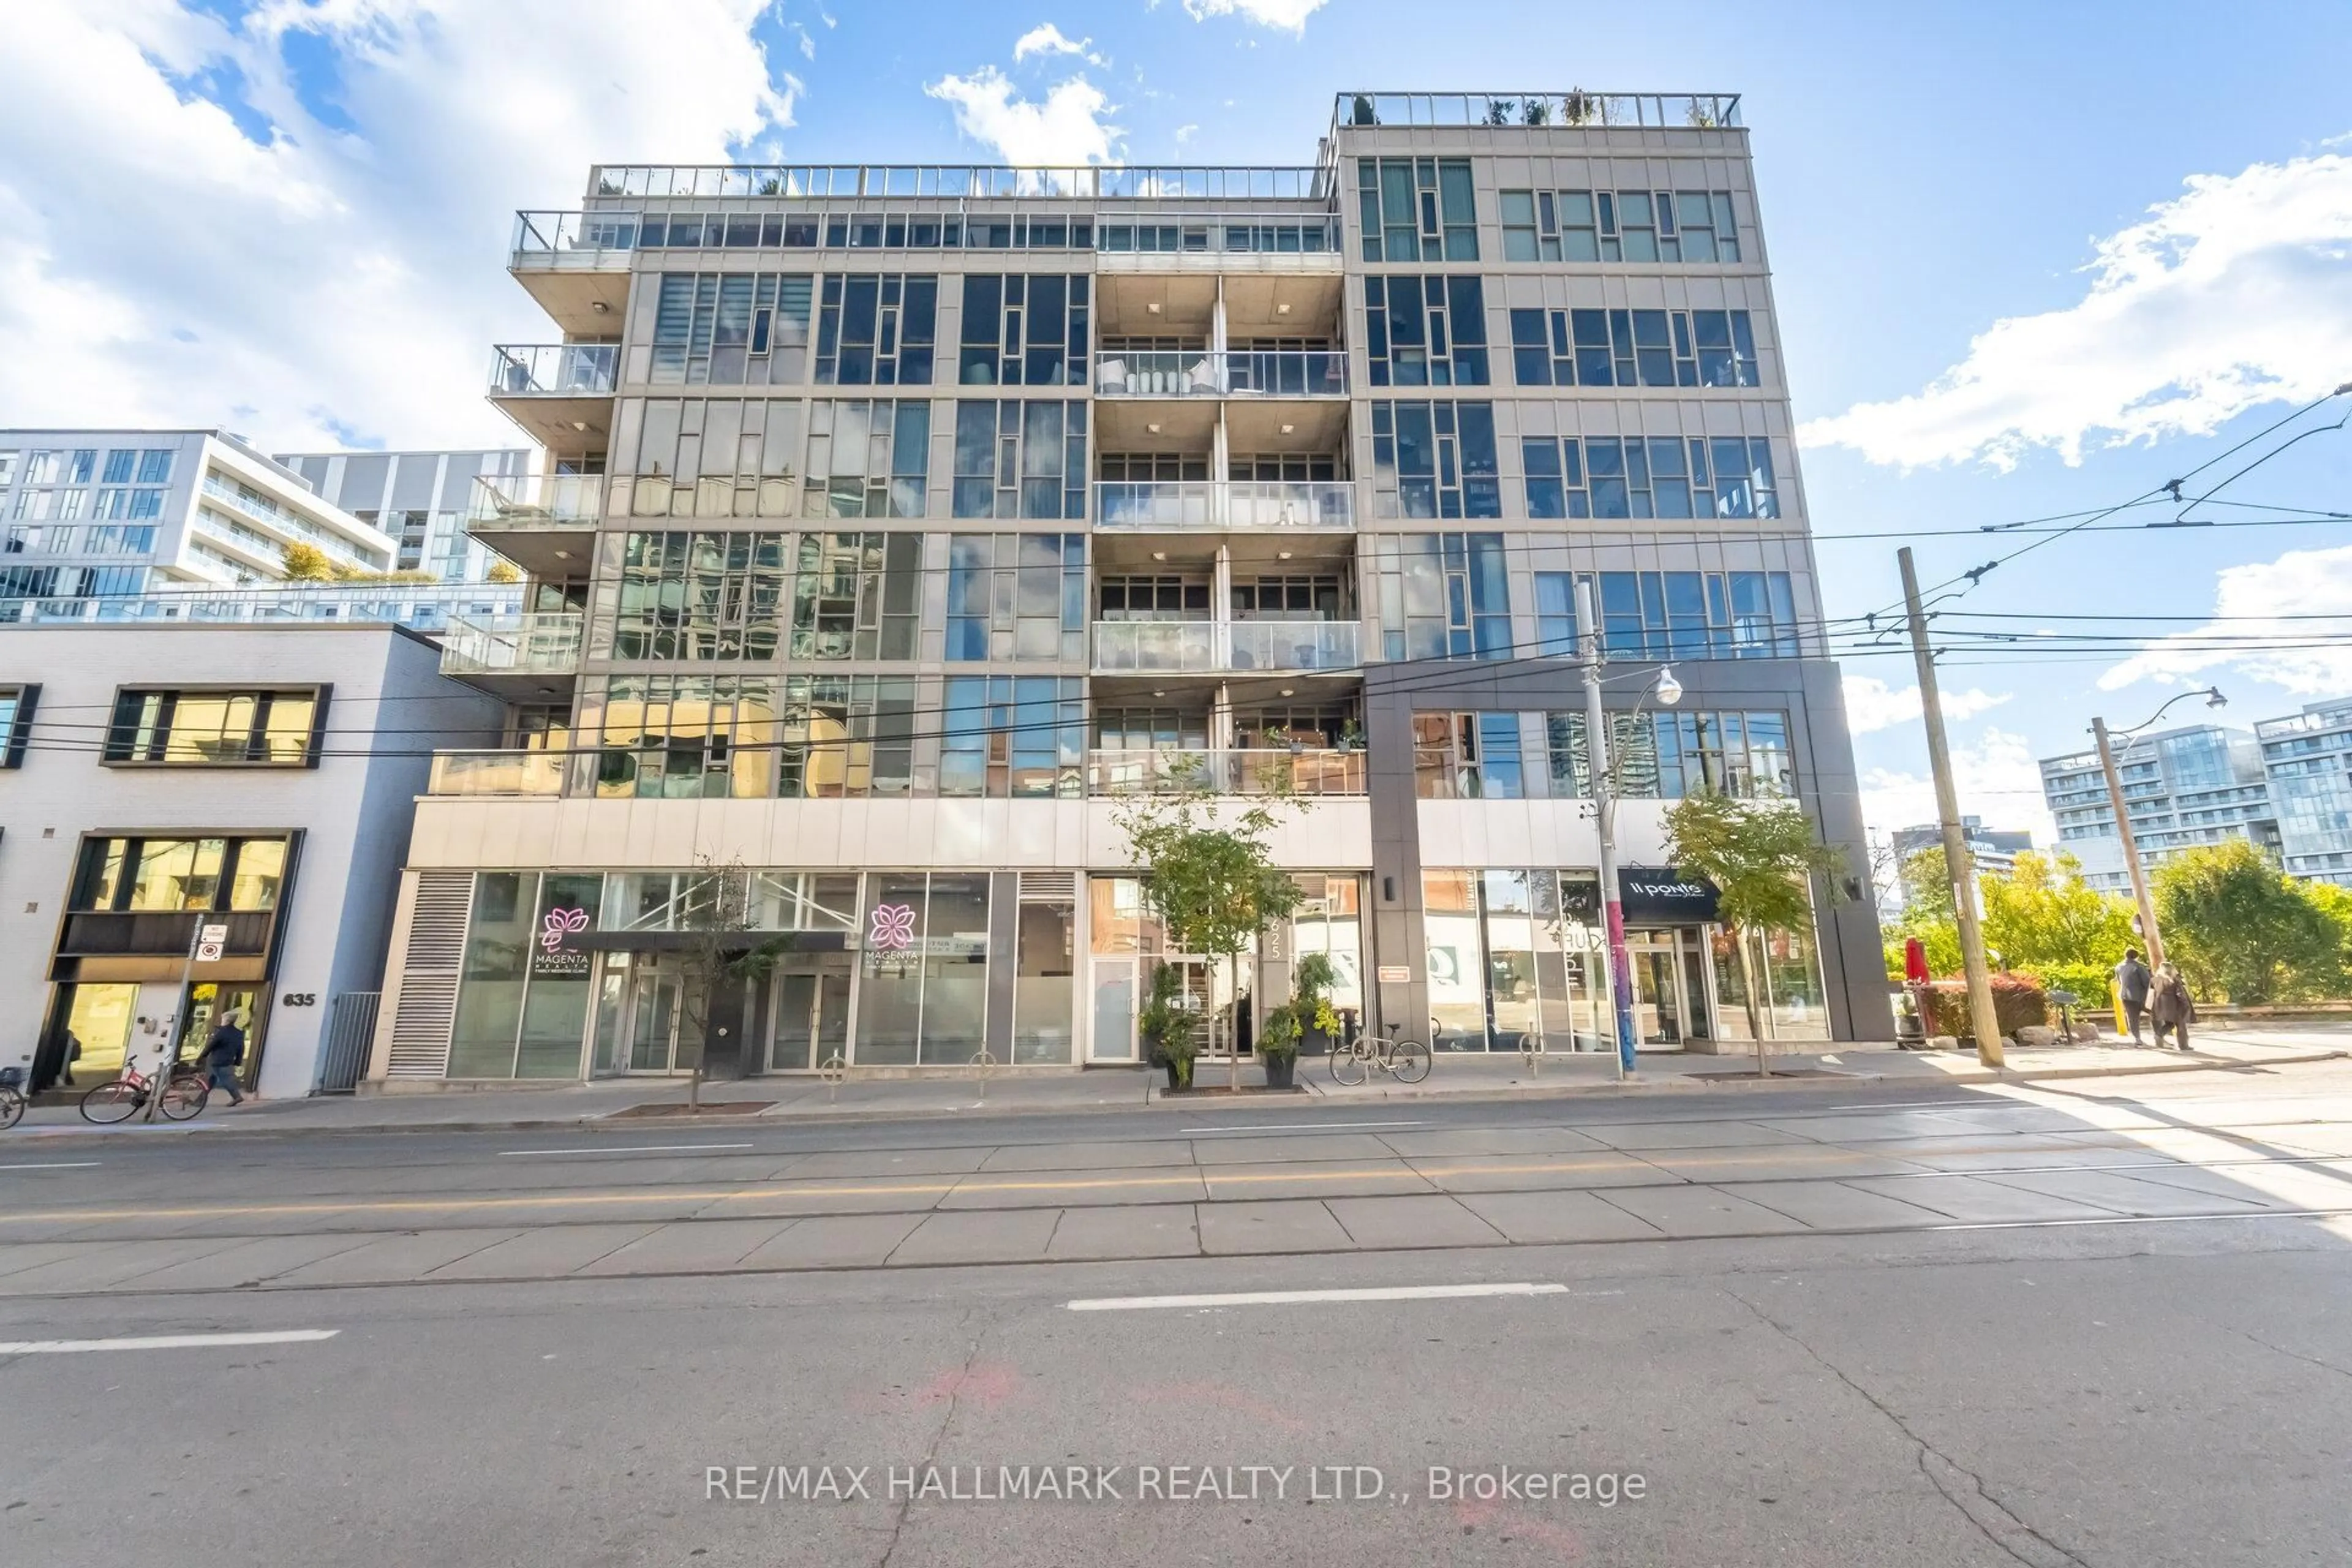
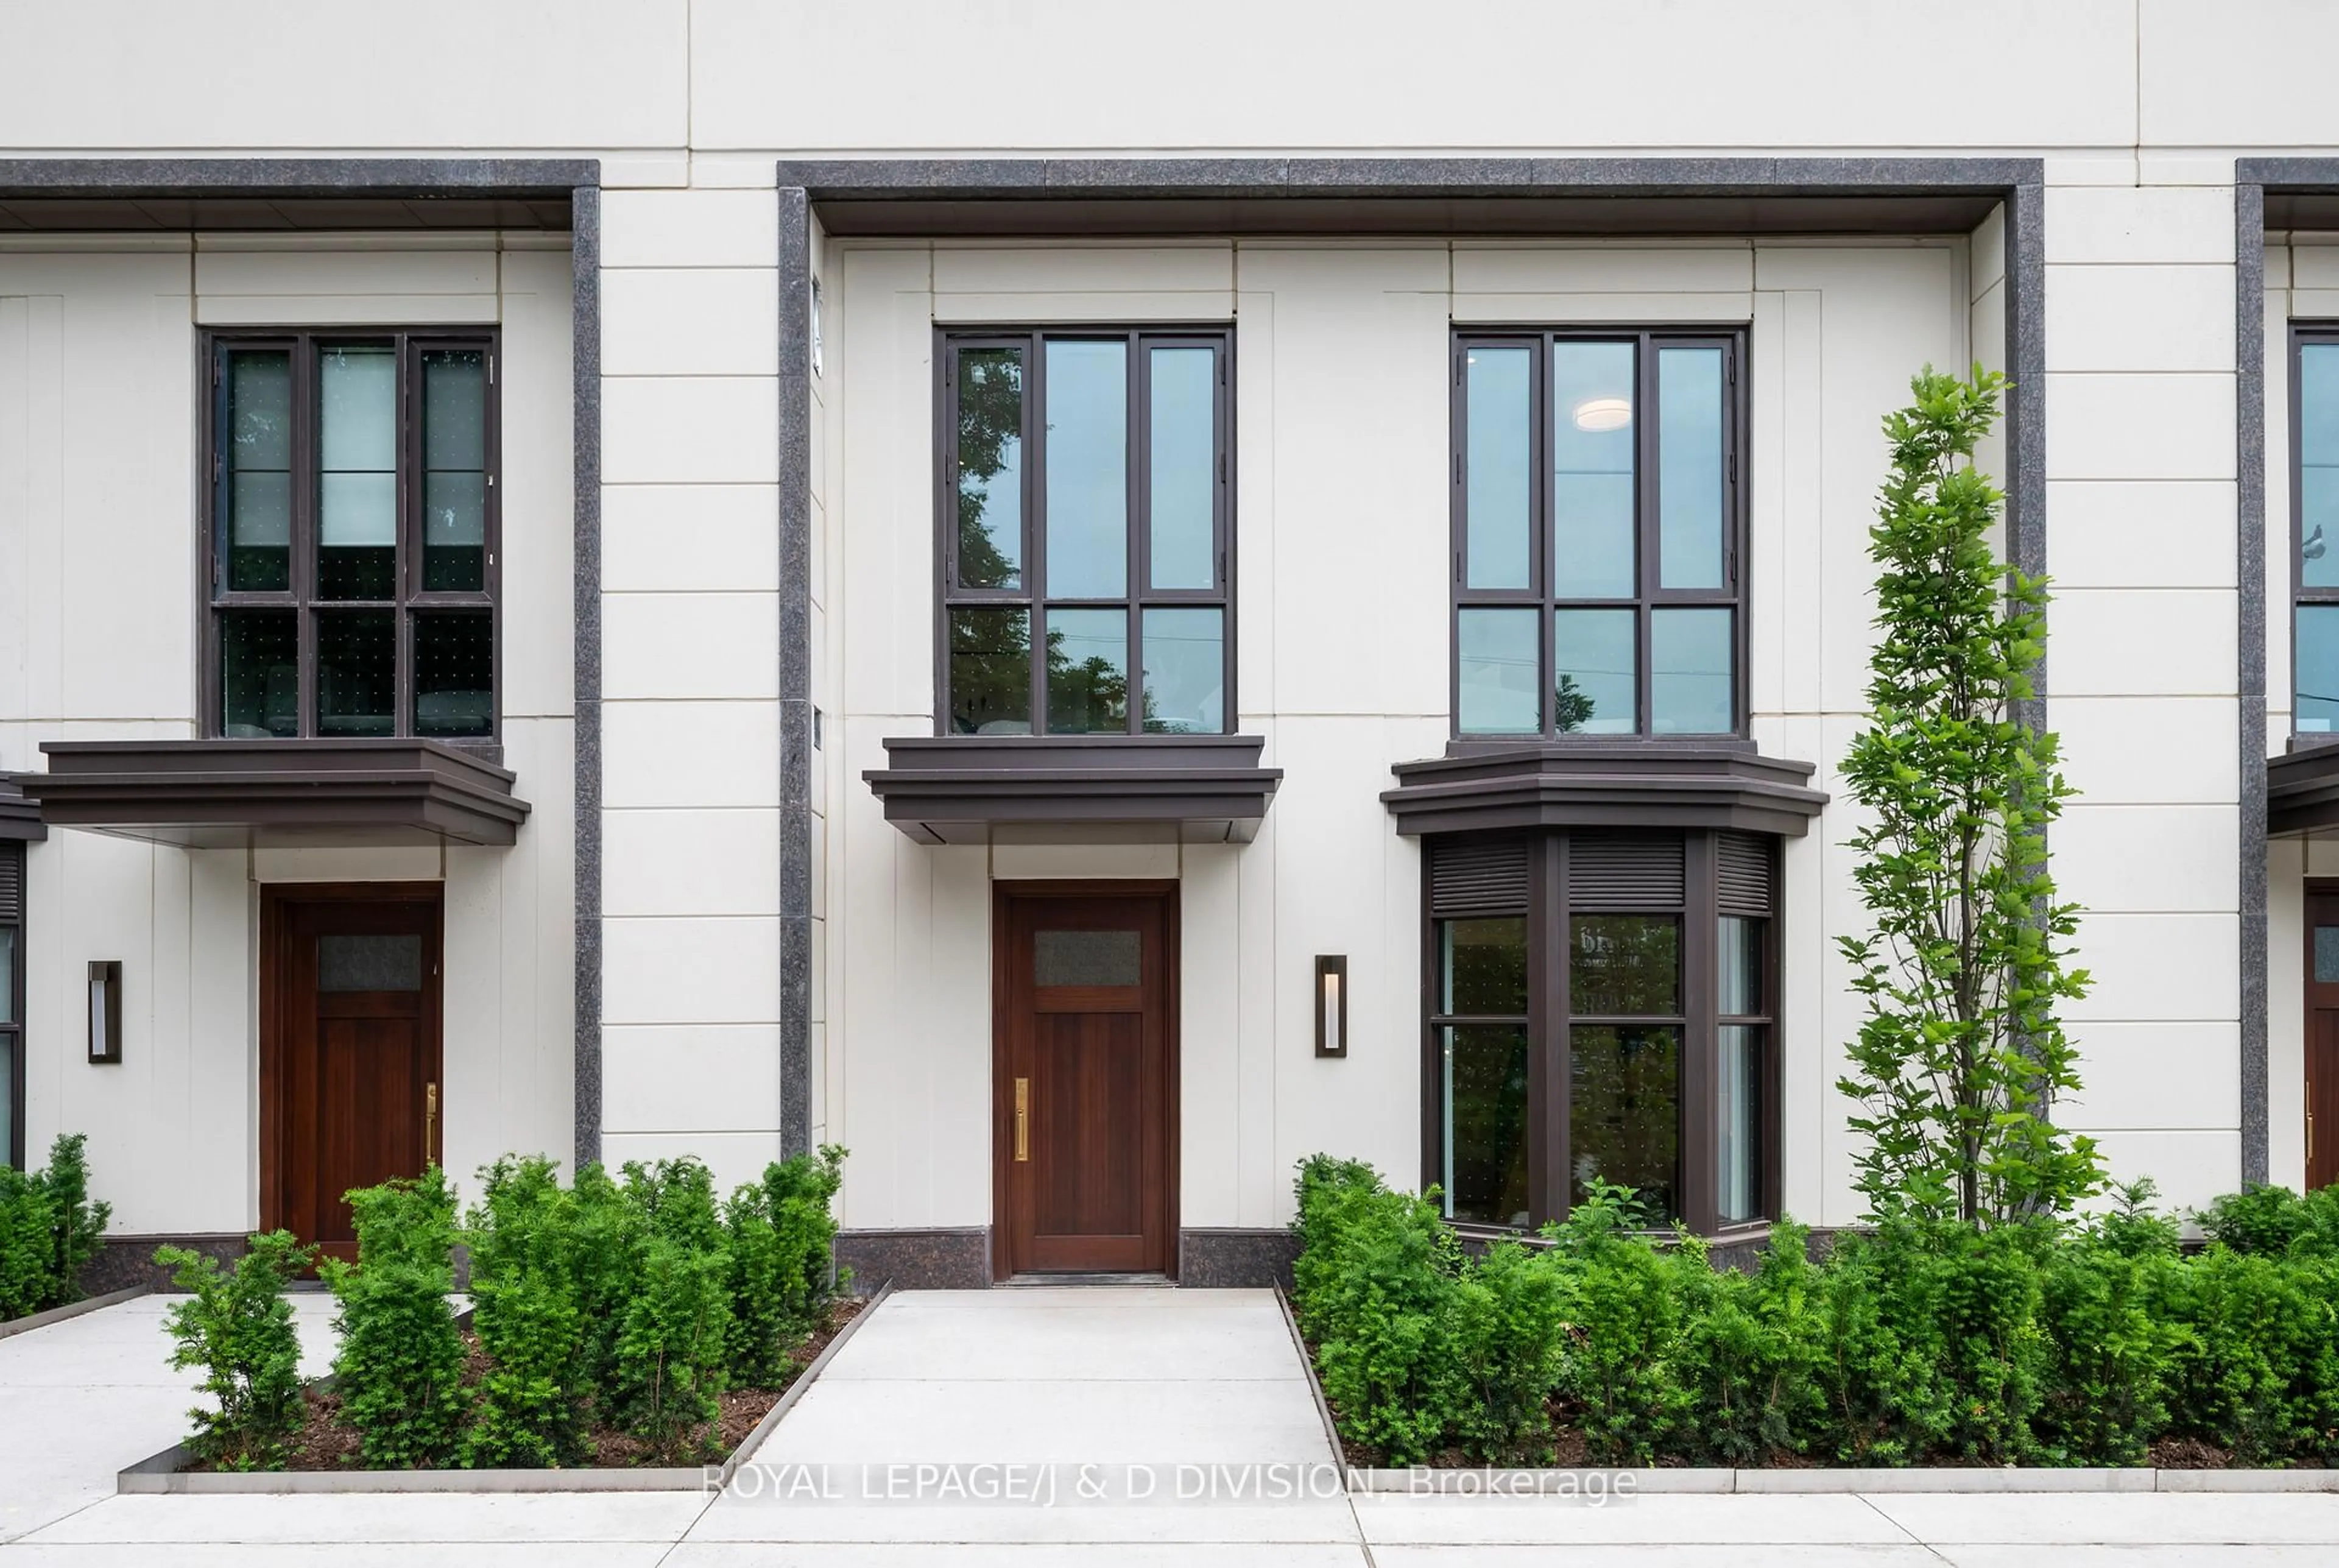
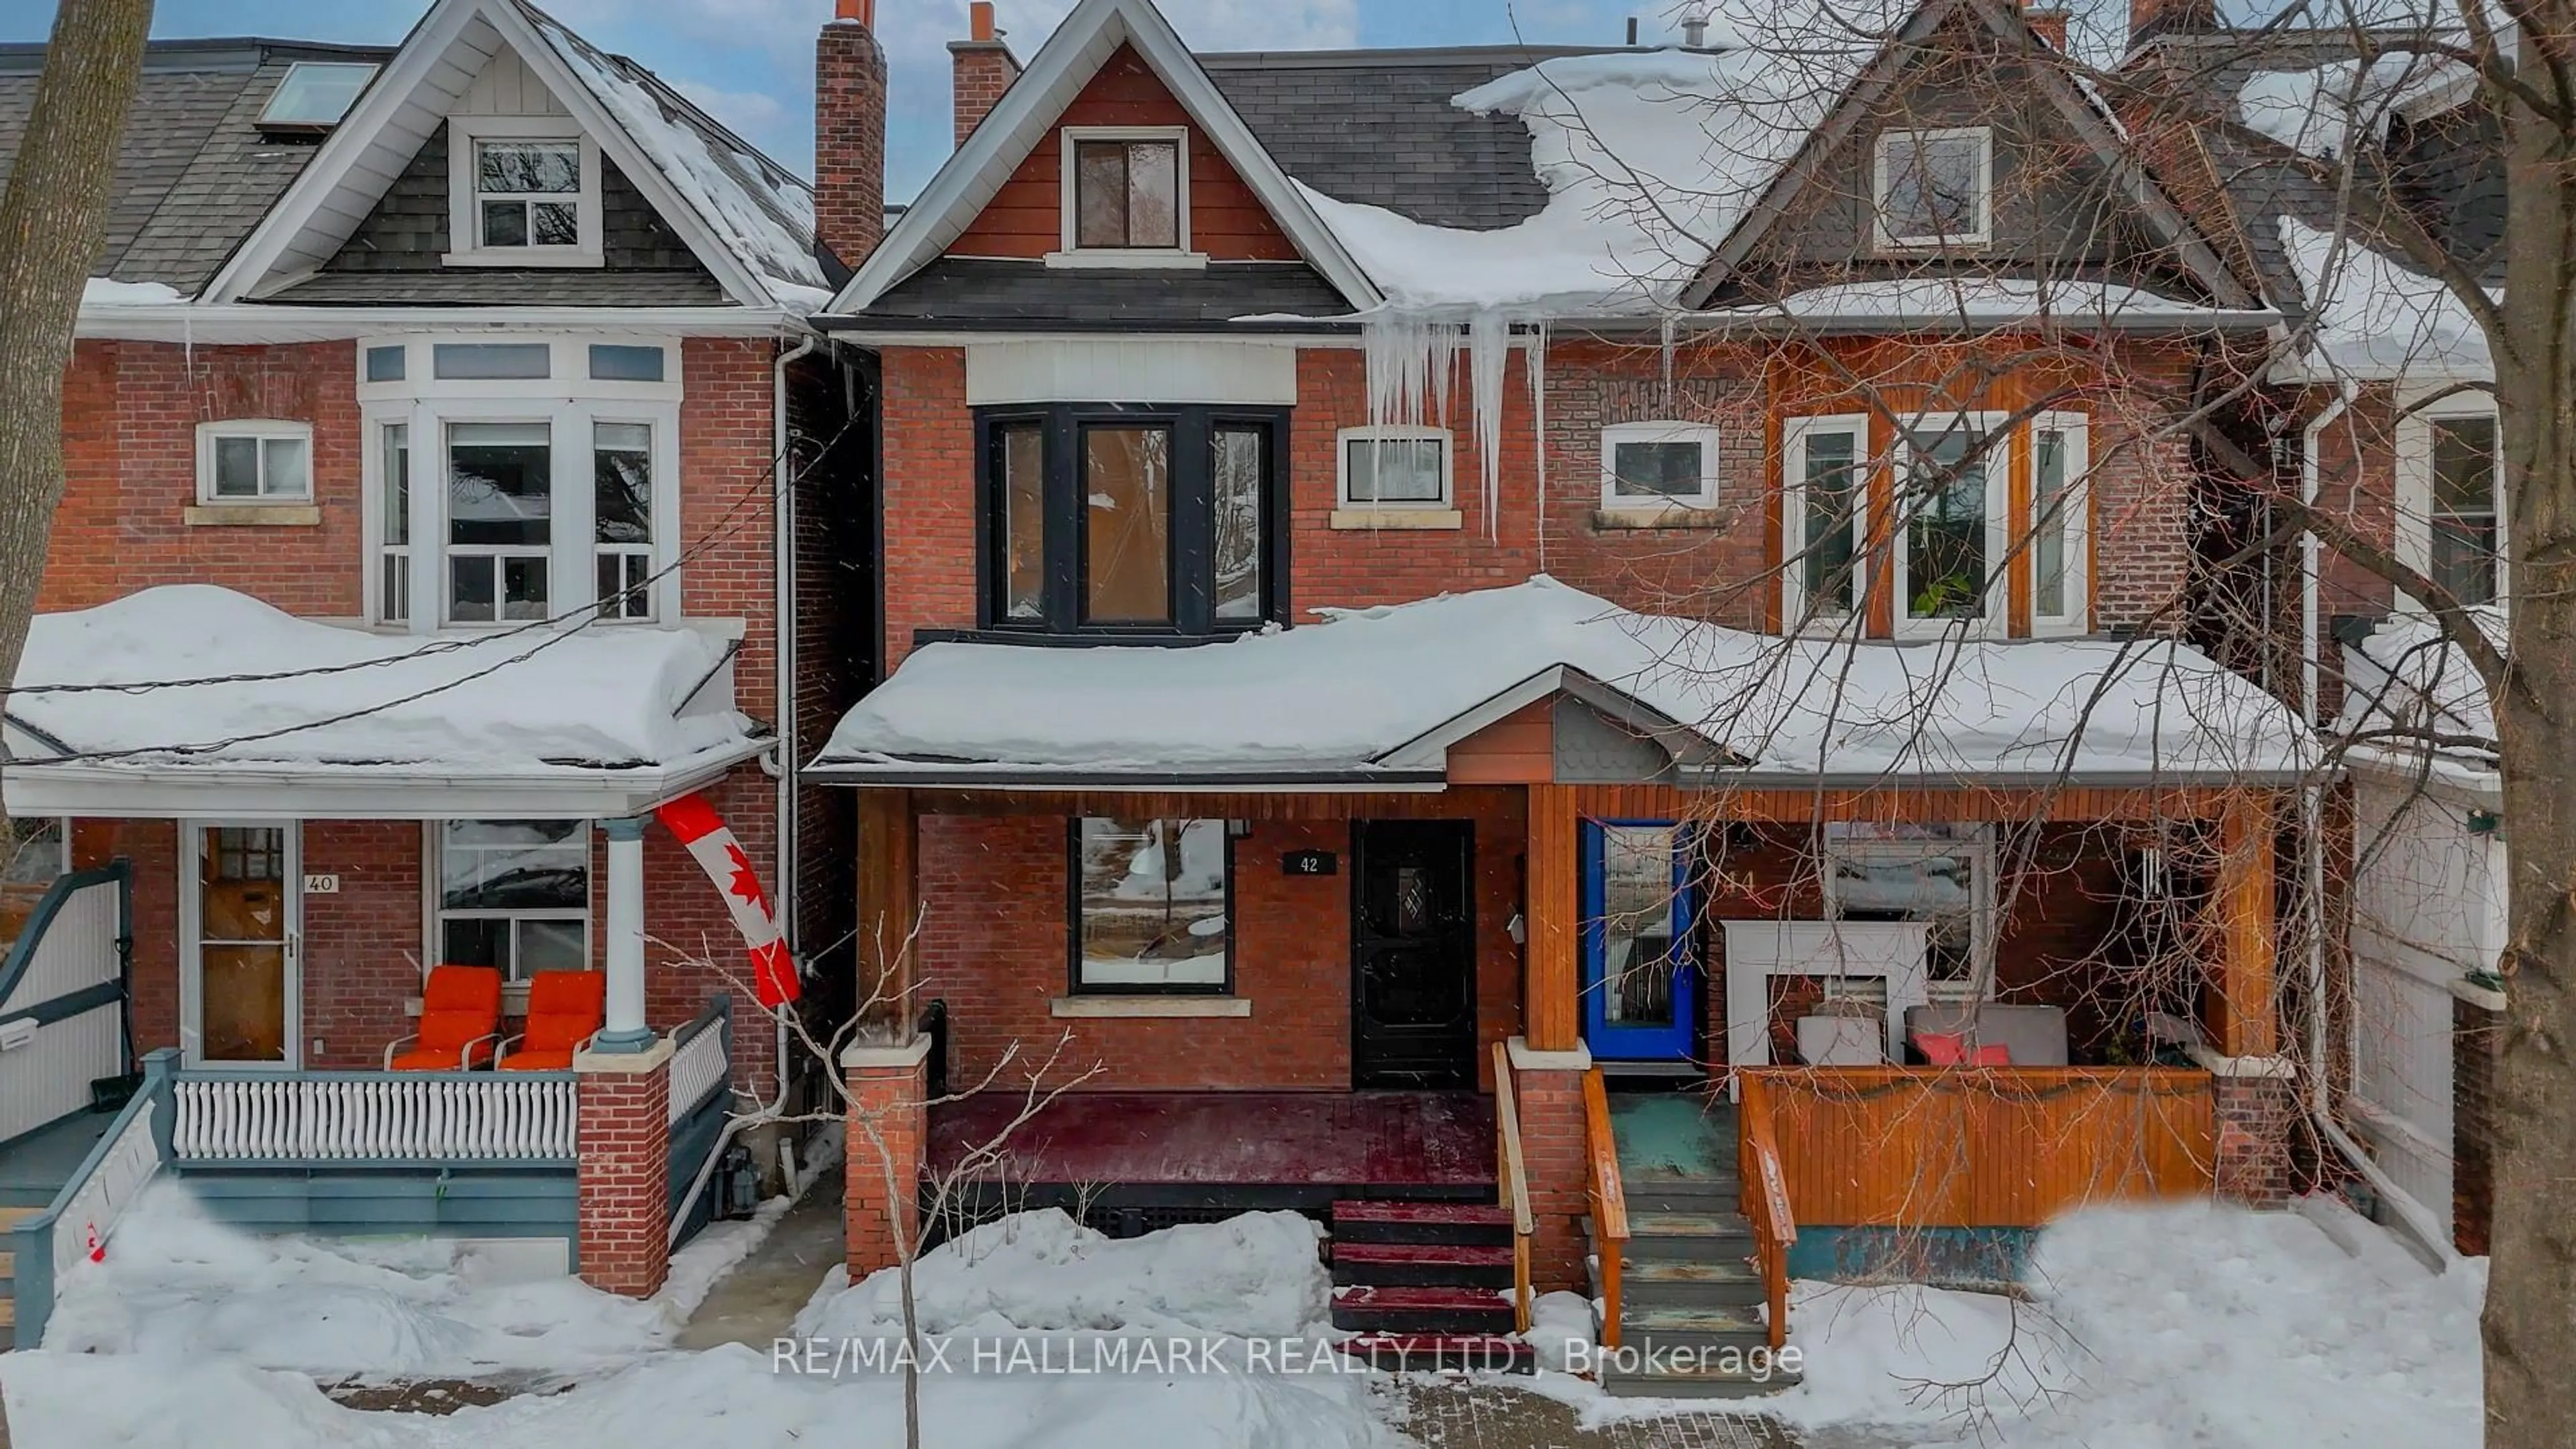
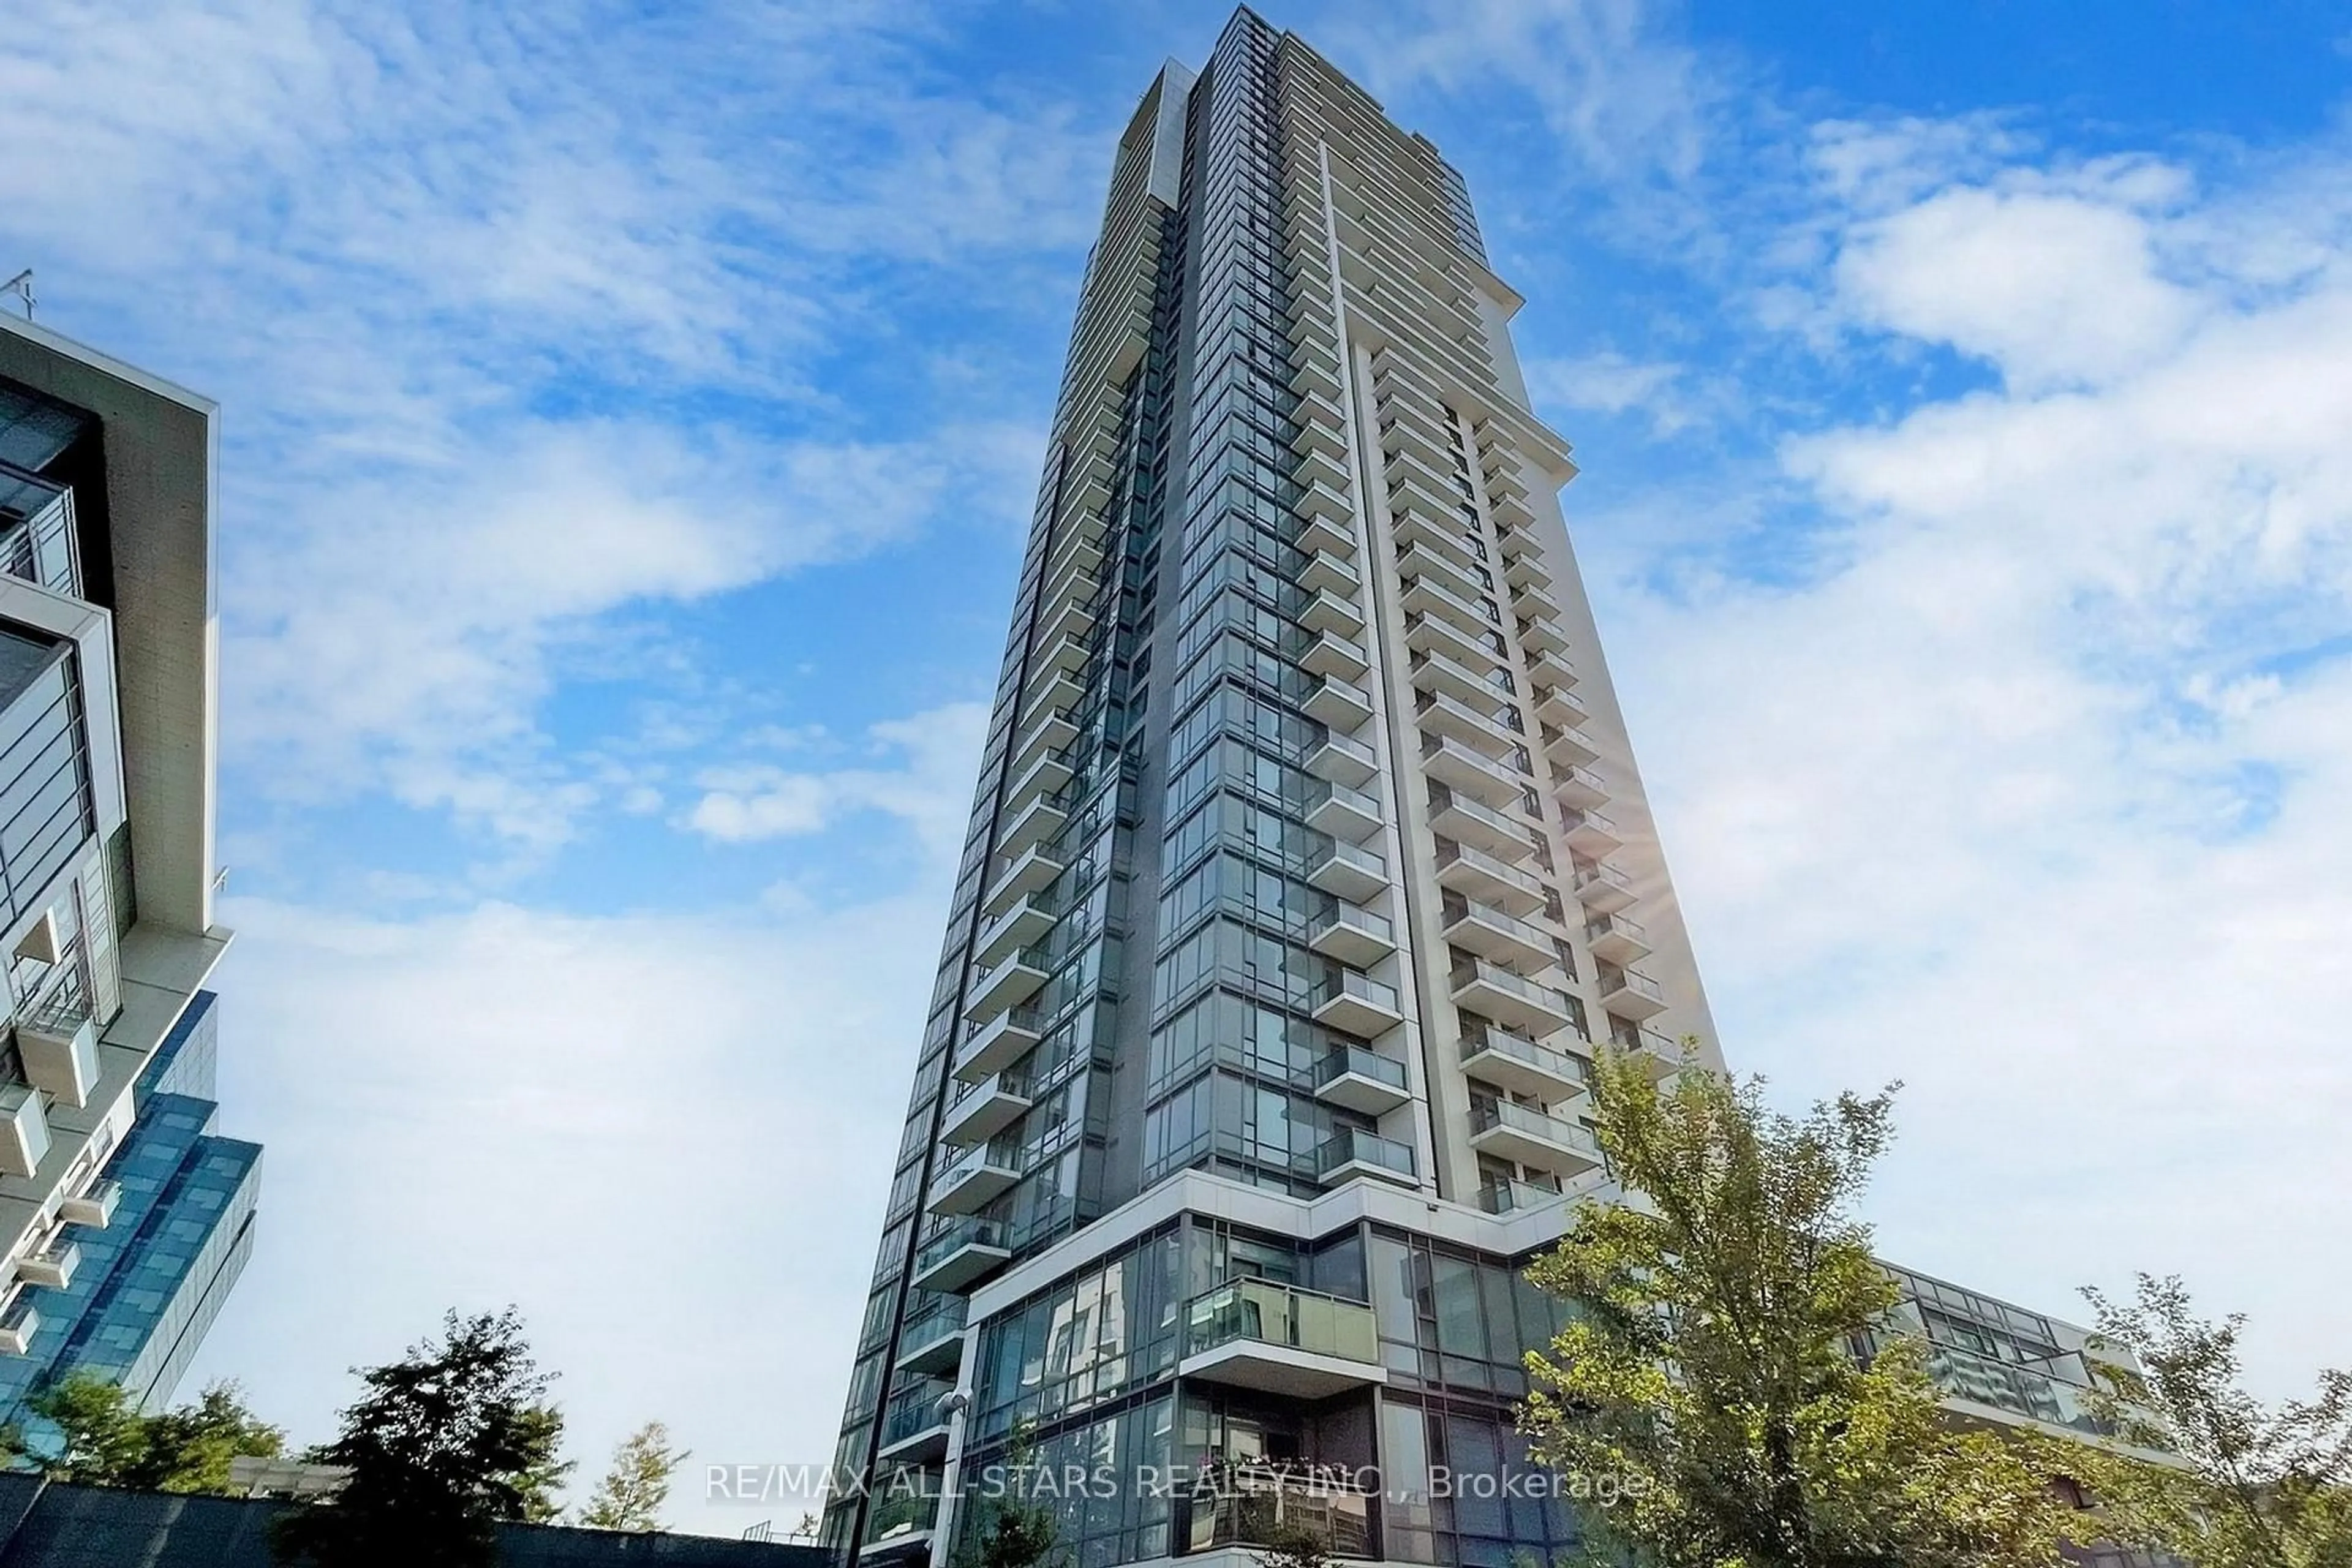
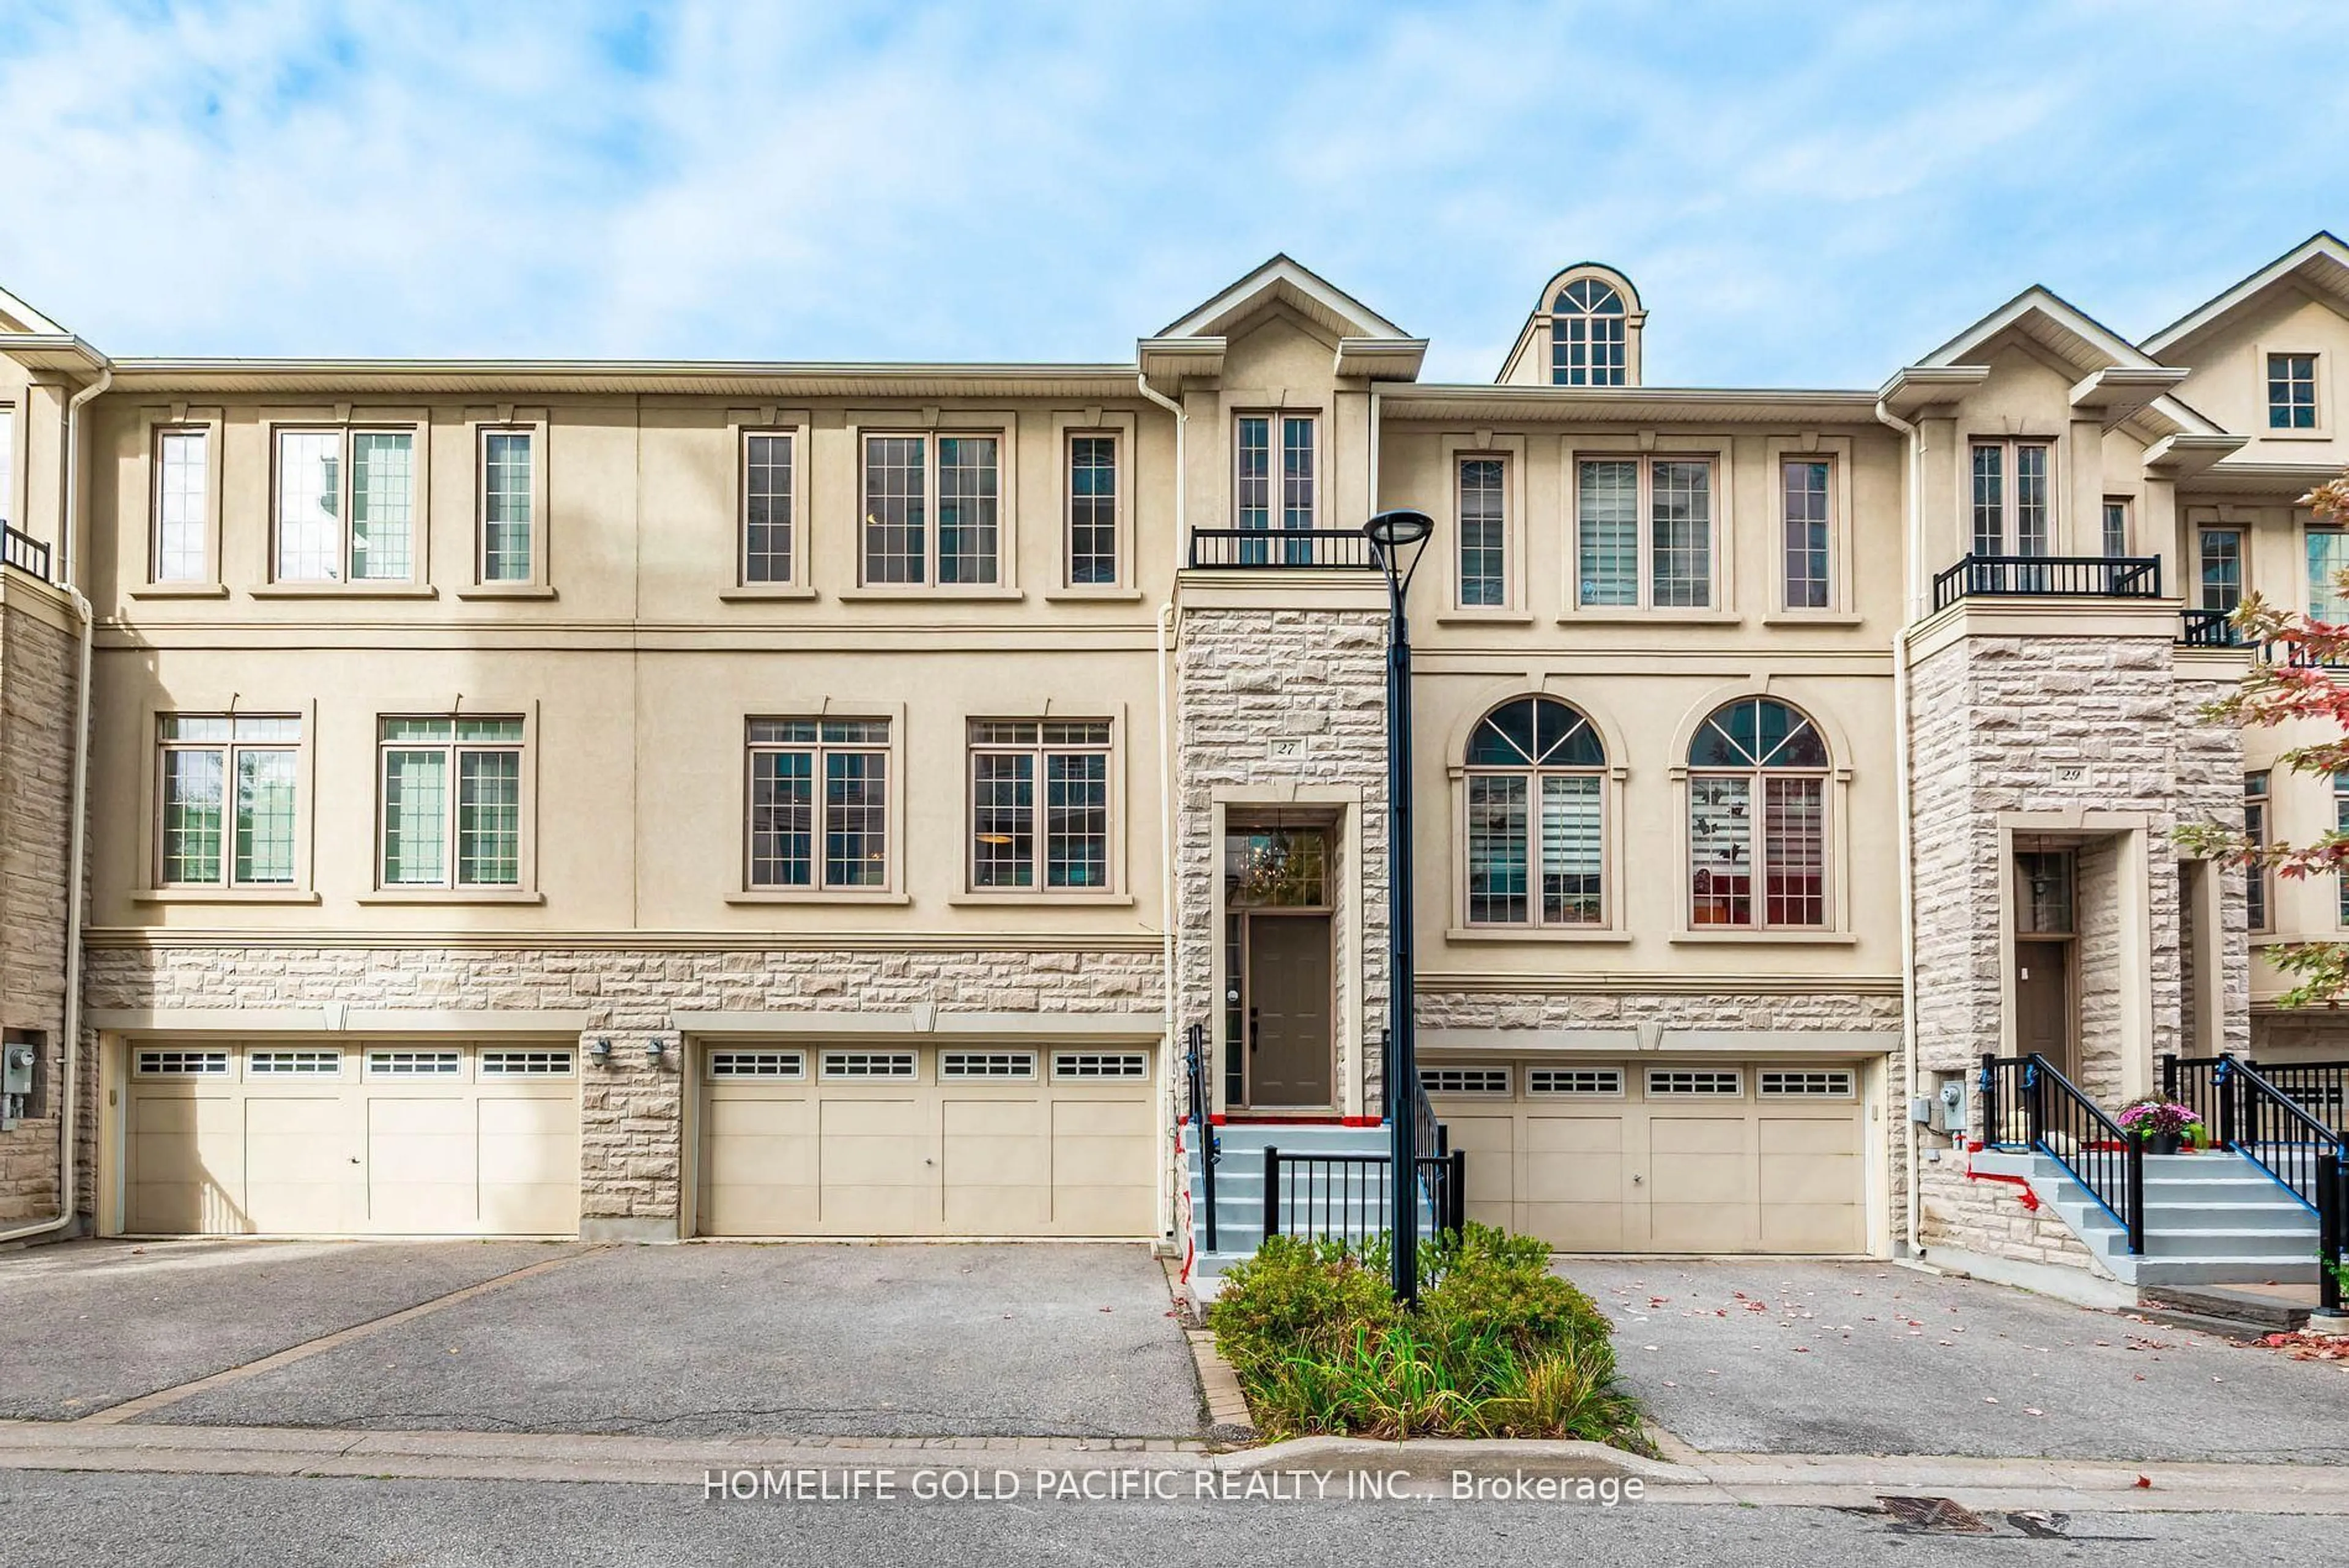
Just Listed in TorontoView all
Open Houses in TorontoView all
Just Sold in TorontoView all
Price Decreased in TorontoView all
Homes near top schools in TorontoView all
Discover Nearby Homes in TorontoView all
What Customers Are Saying:
Overall Google Review Rating
"I had an amazing first time home buyer experience with Wahi, I worked with Faraz Azam for a property in Ontario, Canada. Everything from the property visits to, helping me understand the process and working with me on negotiations was really good. Faraz was very prompt and easy to work with, he took time to understand our needs and gave helpful suggestions throughout. Plus their cash back deal is very sweet. Highly recommended!"
Sunil Murali
"Working with Wahi has been an absolute pleasure! Barbara and her team went above and beyond to make the home buying experience smooth, stress-free, and even enjoyable. From the first consultation to closing day, their professionalism, responsiveness, and deep market knowledge were evident every step of the way. Barbara’s attention to detail and genuine care for her clients truly set her apart. She listened carefully to the needs, offered thoughtful advice, and never pressured me into the sale. Her team was equally fantastic: organized, friendly, and always one step ahead. If you’re looking for a real estate team that treats you like family and delivers results, I highly recommend Wahi Real Estate. Barbara and her team are simply the best!"
David Rodriguez
"I recently went through the home buying process with Barb from Wahi Brokerage, and honestly, the entire experience was just purely positive. Period. It’s been a long journey, and from day one, I felt supported every step of the way. One of the things I appreciated most was how responsive and flexible Barb and her team were. Whether it was early mornings, late evenings, or weekends, they were always there to answer questions, offer guidance, or just check in. That kind of support made a huge difference. Barb really took the time to understand what I was looking for. There was never any pressure, just thoughtful help and honest insight. And in a decision as big as buying a home, that respectful, no-pressure approach really stood out to me. The whole process went incredibly smoothly. Barb was quick to react when needed, always kept me in the loop, and helped make the experience feel easy and manageable. I also want to give a big thanks to Faraz, who offered great advice throughout and was a key part of the journey. Would I recommend Barb and her team to someone else? Absolutely, I already have! Friends, family, anyone who asks. Would I work with them again in the future? Without hesitation, yes. This was a great experience, and I’m grateful I had such professionals on my side."
Volodymyr Vozniak
"Our journey to finding our dream home with Wahi Real Estate was truly outstanding. The whole team was professional, welcoming, and made the process enjoyable. Wahi arranged all our viewings seamlessly, and the tours were excellent. Most of our communication happened through the app, the team was always quick to respond, which made everything easy and stress-free. A special thanks to Michelle, who guided us through the paperwork smoothly and provided invaluable advice at every step. We’re grateful to Wahi for playing such a meaningful role in this milestone. We would highly recommend Wahi to any home buyer!"
Irina Krasyuk
Latest Real Estate Market Insights and News


These Are the Rare GTA Neighbourhoods Where Homebuyers Are Still Bidding Prices Higher


Homes for Sale in New Brunswick
- Homes For Sale in New Brunswick
- Homes For Sale in Woodstock
- Homes For Sale in Shediac
- Homes For Sale in Bathurst
- Homes For Sale in Miramichi
- Homes For Sale in Moncton
- Homes For Sale in Saint John
- Homes For Sale in Saint Andrews
- Homes For Sale in St. Stephen
- Homes For Sale in Dieppe
- Homes For Sale in Belledune
- Homes For Sale in Campbellton
- Homes For Sale in Charlotte
- Homes For Sale in Fredericton
Homes for Sale in Saskatchewan
- Homes For Sale in Saskatchewan
- Homes For Sale In Fort Saskatchewan
- Homes For Sale In Weyburn
- Homes For Sale In Regina
- Homes For Sale In Swift Current
- Homes For Sale In Yorkton
- Homes For Sale In Assiniboia
- Homes For Sale In Buena Vista
- Homes For Sale In Lloydminster
- Homes For Sale In Melville
- Homes For Sale In Moose Jaw
- Homes For Sale In Outlook
- Homes For Sale In Preeceville
- Homes For Sale In Saskatoon
- Homes For Sale In Tisdale
- Homes For Sale In Wakaw
