a

Toronto Housing Market Report

2021 Year-in-Review: Transaction Trends for the Communities within the Municipality of Toronto

By John Peloza, CFA | 14 minute read

Mar 10

(Click infographic to enlarge)     Download here

As it has been well-reported by the Canadian Real Estate Association (CREA), the Canadian housing market had a record year. The number of residential homes sold was up 20.7% year-over-year, smashing the previous record set in 2020, while average prices increased 21.3% on the year. Unprecedented buyer demand driven by increased immigration, a large population cohort of first-time homebuyers, and low mortgage rates have led to a significant supply-demand imbalance. Across the country, housing inventory is at historic lows.

 –

Canada experienced strong price gains and unusually high sales activity in 2021, with the Maritime provinces and Ontario leading the country with annual average prices in New Brunswick, Ontario, and Nova Scotia up 25.7%, 23.6%, and 23.2% respectively. The accelerated trend of remote work and the greater affordability offered by secondary markets are the main drivers behind the growth experienced in these provinces. Unlike Nova Scotia and New Brunswick, Ontario boasts the largest population centre in the country, and evidence of Torontonians moving farther away from the urban core can be seen in the price changes within the municipality of Toronto compared to the provincial average.

House Prices in Toronto

The municipality of Toronto is bounded by Steeles Avenue to the north and comprises three main regions: Etobicoke to the west, Toronto and York in the centre (Toronto Central), and Scarborough in the east. Across these regions, the Toronto Regional Real Estate Board (TRREB) recorded just under 45,000 overall transactions during the year, up 32.4% since 2020. Sales activity in Toronto grew at a faster rate than in the rest of Ontario and Canada because of the extreme decline in sales activity in large cities in March 2020, the start of the pandemic. However, despite strong growth in annual sales, the average price was up a much healthier 7.8% compared to all of Ontario (+23.6%). The median price increase, which compares the middle-priced home sold in 2021 to the middle-priced home sold in 2020 and is therefore not skewed by outlier prices, was only 5.7% for the municipality of Toronto.

Condo Prices in Toronto

Across the three regions, Toronto Central saw the highest increase in annual sales activity, up 45.9% compared to 2021. This has been driven by its many existing and new-build condo projects, which represented close to 70% of the units sold in Toronto Central in 2021. However, the median price in Toronto Central grew only 2.1% to $766,000, while median prices in Etobicoke and Scarborough were both up 12%. While many young and retiring Canadians alike are still flocking to the urban core of Toronto, neighbourhoods that offer larger homes and more living space have seen prices grow at a faster rate. This insight holds true for property types, with semi-detached and detached properties experiencing the greatest annual increase in median sold price for Etobicoke, Toronto, and Scarborough when compared to their condominium and townhome counterparts.

Downtown Toronto Leads Annual Growth in Sales but Greatest Price Gains in Suburbs

The Entertainment District

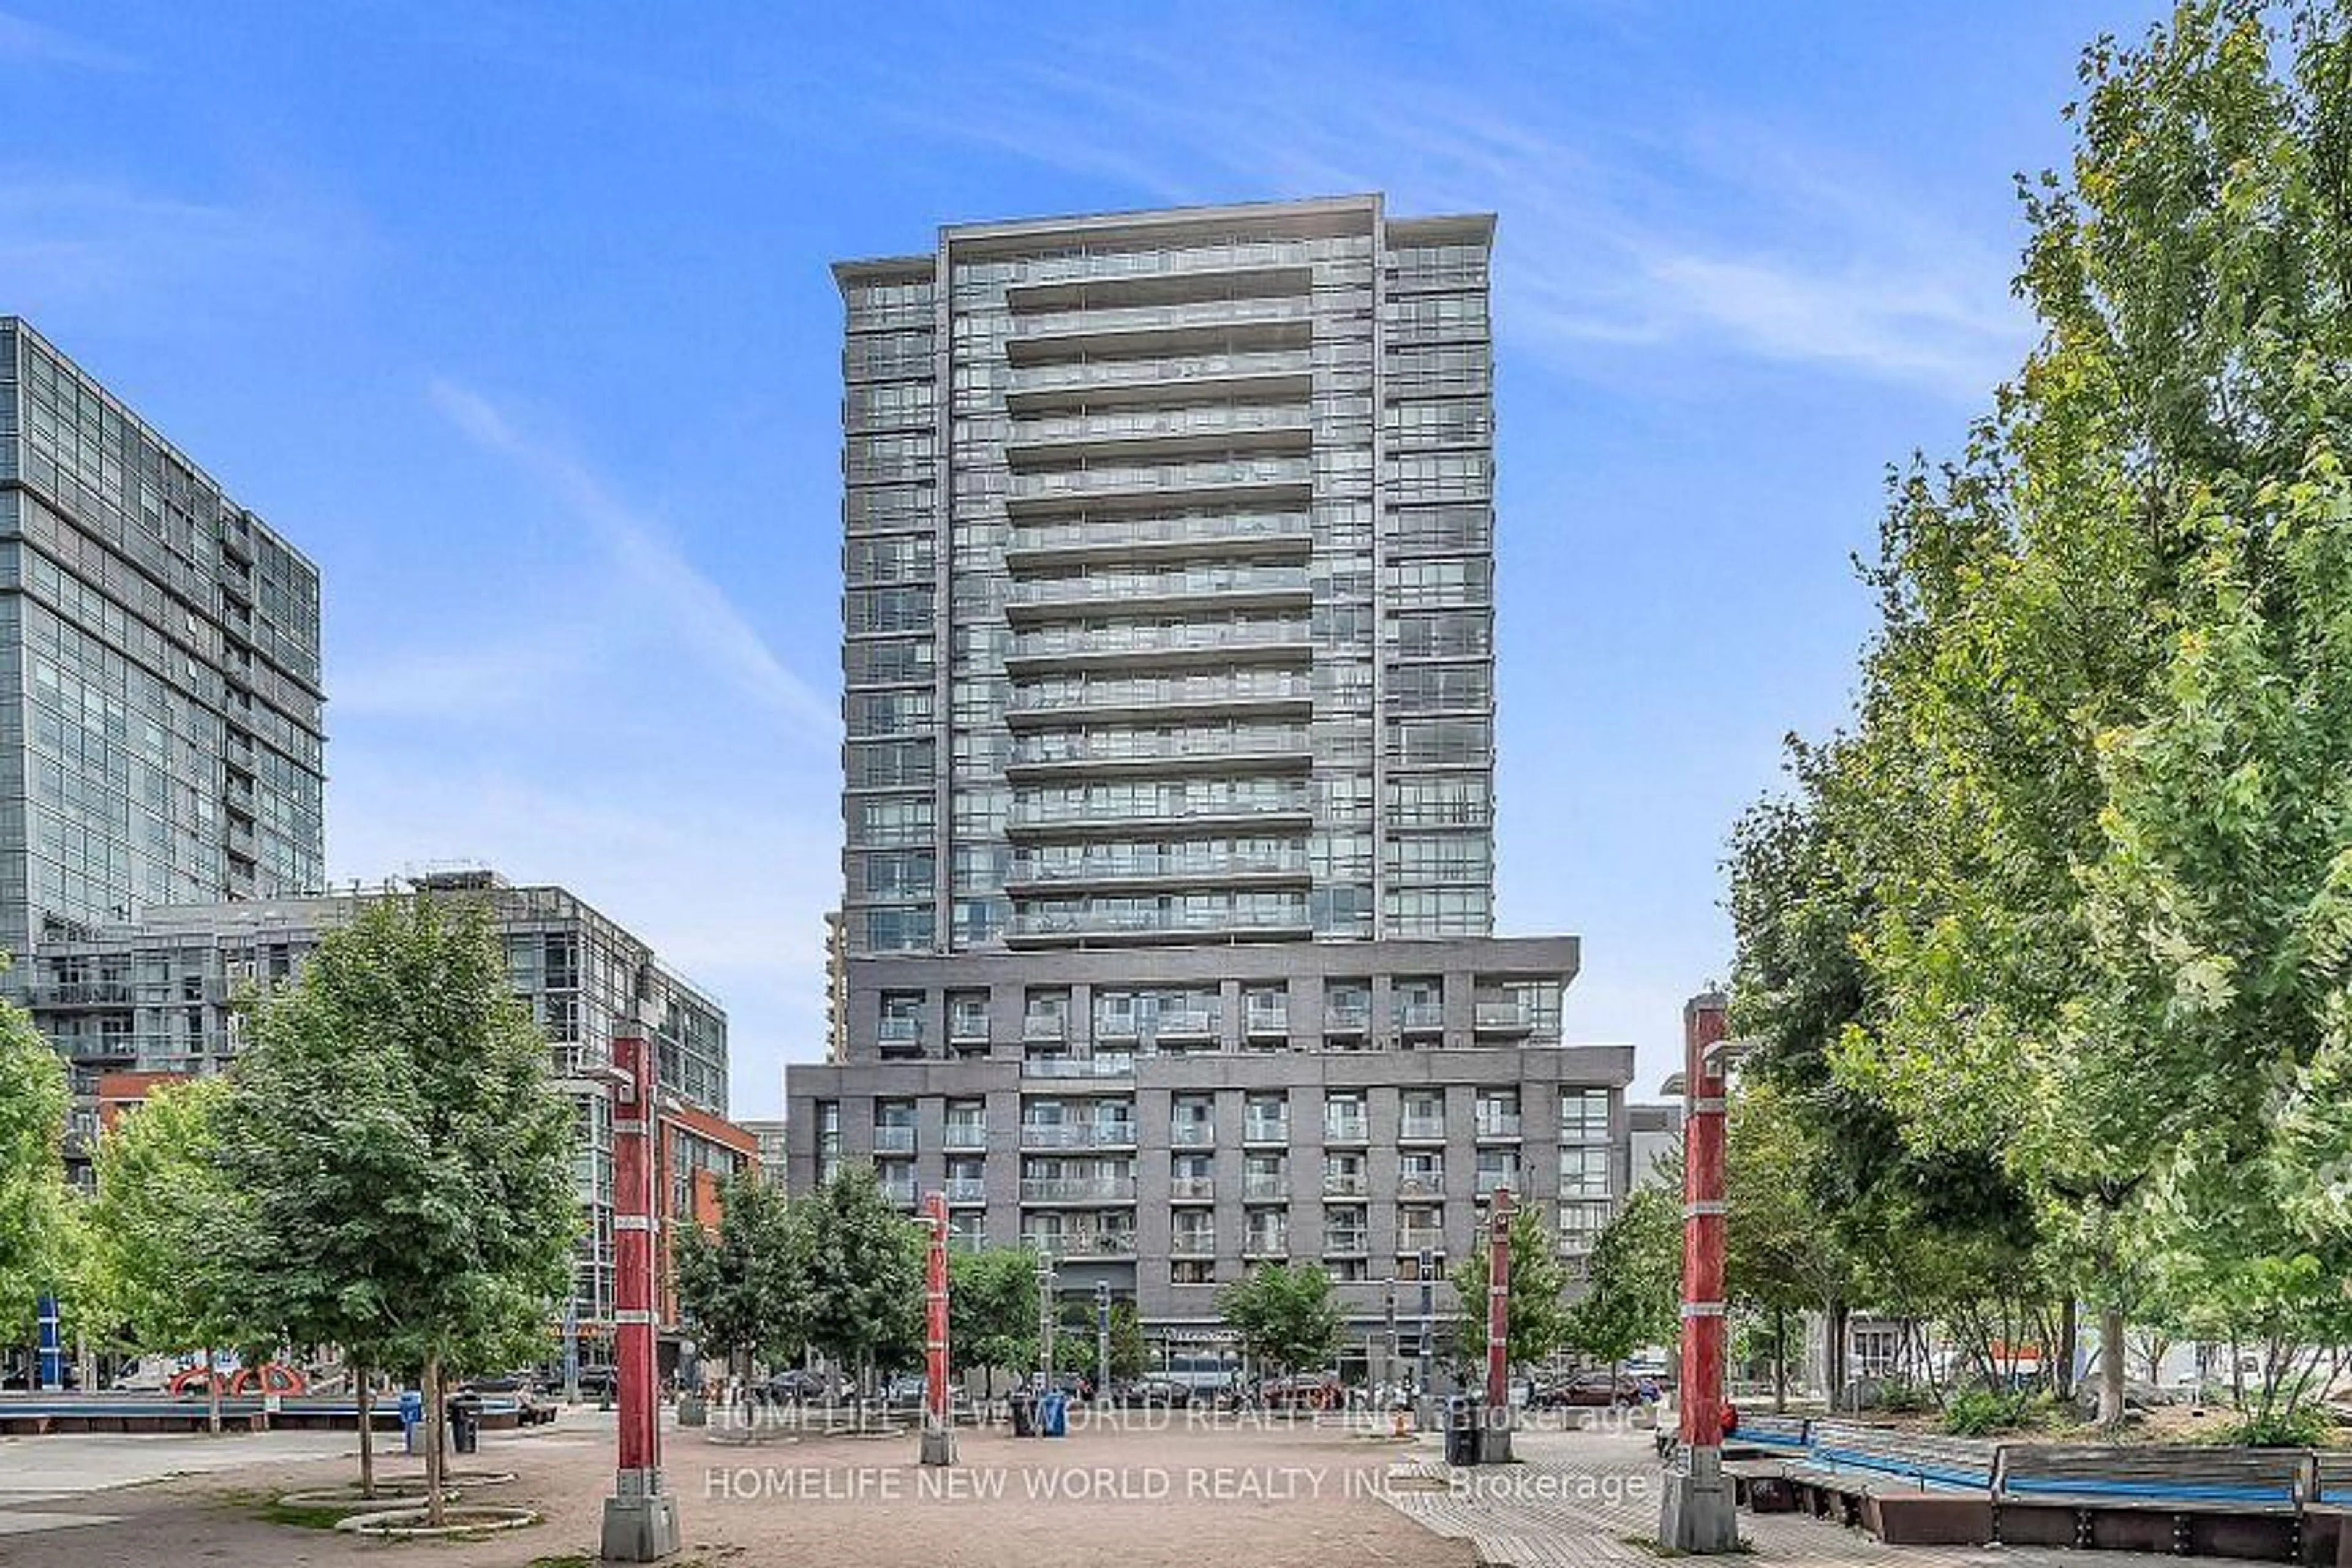
Downtown Toronto is defined as the area south of Bloor street. The downtown core is separated by Yonge street into two communities: Old Toronto East and the Entertainment District in the west. Downtown west, or the Entertainment District, is home to some of the city’s most vibrant neighbourhoods like Little Italy, Chinatown, Trinity Bellwoods, King-West, and Kensington Market. Closer to the waterfront, the Fort York Historic Site and Exhibition Place feature an array of green space and outdoor venues for sporting events, festivals, and concerts. Popular with young professionals, the Entertainment District is growing fast, with more than double the homes sold in 2021 than any other community in Toronto. This is primarily driven by a multitude of large-scale condo developments in the area, with 84.4% of sales in 2021 being condominiums. In 2021, the Entertainment District saw an annual increase in overall transactions of 53.5%, second only to Old Toronto East, with a median sales price of $725,000, up a modest 2.8% compared to the 2020 median price.

St. Lawrence Market

To the east of Yonge street, Old Toronto East is also predominantly high-density apartments, with 89.8% of units sold in 2021 being condominiums. Old Toronto East features some of the oldest and most historic landmarks in the city, with St. Lawrence Market and the Distillery District being two notable examples of popular spots for shopping and dining. Closer to the Bloor boundary, Ryerson University, with its large student population, contributes to the vibrant nightlife along the Church-Yonge corridor. Old Toronto East led all Toronto communities for growth in sales activity, with the number of properties sold up 54.8% compared to 2020. The median sale price was $695,000, up 3.0% for the year. Collectively, these two communities comprising downtown Toronto accounted for close to a quarter of all municipality property sales in 2021.

Willowdale-Newtonbrook East

After Old Toronto and the Entertainment District, the only other community with a +50% increase in sales activity in 2021 was Willowdale-Newtonbrook East, also located in Toronto Central. The community is located near the northern border of the Toronto municipality, bordered by Steeles to the north, the 401 to the south, and Yonge and Bayview to the west and east. It is a primarily residential area with the majority (71.4%) of homes being condominiums. The median price in this community rose modestly in 2021, up 4.4% to $710,000, but it notably had an average sales price that was 43.5% greater than its median sale in 2021. This discrepancy between average price and median price is an indication of the greater variety of detached, semi-detached, and other luxury neighbourhoods in Willowdale-Newtonbrook East. For comparison, the Entertainment District and Old Toronto, which feature a more consistent housing mix of standard condominiums, had average prices that were 20.8% and 15.7% greater than their median sales.

Scarborough and Etobicoke communities led the way for Price Gains in 2021 after Toronto community of Bridle Path and St. Andrews

The Bridle Path and St. Andrews

Detached Home Prices in Toronto

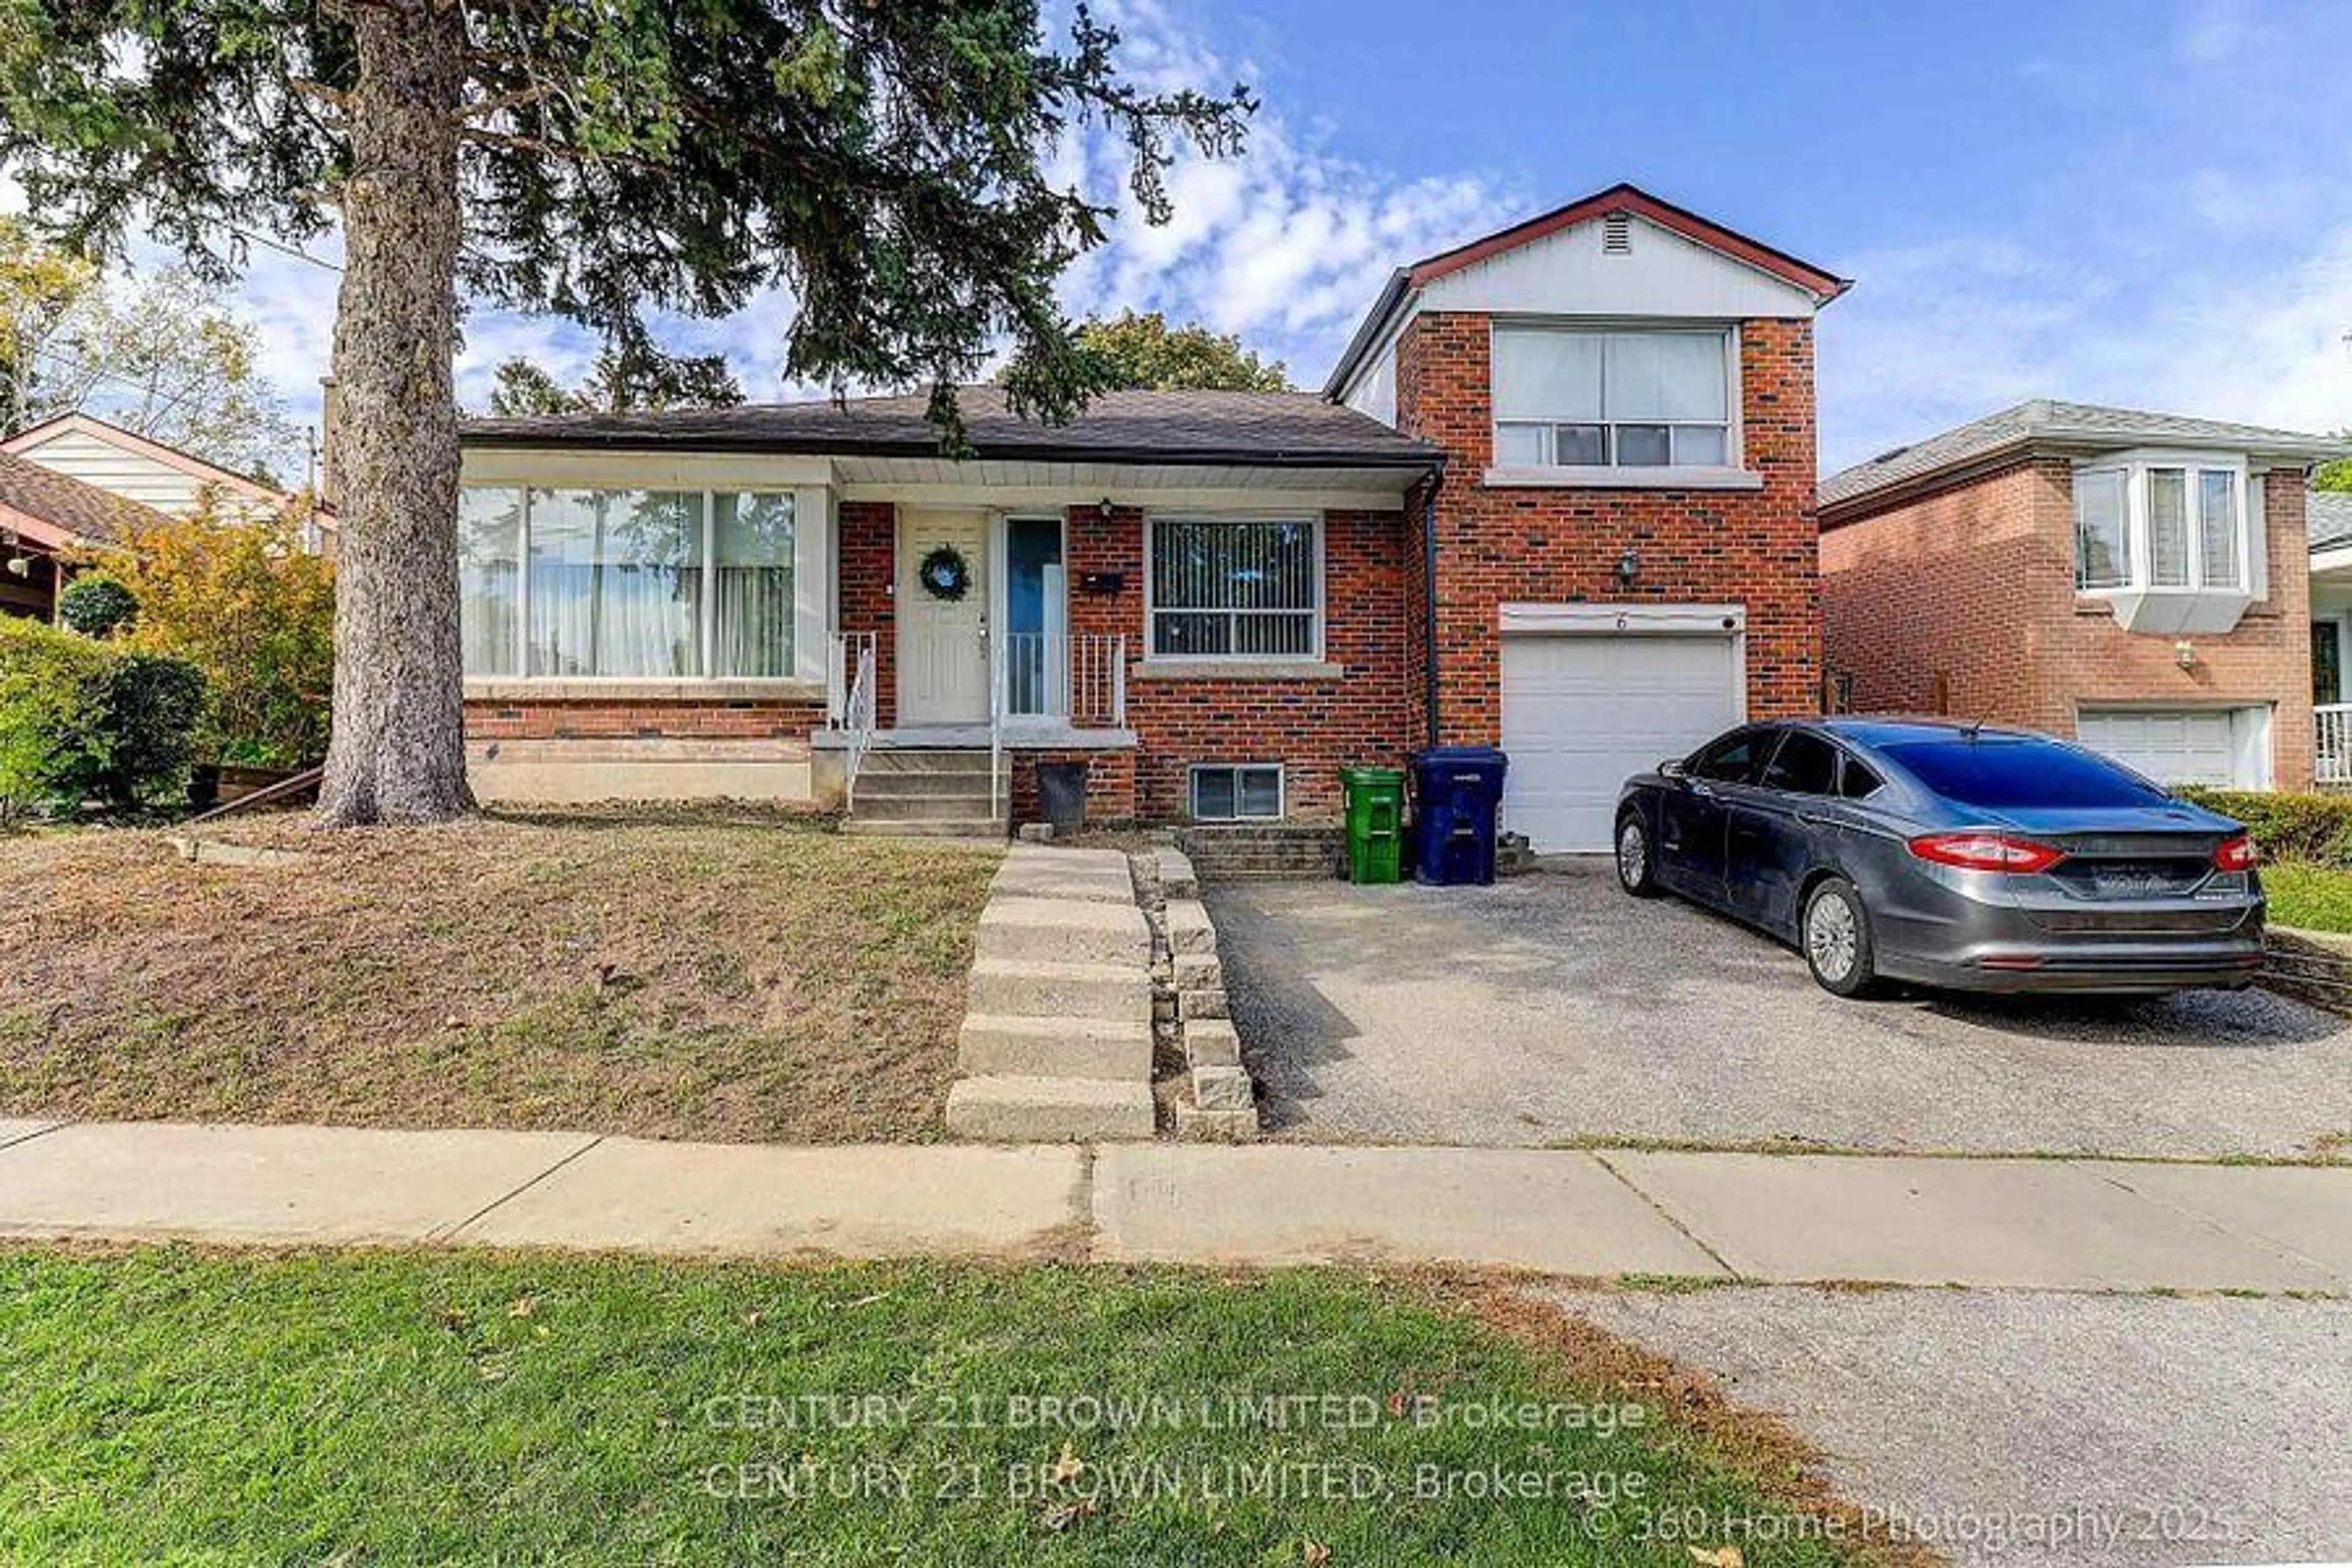
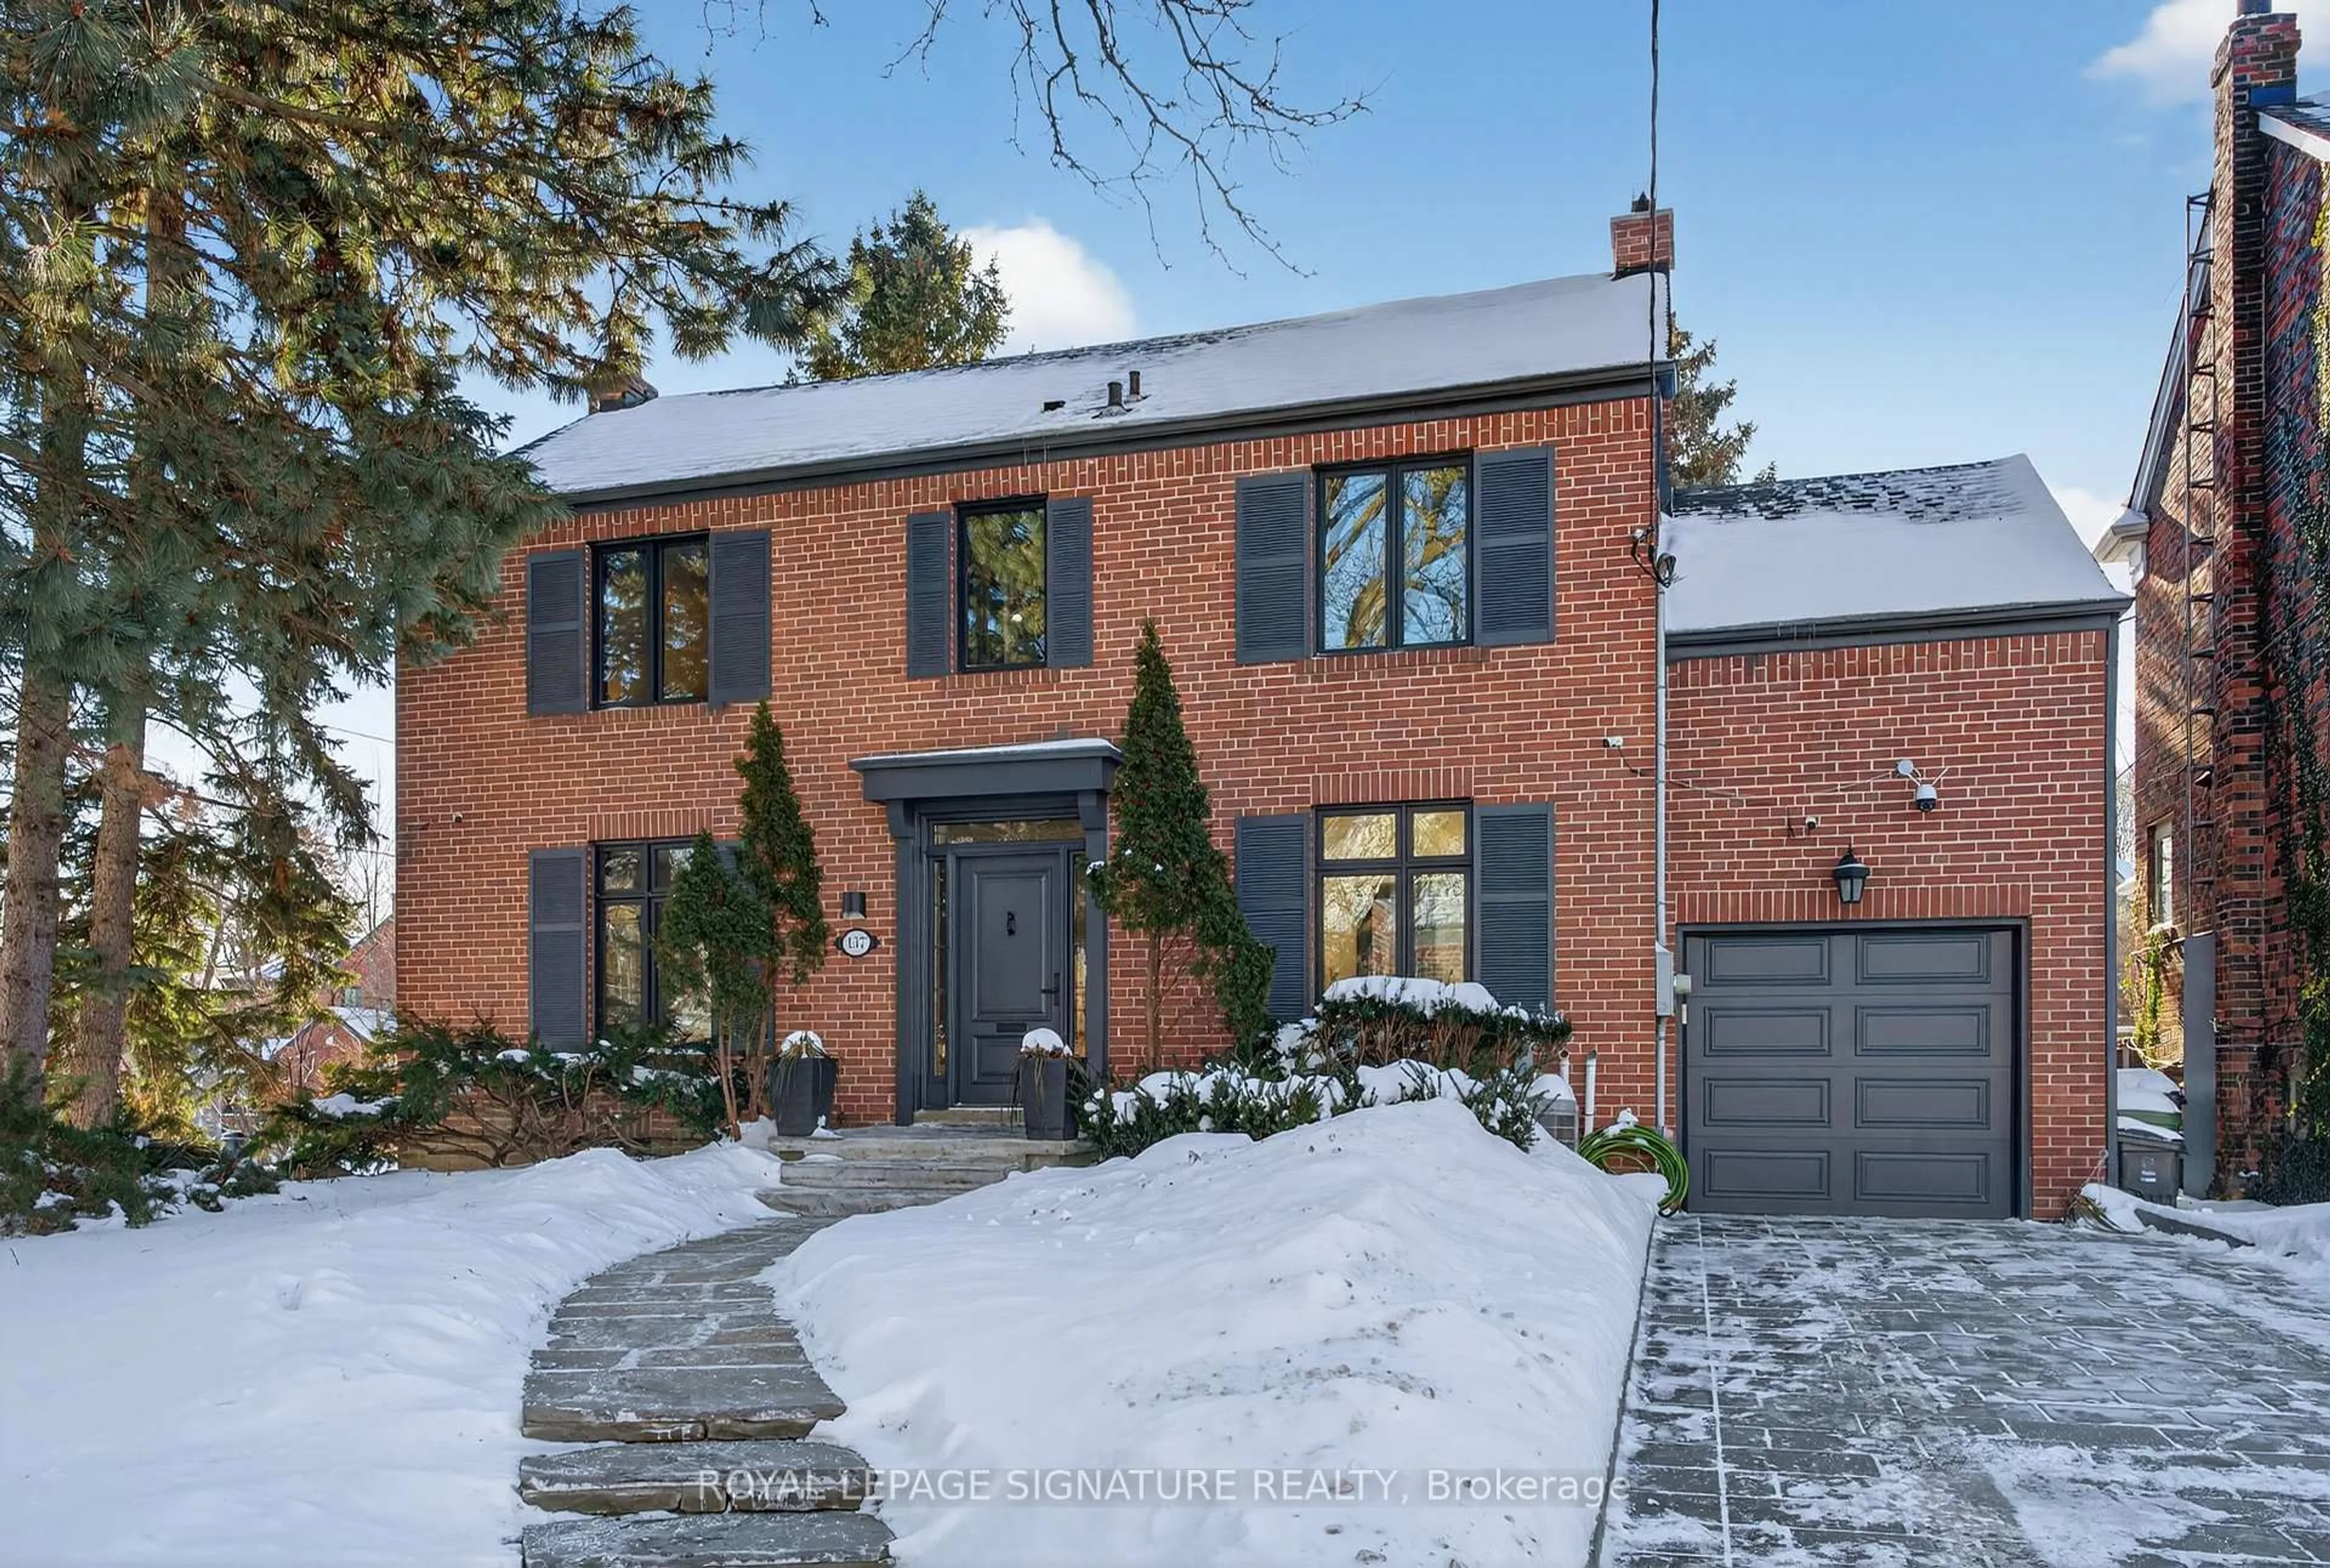
With less than 400 property sales in 2021, the Bridle Path and St. Andrews community is one of the most exclusive areas in Toronto.  Located to the north of Eglinton and south of the 401, this residential area is mostly comprised of large lots and plenty of green space. Sixty-five per cent of units sold in 2021 were detached homes, with a median sales price of $2,817,500. The median price was up 31.7%  compared to 2020, leading the way for all 35 communities within the Toronto municipality. Bounded by Yonge Street to the west and the Don Valley river to the east, the Bridle Path and St. Andrews is a secluded neighbourhood that is often referred to as “Millionaire’s Row.” Over the years, many celebrities have set up residence here, including Drake, Prince, and Celine Dion. With the COVID-19 pandemic driving the need for more space, the Bridle Path and St. Andrews neighbourhoods saw their median days on market fall from 18 days in 2020 to 10 days in 2021, with buyers quick to act on the limited opportunities in these areas.

 –

After the Bridle Path and St. Andrews, the next 10 communities that experienced the highest median price growth were in Etobicoke and Scarborough. In Scarborough, the Agincourt community saw the second-highest growth in median sales price, up 23.7% compared to 2020. Bounded by Steeles Avenue to the north and the 401 to the south, Agincourt saw the highest annual increase in overall transactions (39.7%) for Scarborough in 2021. The high-growth community, running between Kennedy and Markham roads and centred at the intersection of Finch Avenue and McCowan Road, is comprised of an equal split between detached homes and condominiums. With a median sales price of only $770,000 in 2021, the affordability of the Agincourt neighbourhood plays a large part in its recent and significant price appreciation.

Agincourt

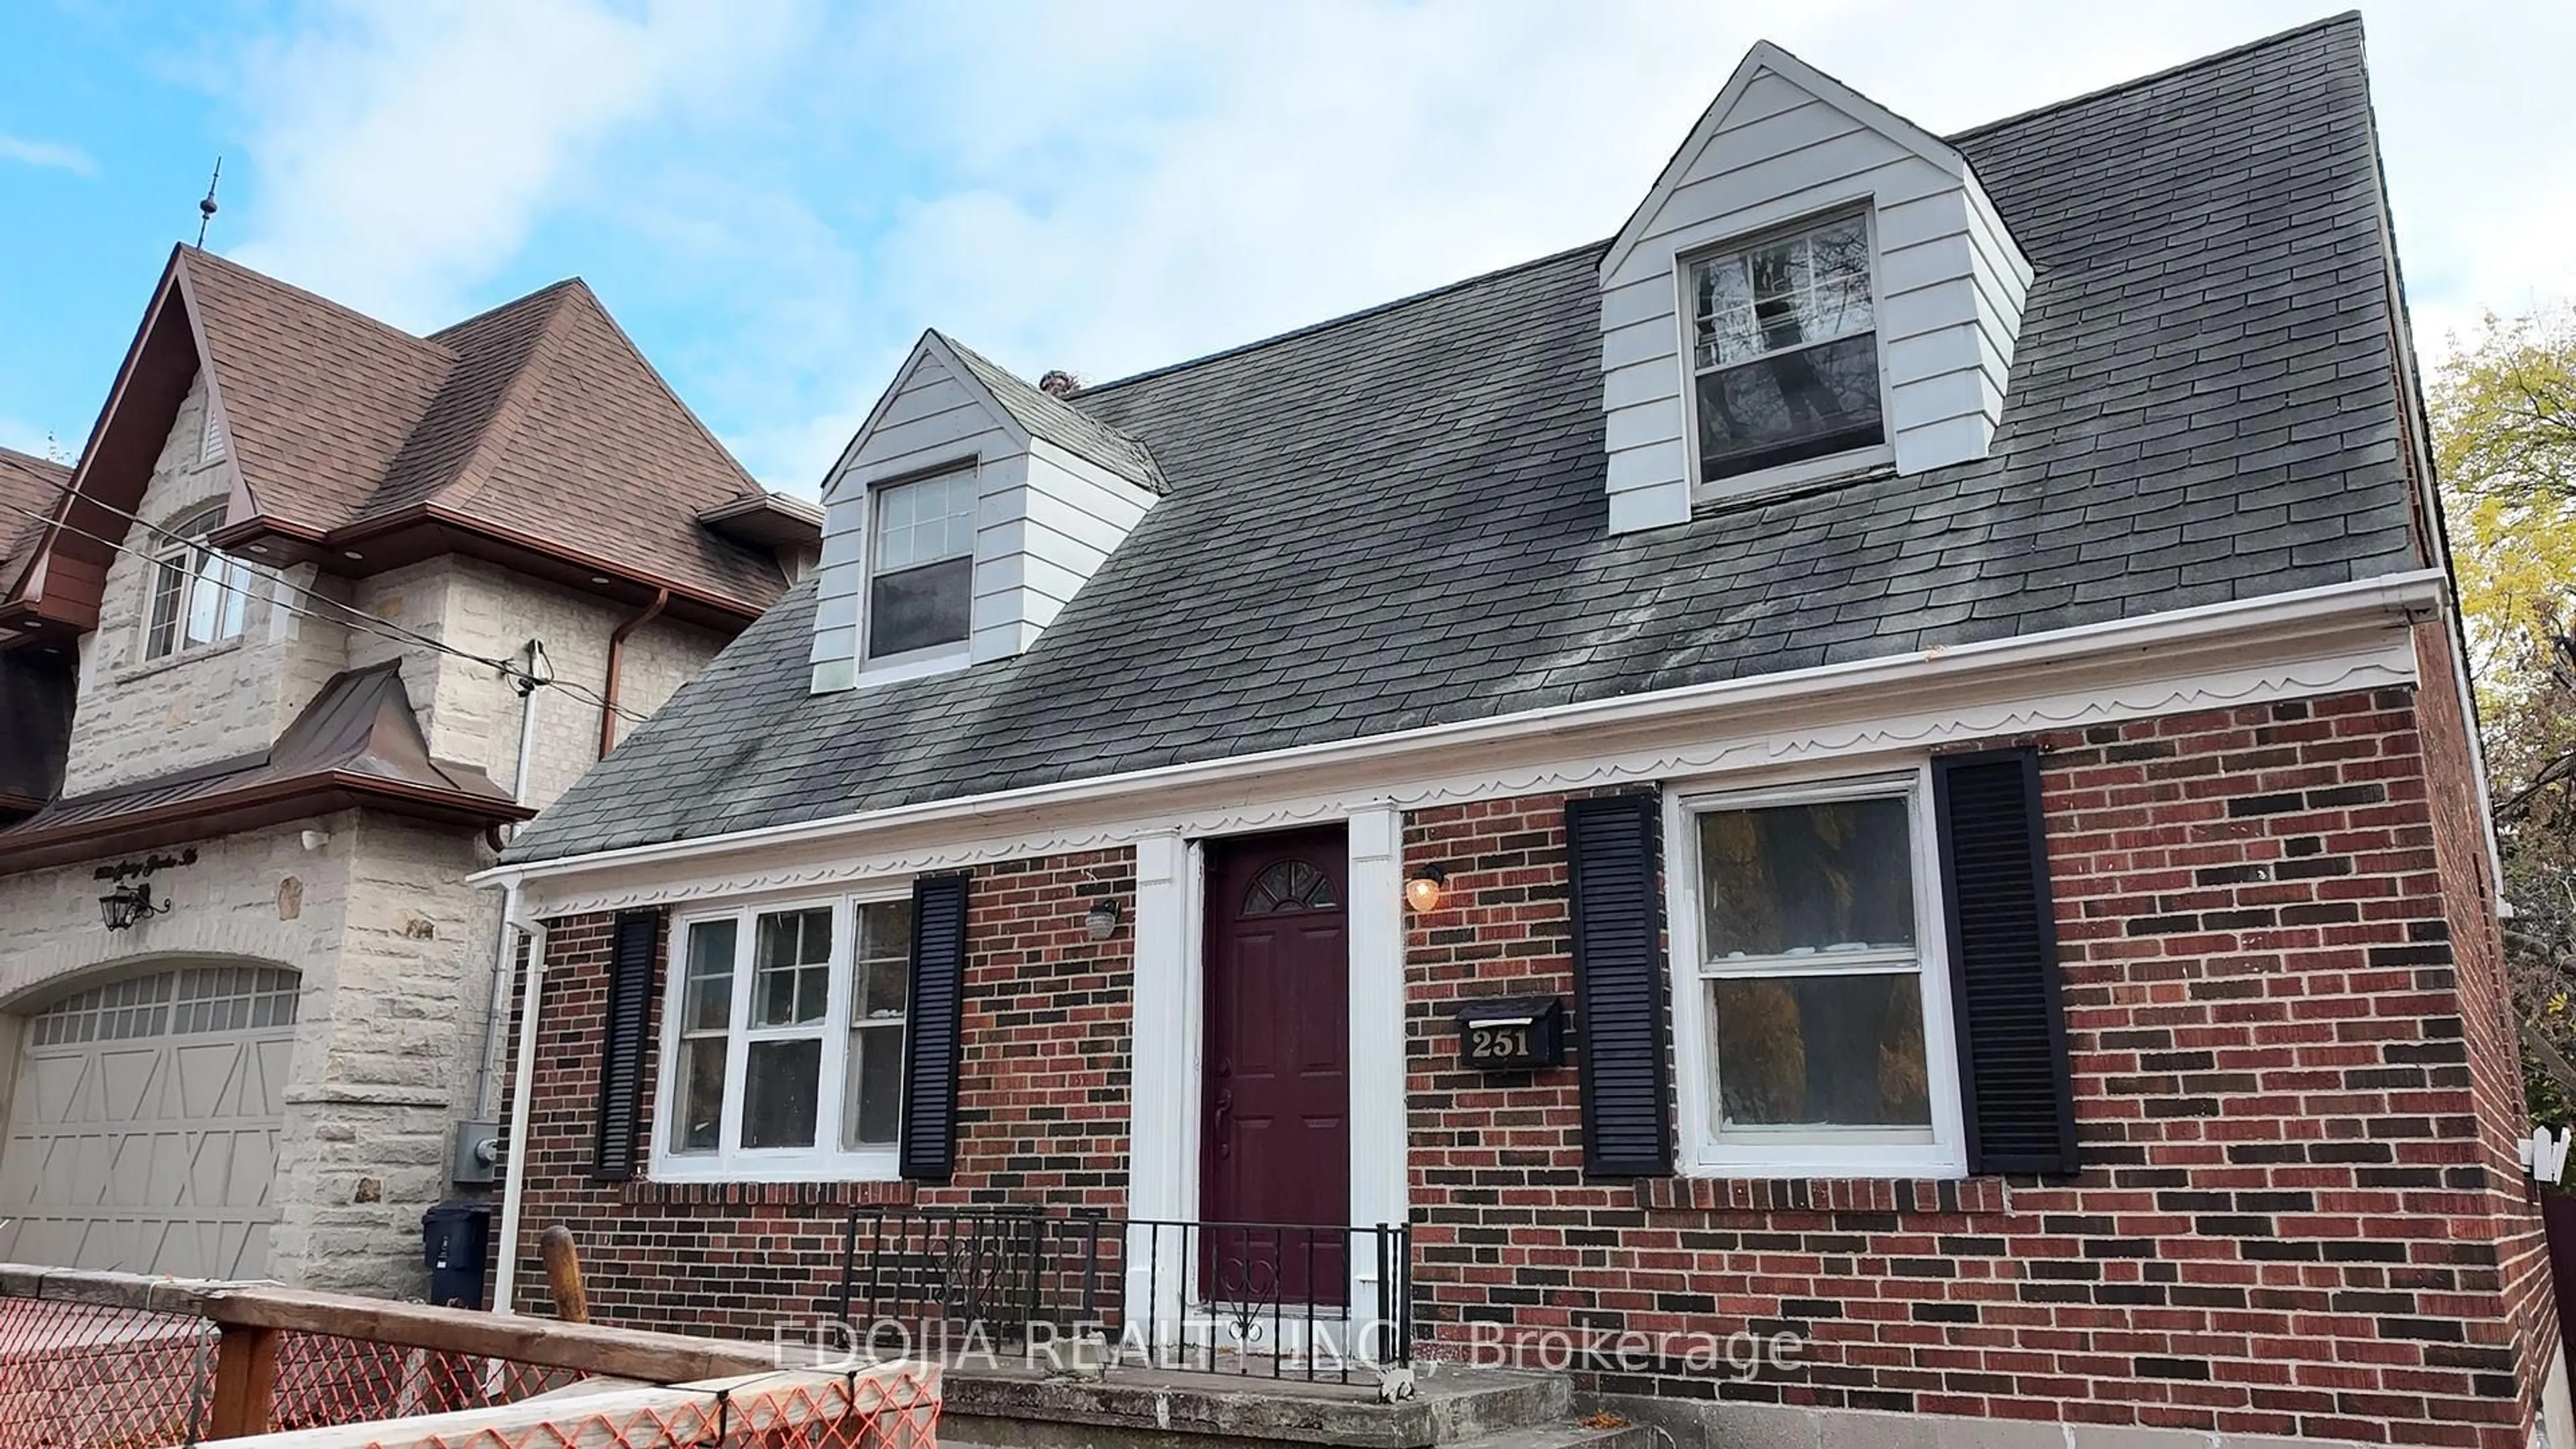
Third in median price growth in 2021 was East Humber Downsview, a large Etobicoke community bordered to the north by Steeles Avenue, Highway 401 to the south, Allen Road to the east, and the Humber River to the west. East Humber-Downsview is comprised mostly of detached homes (49.9%) with a good mix of condos and townhouses. The median sales price for 2021 was $860,000, up 19.8% for the year. East Humber-Downsview also led all Etobicoke communities for year-over-year growth in sales activity, up 31.2% in units sold compared to 20.6% for all of Etobicoke. The community has a variety of industrial land uses, notably around Humber Summit and near the Downsview Airport, while also featuring many parks and rivers. Black Creek flows east of Jane St. and Finch Ave., with green areas like Northwood Park and Downsview Dells Park, as well as Albion Gardens and Rowntree Mills Park on the banks of the Humber River to the west.

East Humber

Most notably, East Humber Downsview was one of only three Toronto communities with an average sales price that was lower than its median price in 2021. This is attributable to a greater proportion of low-income housing in certain pockets of the community since low sale prices will skew average values lower. Nonetheless, the community experienced a significant increase in buyer demand, with the average sales price also gaining 19.3% for the year, outperforming the average price gain for all of Etobicoke (10.5%), as well as the entire Toronto municipality (7.8%).

(Click infographic to enlarge)      Download here

Toronto Housing Market Sales Activity

As we approach the end of 2022’s first quarter, an update on sales activity across these Toronto communities will help consumers understand how the market is changing. Relative to 2020, a challenging year for large urban centres like Toronto, every Toronto community reported an increased sales activity in 2021, with the Beaches reporting the lowest annual gain at 1.3%. From a price perspective, only two communities located in Toronto Central – Rosedale and Mount Pleasant – saw decreases to both their average and median sale prices in 2021. On the following pages, a table outlining key transaction trends by community and supporting map is presented, with all but one community reporting a decreased or unchanged median selling time during 2021.

(Click infographic to enlarge)     Download here

(Click infographic to enlarge)     Download here

(Click infographic to enlarge)     Download here

(Click infographic to enlarge)     Download here

(Click infographic to enlarge)     Download here

The Toronto Housing Market Report will be updated on a quarterly basis throughout 2022. Subscribe to Wahi’s newsletter to receive report updates and other market notifications.

John Peloza, CFA

Wahi writer

What Can You Afford?

Use our mortgage calculator to calculate your total monthly expenses for a property.

You might also like

Wahi

Get so in the Know

On everything real estate.

From the latest Canadian housing market trends and stories, to insider tips and tricks.

By clicking “subscribe”, you agree to receive emails from Wahi. You always have the option to unsubscribe at any time, see our privacy policy for more details.