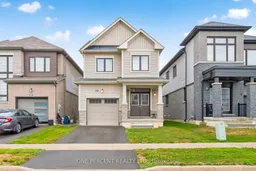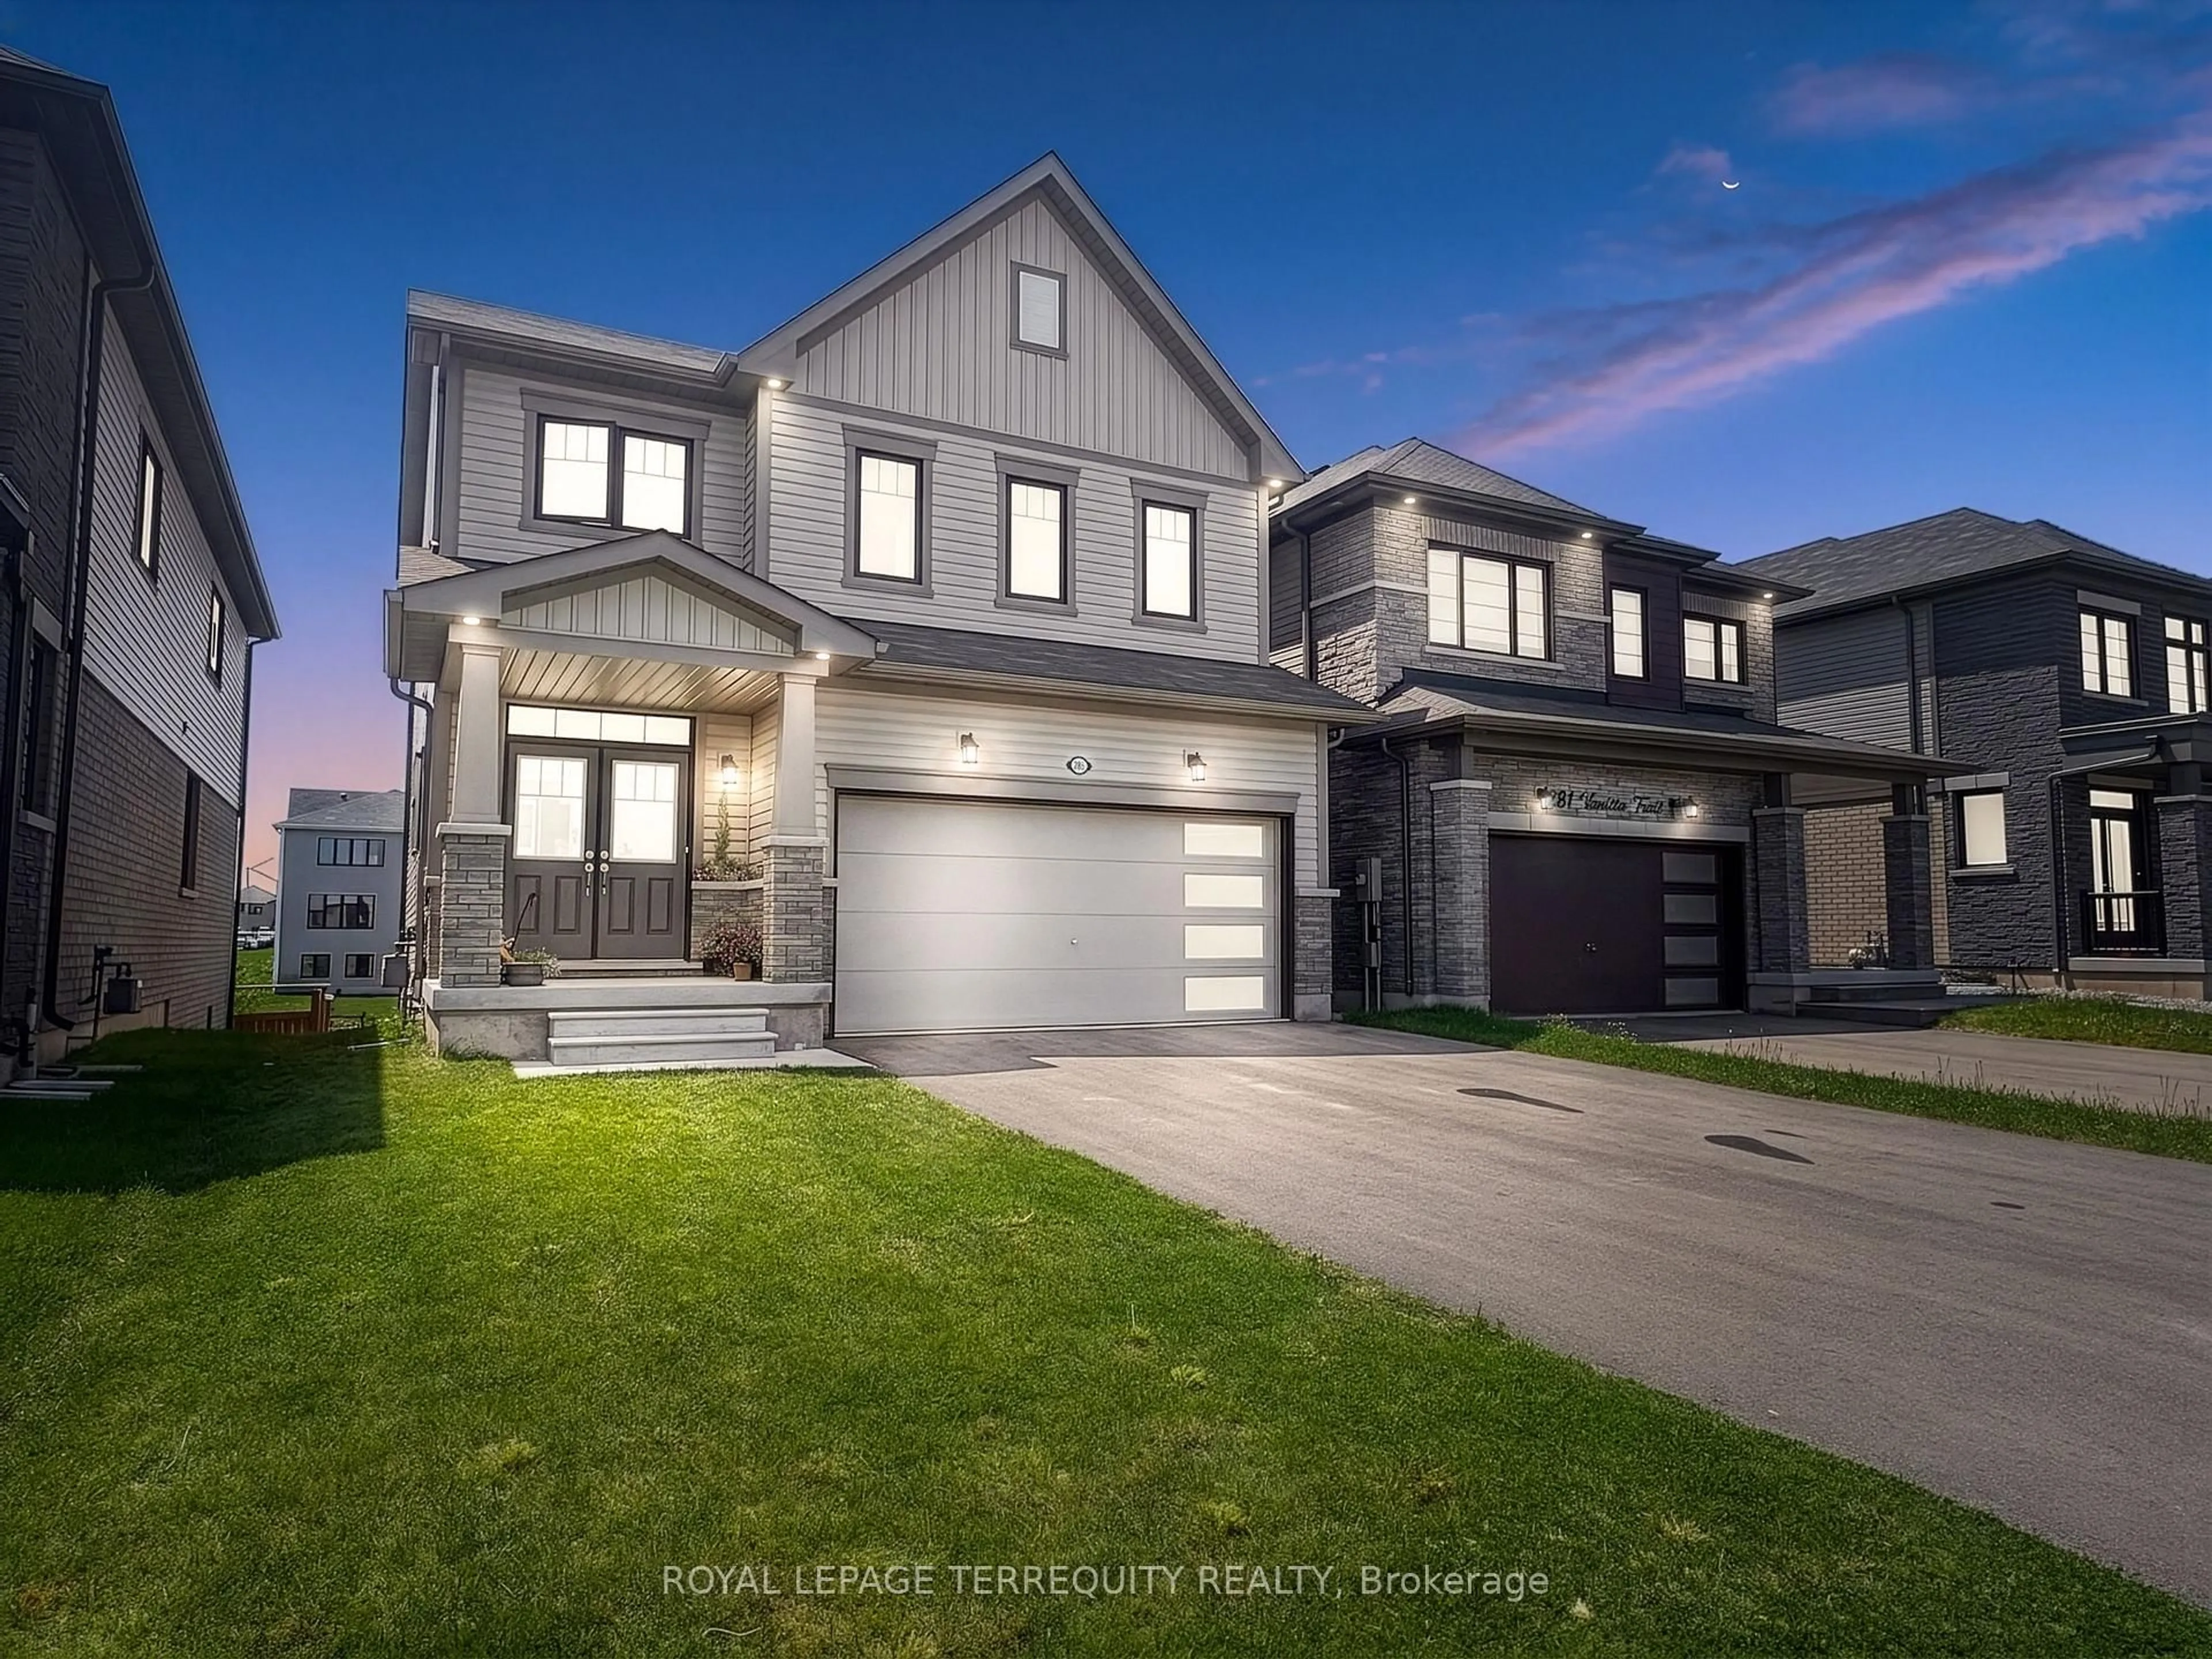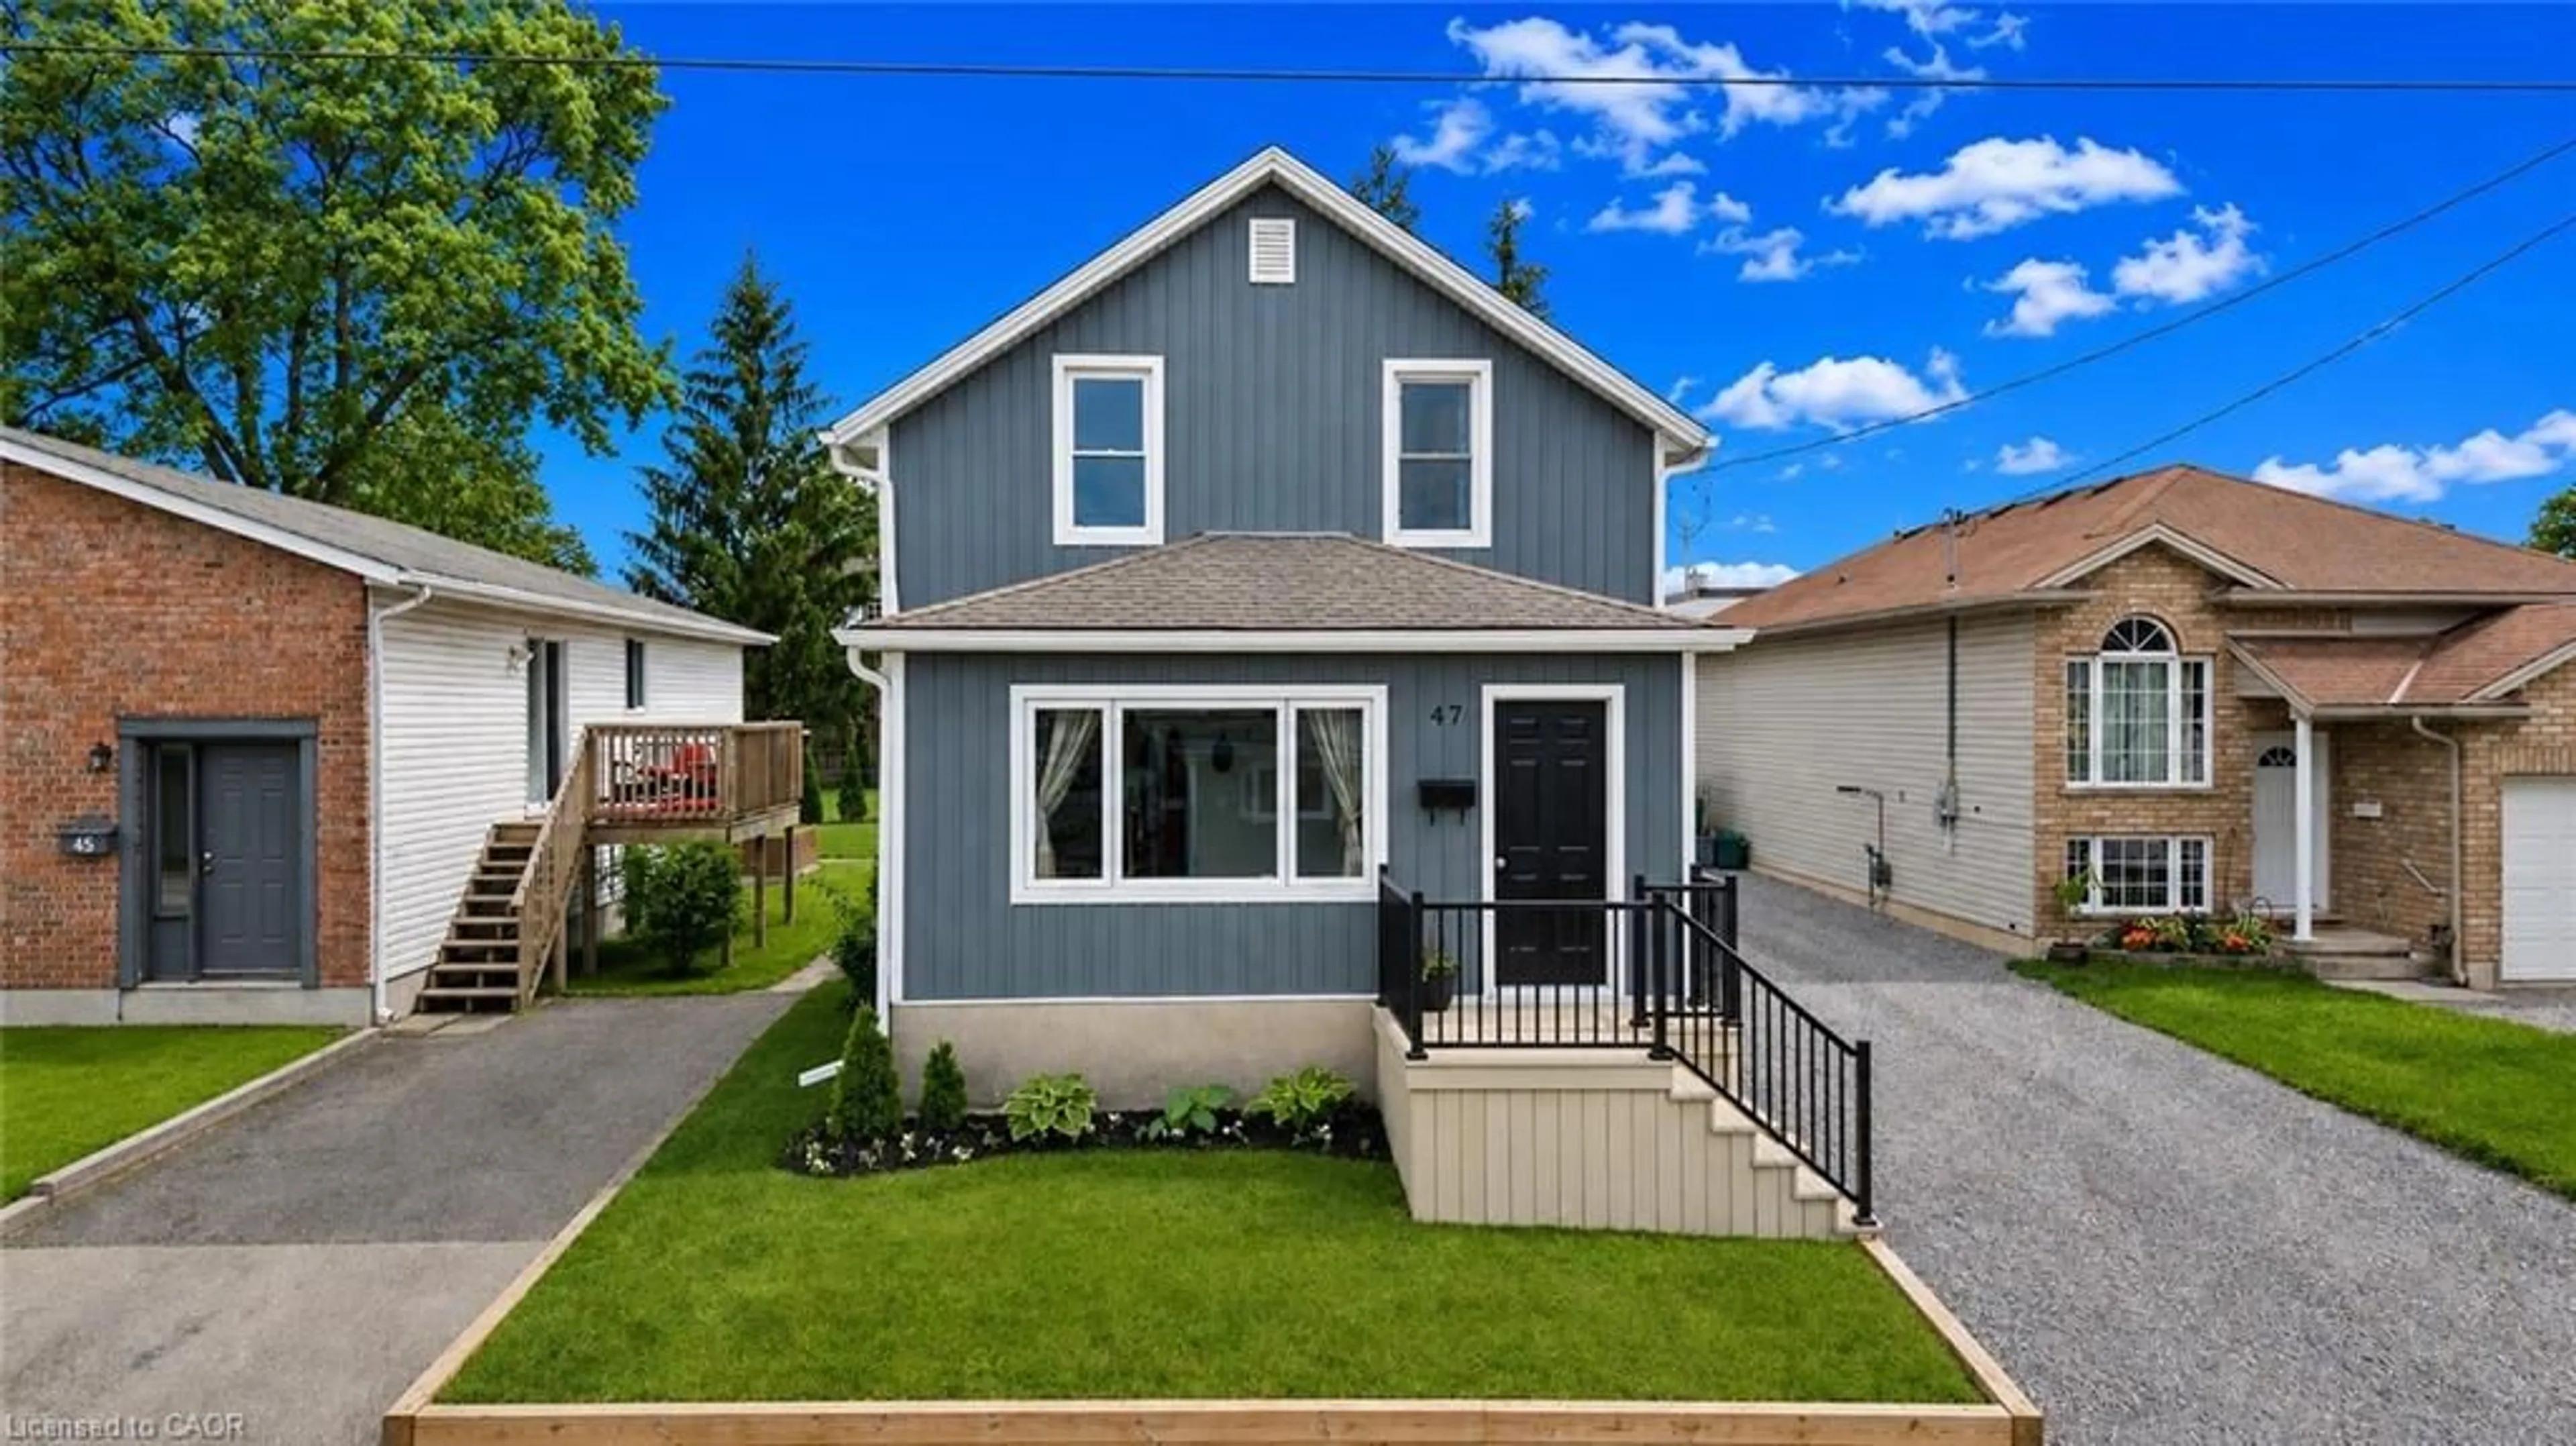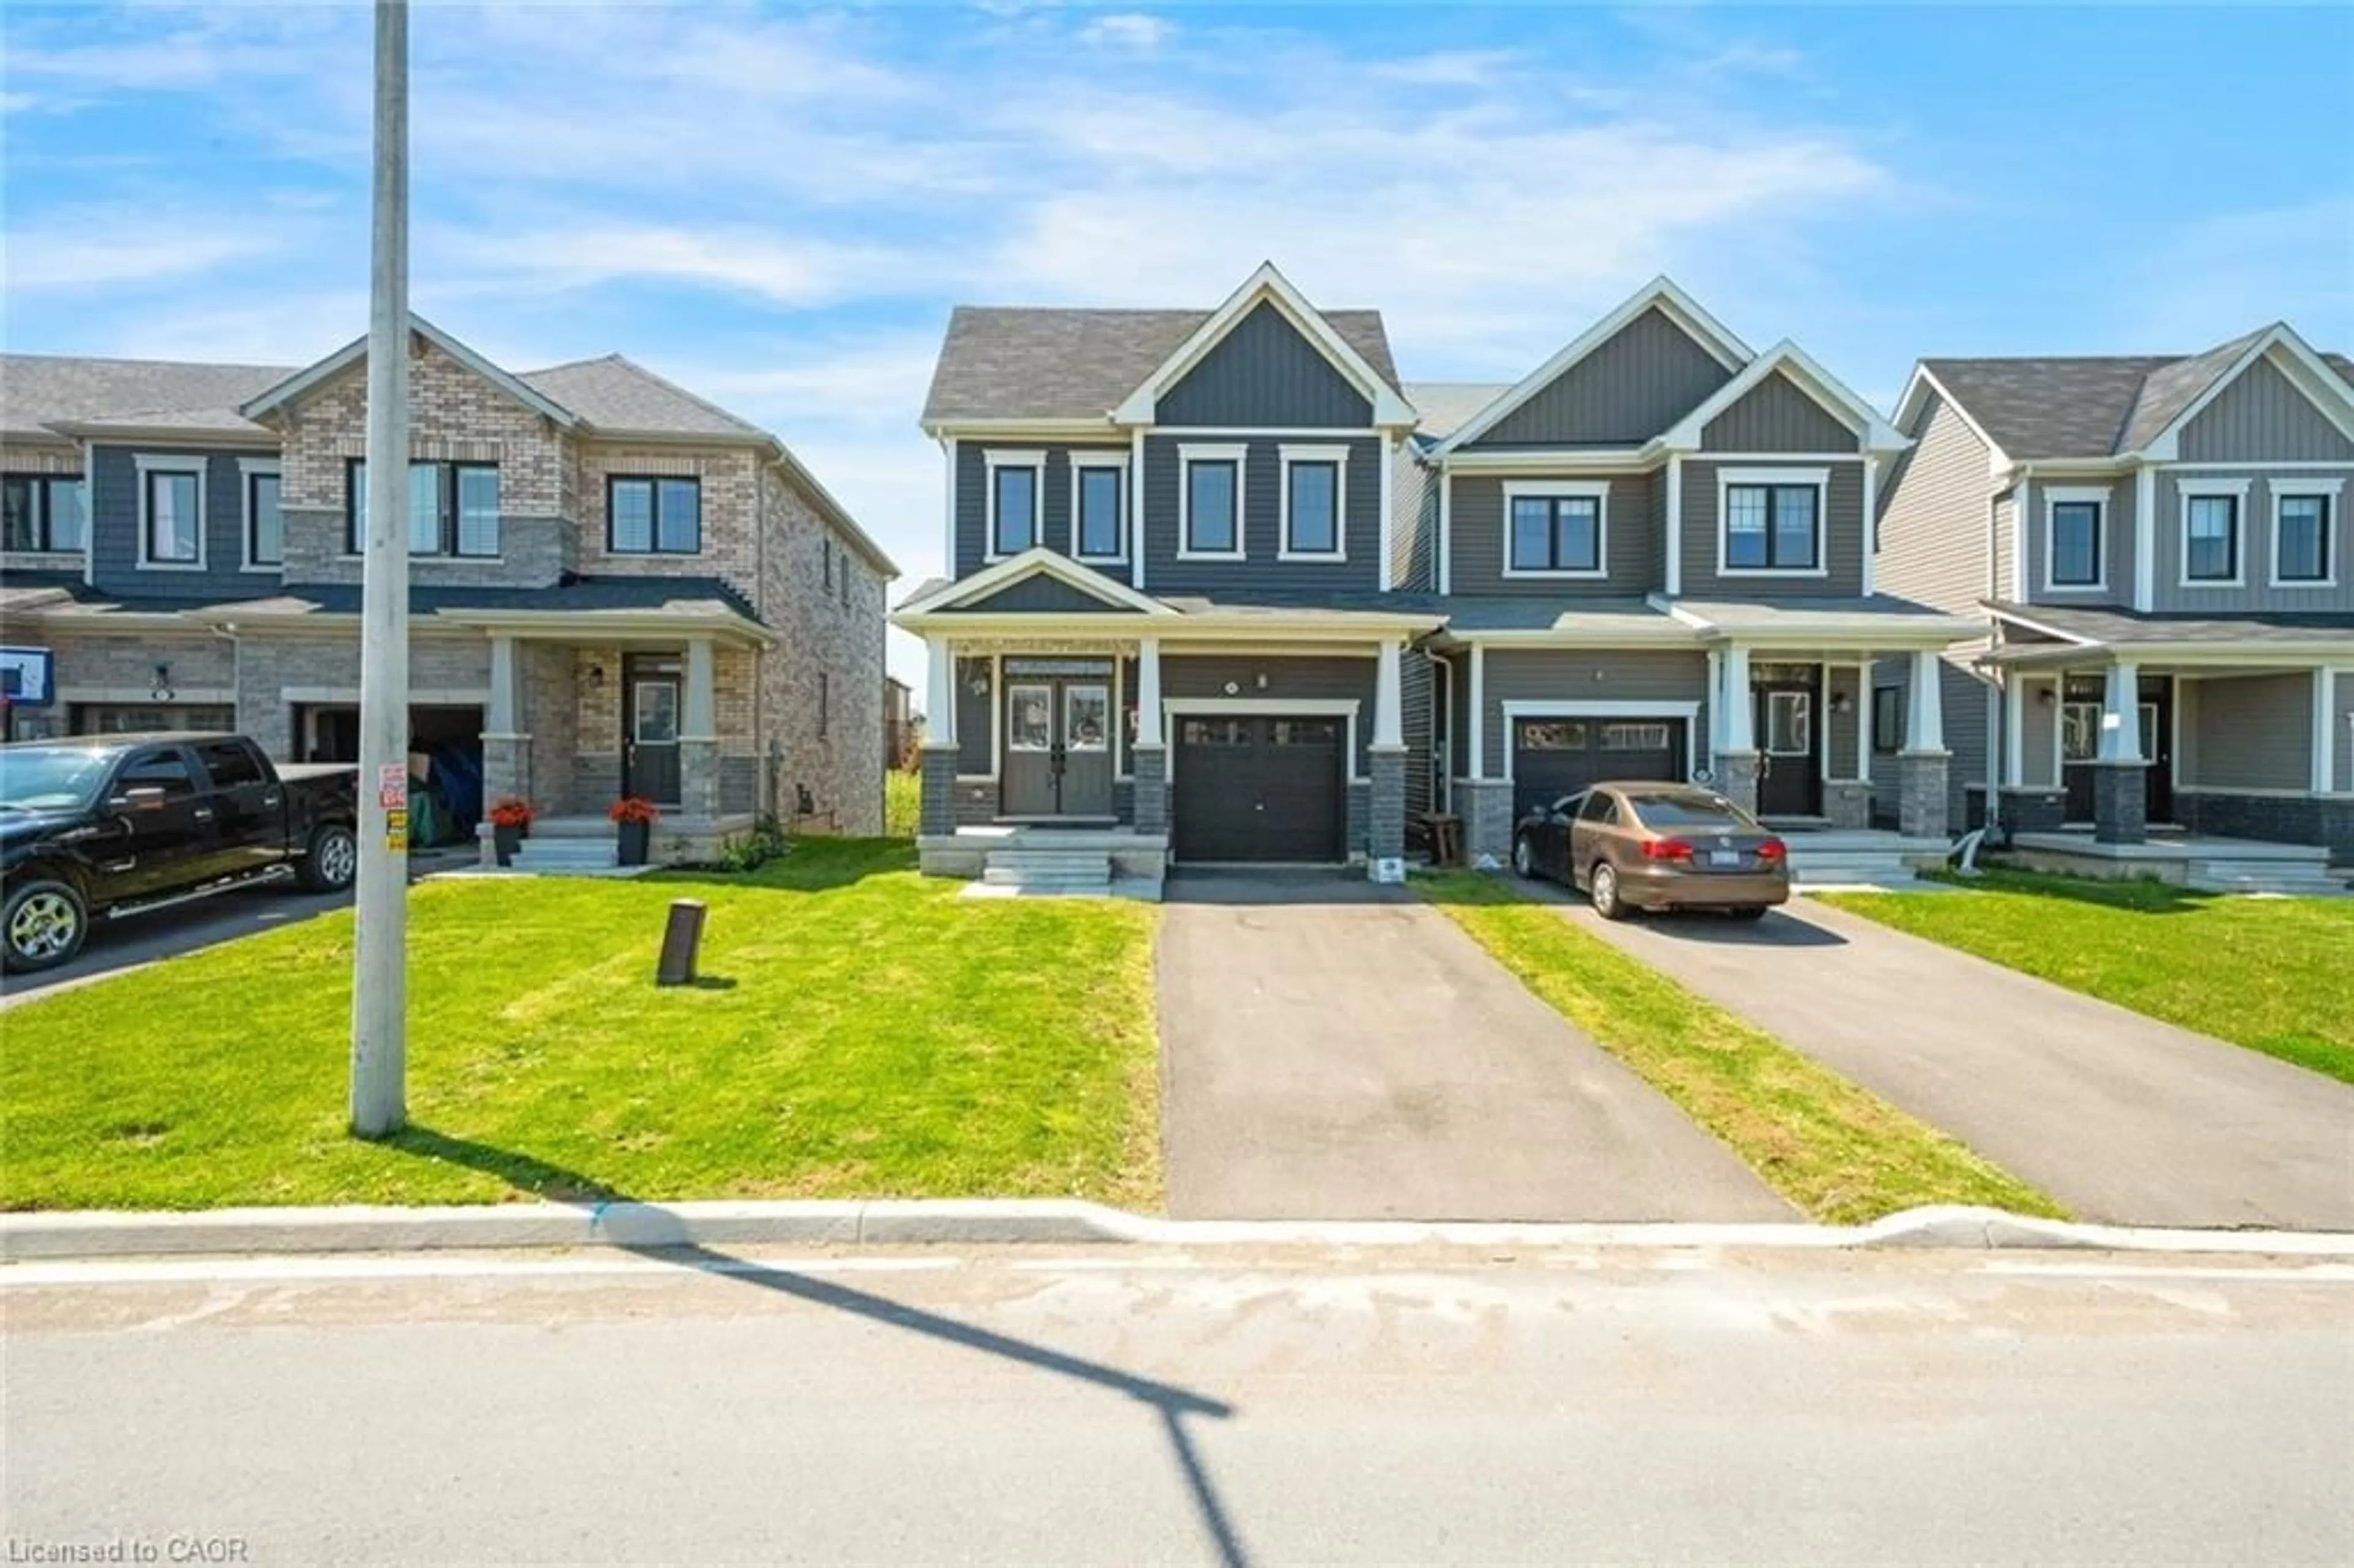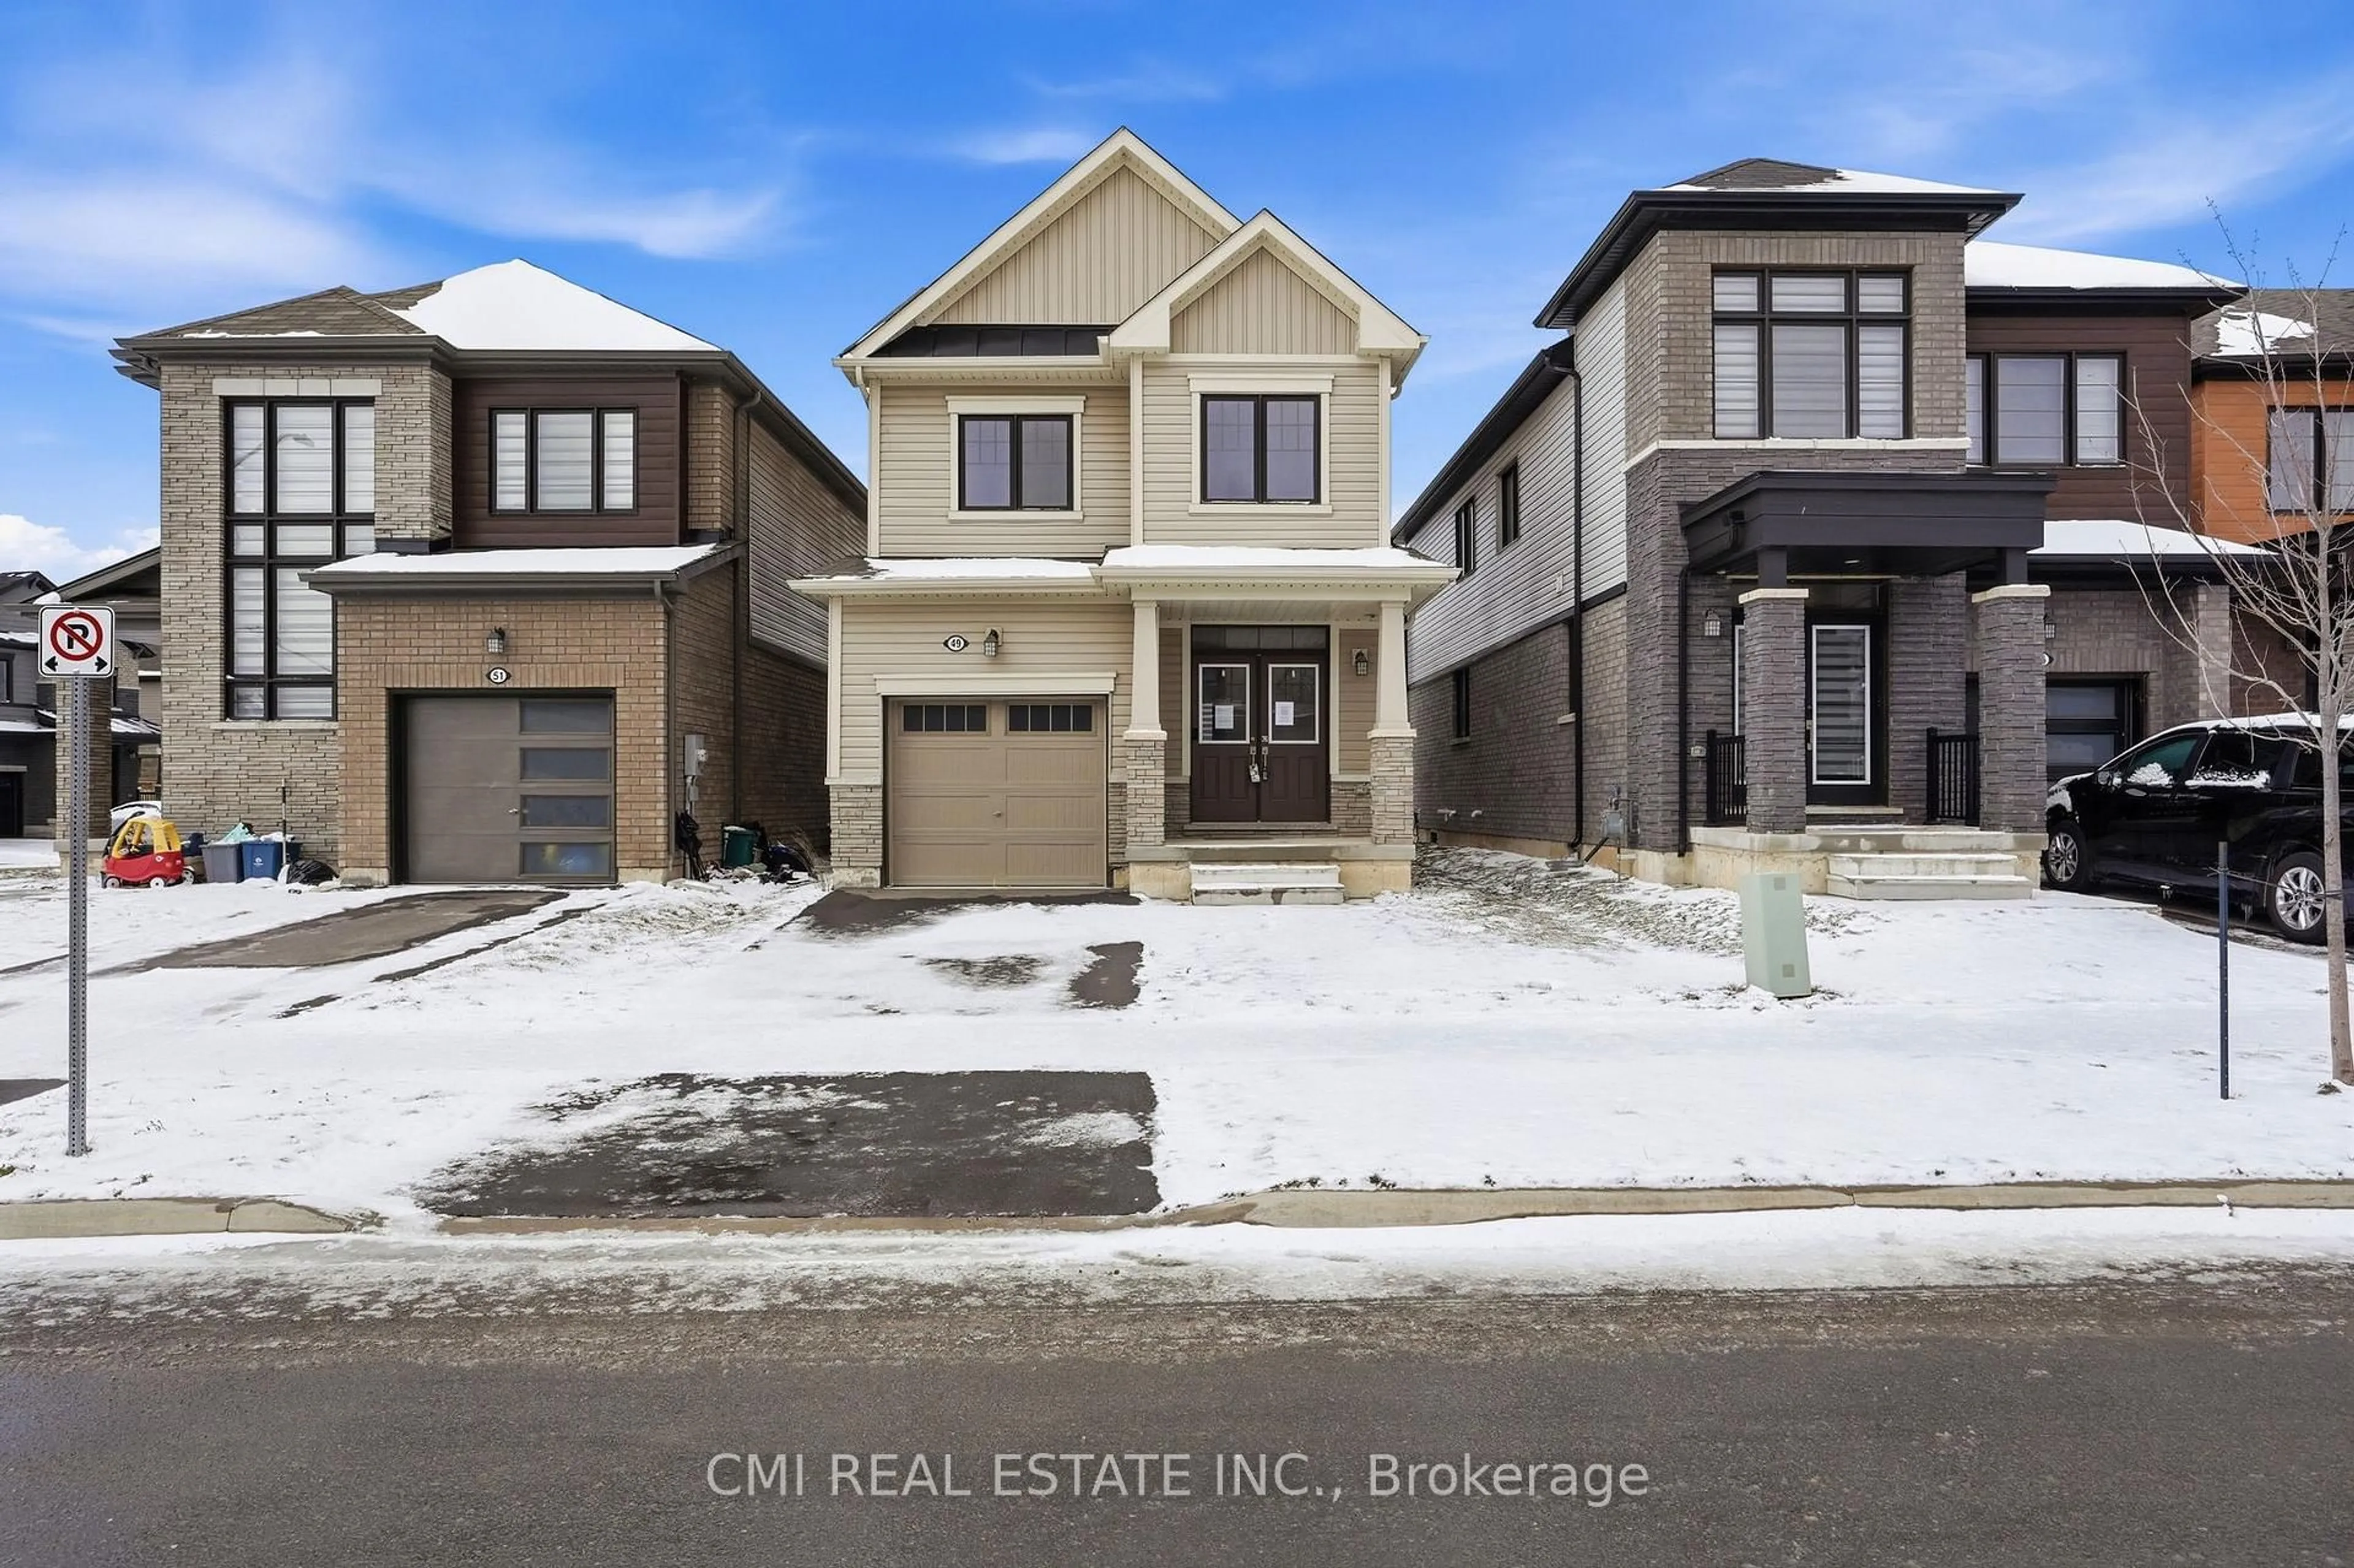
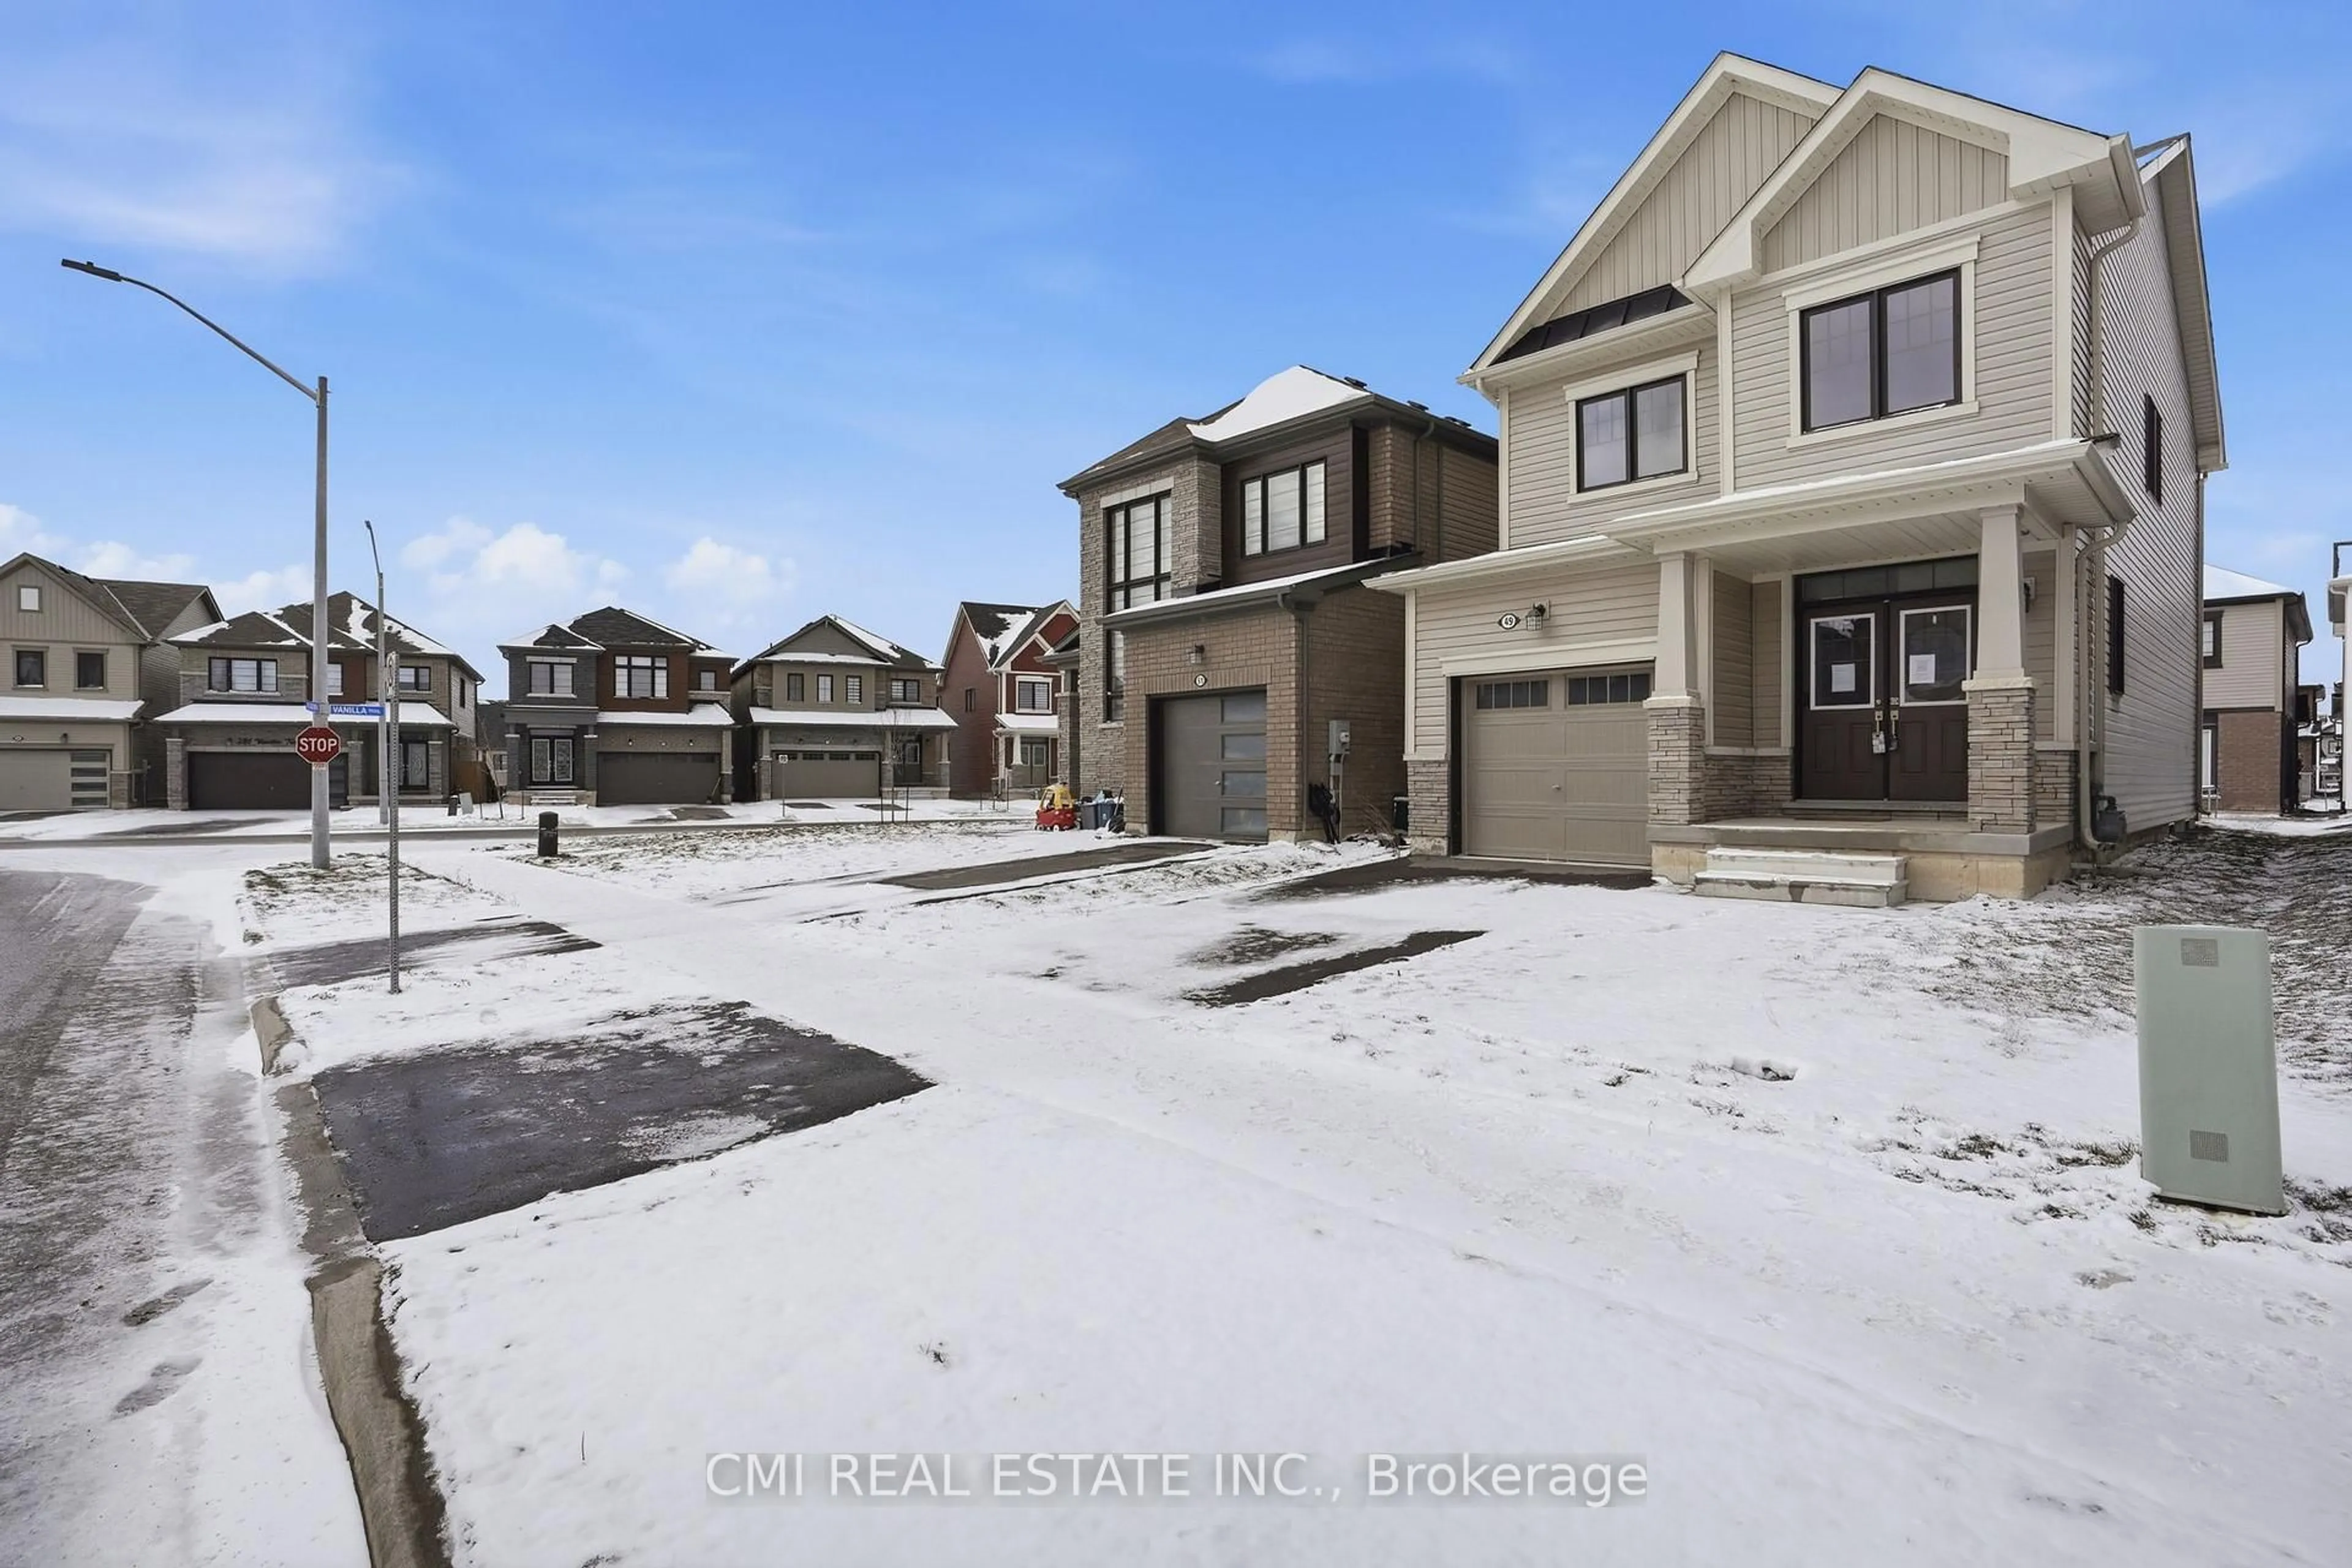
49 Sugar May Ave, Thorold, Ontario L2V 0L3
Contact us about this property
Highlights
Estimated valueThis is the price Wahi expects this property to sell for.
The calculation is powered by our Instant Home Value Estimate, which uses current market and property price trends to estimate your home’s value with a 90% accuracy rate.Not available
Price/Sqft$396/sqft
Monthly cost
Open Calculator
Description
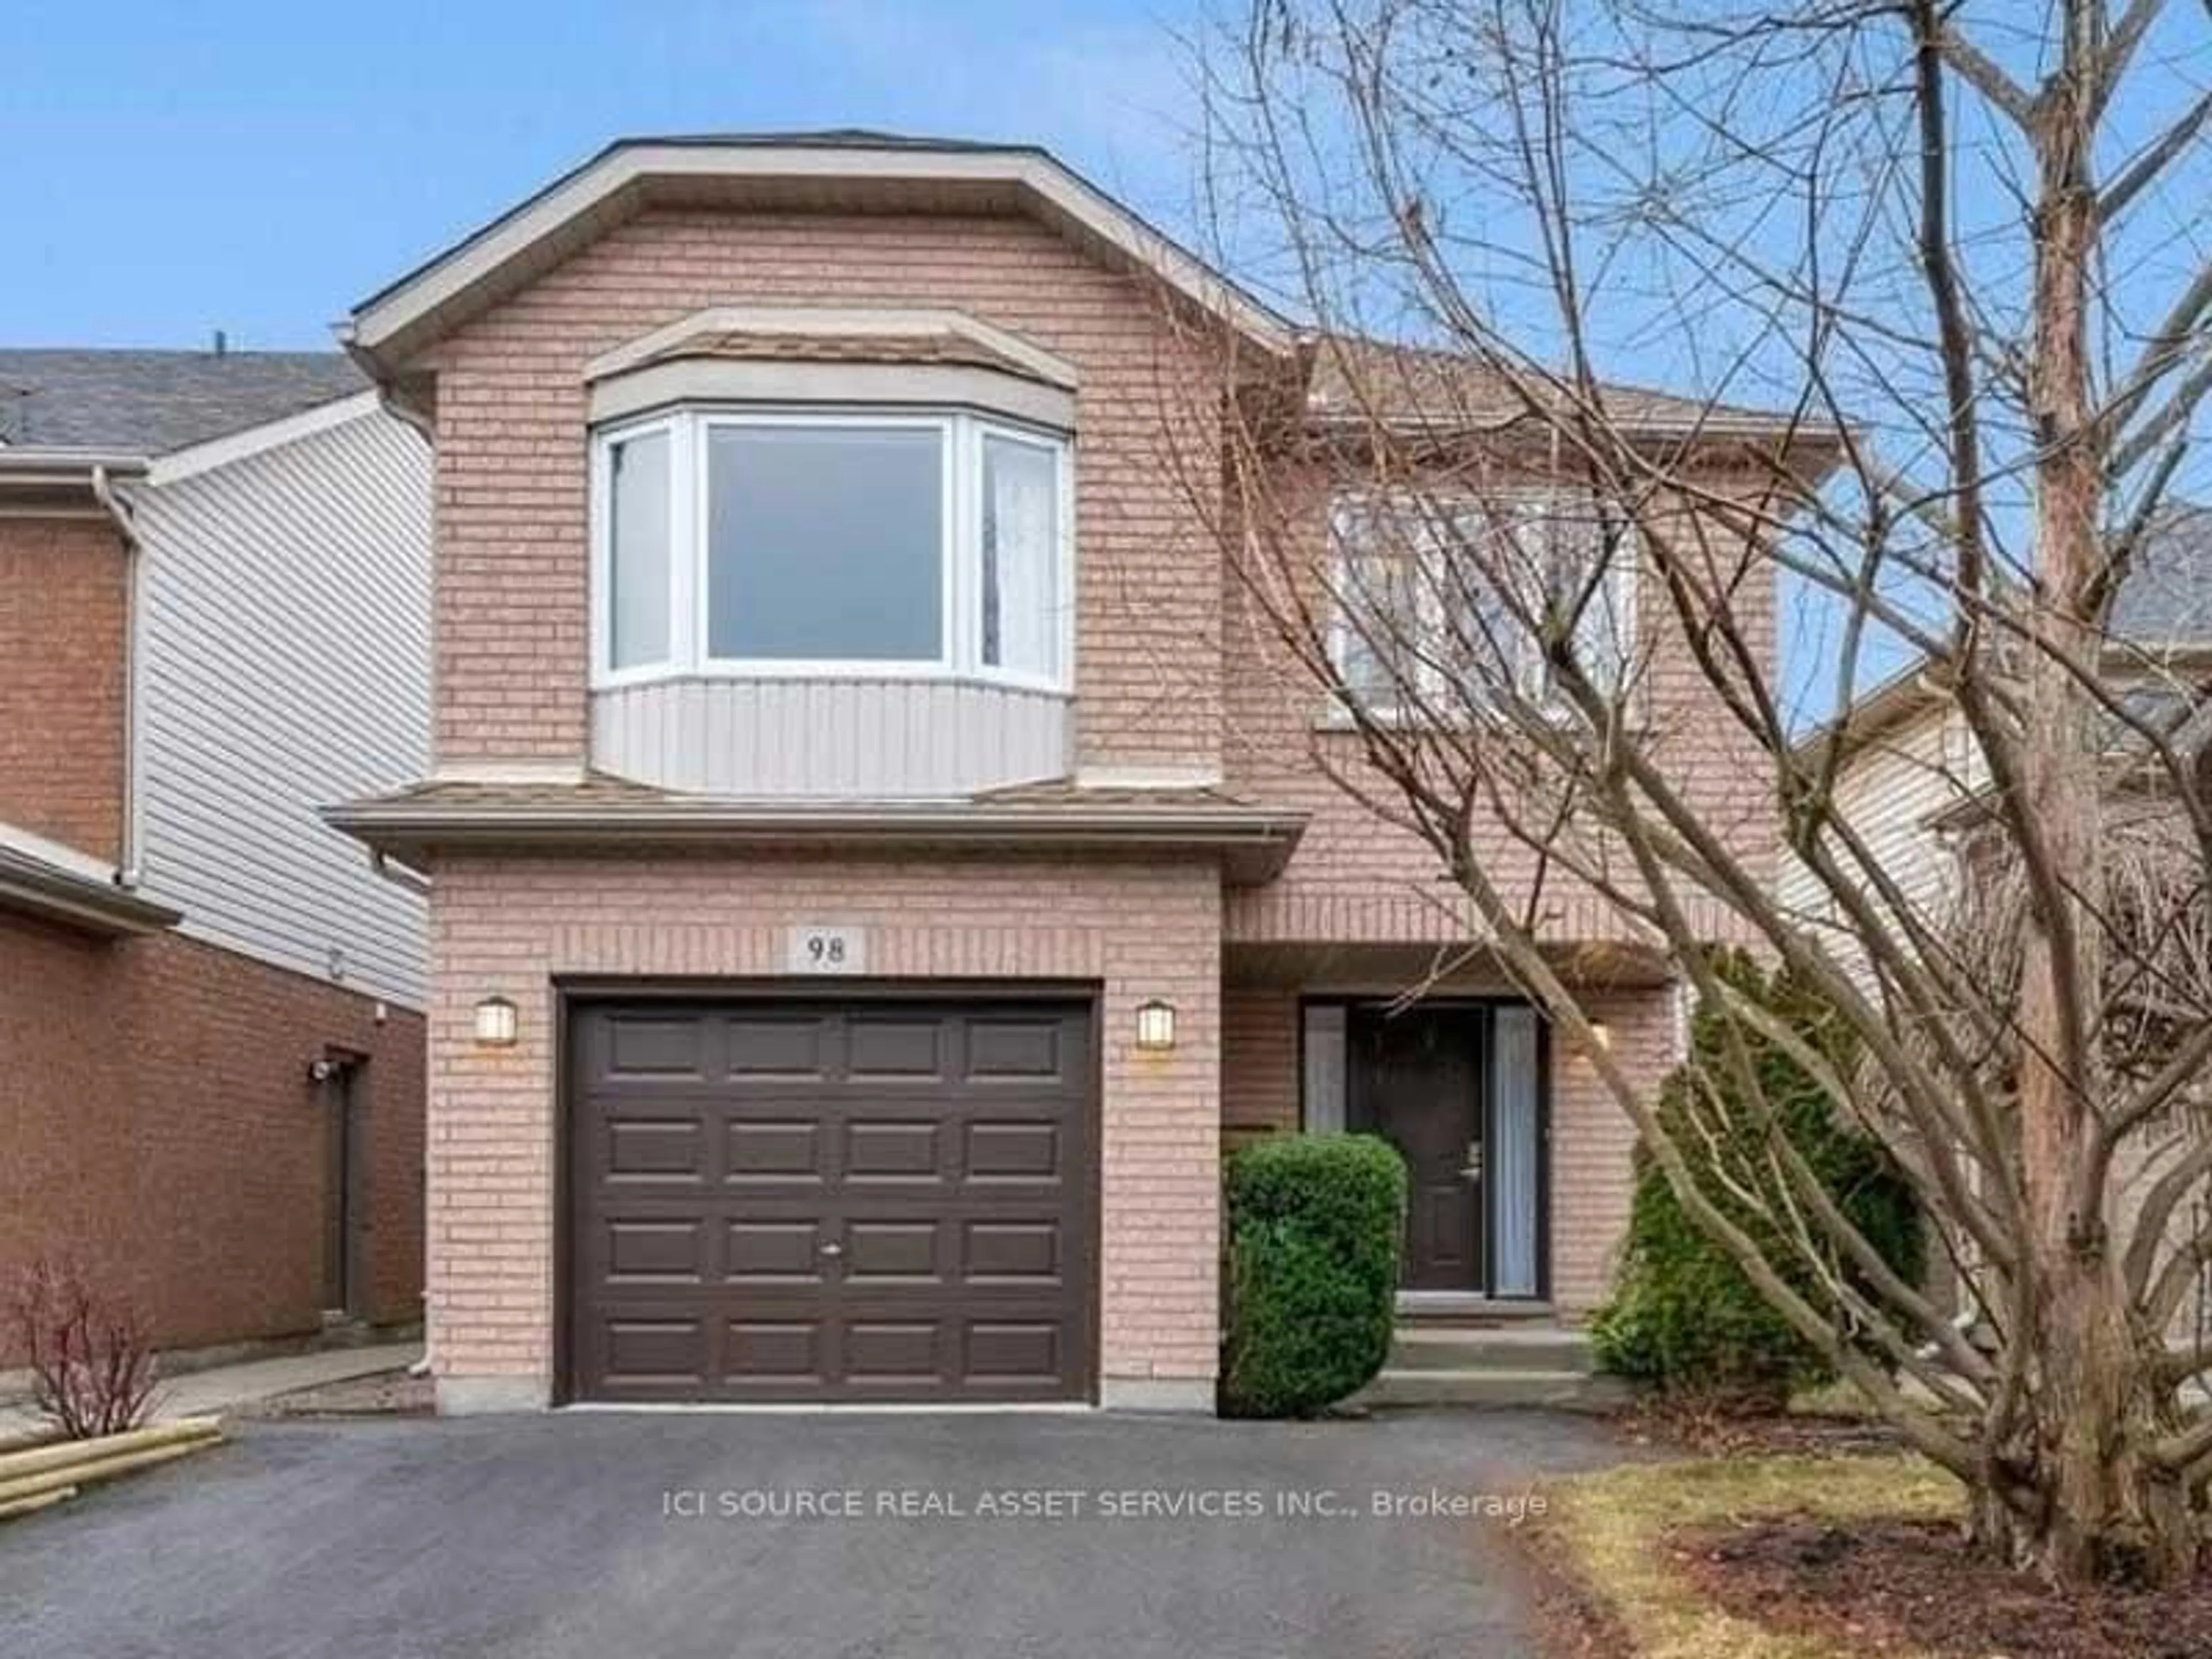
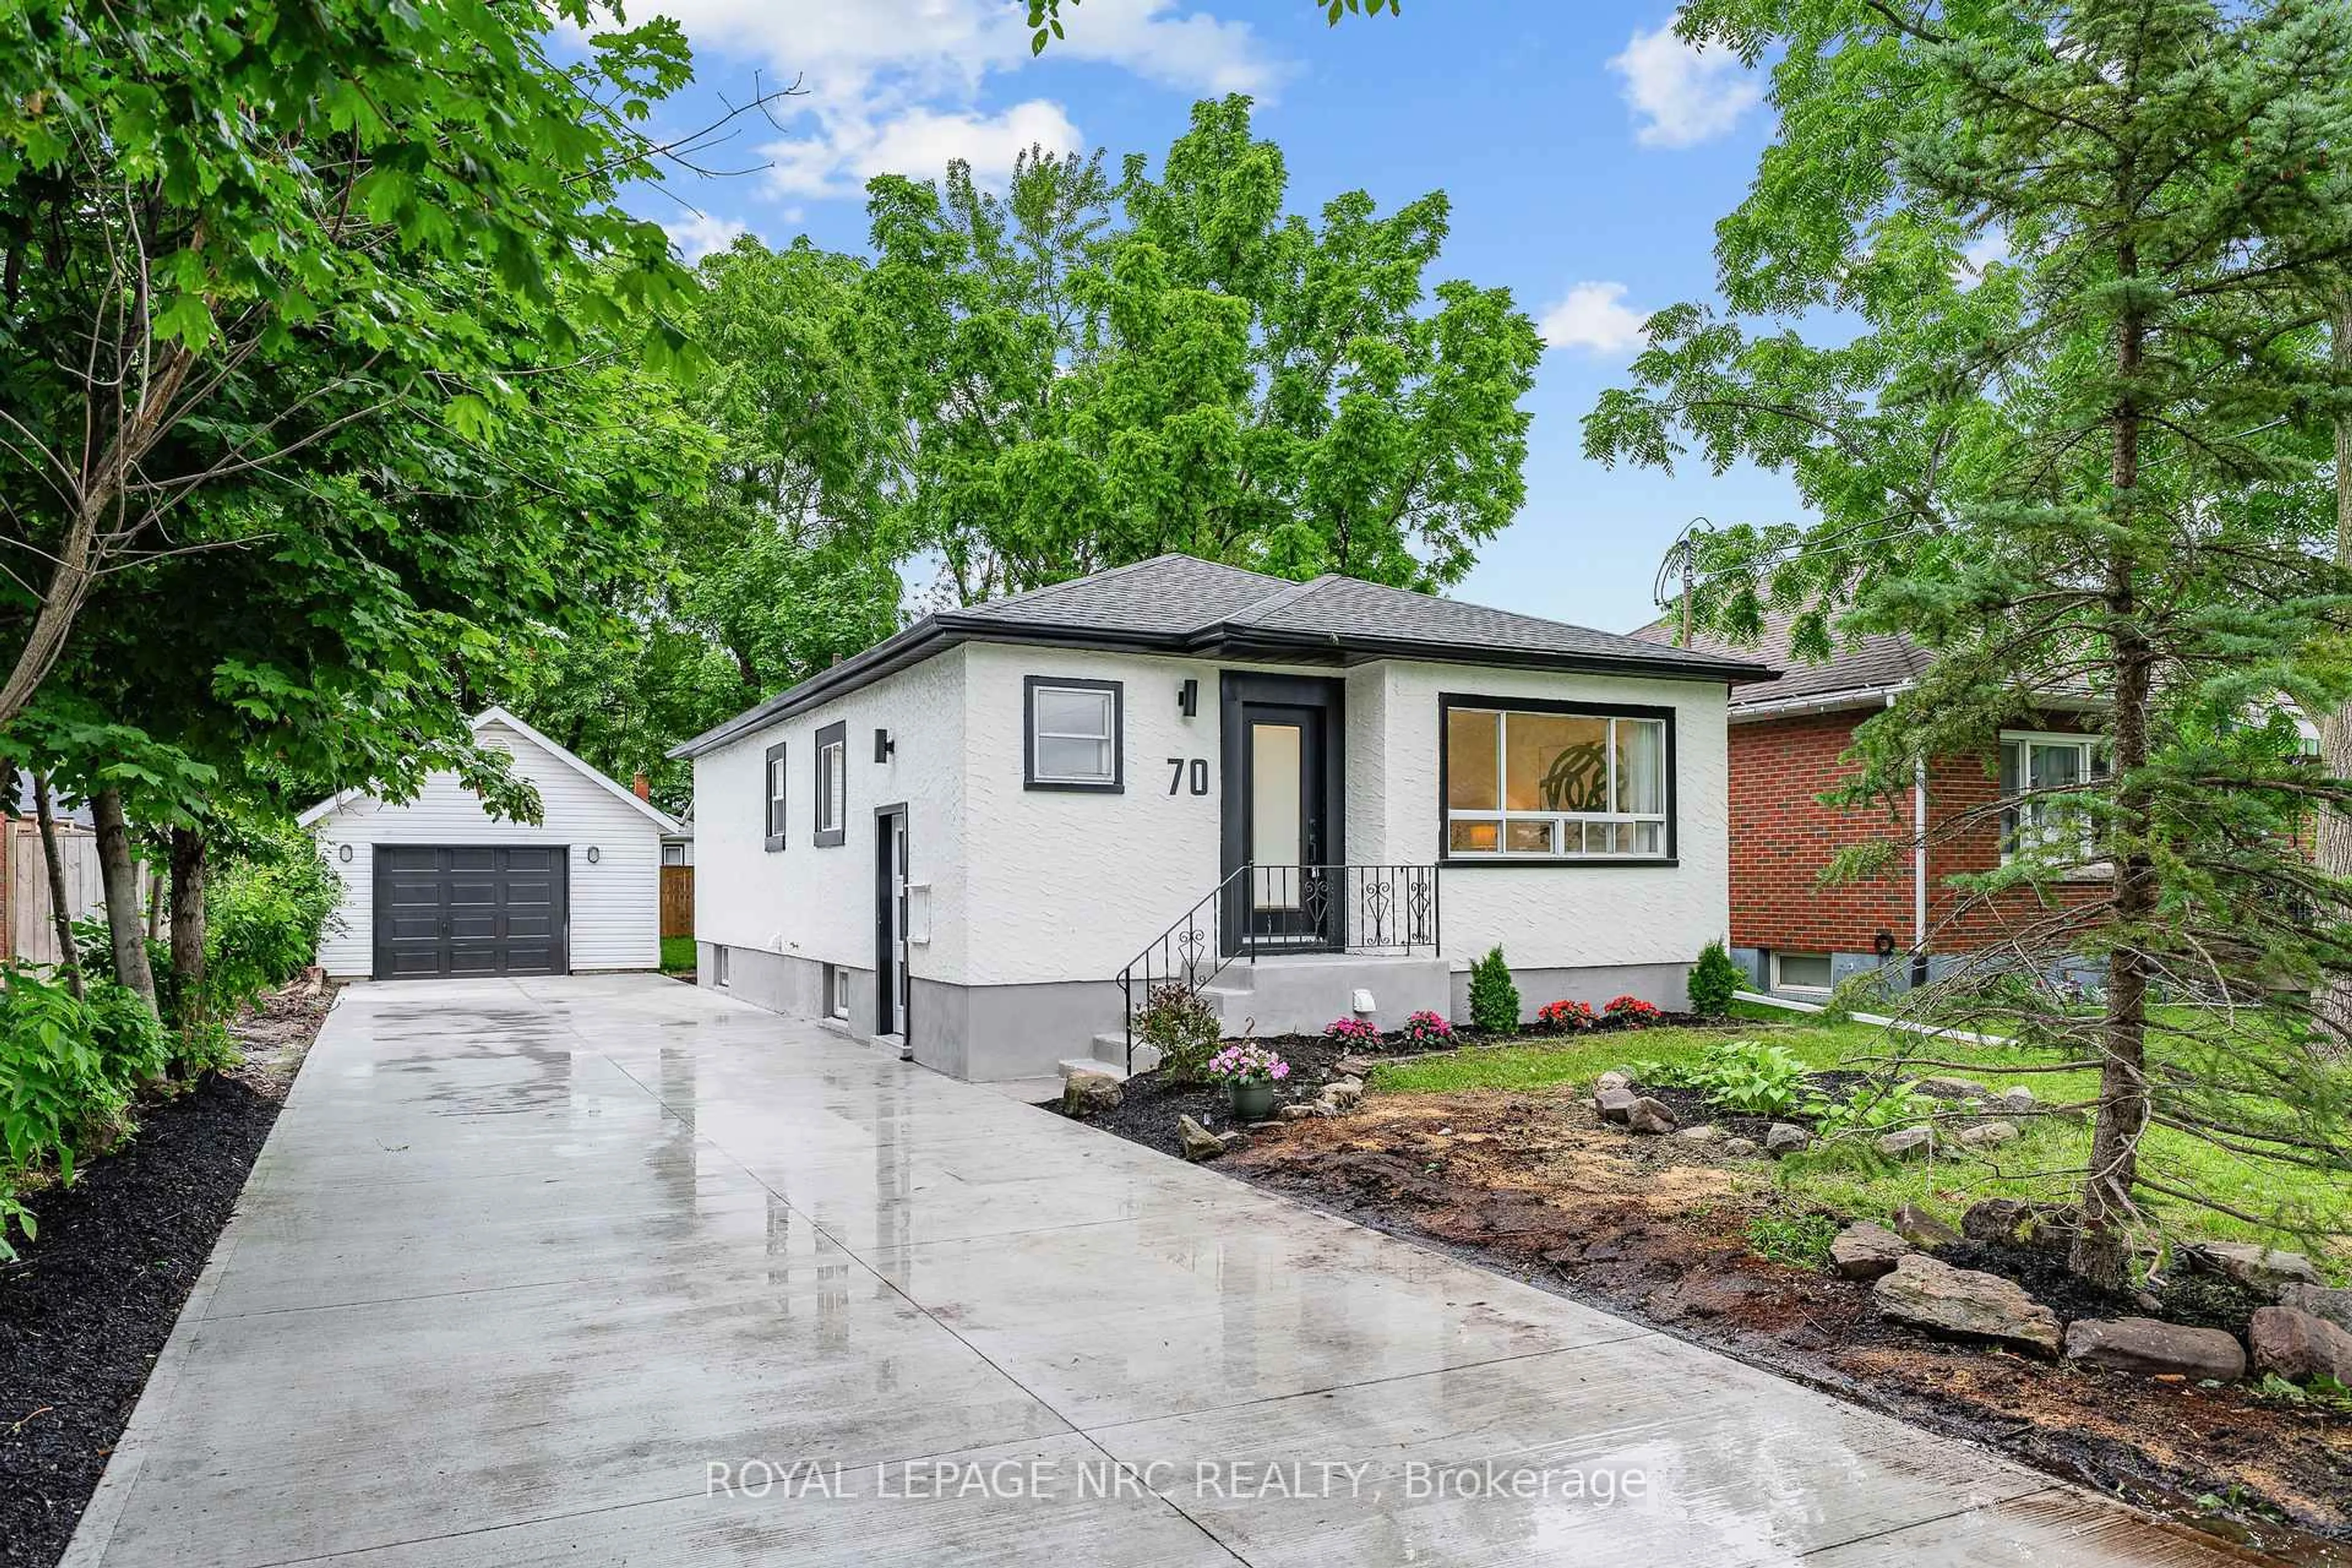
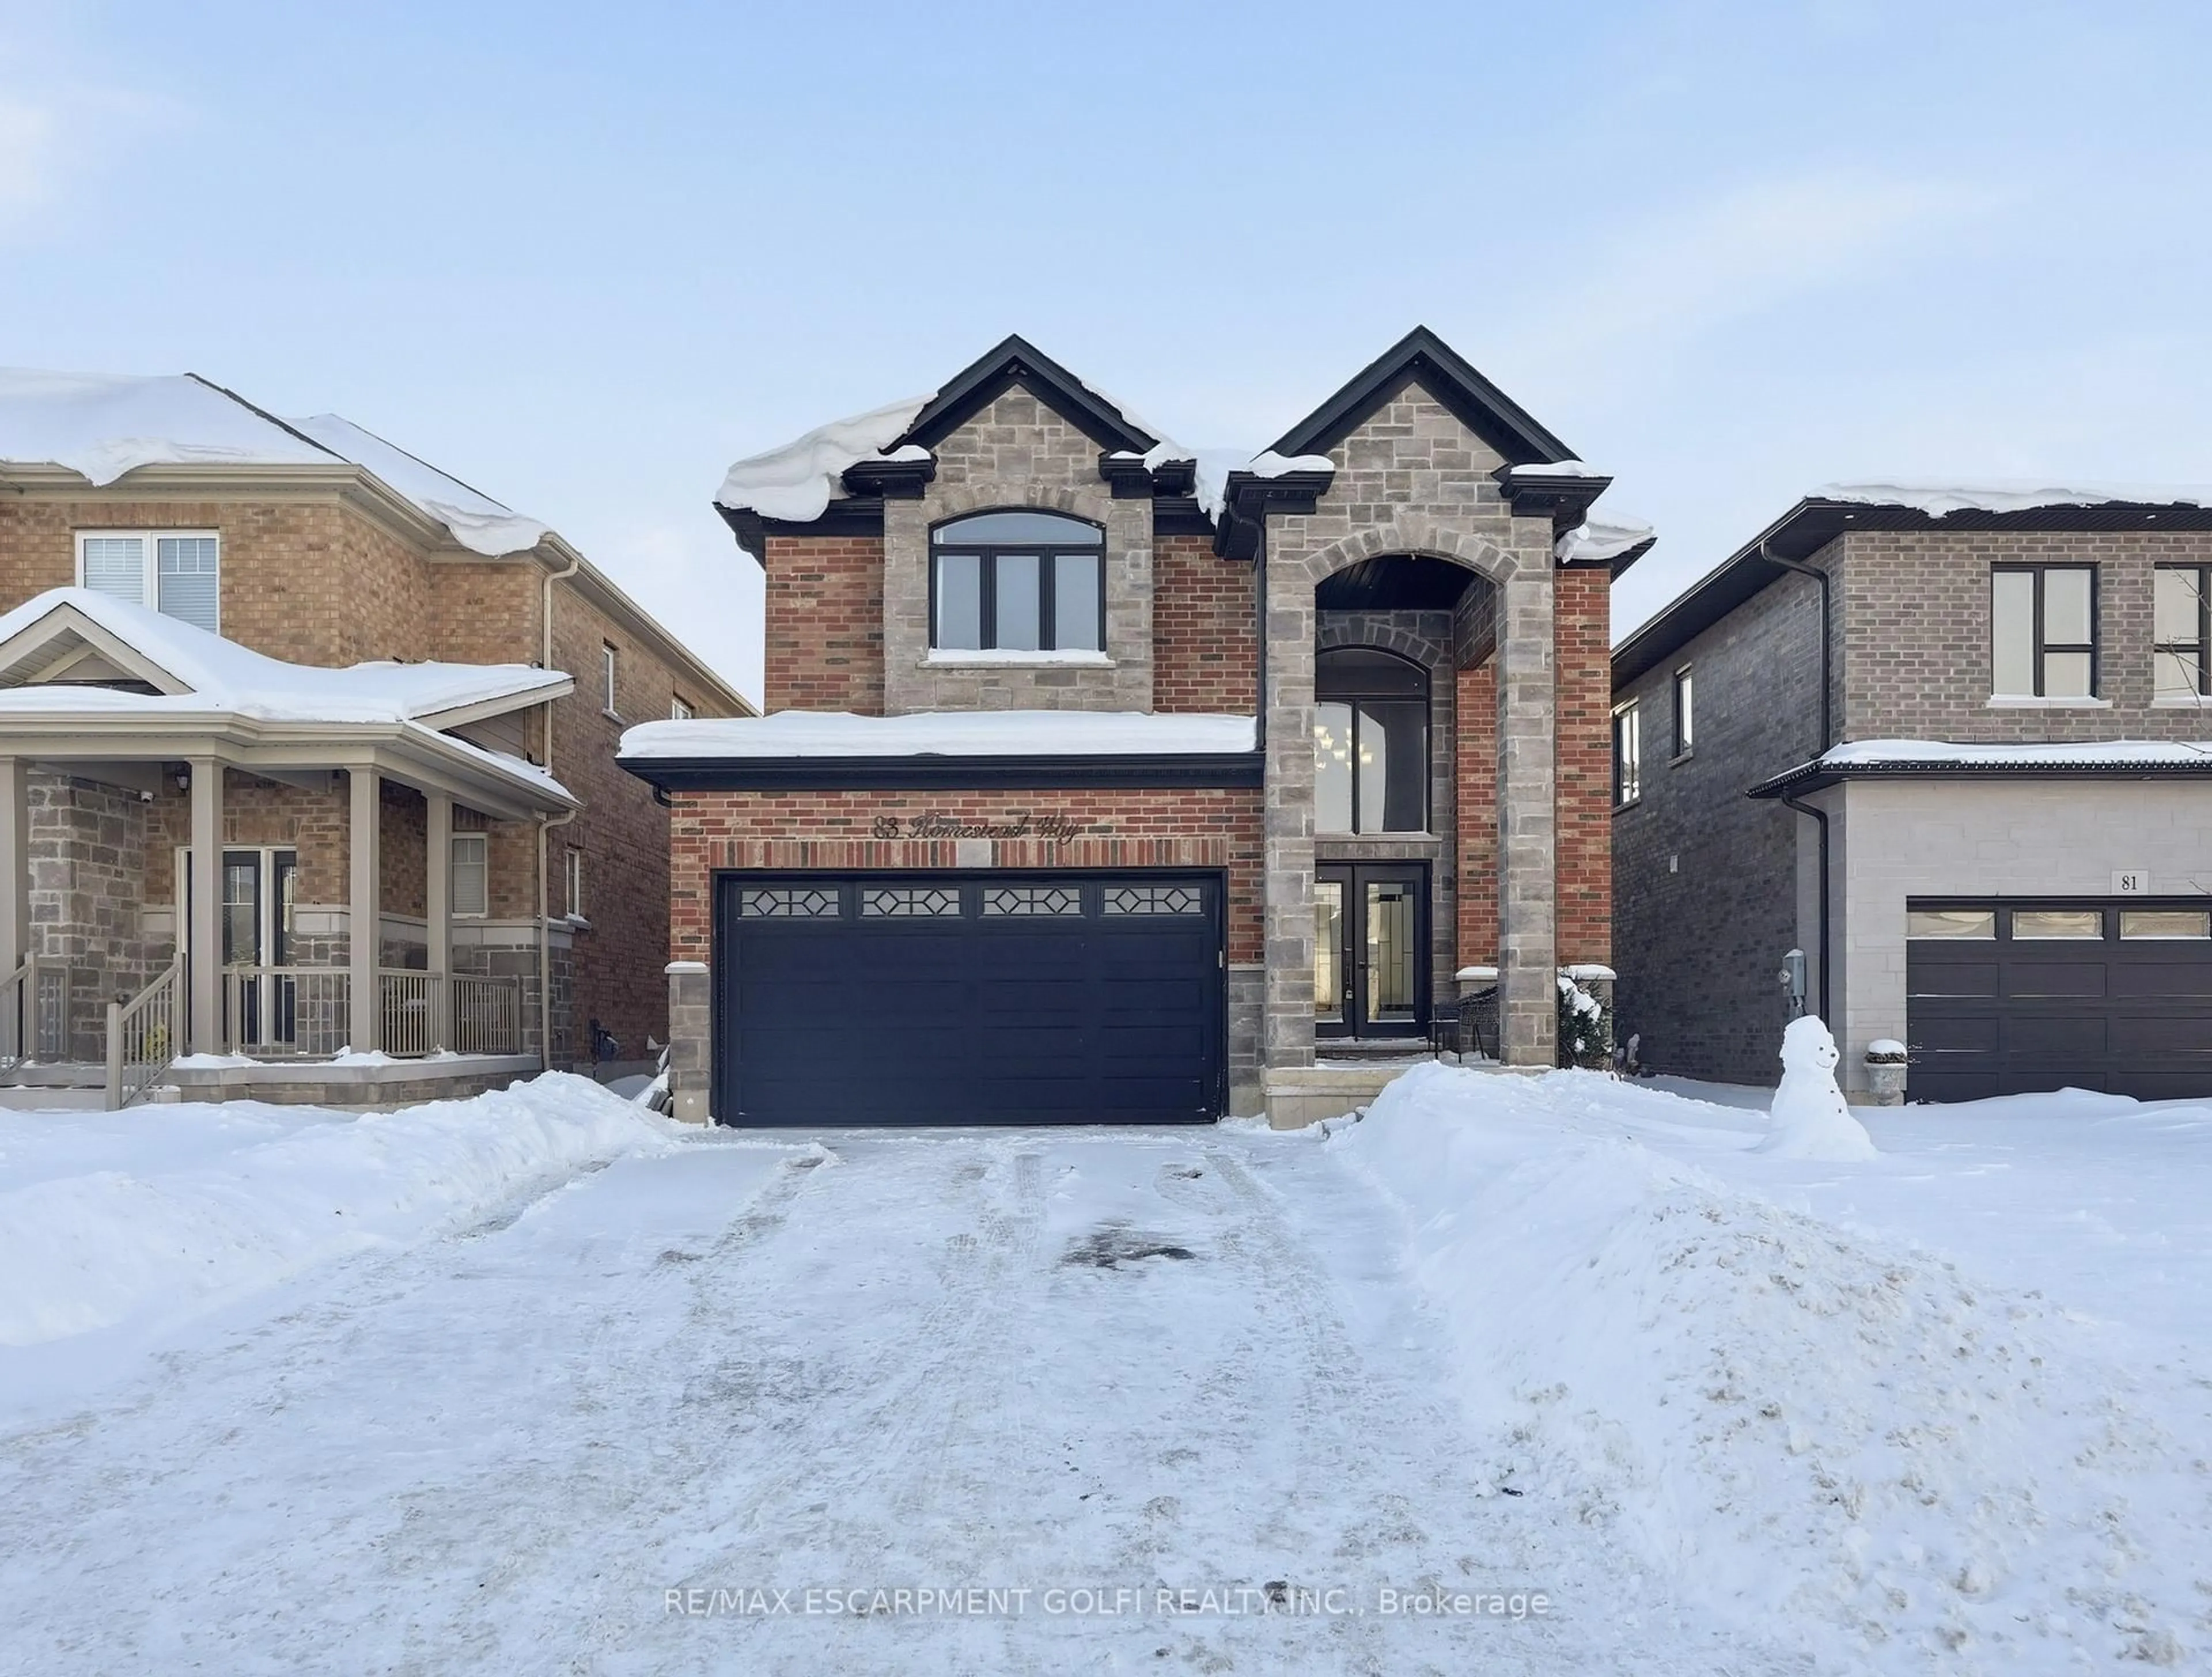
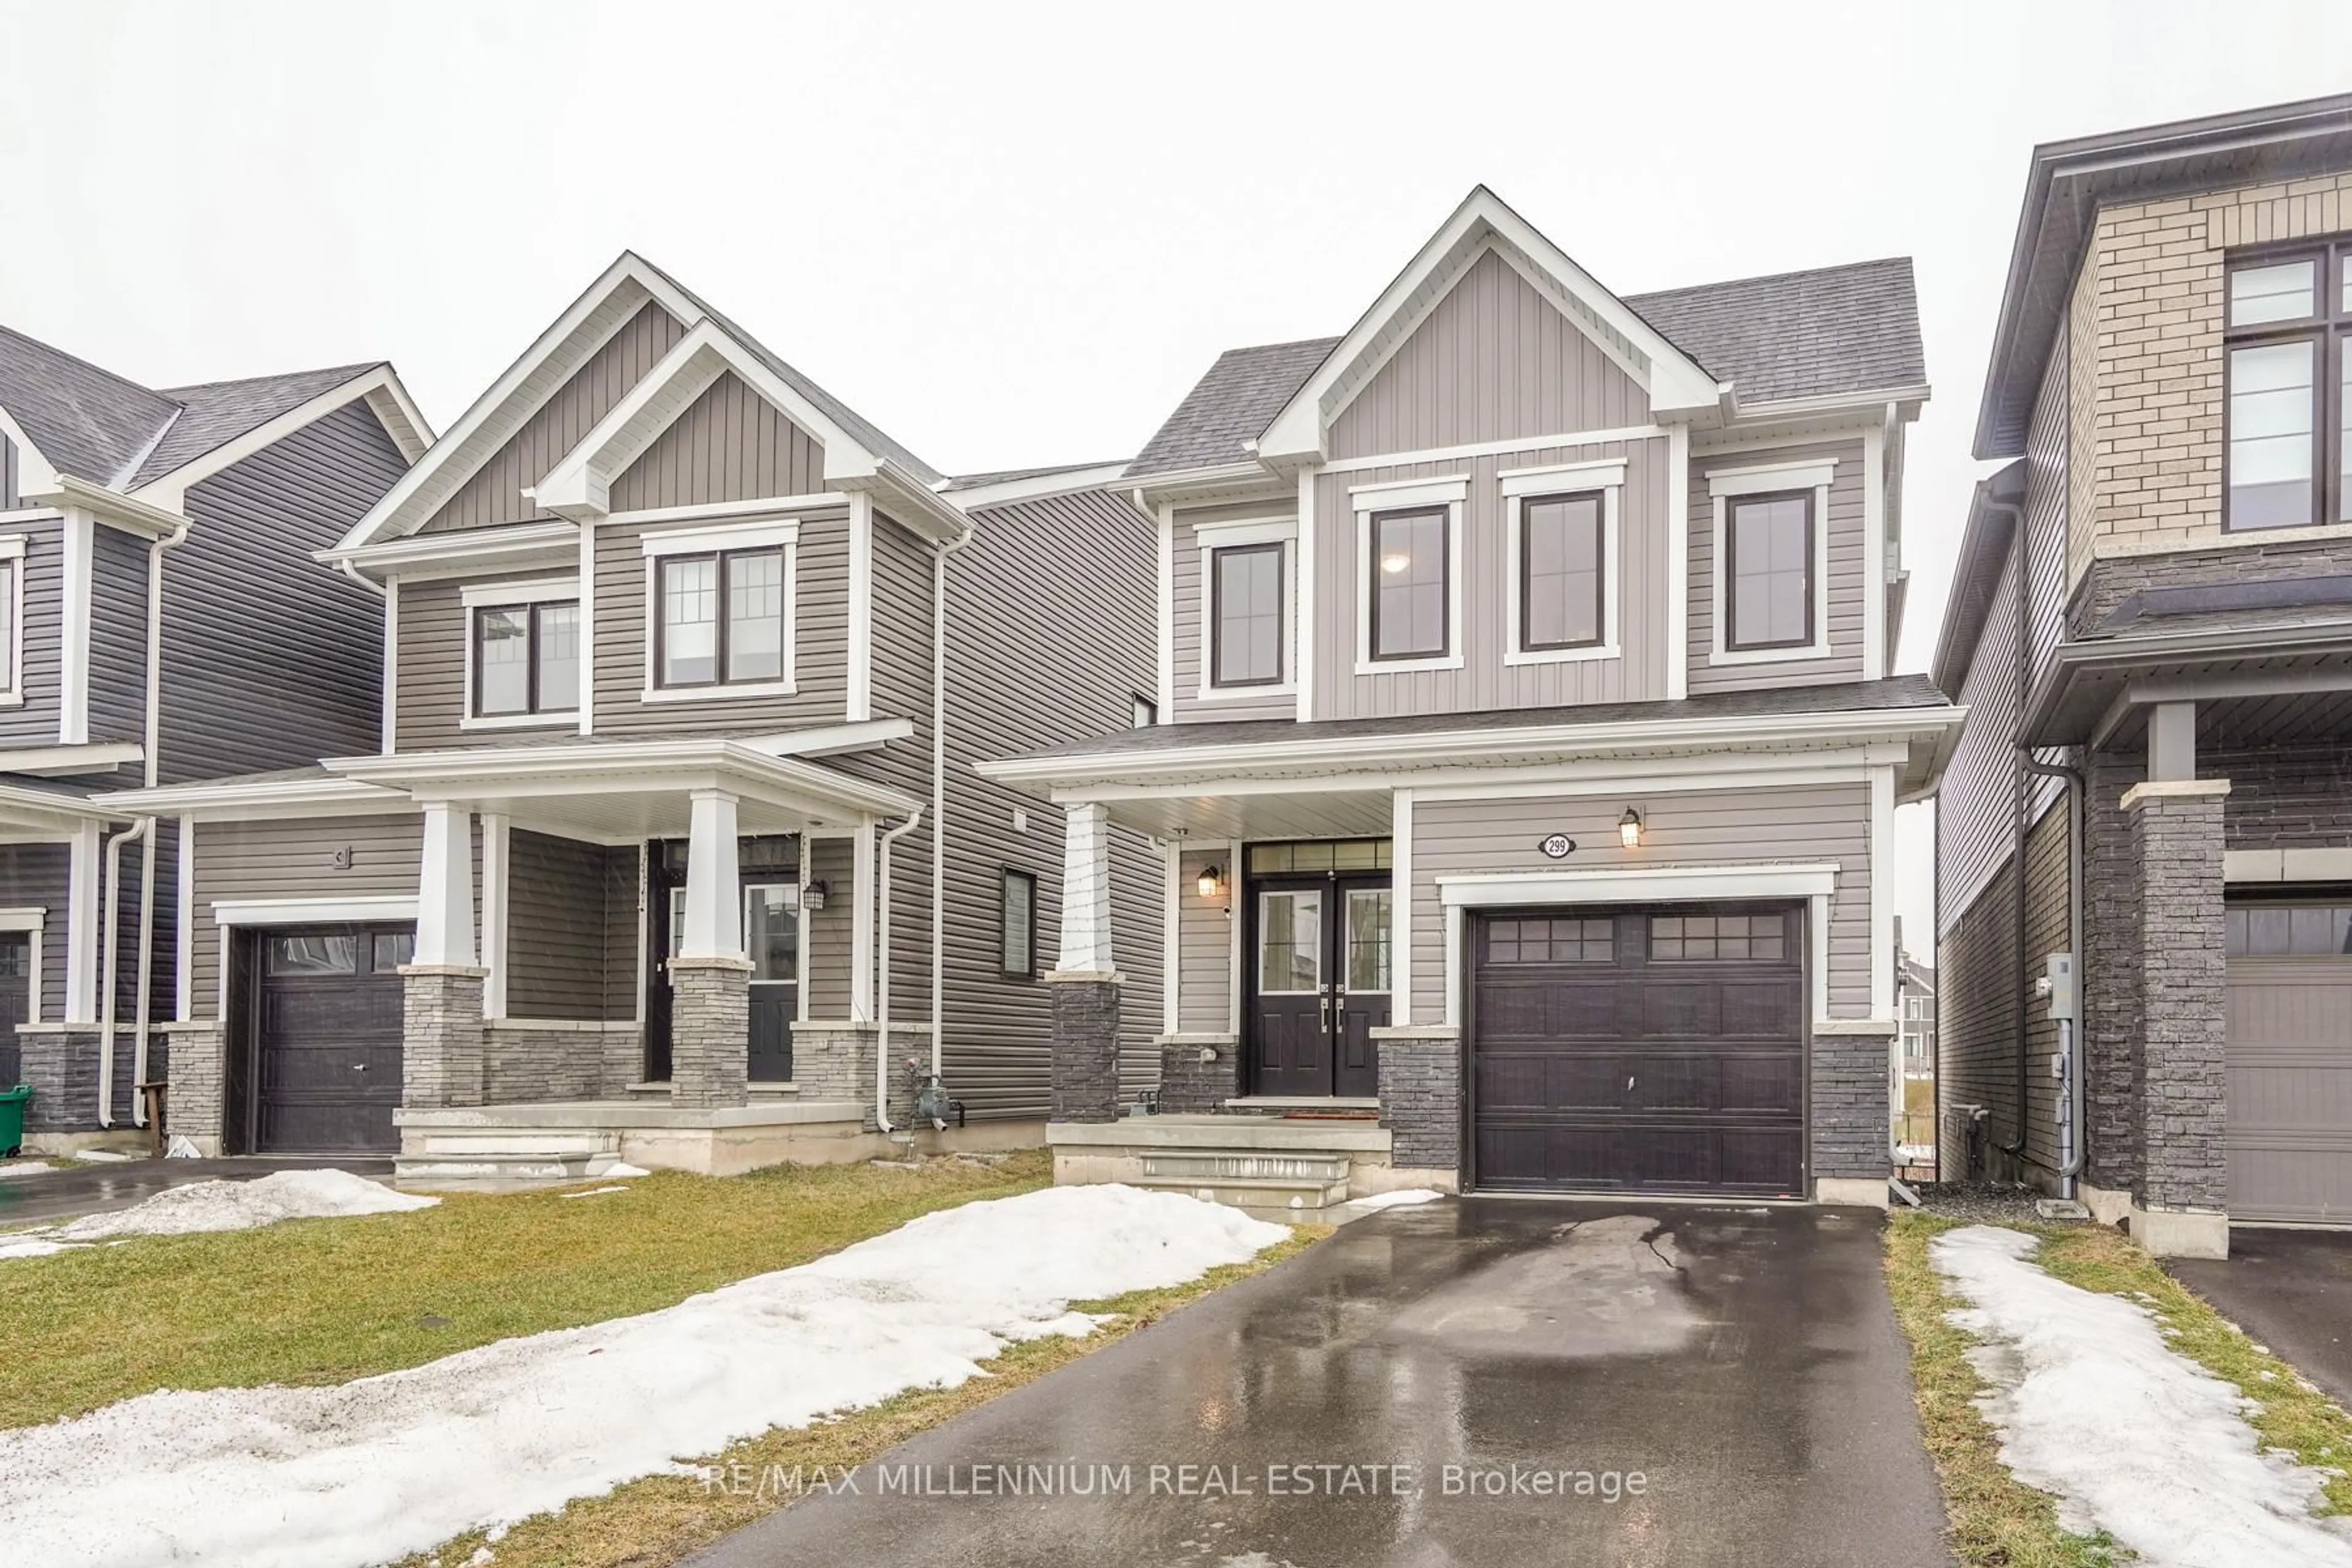
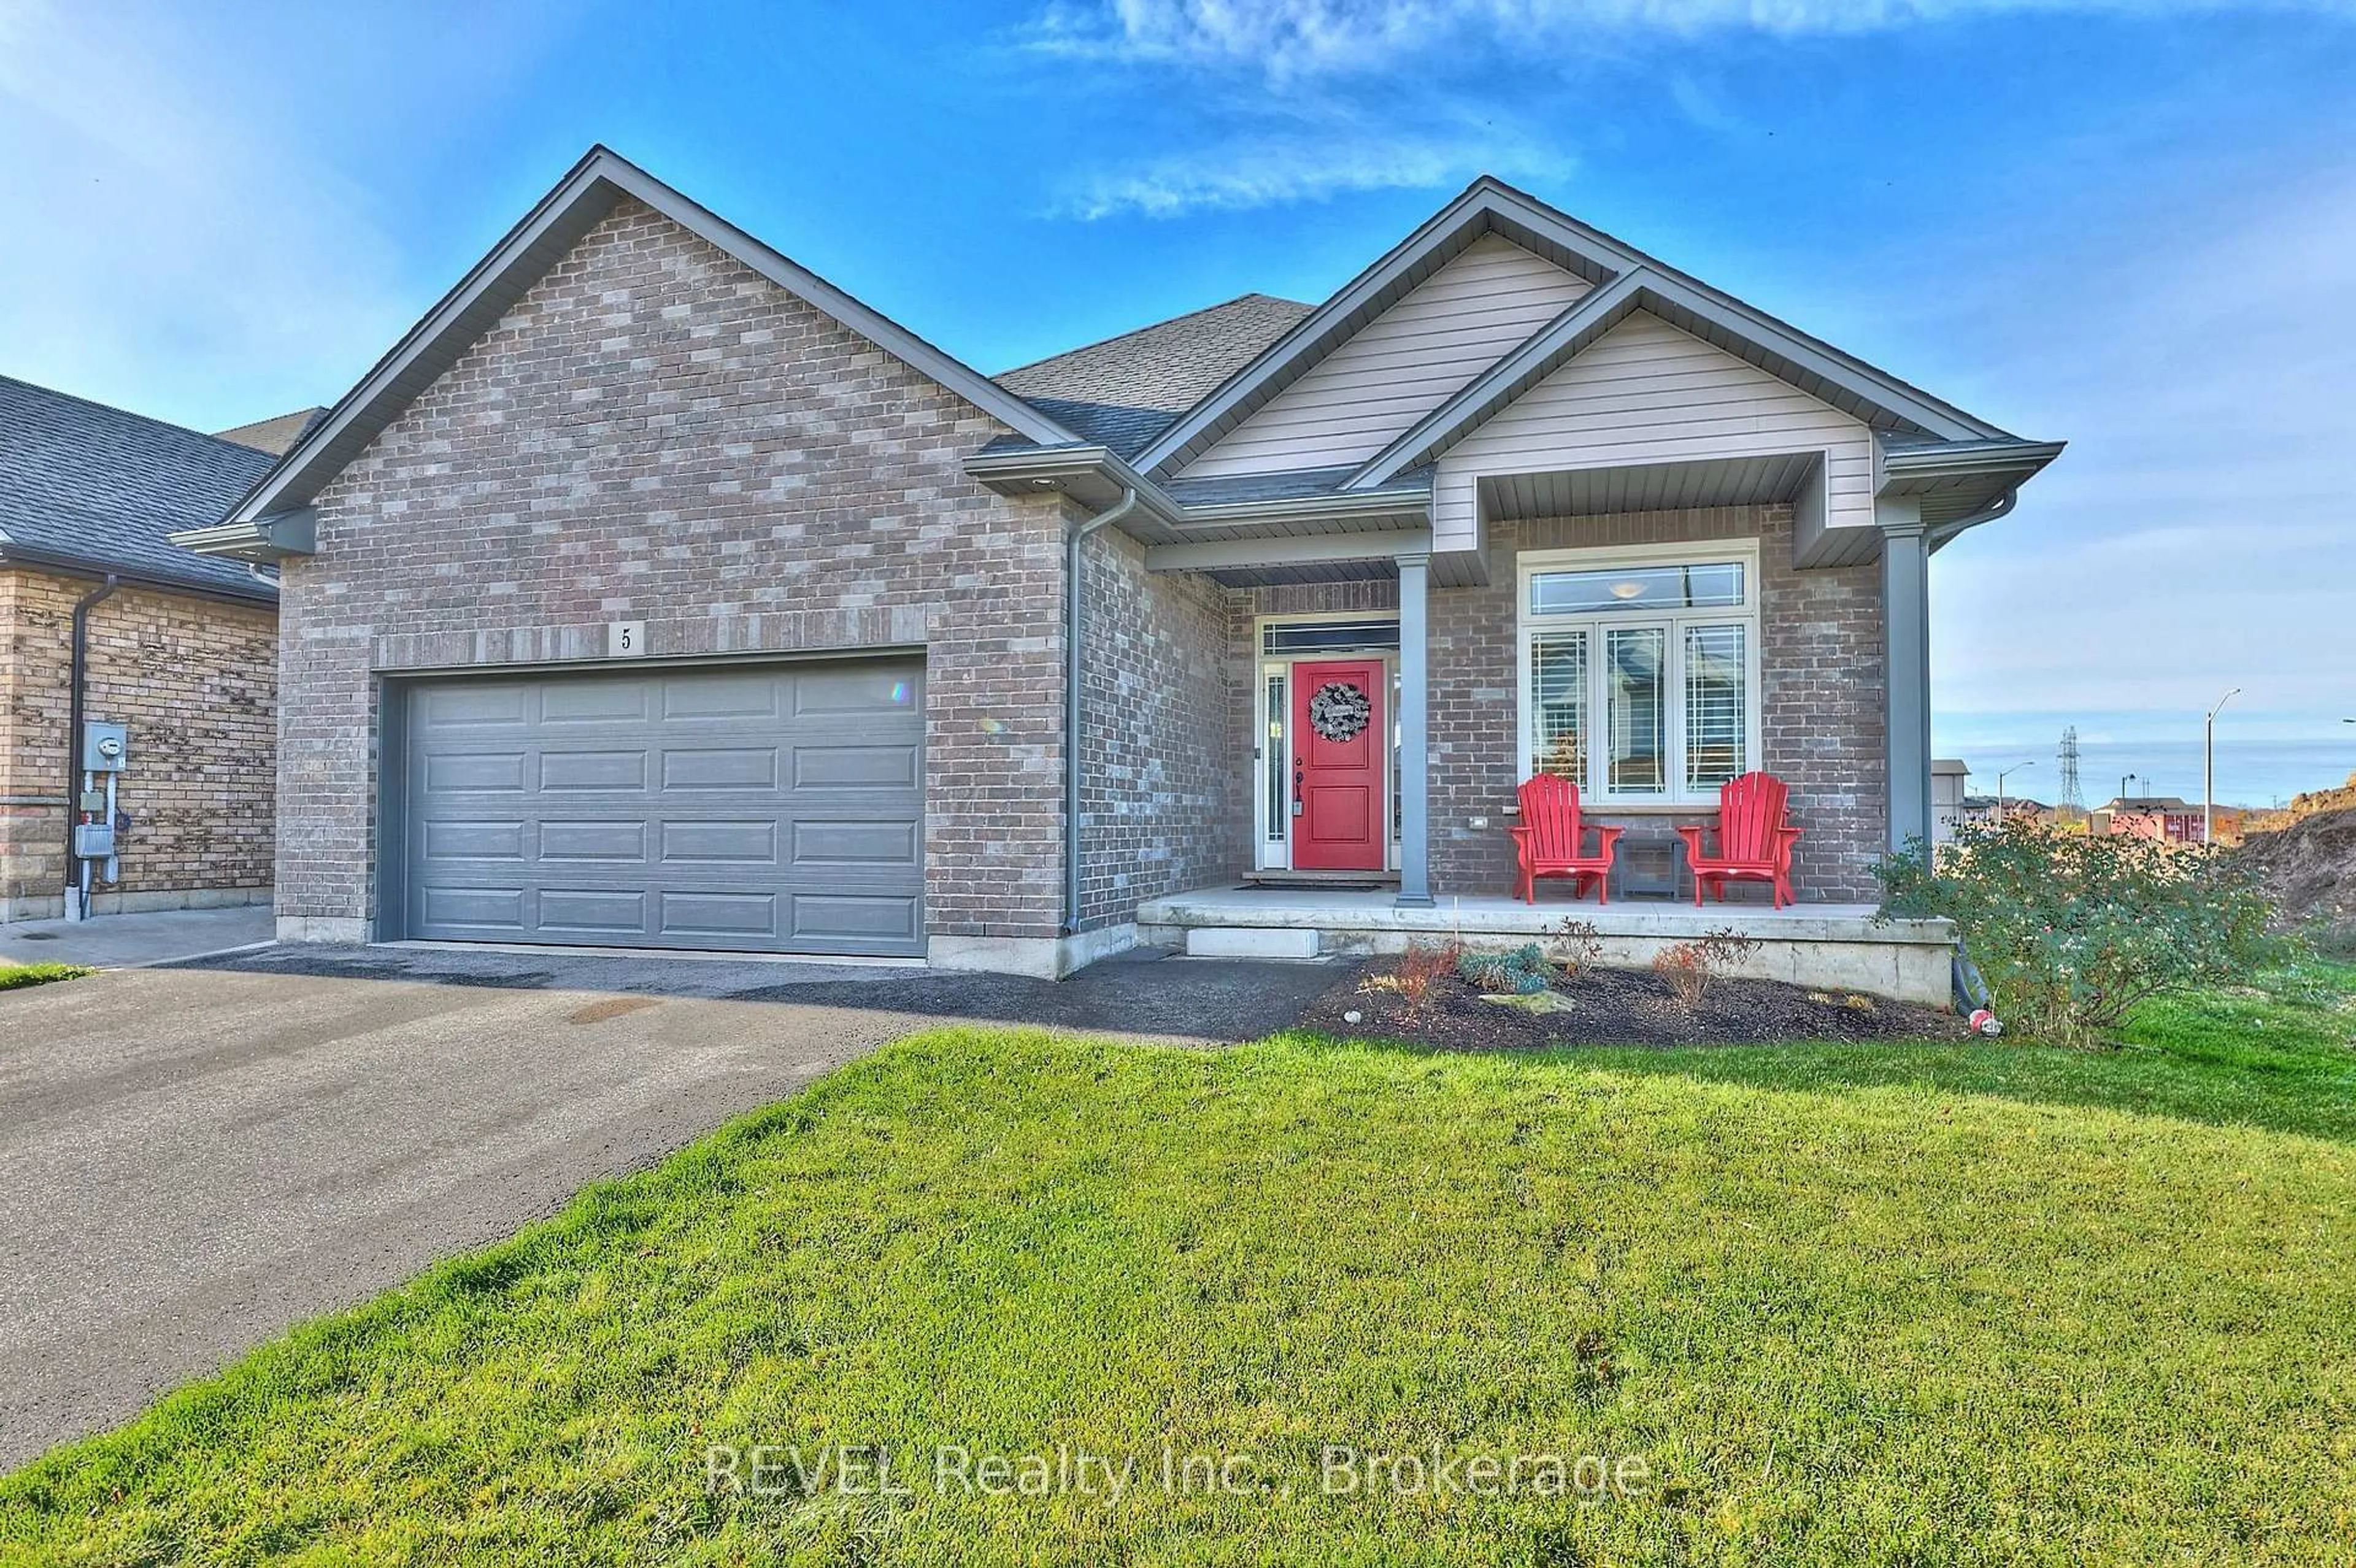
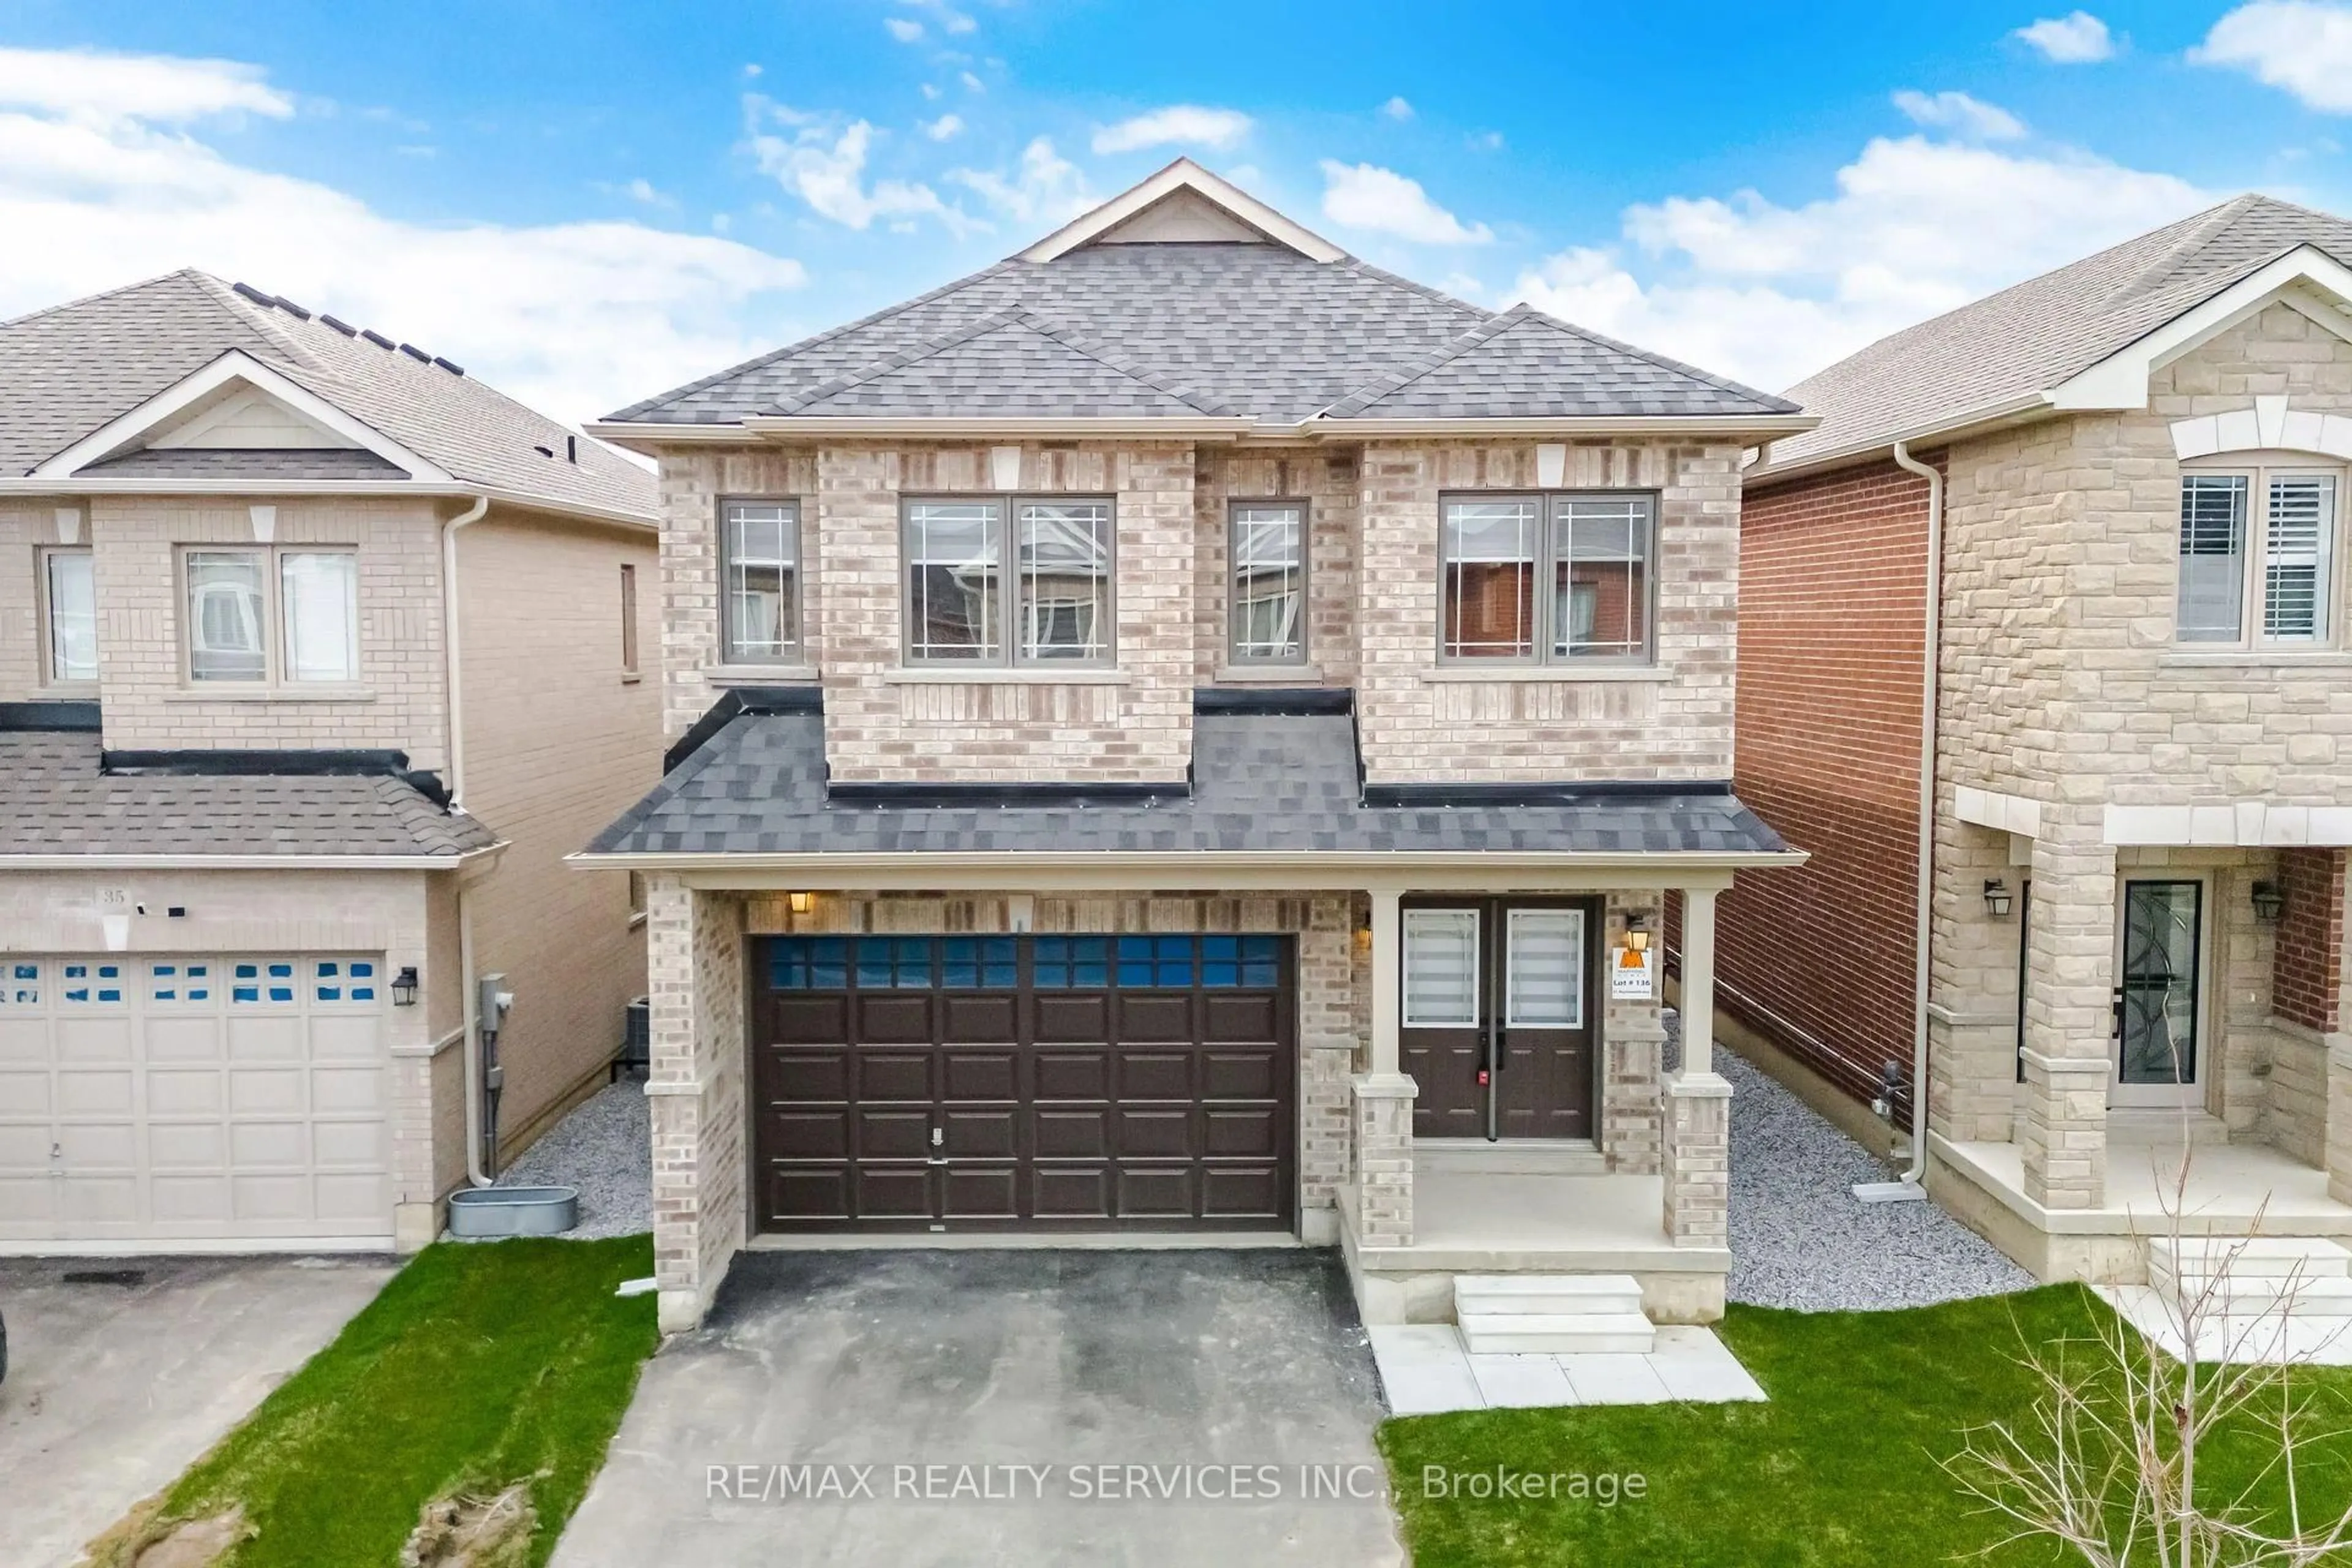
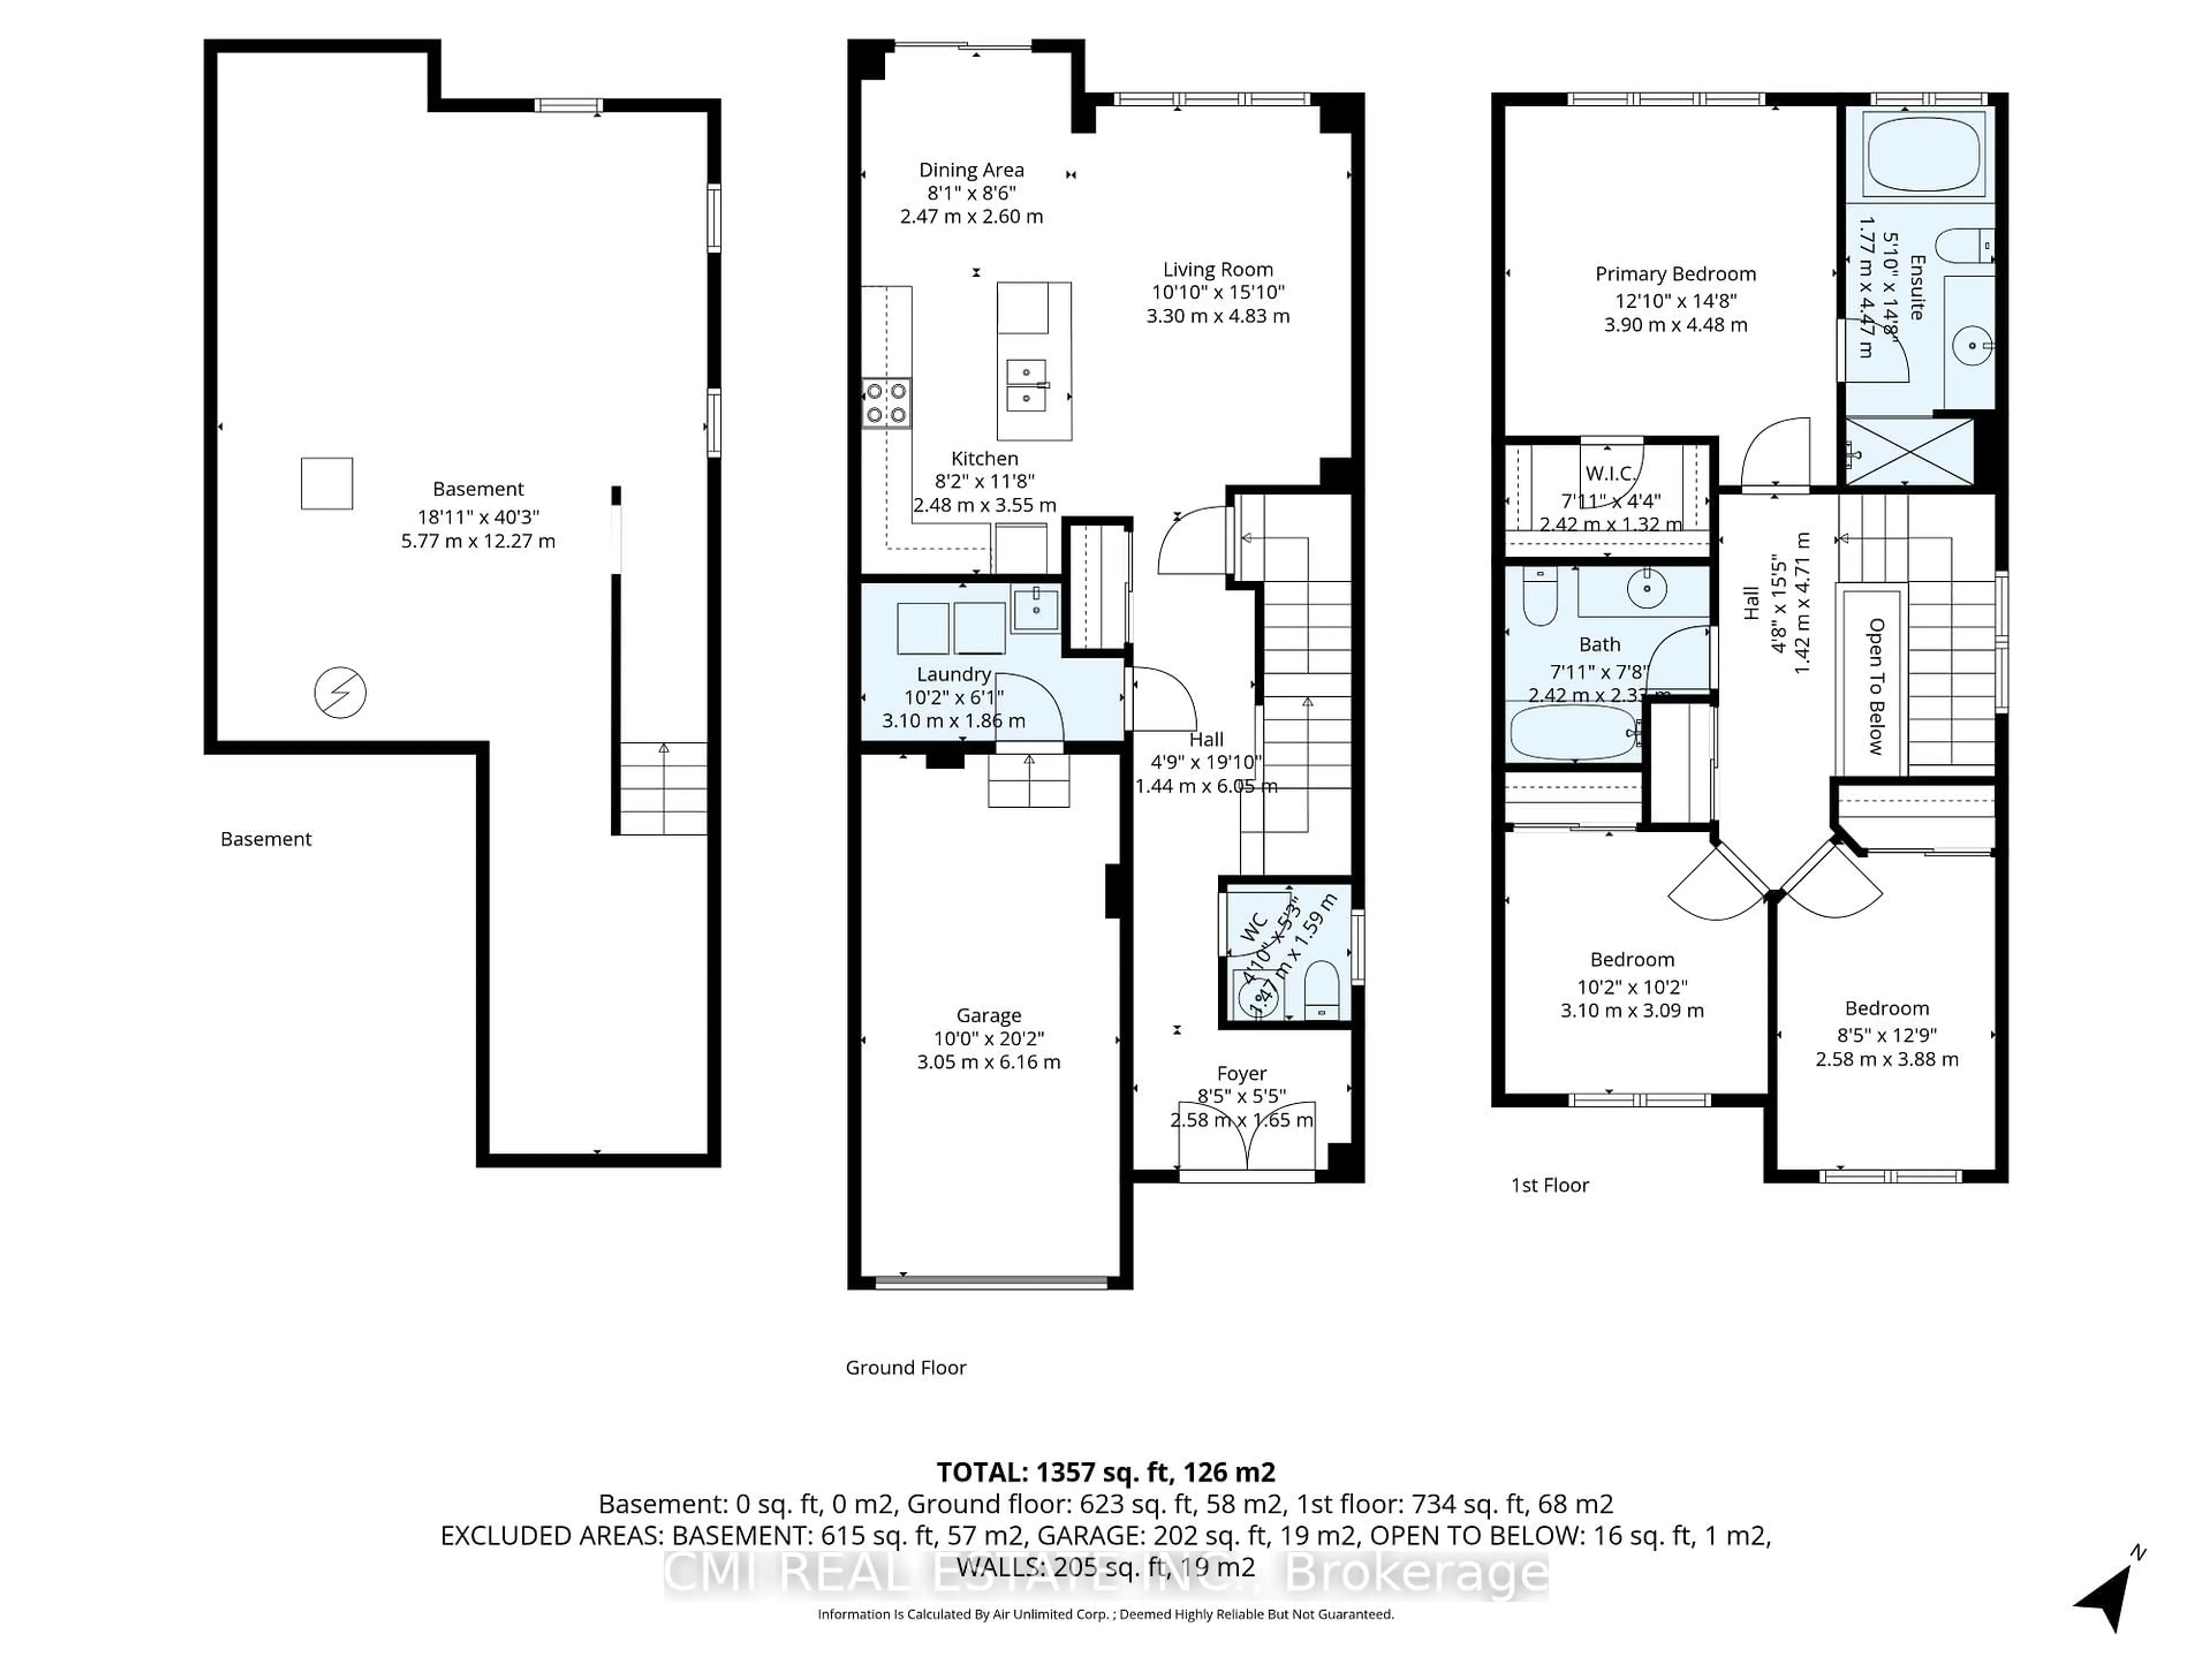
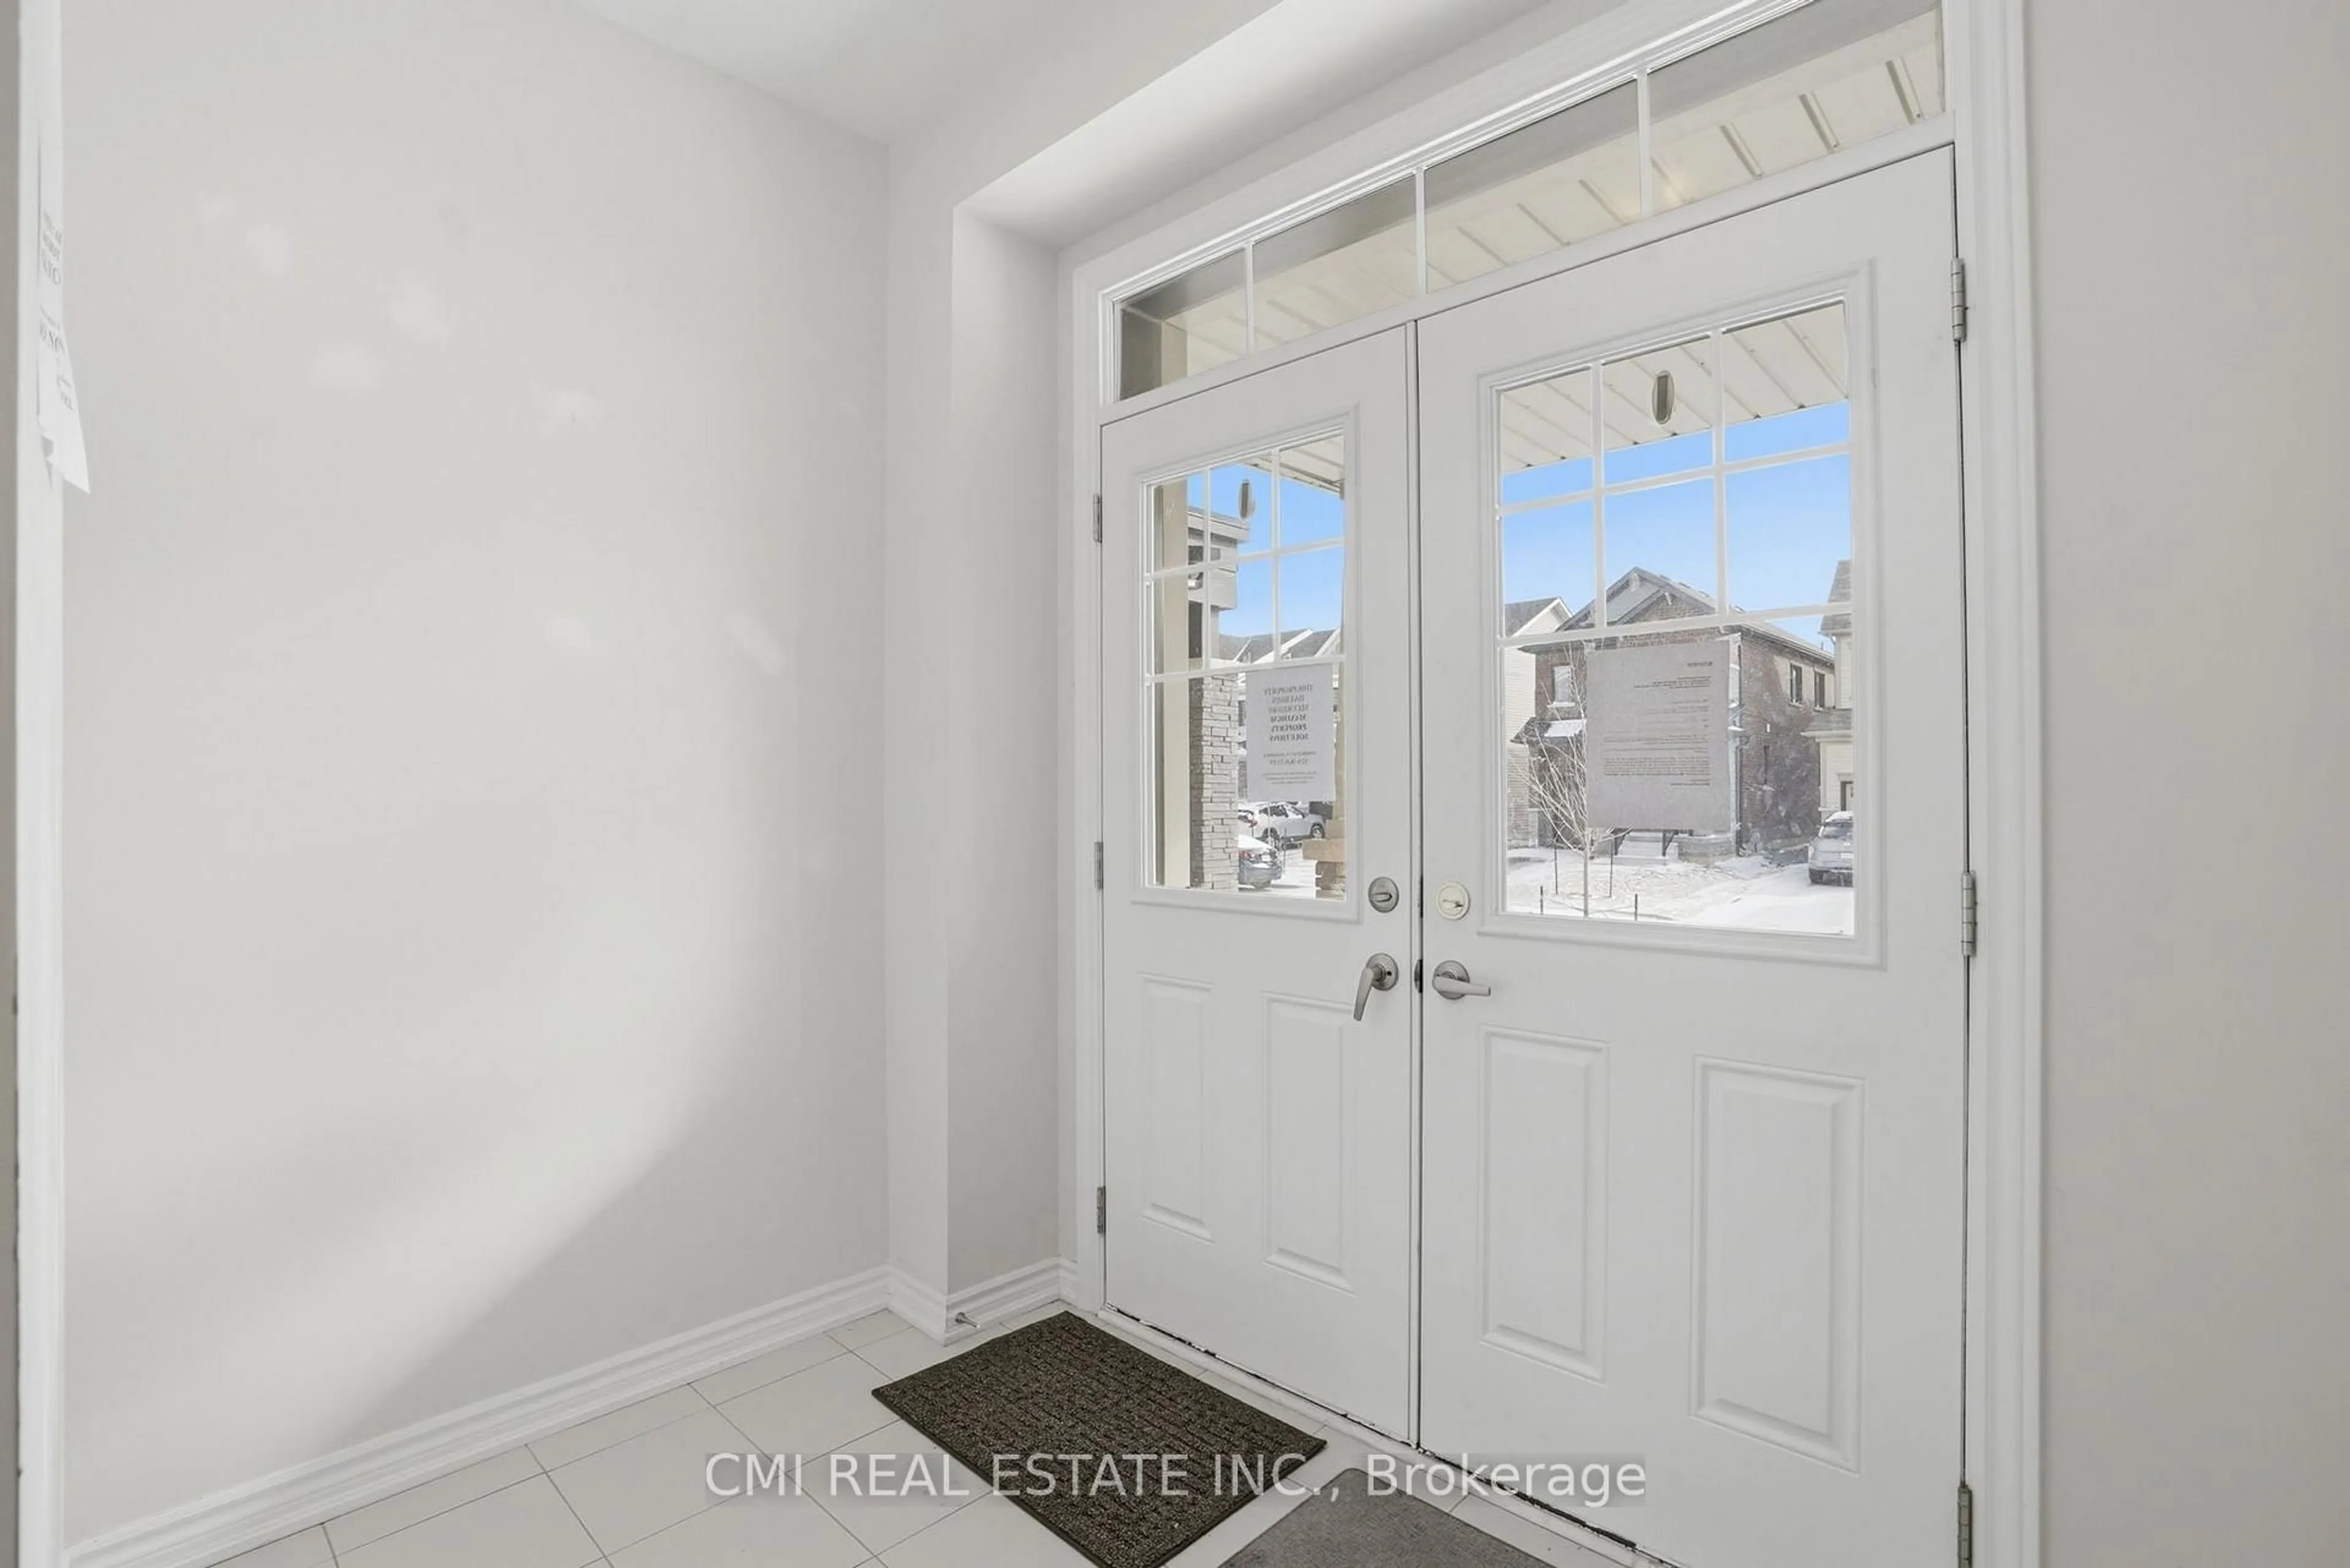
Discover Modern Living in Thorold's Premier Community Nestled in one of the city's most rapidly appreciating pockets, 49 Sugar May Avenue is a masterclass in contemporary design. This two-story residence boasts a thoughtful layout featuring three expansive bedrooms and 2.5 baths-highlighted by a serene primary retreat complete with a private ensuite and walk-in closet. The heart of the home is an airy, sun-drenched open-concept main floor designed for effortless hosting. Downstairs, a versatile lower level awaits your personal touch-be it a high-end home gym or a quiet executive office. With parks, schools, and transit just moments away, this move-in-ready property is where convenience meets suburban elegance.
Property Details
Interior
Features
Main Floor
Living
3.3 x 4.83Dining
2.47 x 2.6Kitchen
2.48 x 3.55Laundry
3.1 x 1.86Exterior
Features
Parking
Garage spaces 1
Garage type Attached
Other parking spaces 1
Total parking spaces 2
Property History
 42
42