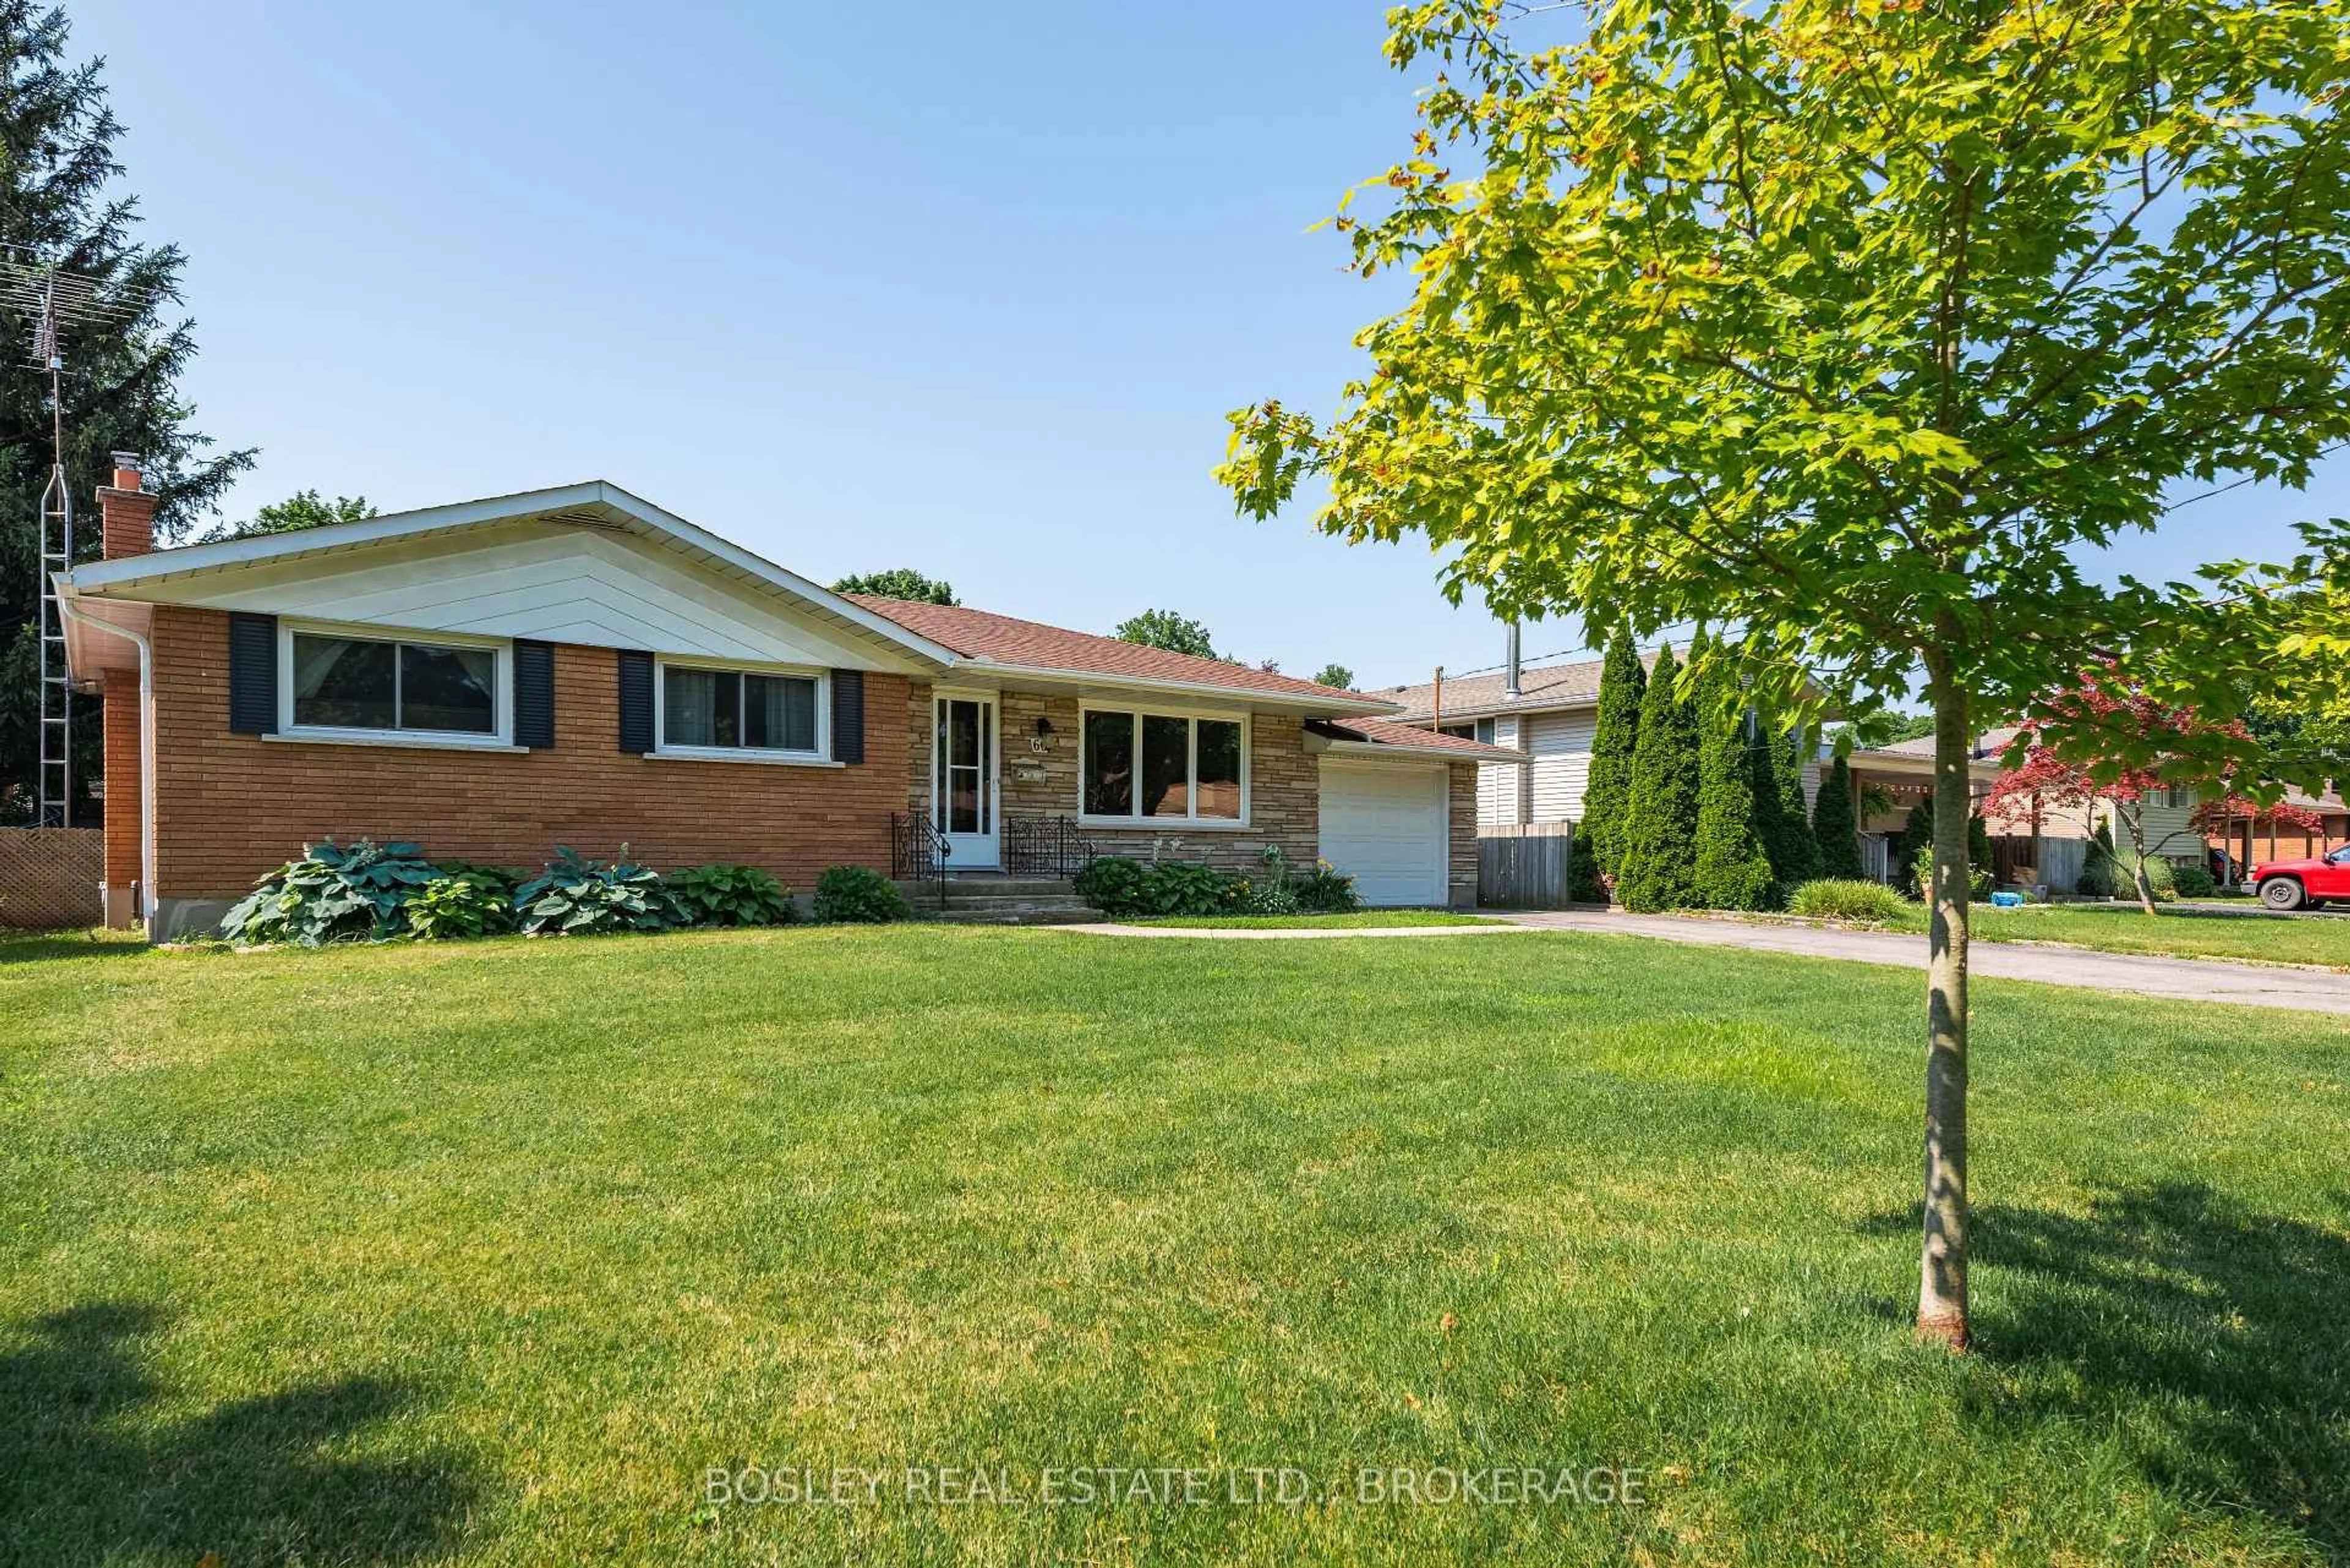
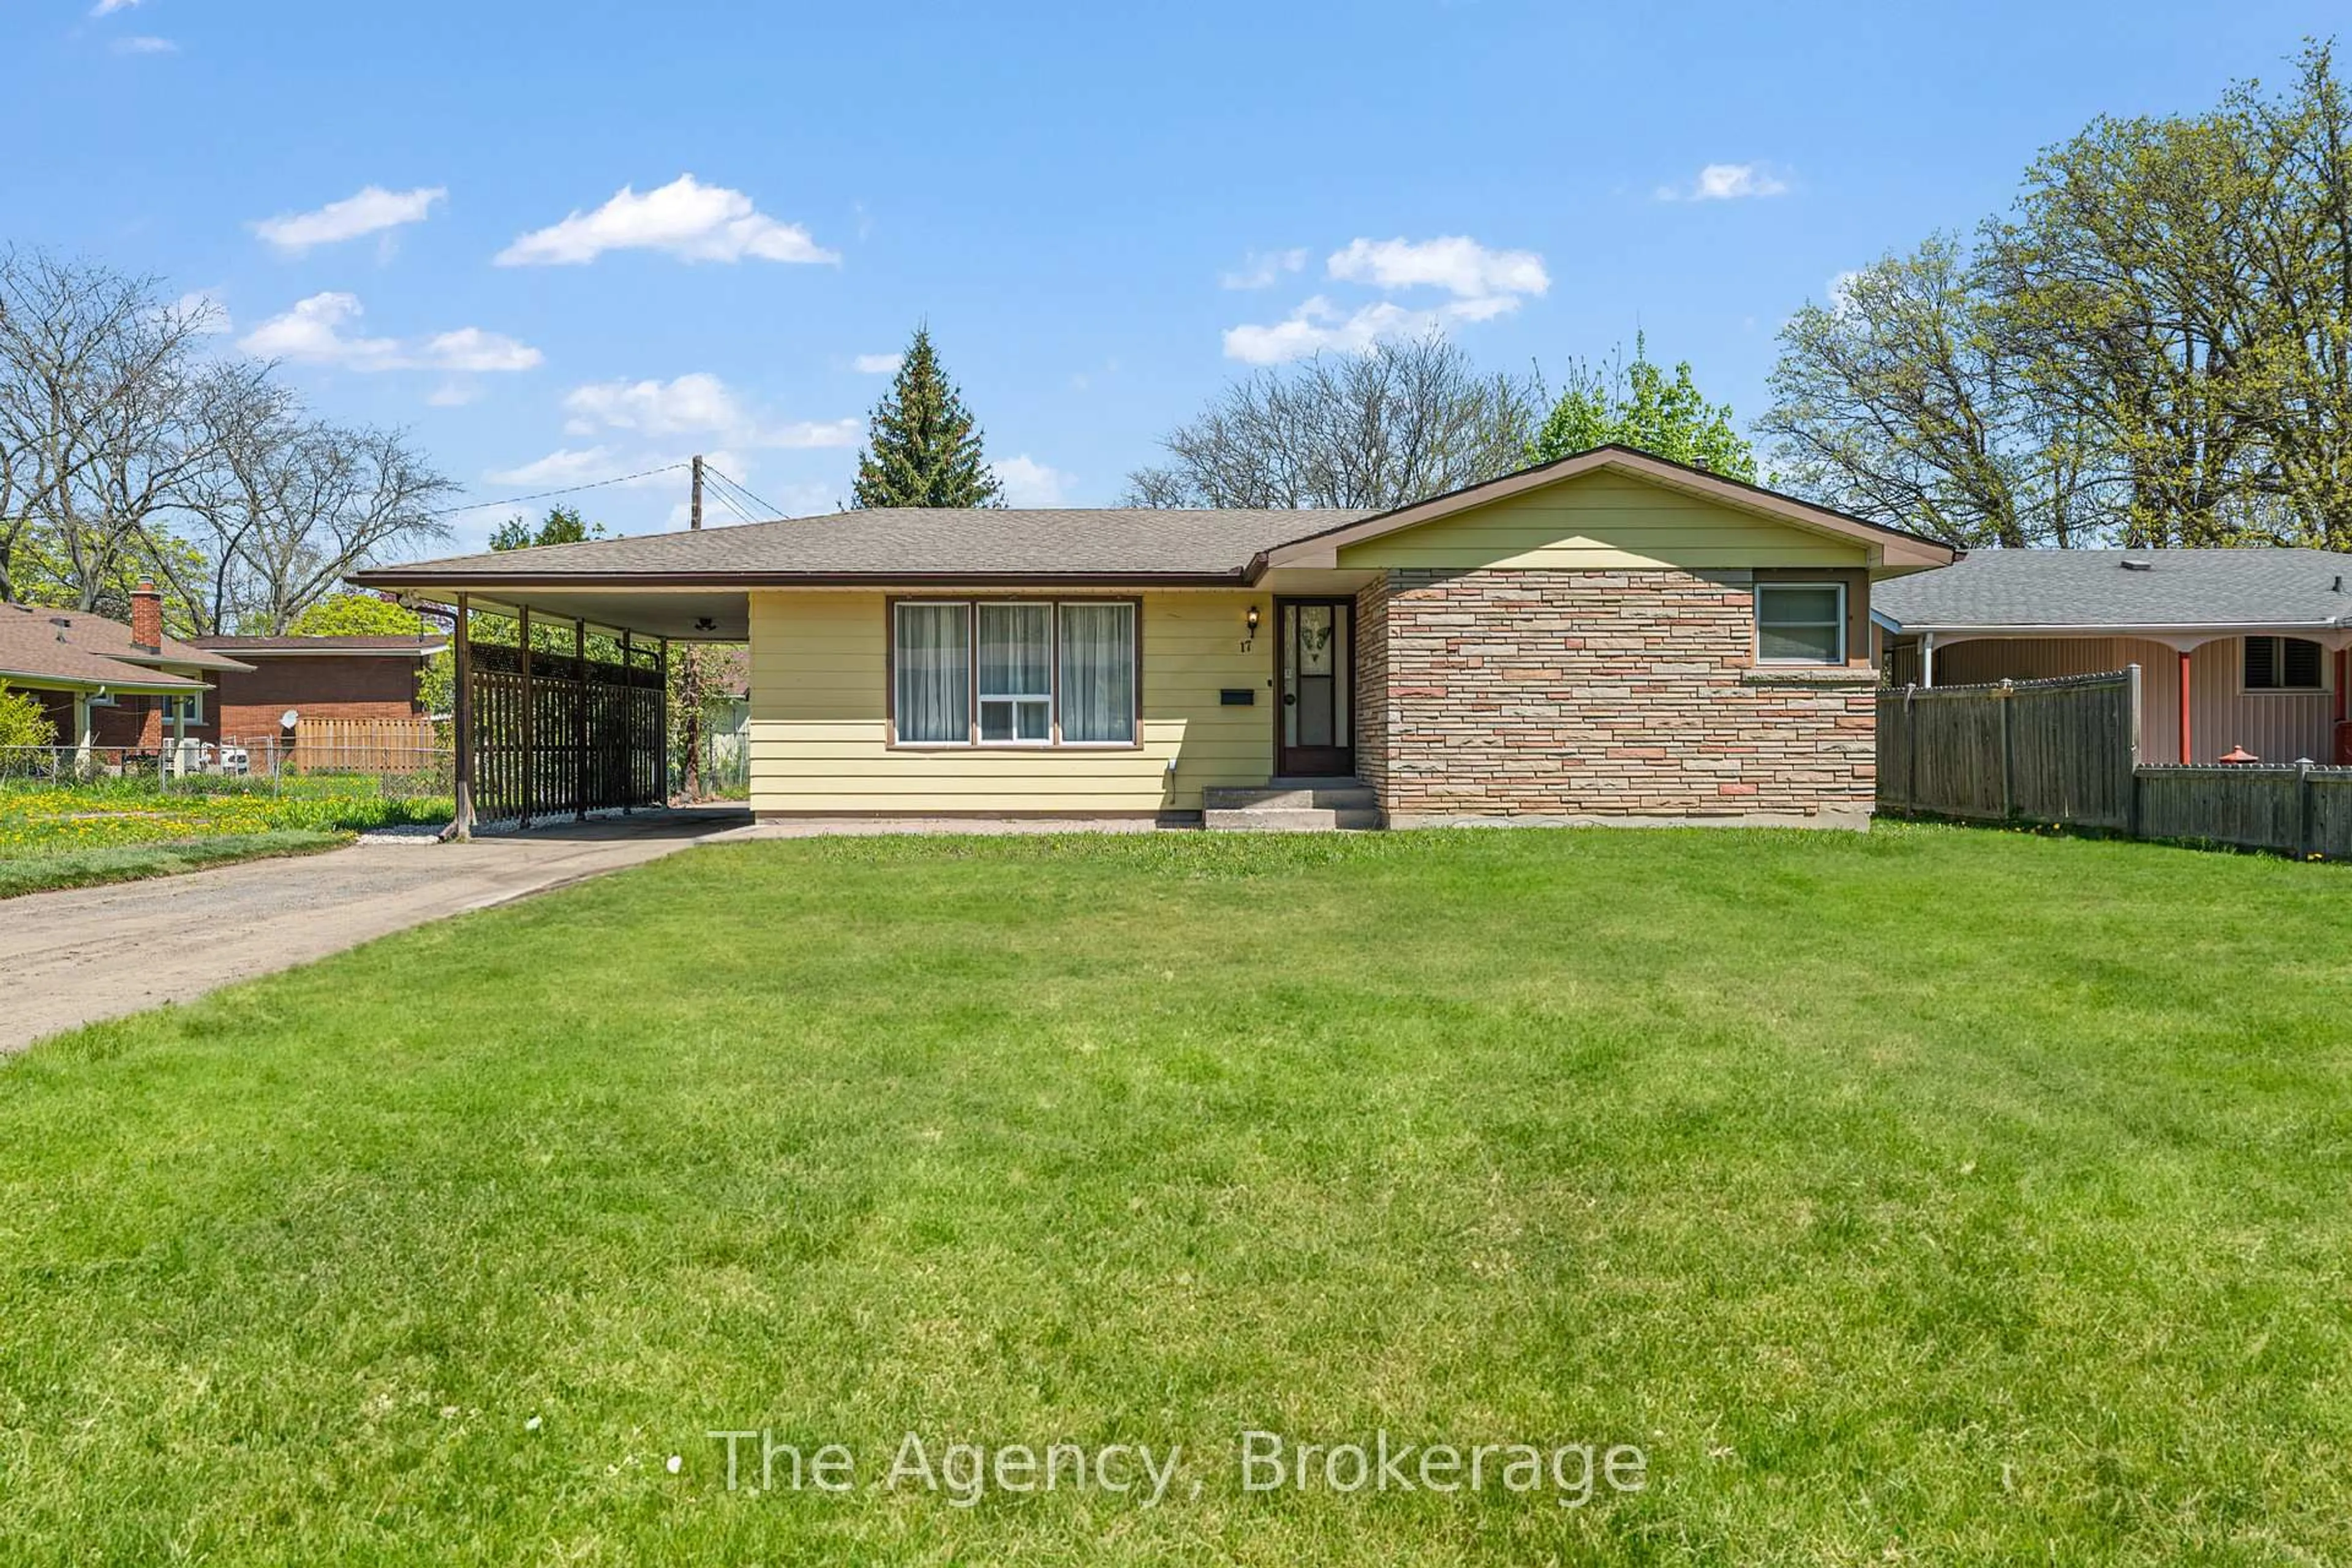
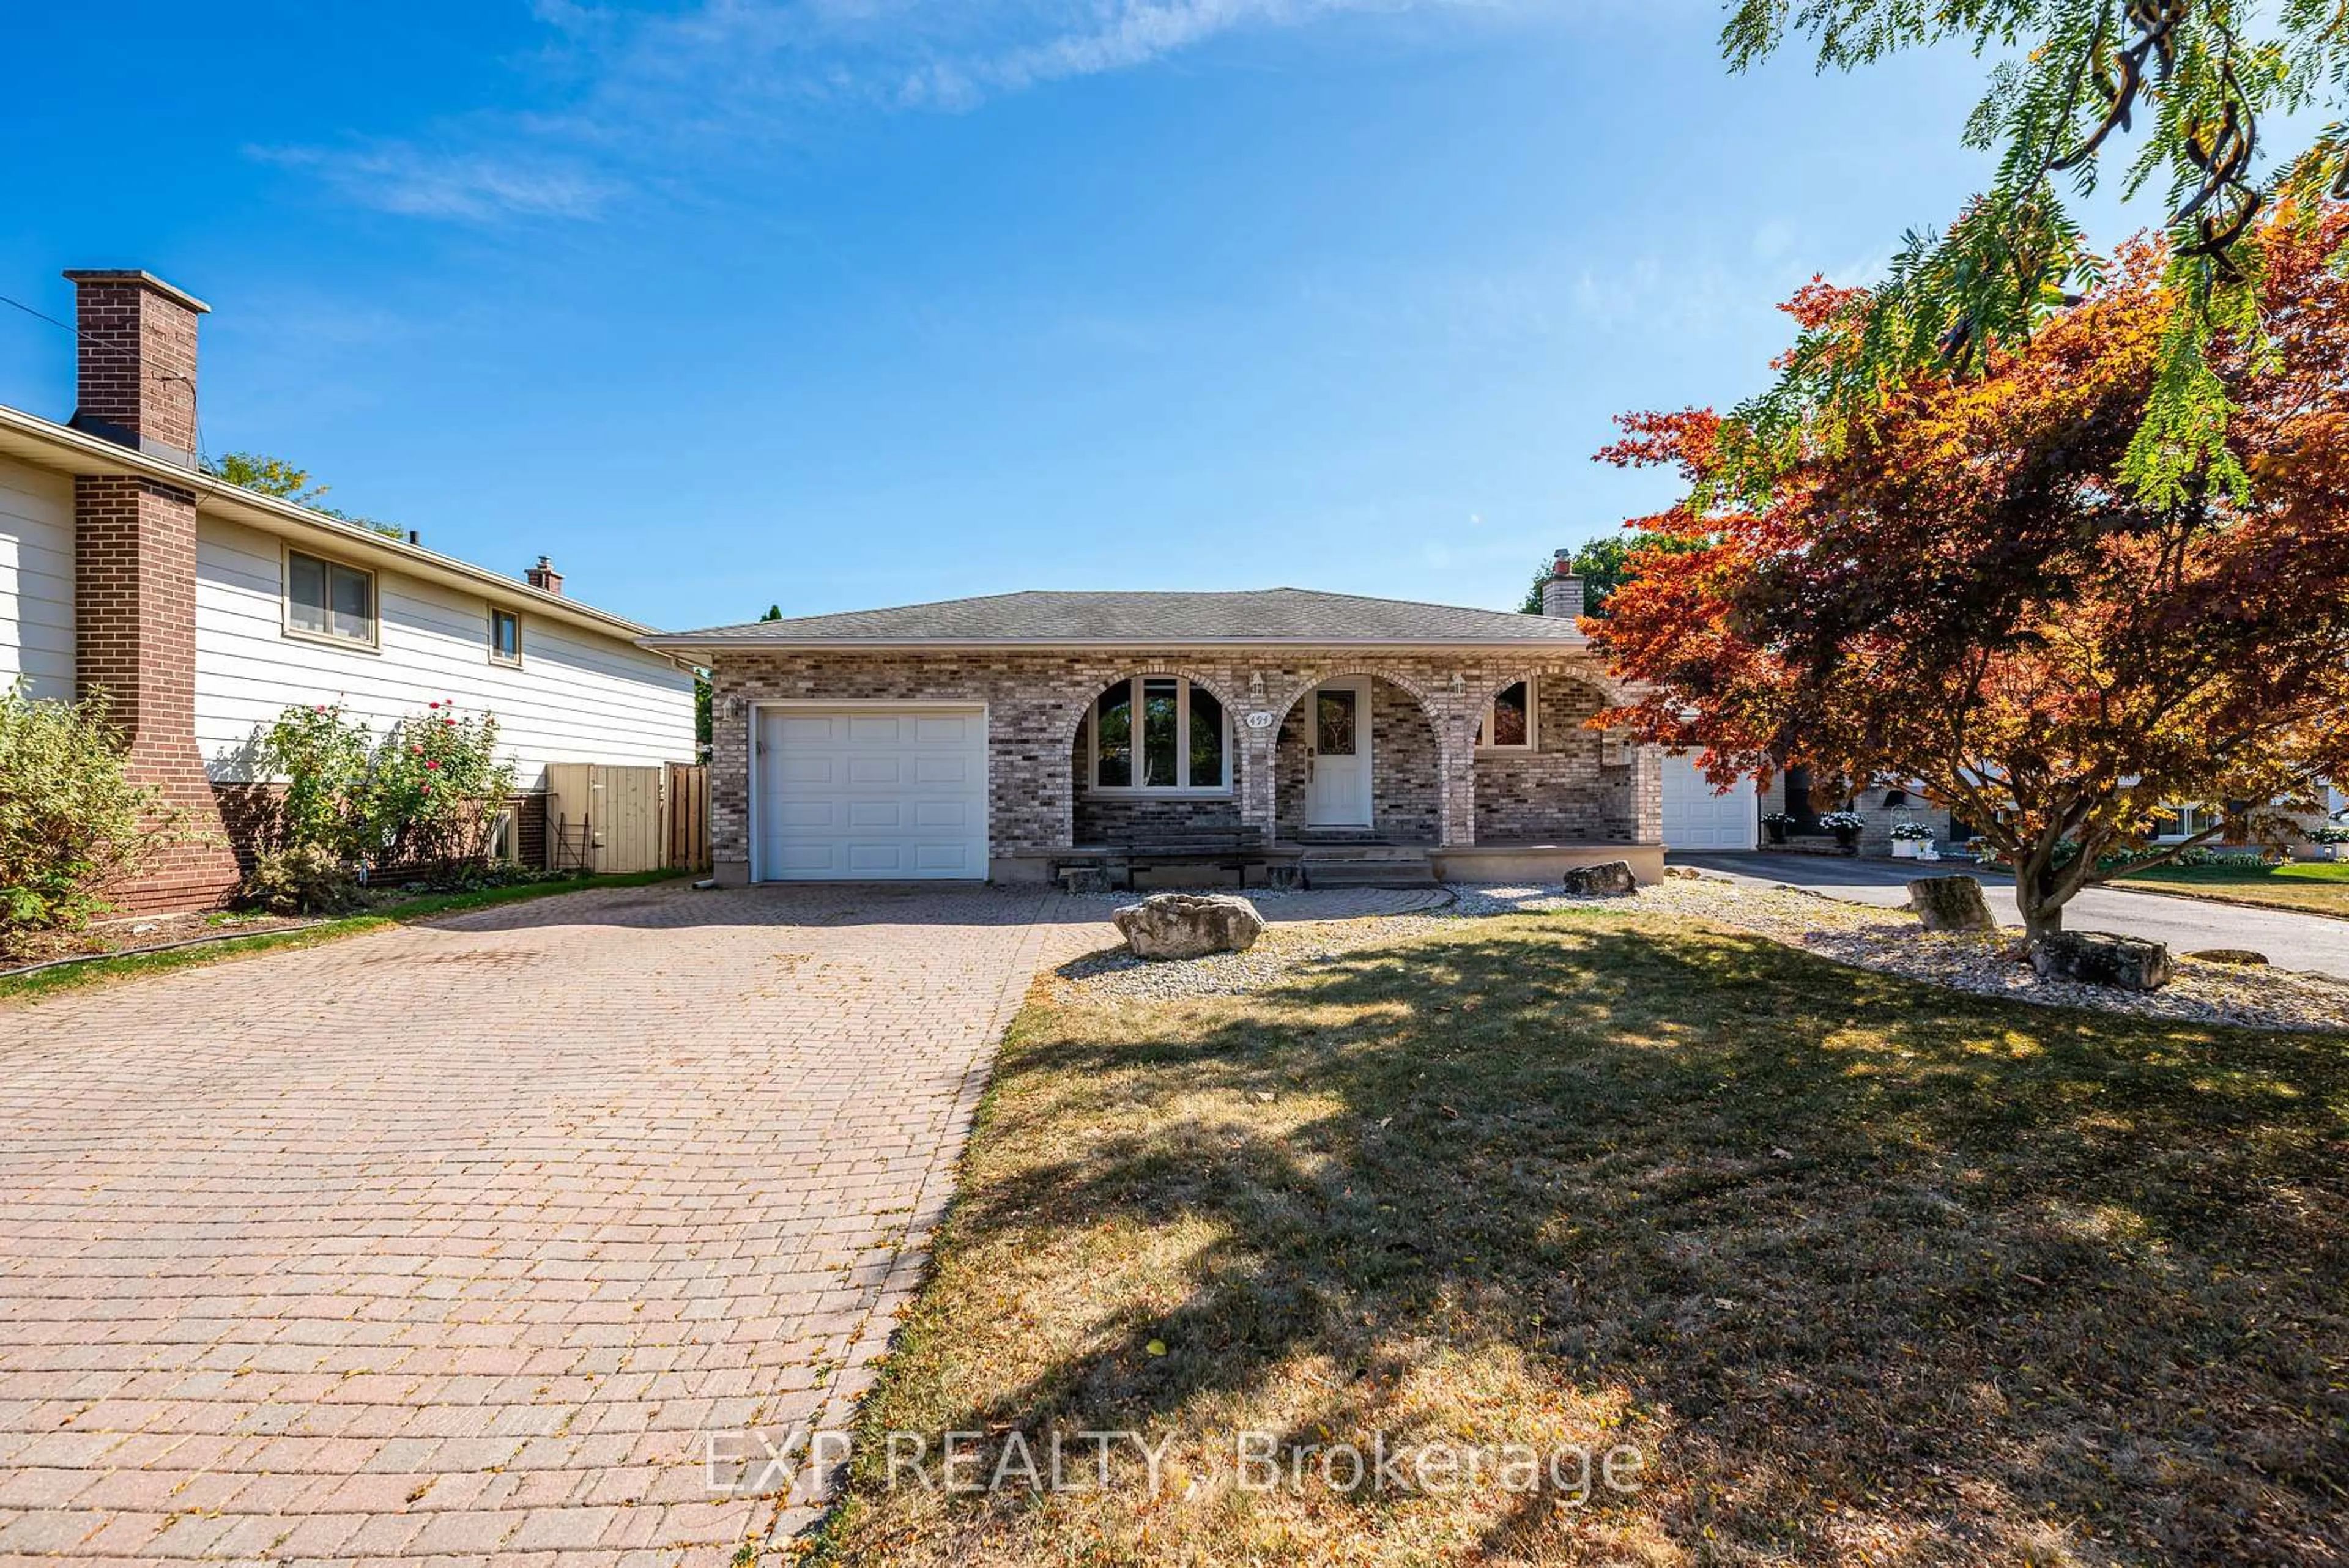
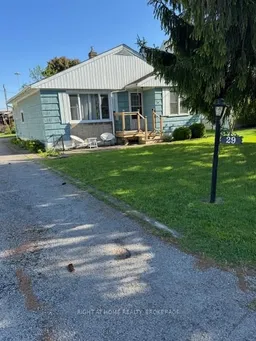
A pic from outside/outdoor area/front of a property/back of a property/a pic from drone, street for 29 Henley Dr, St. Catharines Ontario L2N 4B1
6 days on Market

29 Henley Dr, St. Catharines, Ontario L2N 4B1

Detached
2
2
~700-1100 sqft
$499,000
Get pre-qualifiedPowered by nesto
Detached
2
2
~700-1100 sqft

Contact us about this property

Call

Highlights

Estimated ValueNot available

Price/Sqft$583/sqft

Est. Mortgage$2,143/mo

Tax Amount (2024)$4,020/yr

Days On Market6 days


Description

Solid 2 bedroom bungalow close to major shopping and QEW. Minutes to Port Dalhousie, the beach, marina. Large lot. Plaster walls , Hardwood floors and wood trim throughout murphys bed in basement.Vinyl windows. Large mud room with patio doors to backyard. Painted Cedar siding. Lots of possibilities.


Property Details

StyleBungalow
View-
Age of property51-99
SqFt~700-1100 SqFt
Lot Size7,050 SqFt(141 x 50)
Parking Spaces4
MLS ®NumberX12169502
Community NameSt. Catharines
Data SourceTRREB
Listing byRIGHT AT HOME REALTY, BROKERAGE

Features

Heating: Forced Air
Cooling: Central Air
Fireplace
Basement: Part Fin

Main Floor

Kitchen

3.333 x 3.0

Living

4.484 x 3.515

Br

3.03 x 3.666

2nd Br

3.333 x 3.03


Features

Lot size: 7,050 SqFt

Parking

Garage spaces 2

Garage type Attached

Other parking spaces 2

Total parking spaces 4


Property History
May 23, 2025
ListedActive
$499,000
6 days on market
history photo preview21
Listing by trreb®
Property listed by RIGHT AT HOME REALTY, BROKERAGE, Brokerage
Agent Banner Image
Interested in this property?Get in touch to get the inside scoop.

Market Data - St. Catharines

Geo Zone Map ThumbnailSt. Catharines

Balanced Market

View Market Data

Detached house - for the past 30 days

Buyer's market Seller's market

Avg. Days on Market

Past 30 days

32 days

Compared to

2024

36 days

2023

22 days

2022

12 days

New Listings

Past 30 days

258 listings

Compared to

2024

286 listings

2023

178 listings

2022

266 listings

Units sold

Past 30 days

101 units

Compared to

2024

135 units

2023

118 units

2022

175 units

Median Sold Price

Past 30 days

$625,000

Compared to

2024

$660,000

2023

$647,500

2022

$775,000


Population and Demographics

Overview

Total population 136534
Average household income $106,005

Age (%)

65 and plus
23%
50 to 64
21%
20 to 34
20%
0 to 19
19%
35 to 49
17%

Household composition (%)

Single family
60%
Single person
34%
Multi person
5%
Multi family
0%

Mother tongue (%)

English
86%
Others
3%
Spanish
2%
French
2%
Italian
1%
German
1%
Polish
1%
Arabic
1%

House tenancy (%)

Owners
65%
Renters
35%

What’s nearby?Essentials within 5 km

Local Logic

Transportation Scores

Estimated Budget