Sold conditionally
Re-listed 39 days ago
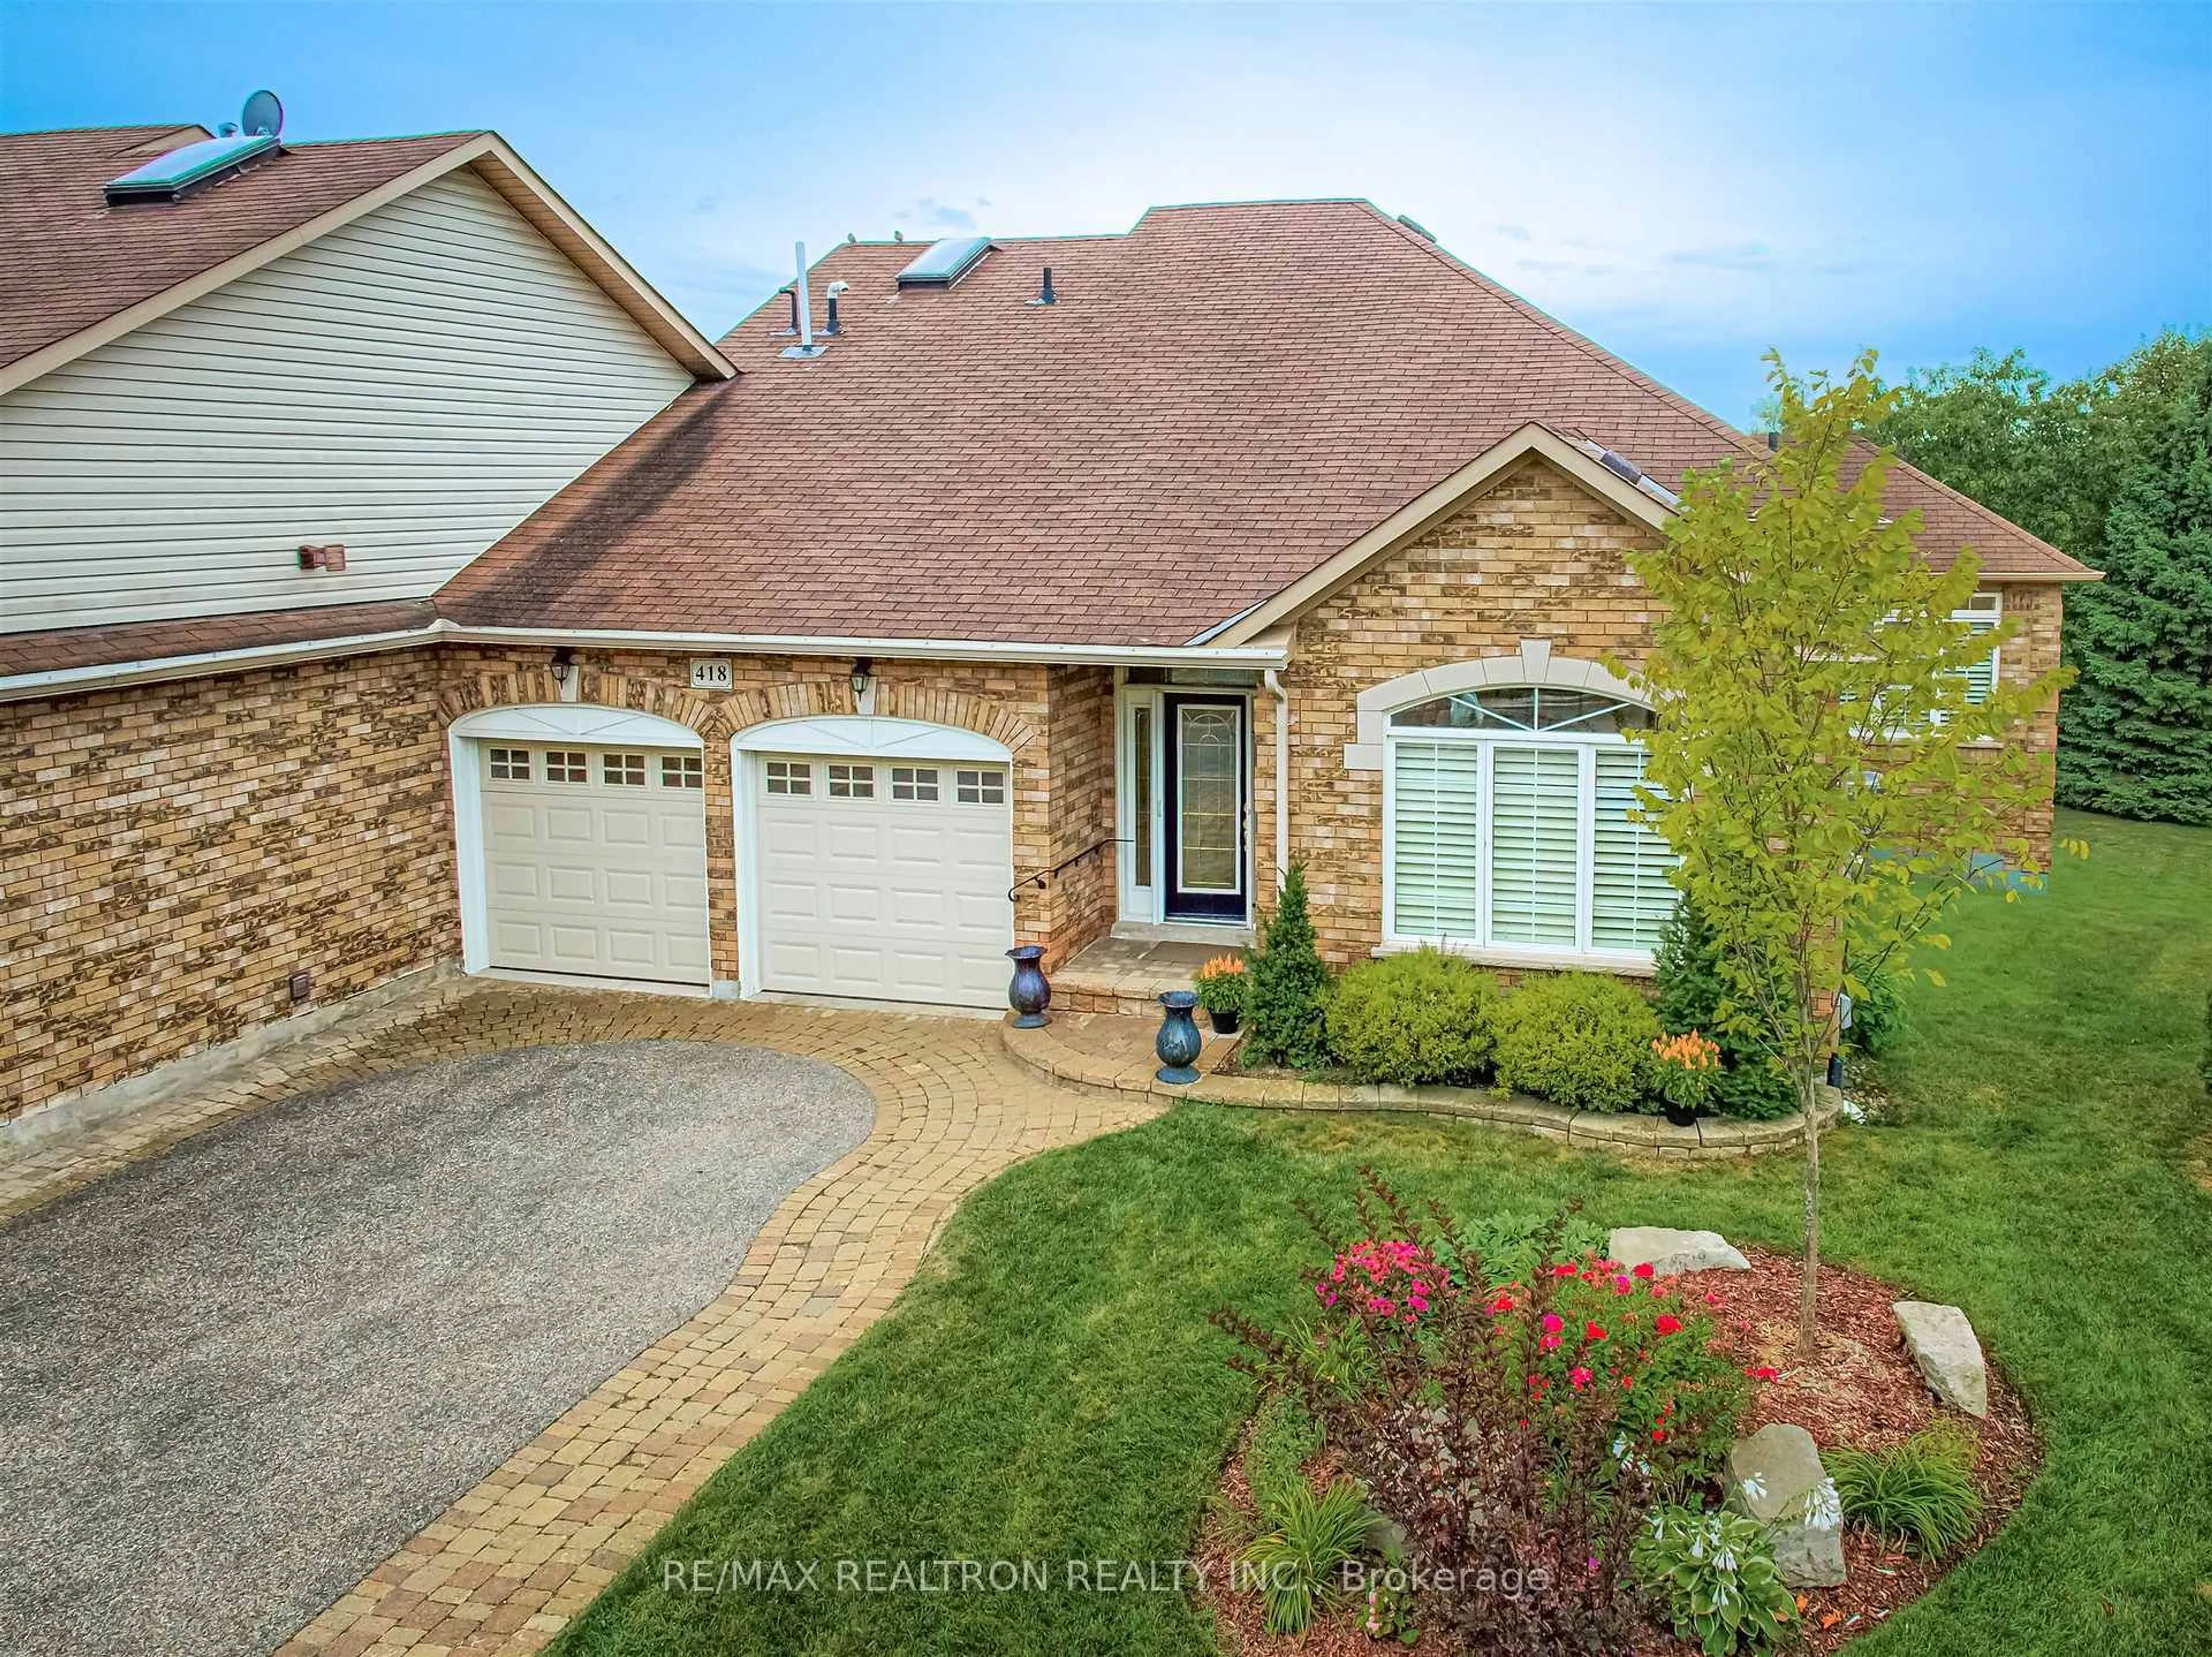
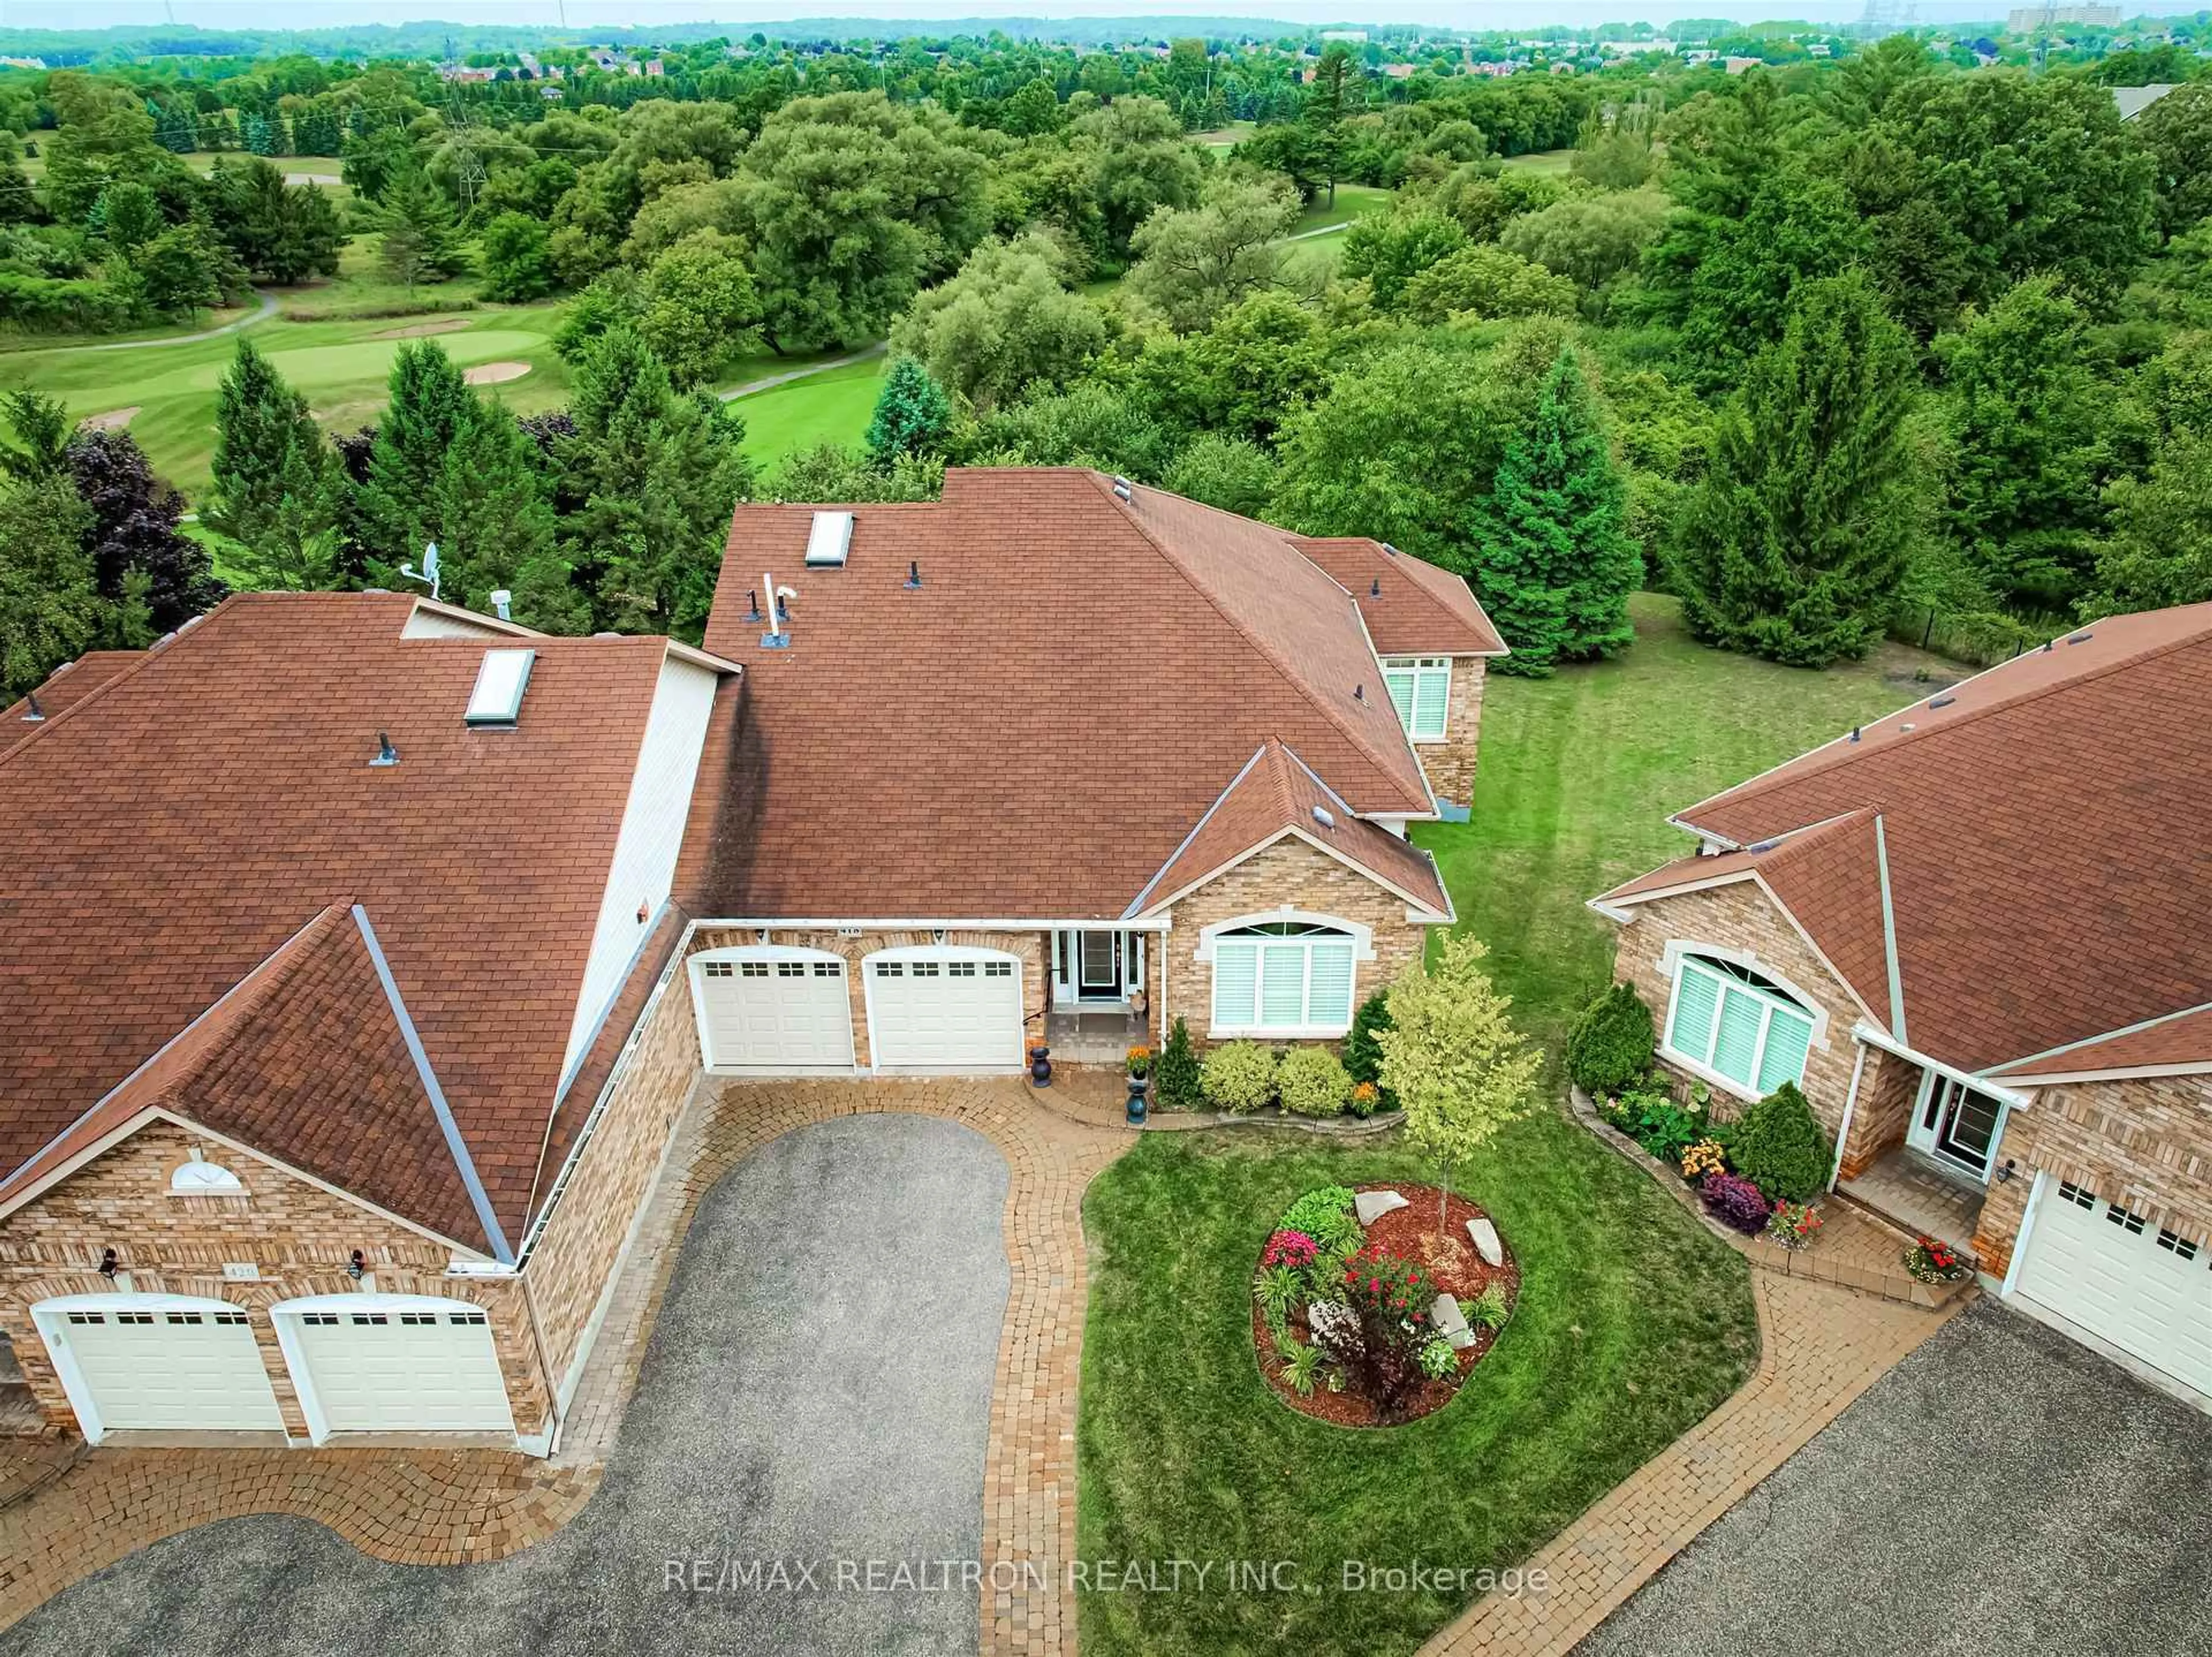
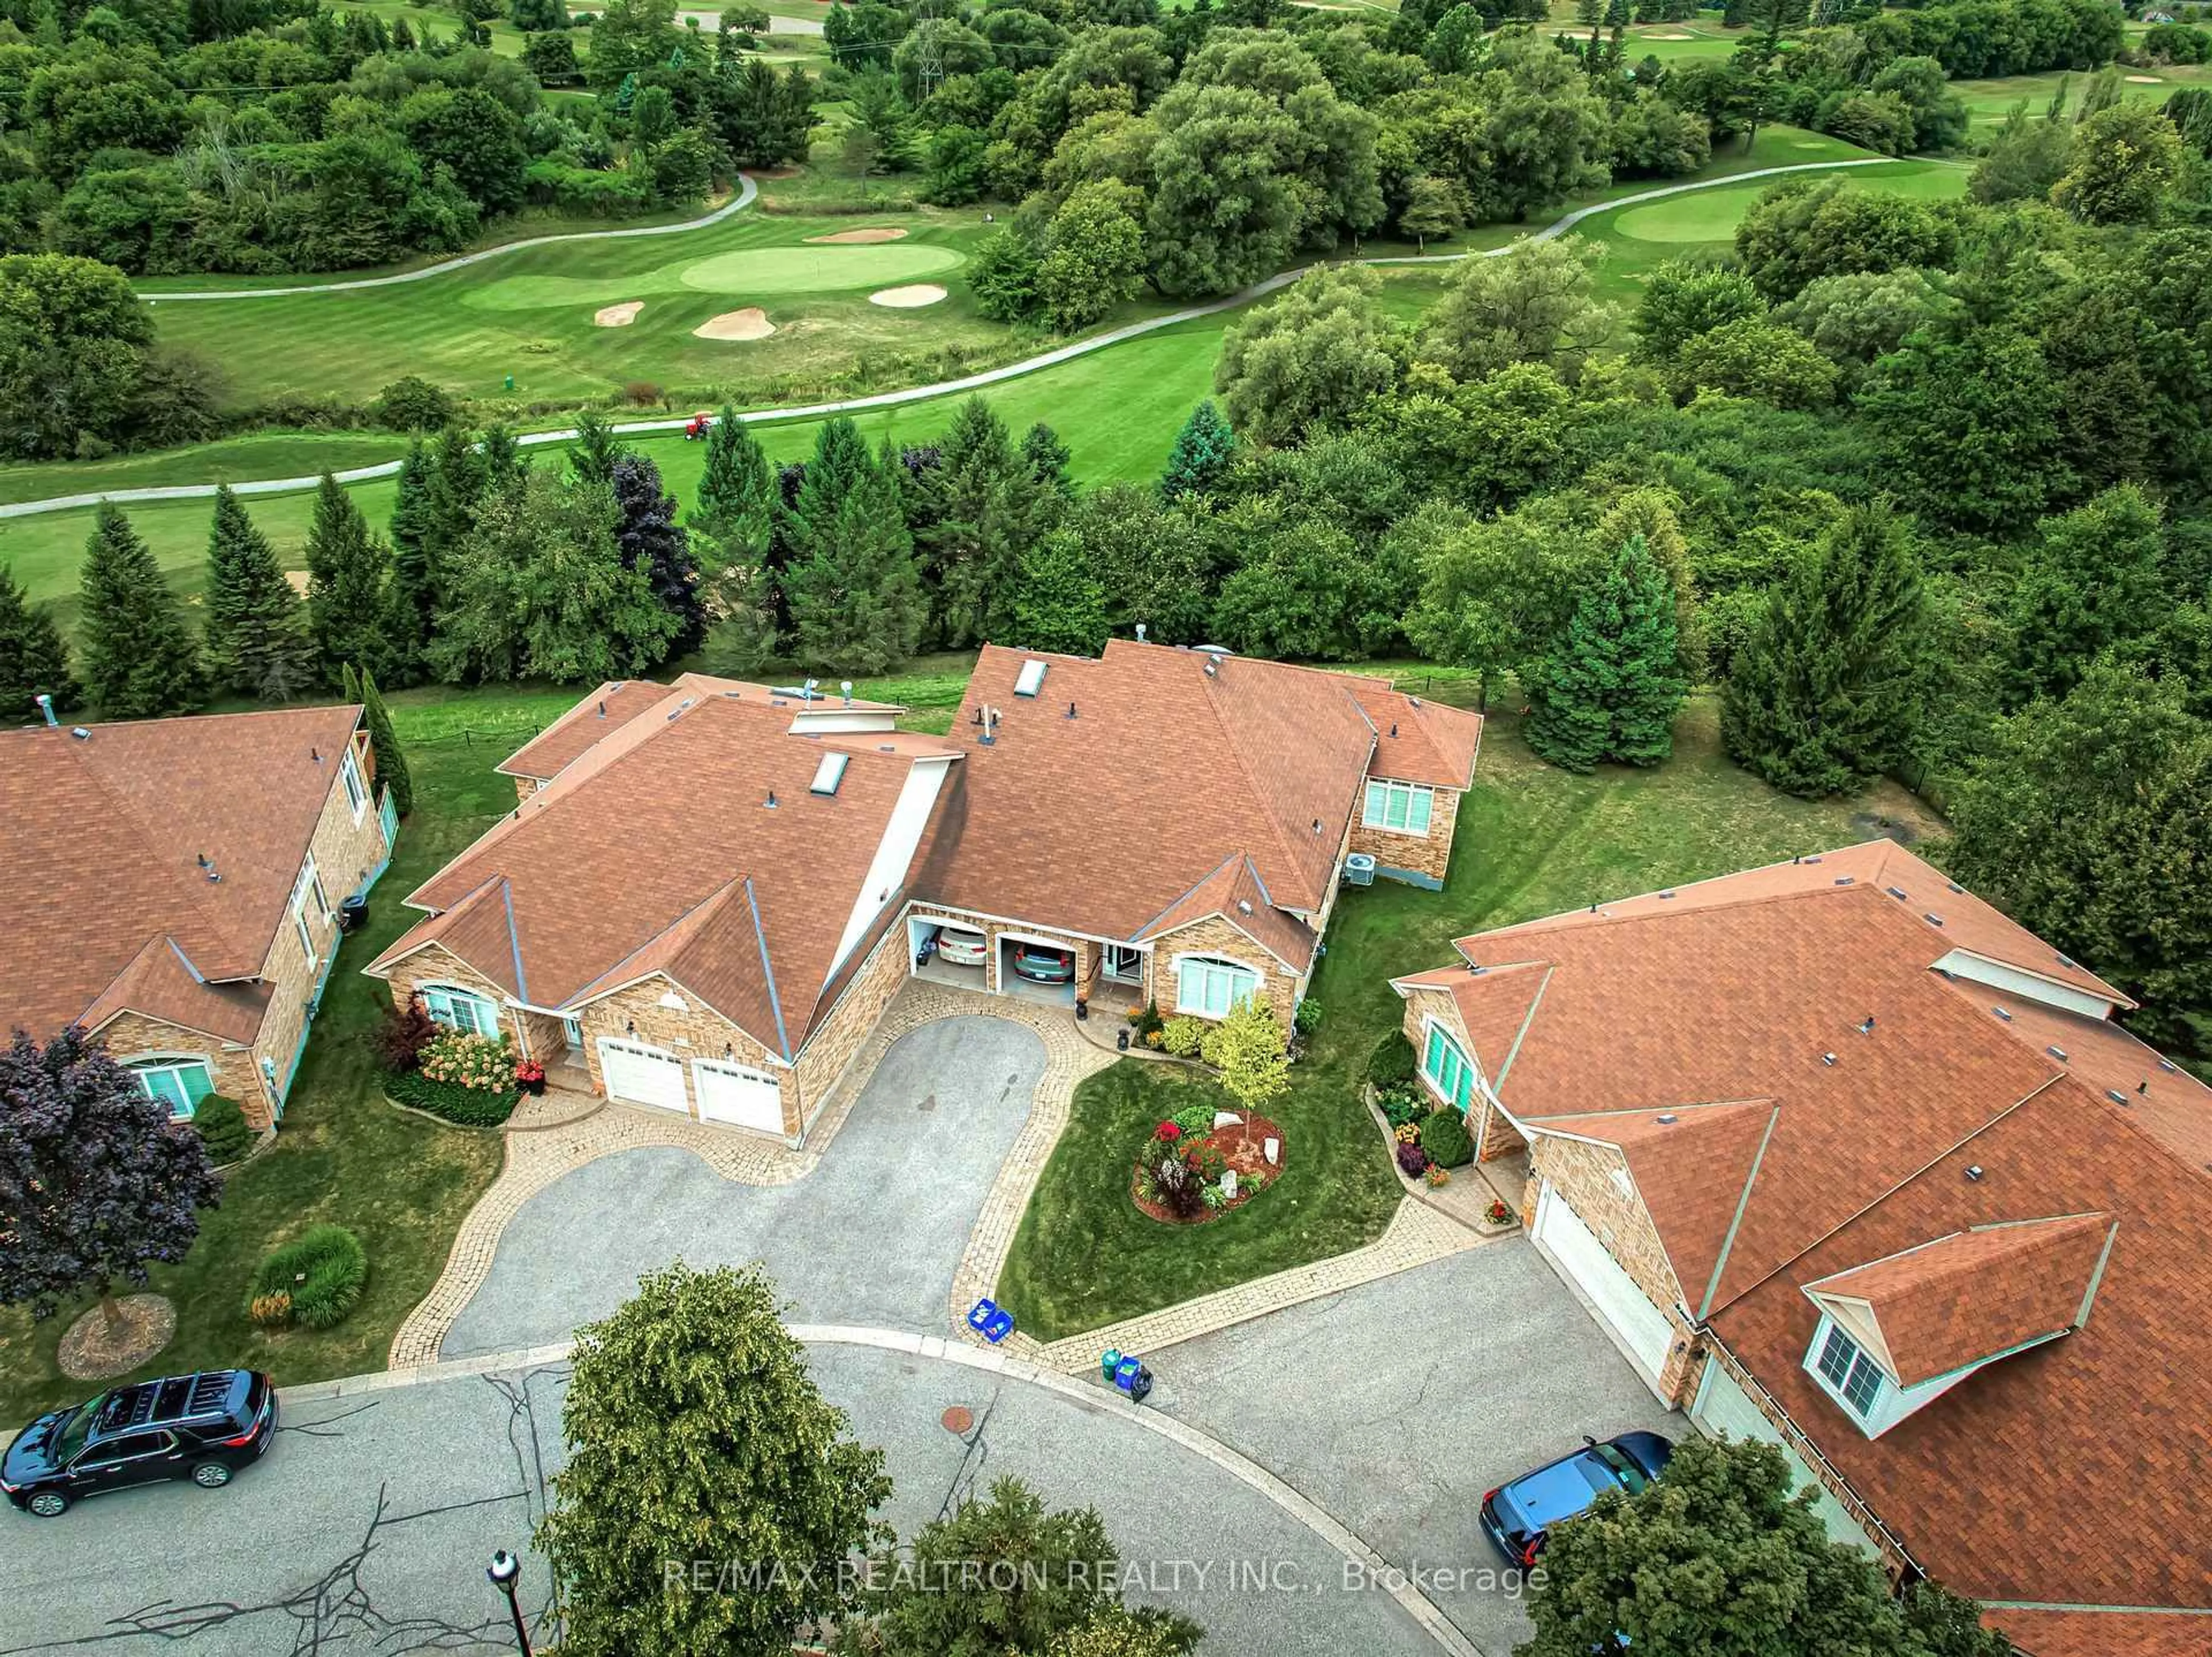
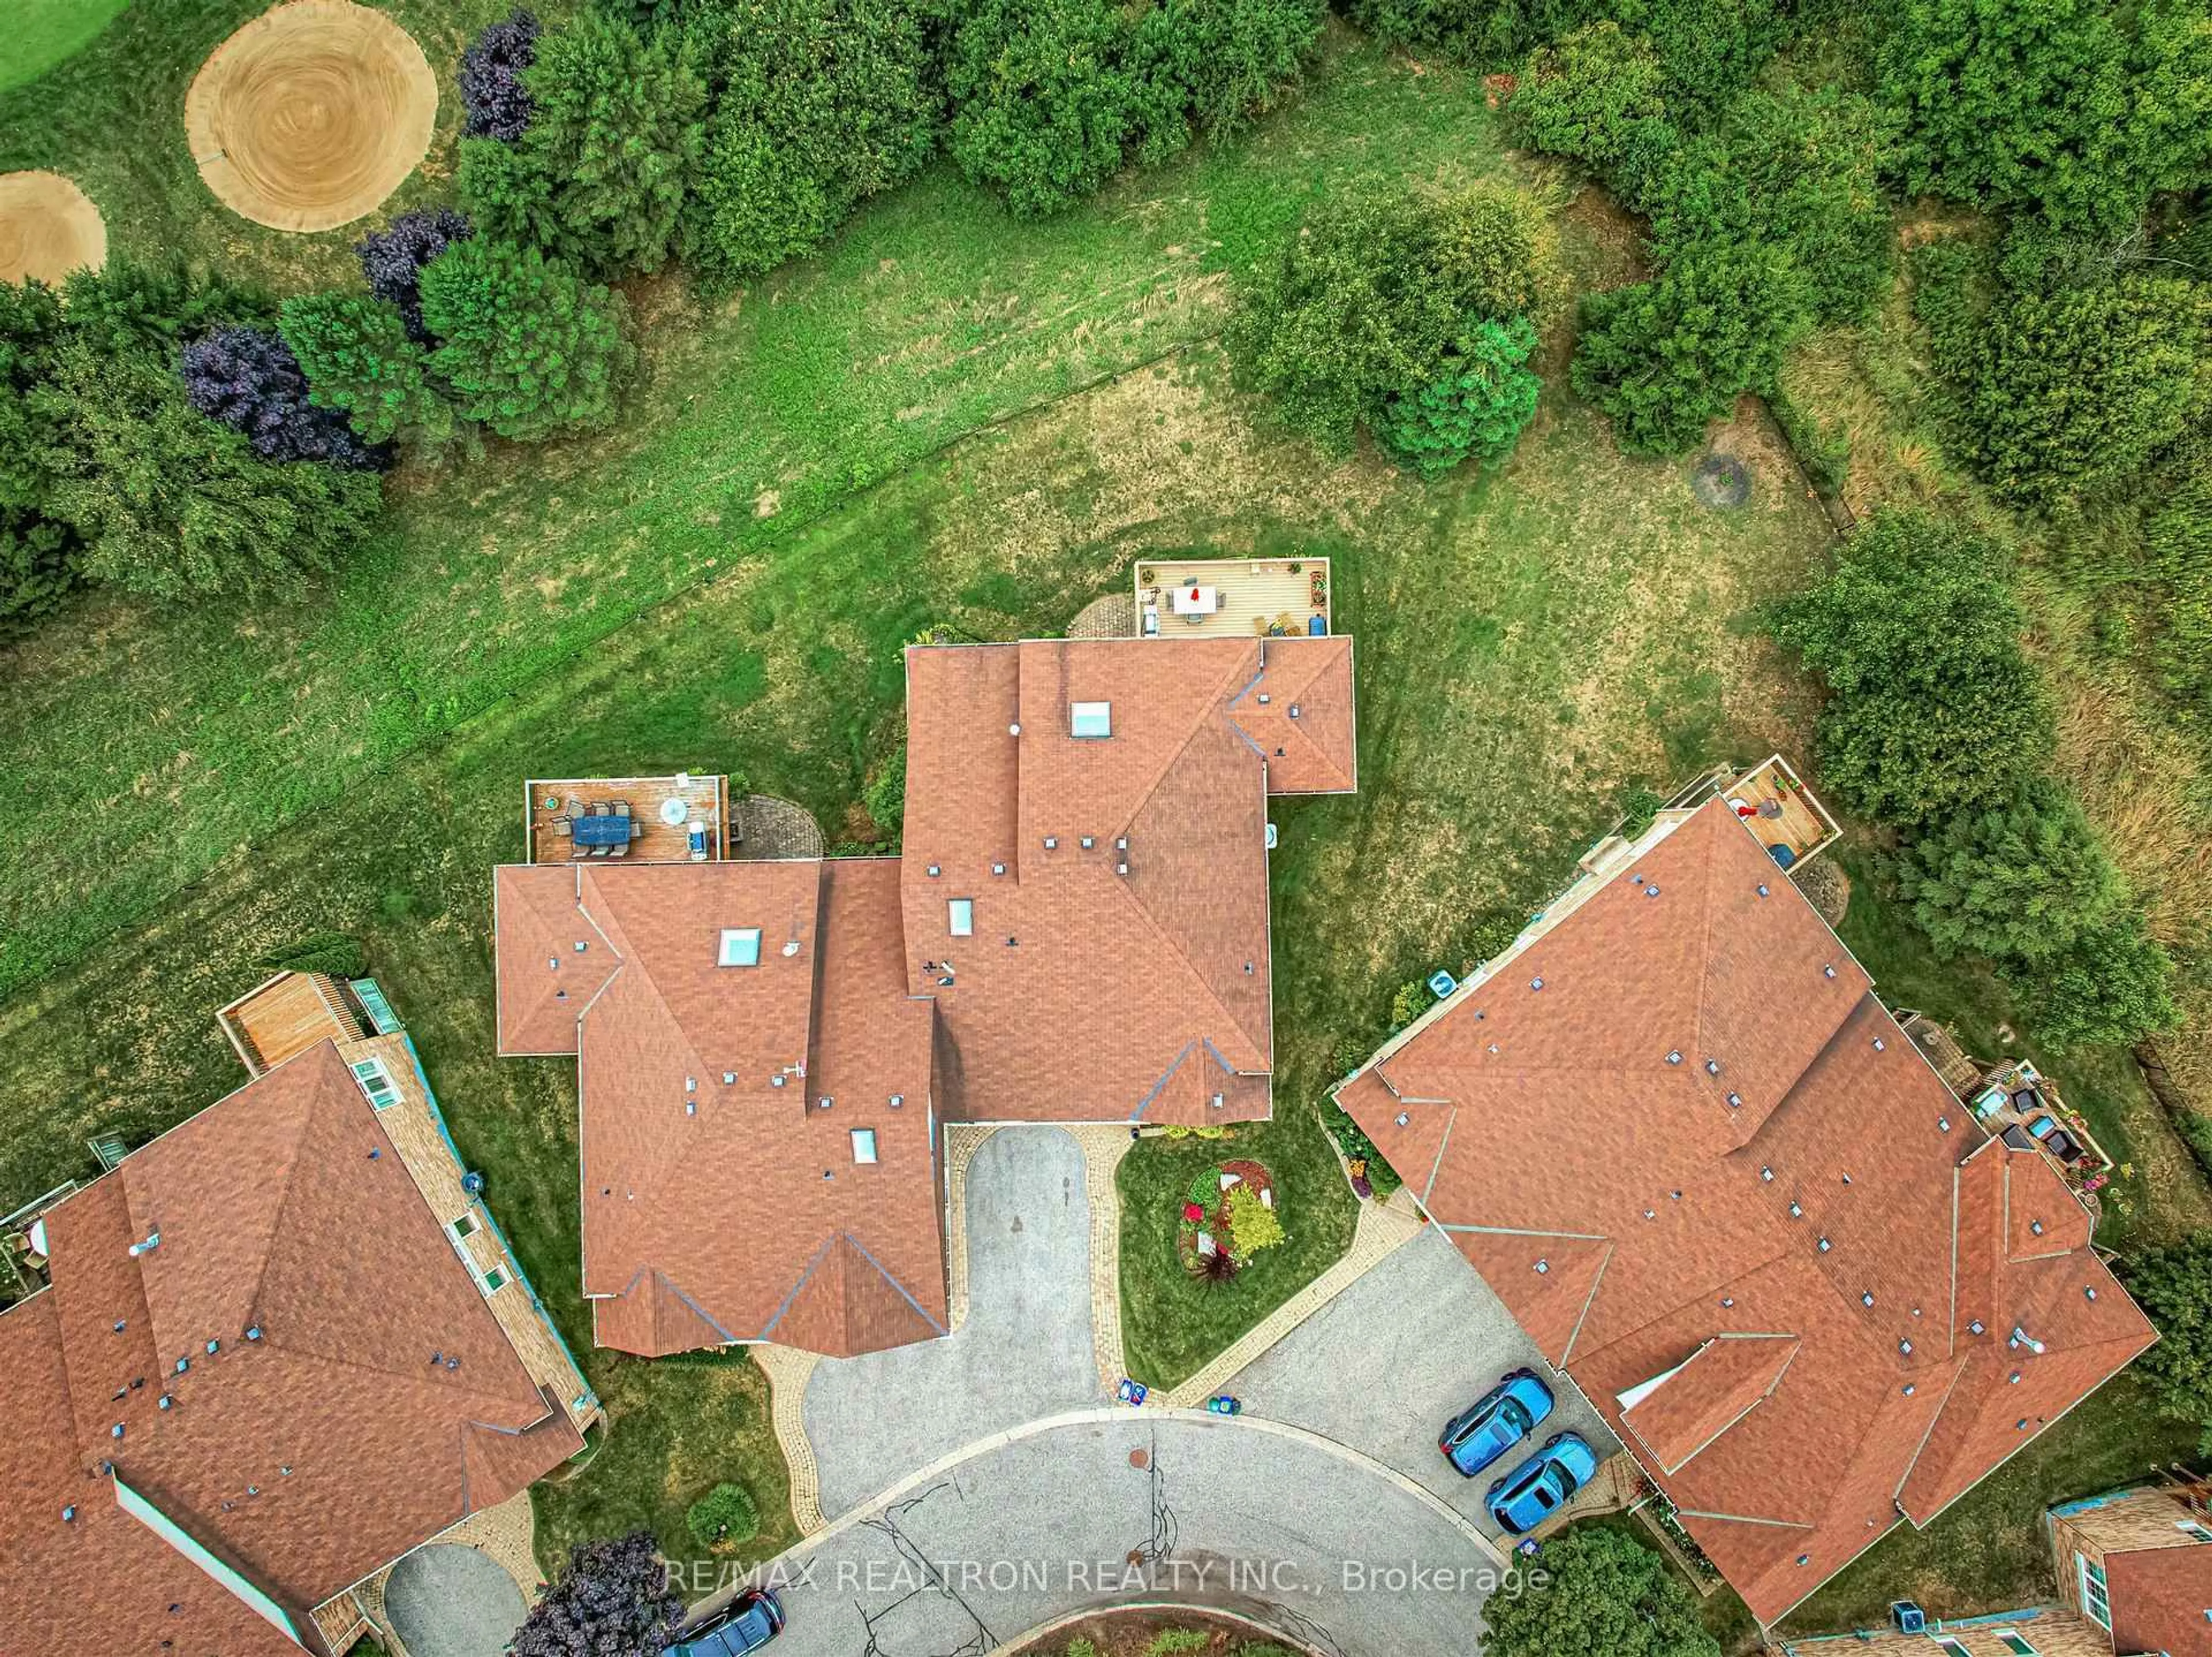
418 Morley Cook Cres, Newmarket, Ontario L3X 2M3
In the same building:
-
•
•
•
•
Sold for $···,···
•
•
•
•
Contact us about this property
Highlights
Days on marketSold
Total days on marketWahi shows you the total number of days a property has been on market, including days it's been off market then re-listed, as long as it's within 30 days of being off market.
72 daysEstimated valueThis is the price Wahi expects this property to sell for.
The calculation is powered by our Instant Home Value Estimate, which uses current market and property price trends to estimate your home’s value with a 90% accuracy rate.Not available
Price/Sqft$386/sqft
Monthly cost
Open Calculator
Description
Property Details
Interior
Features
Heating: Forced Air
Cooling: Central Air
Fireplace
Basement: Fin W/O
Exterior
Features
Patio: Terr
Balcony: Terr
Parking
Garage spaces 2
Garage type Attached
Other parking spaces 4
Total parking spaces 6
Condo Details
Property History
Login required
Price changeActive
$•••,•••
Login required
Re-listed
$•••,•••
39 days on market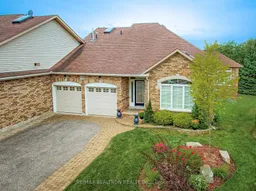 50Listing by trreb®
50Login required
Terminated
Login required
Listed
$•••,•••
Stayed --32 days on market Listing by trreb®
Property listed by RE/MAX REALTRON REALTY INC., Brokerage

Interested in this property?Get in touch to get the inside scoop.

