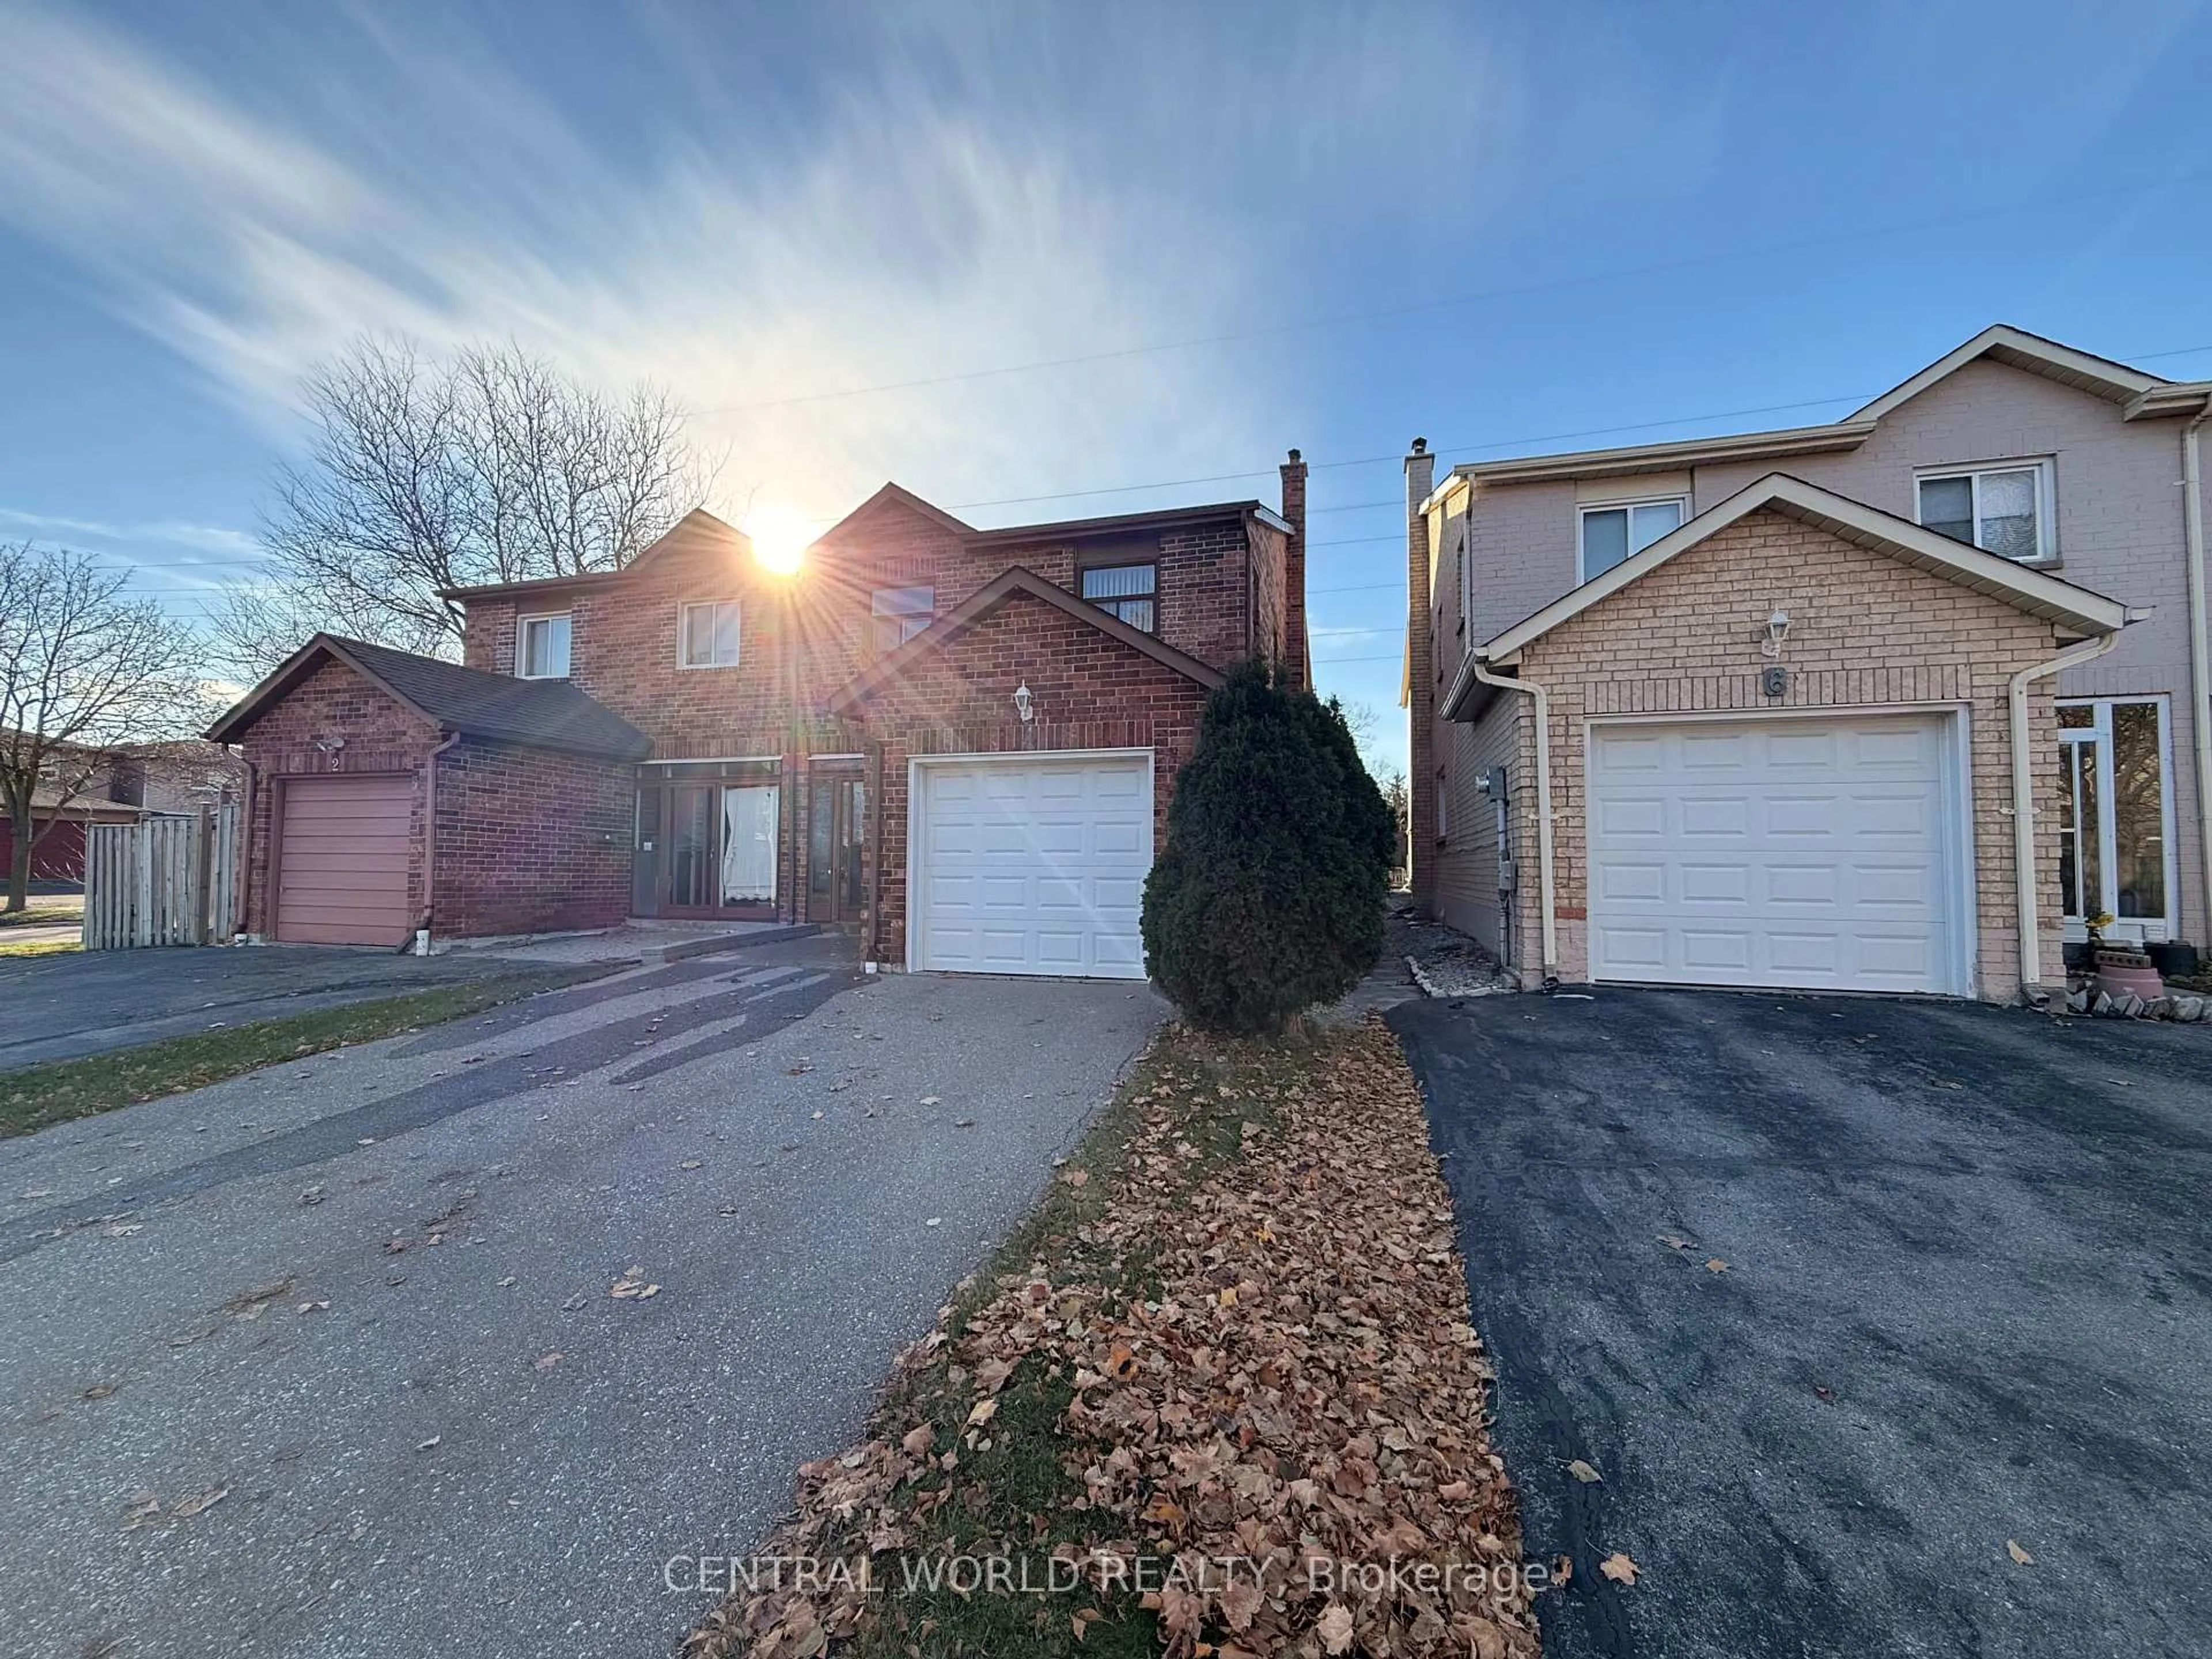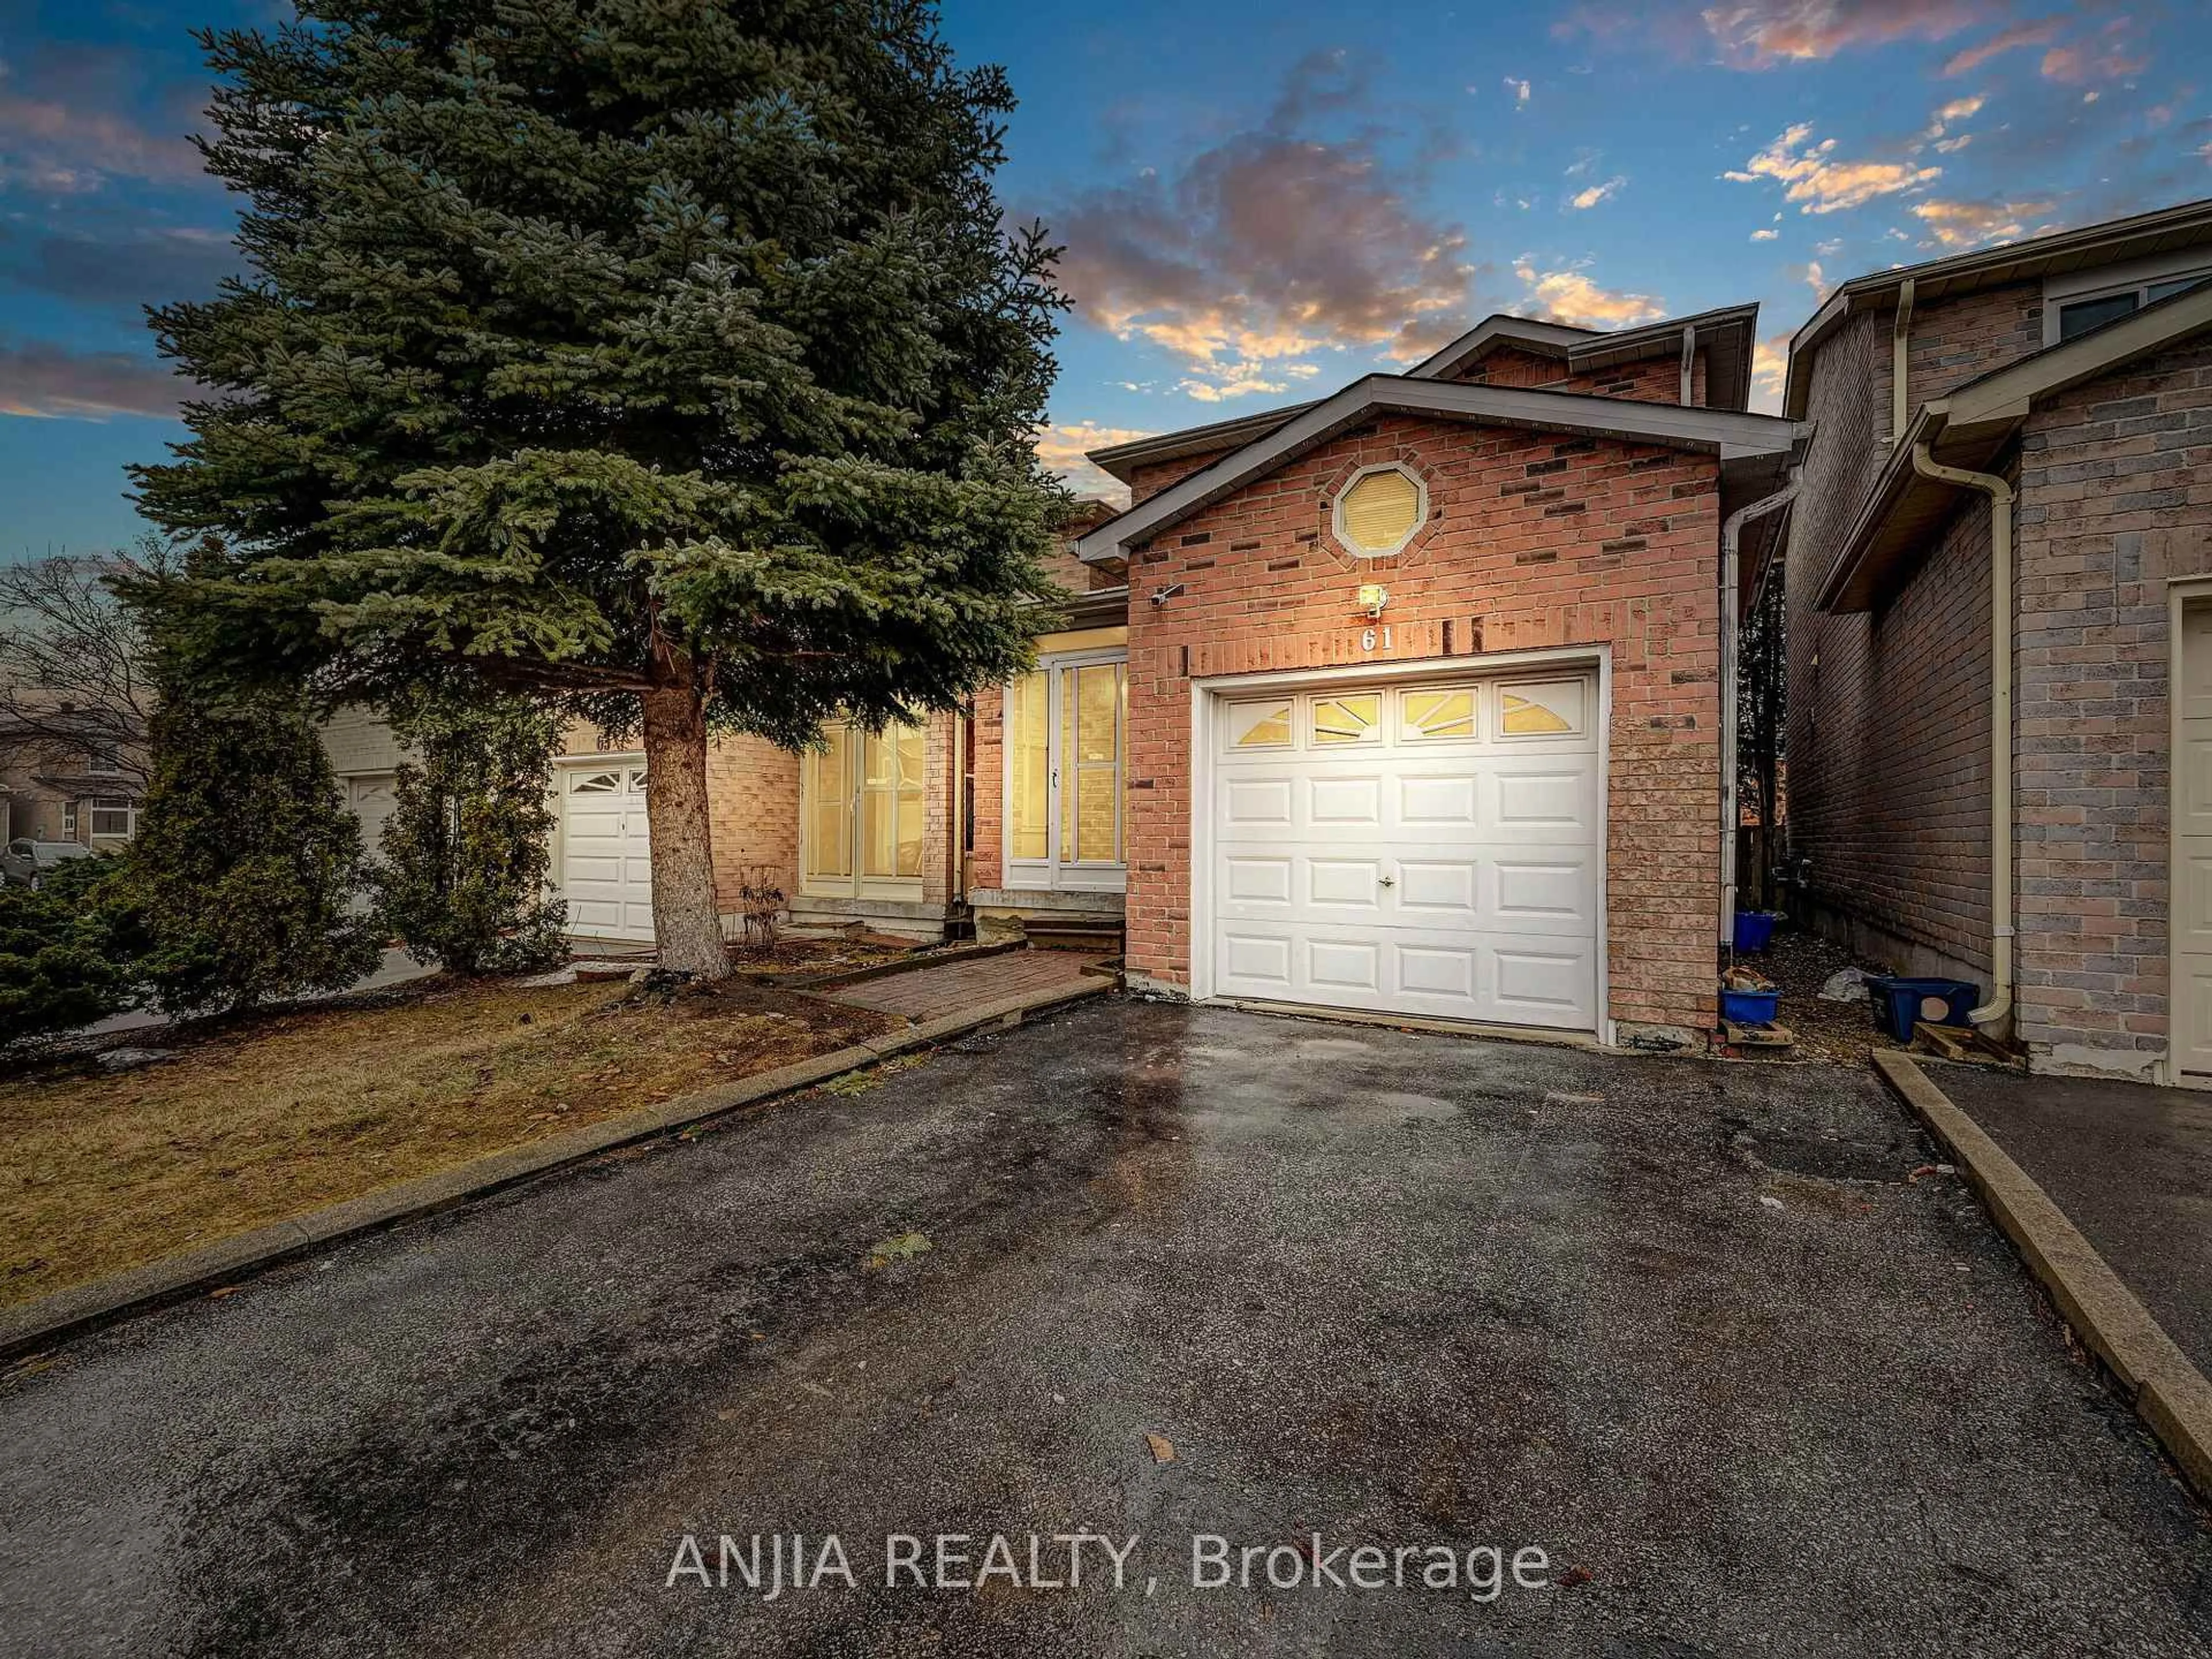
61 Sorrell Cres, Markham, Ontario L3S 1K9
Contact us about this property
Highlights
Estimated valueThis is the price Wahi expects this property to sell for.
The calculation is powered by our Instant Home Value Estimate, which uses current market and property price trends to estimate your home’s value with a 90% accuracy rate.Not available
Price/Sqft$1,049/sqft
Monthly cost
Open Calculator
Description
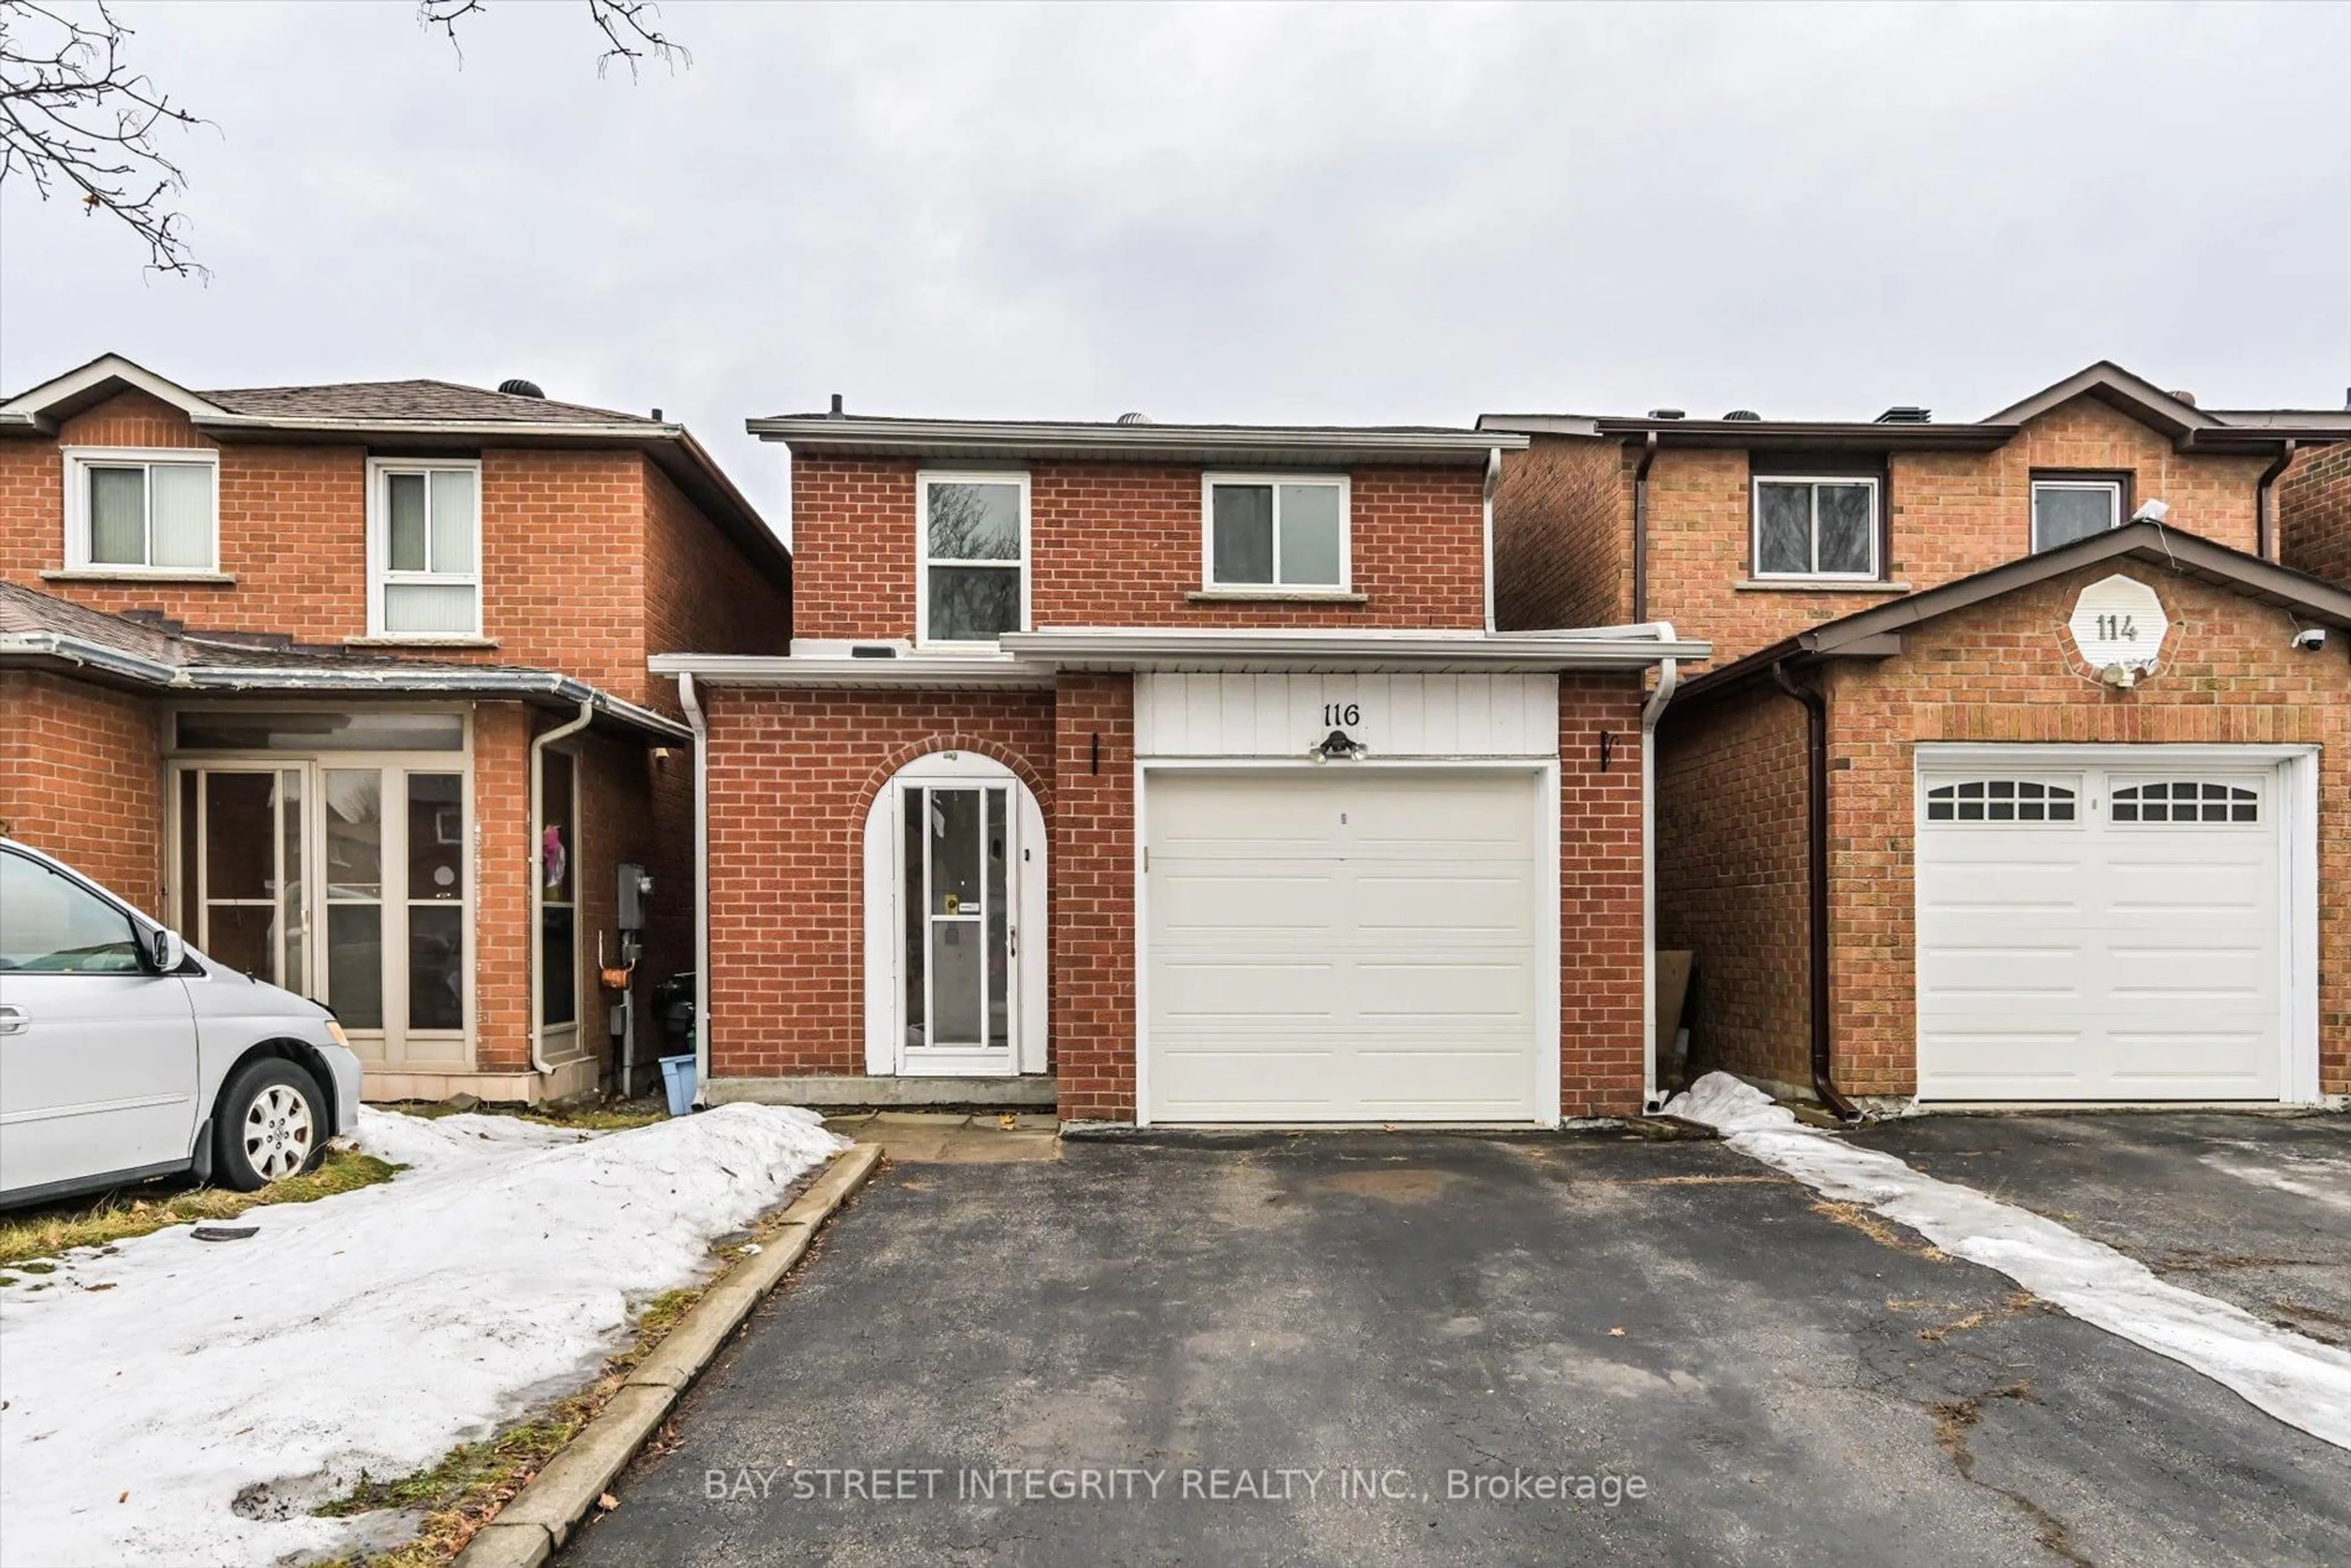
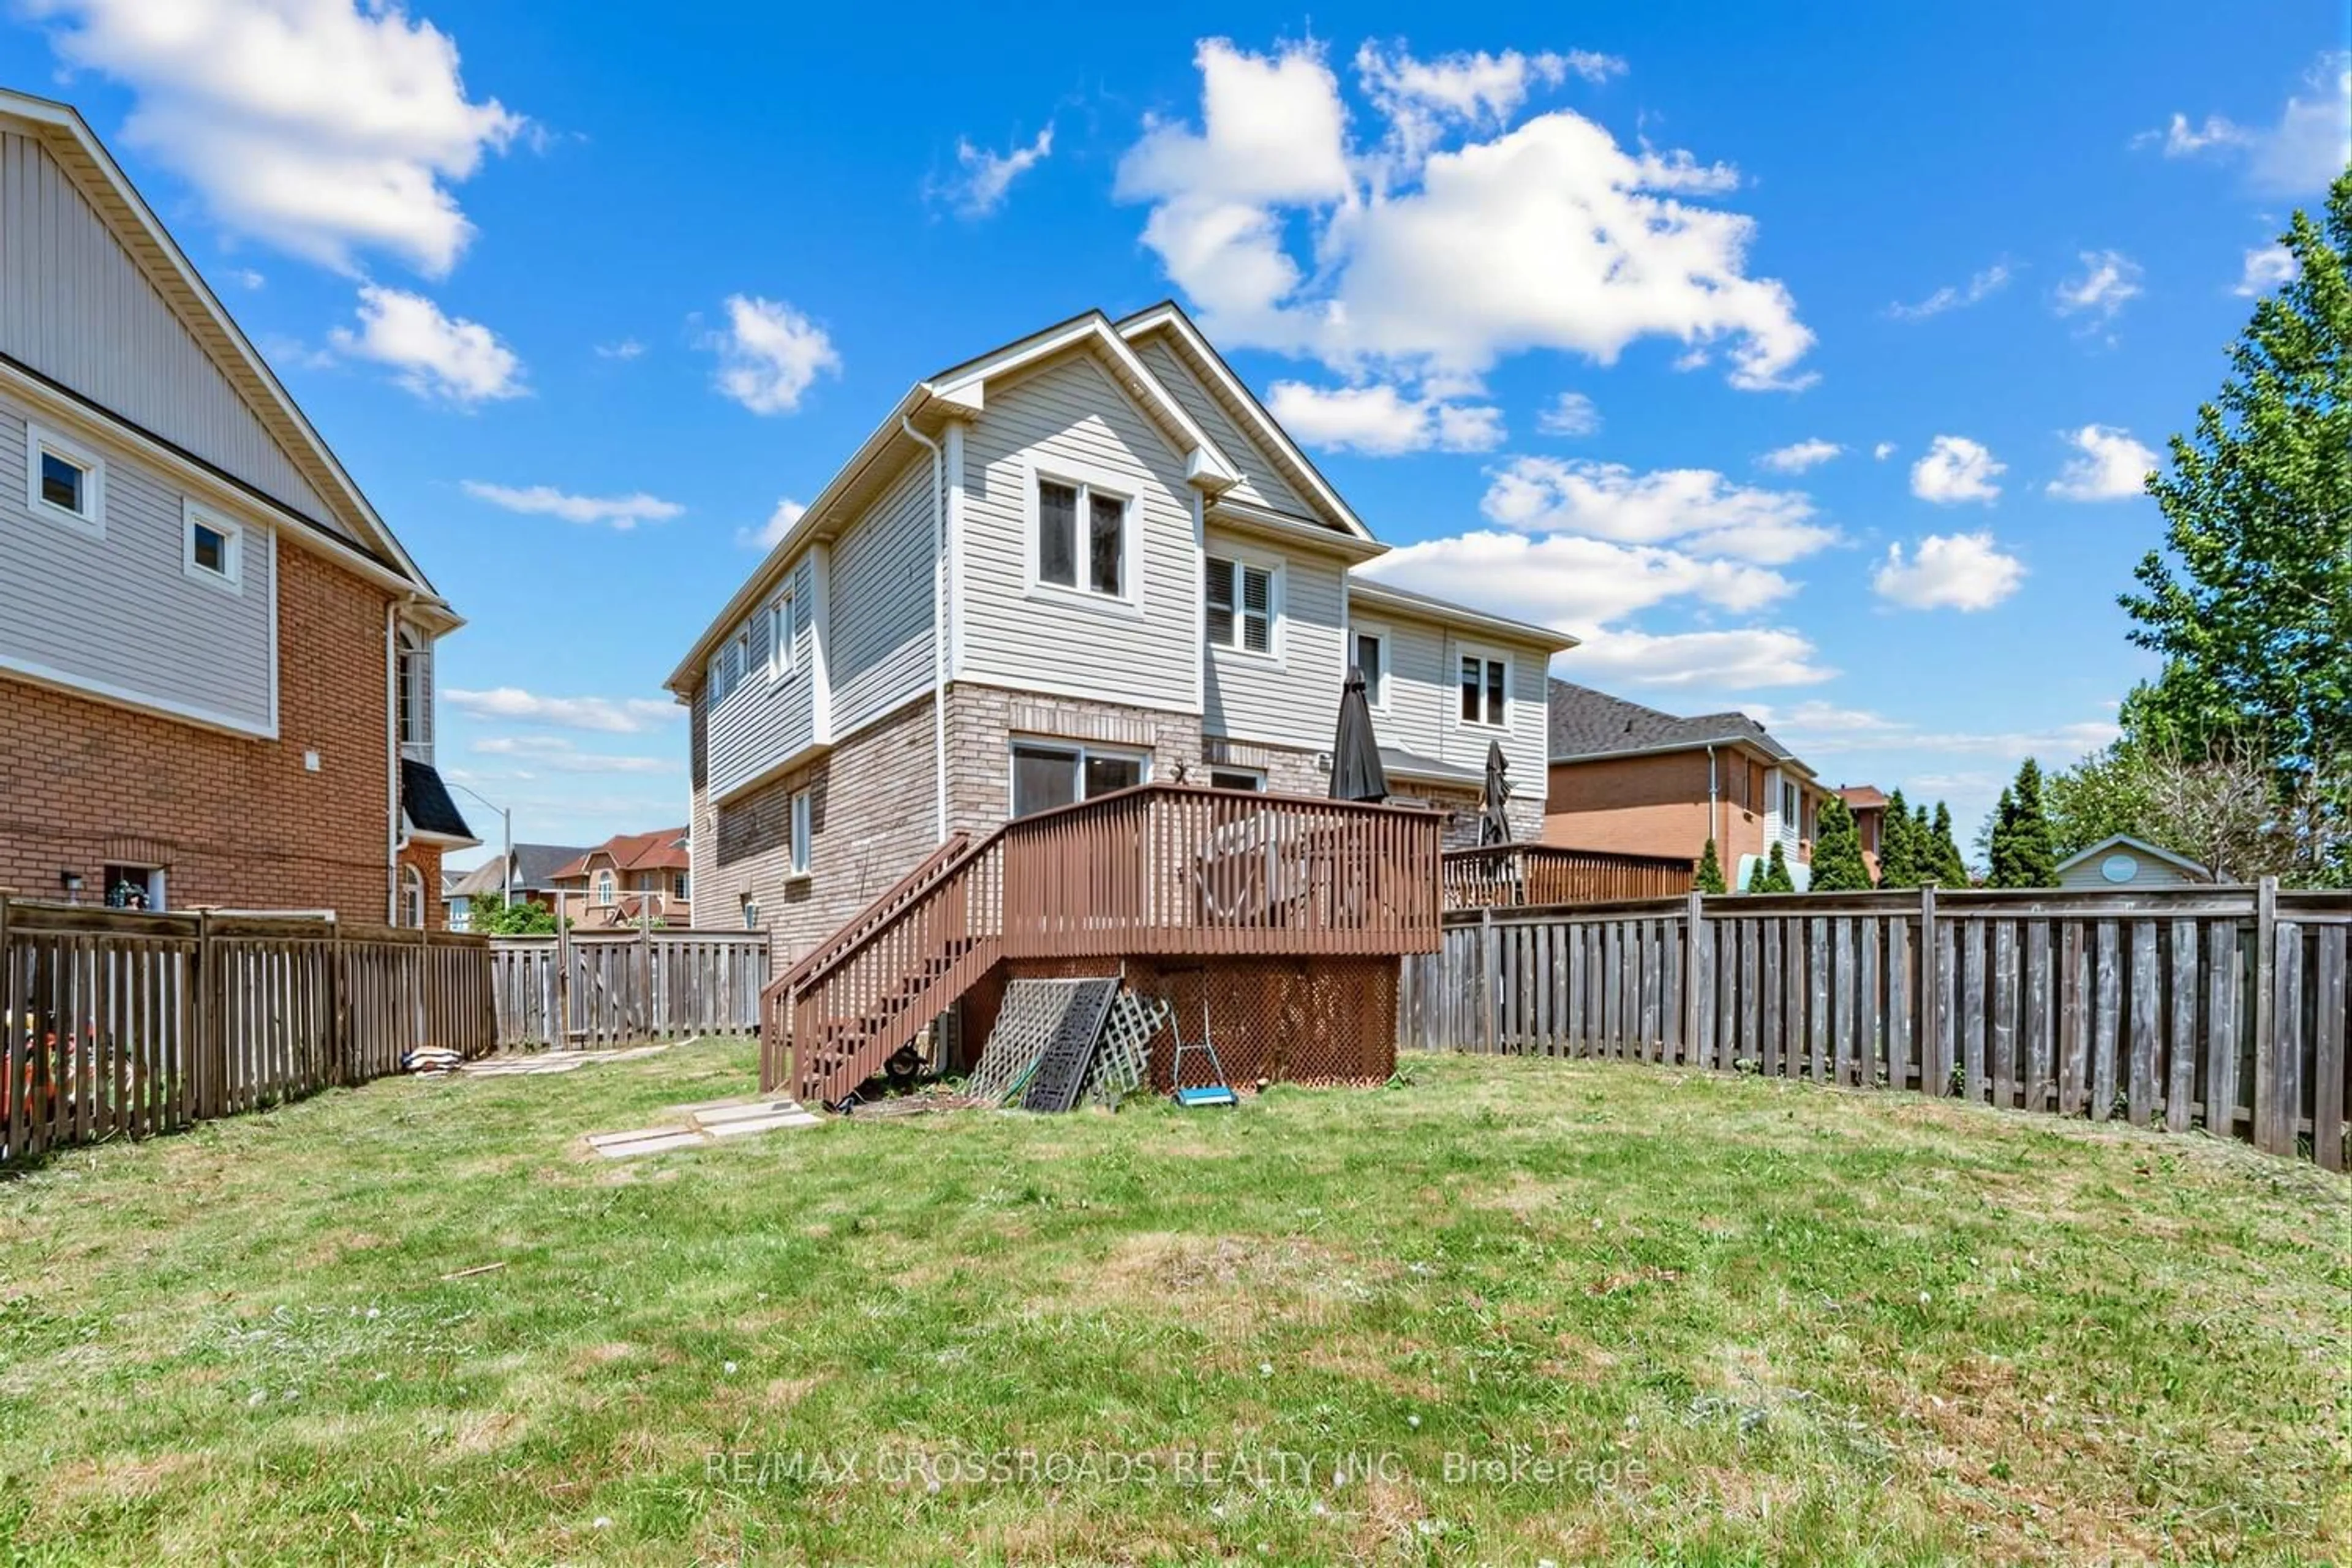
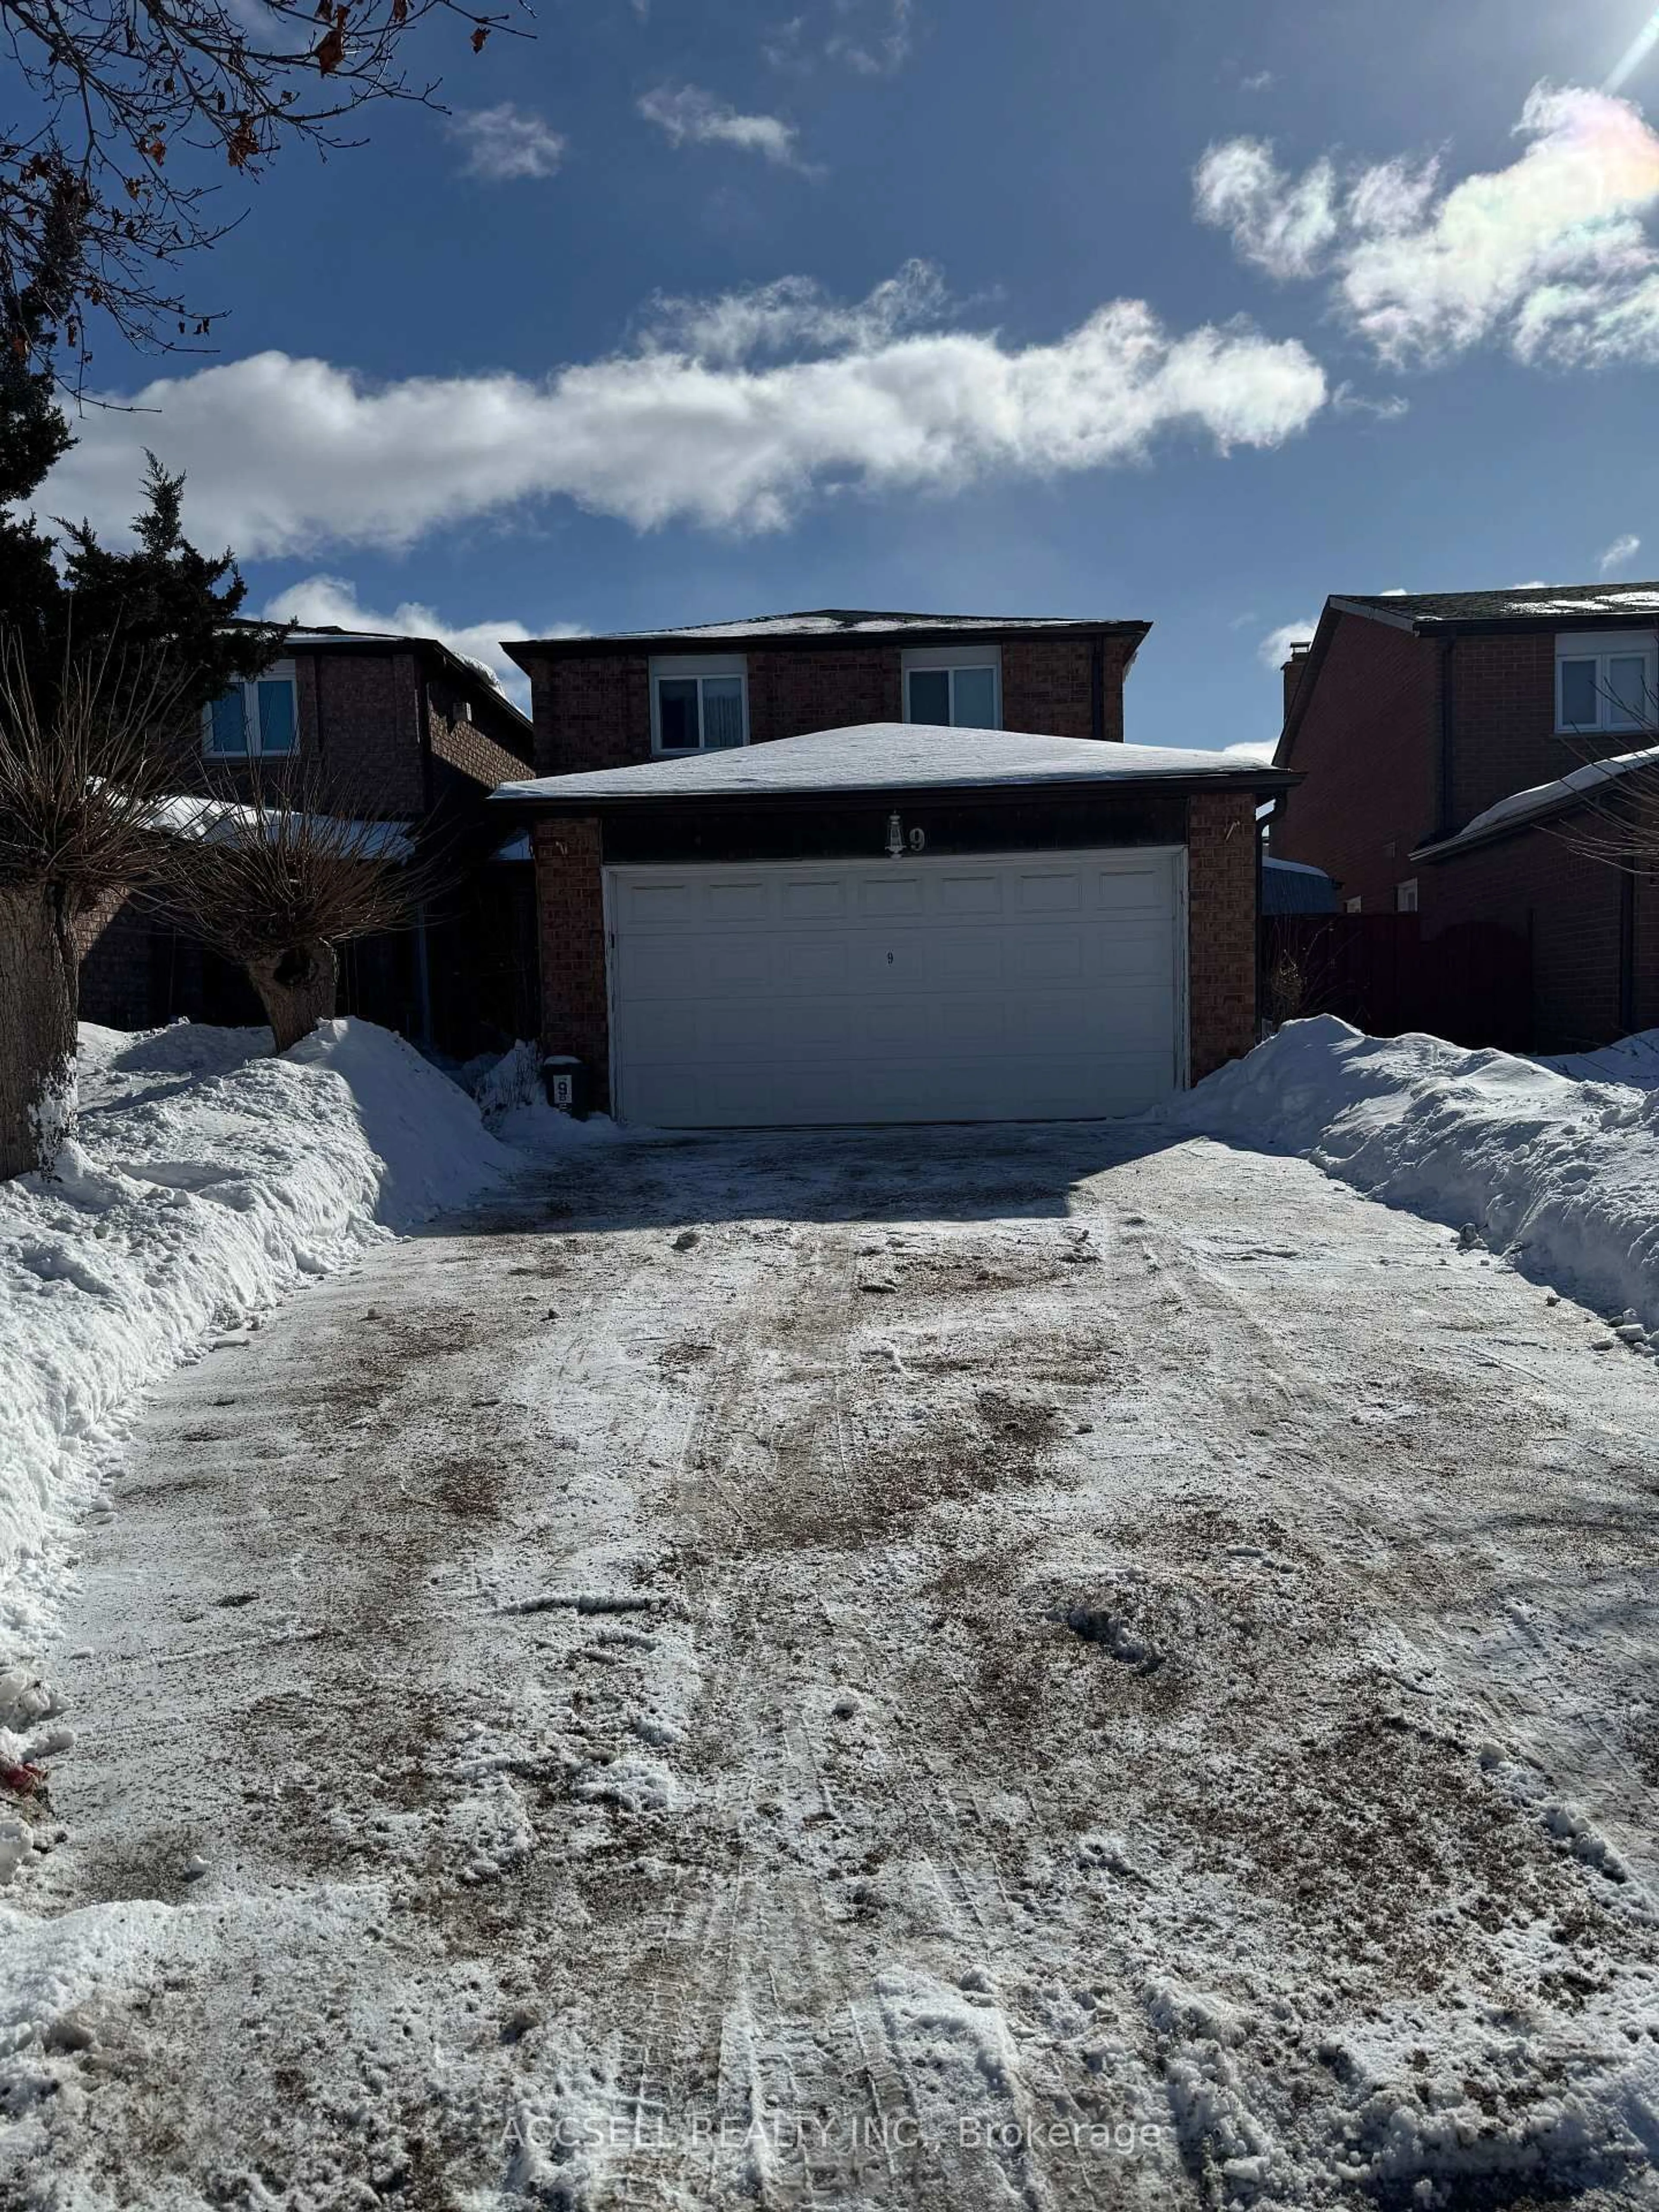
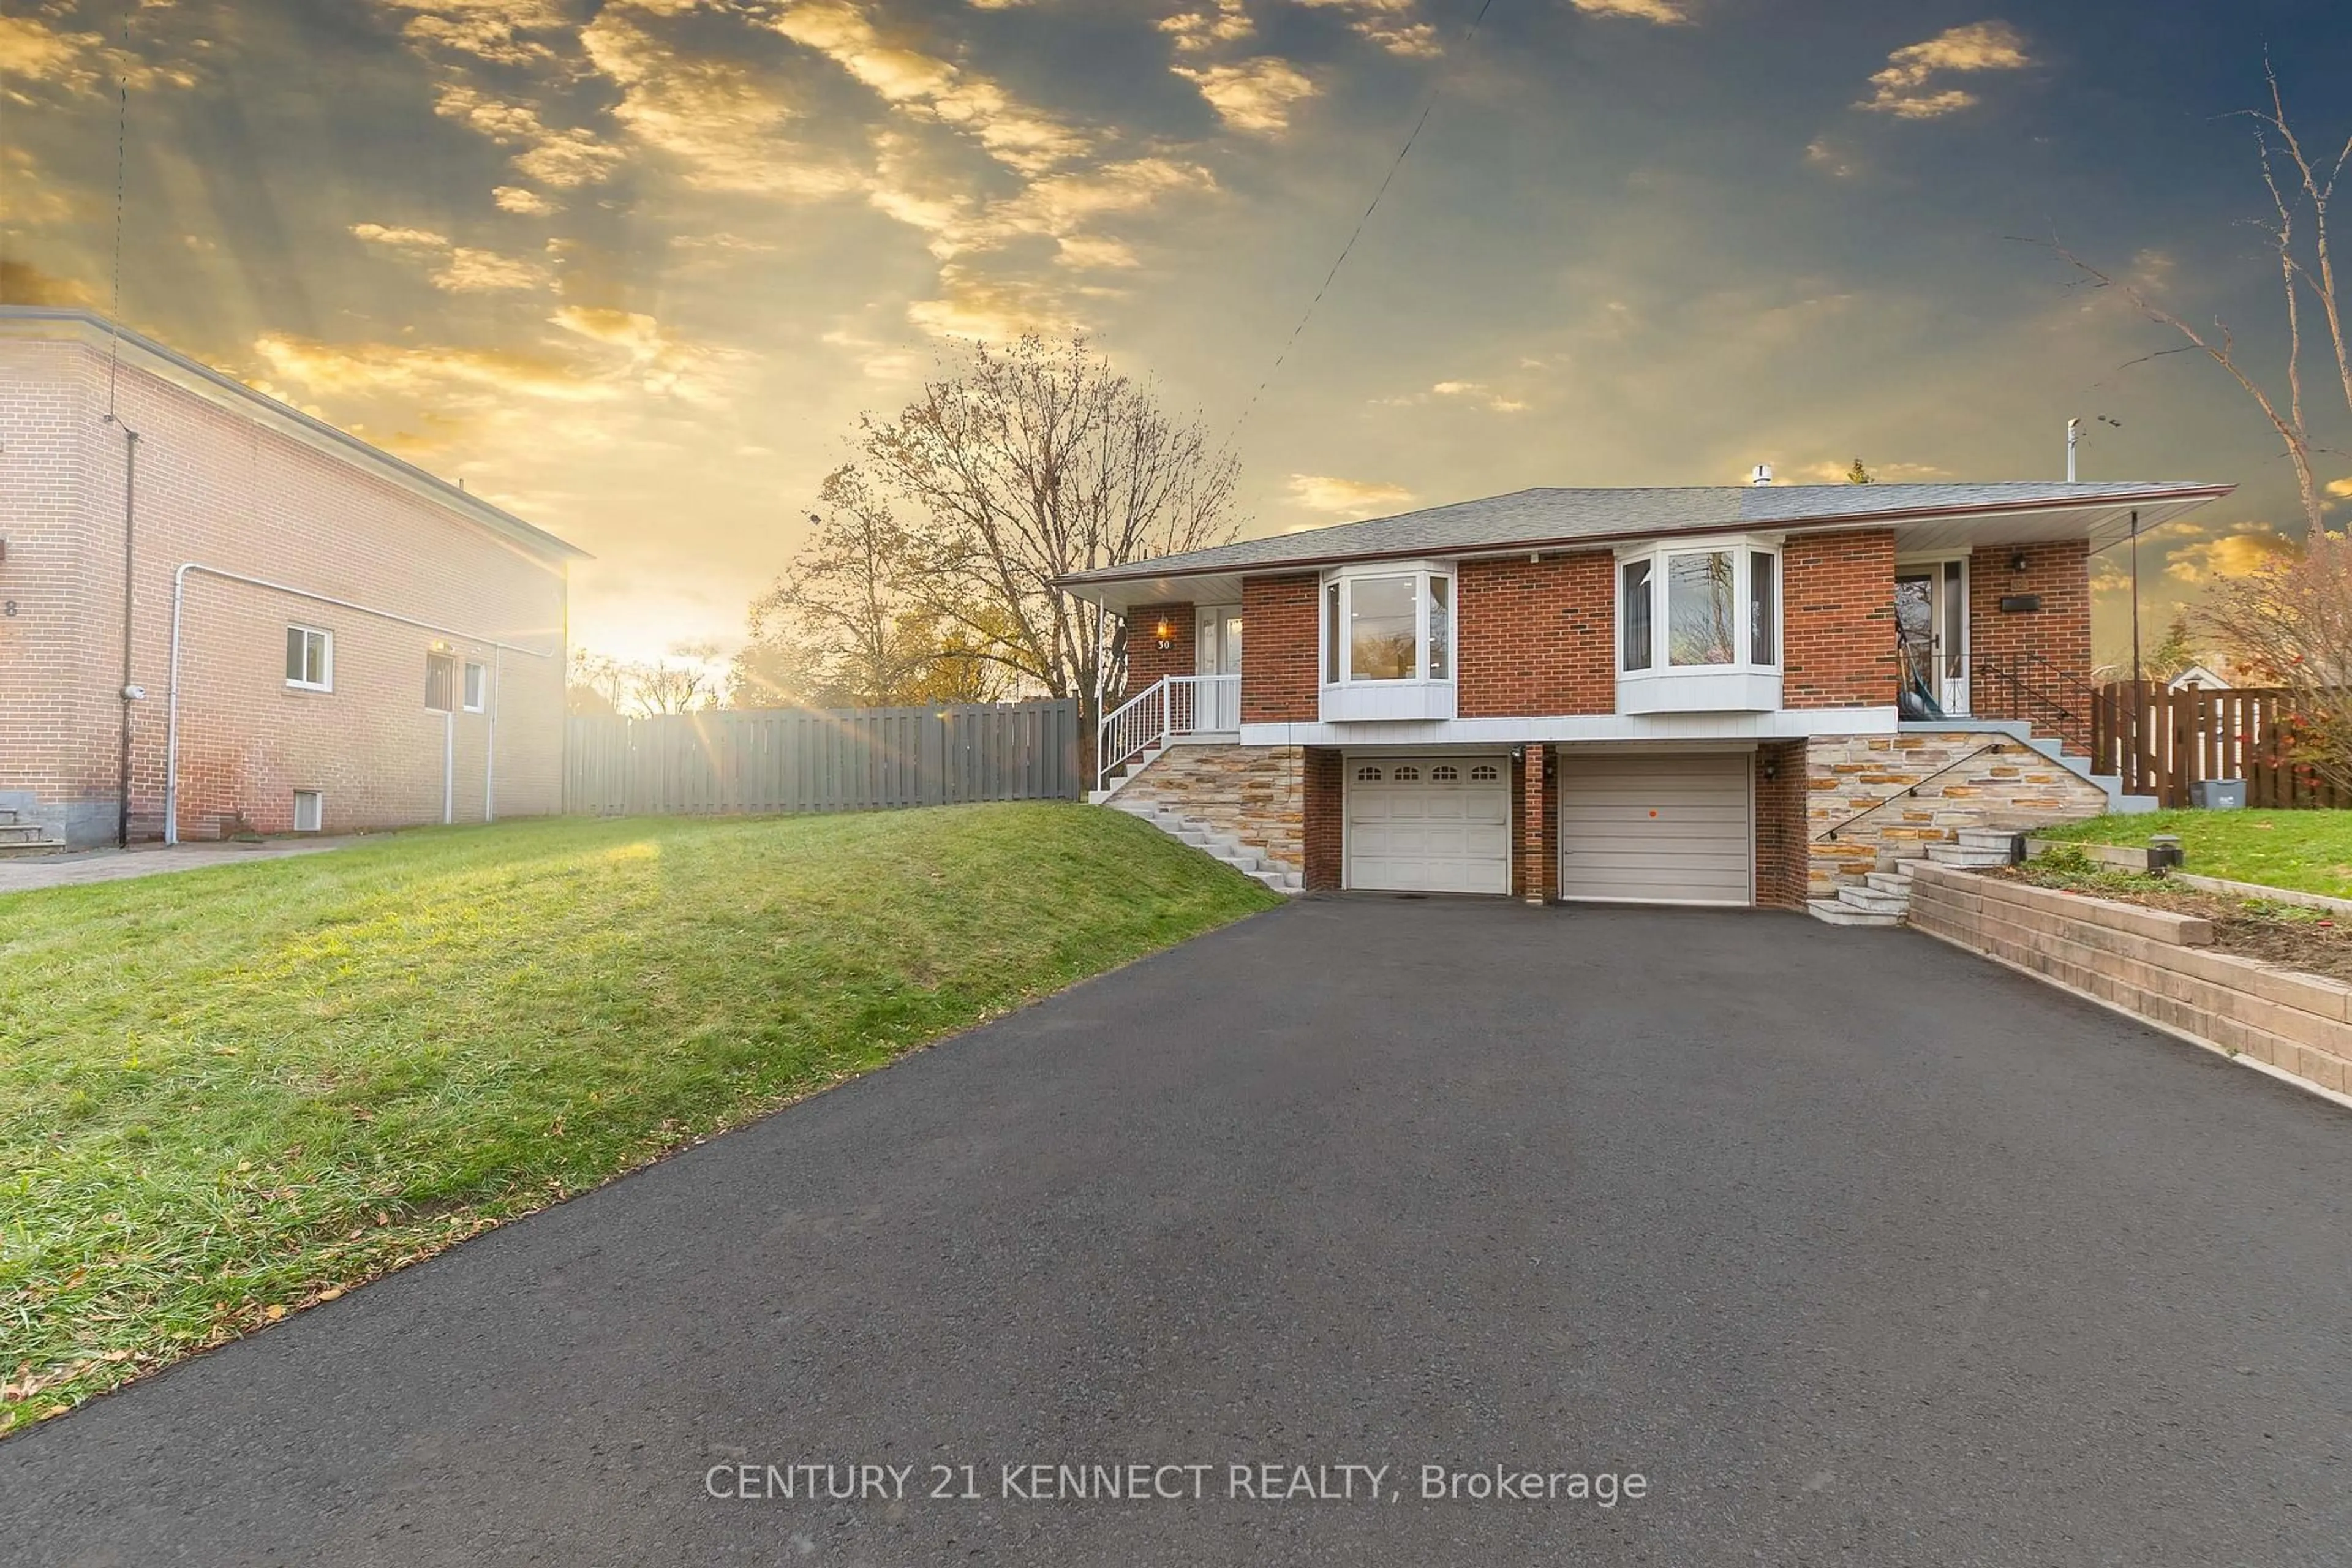
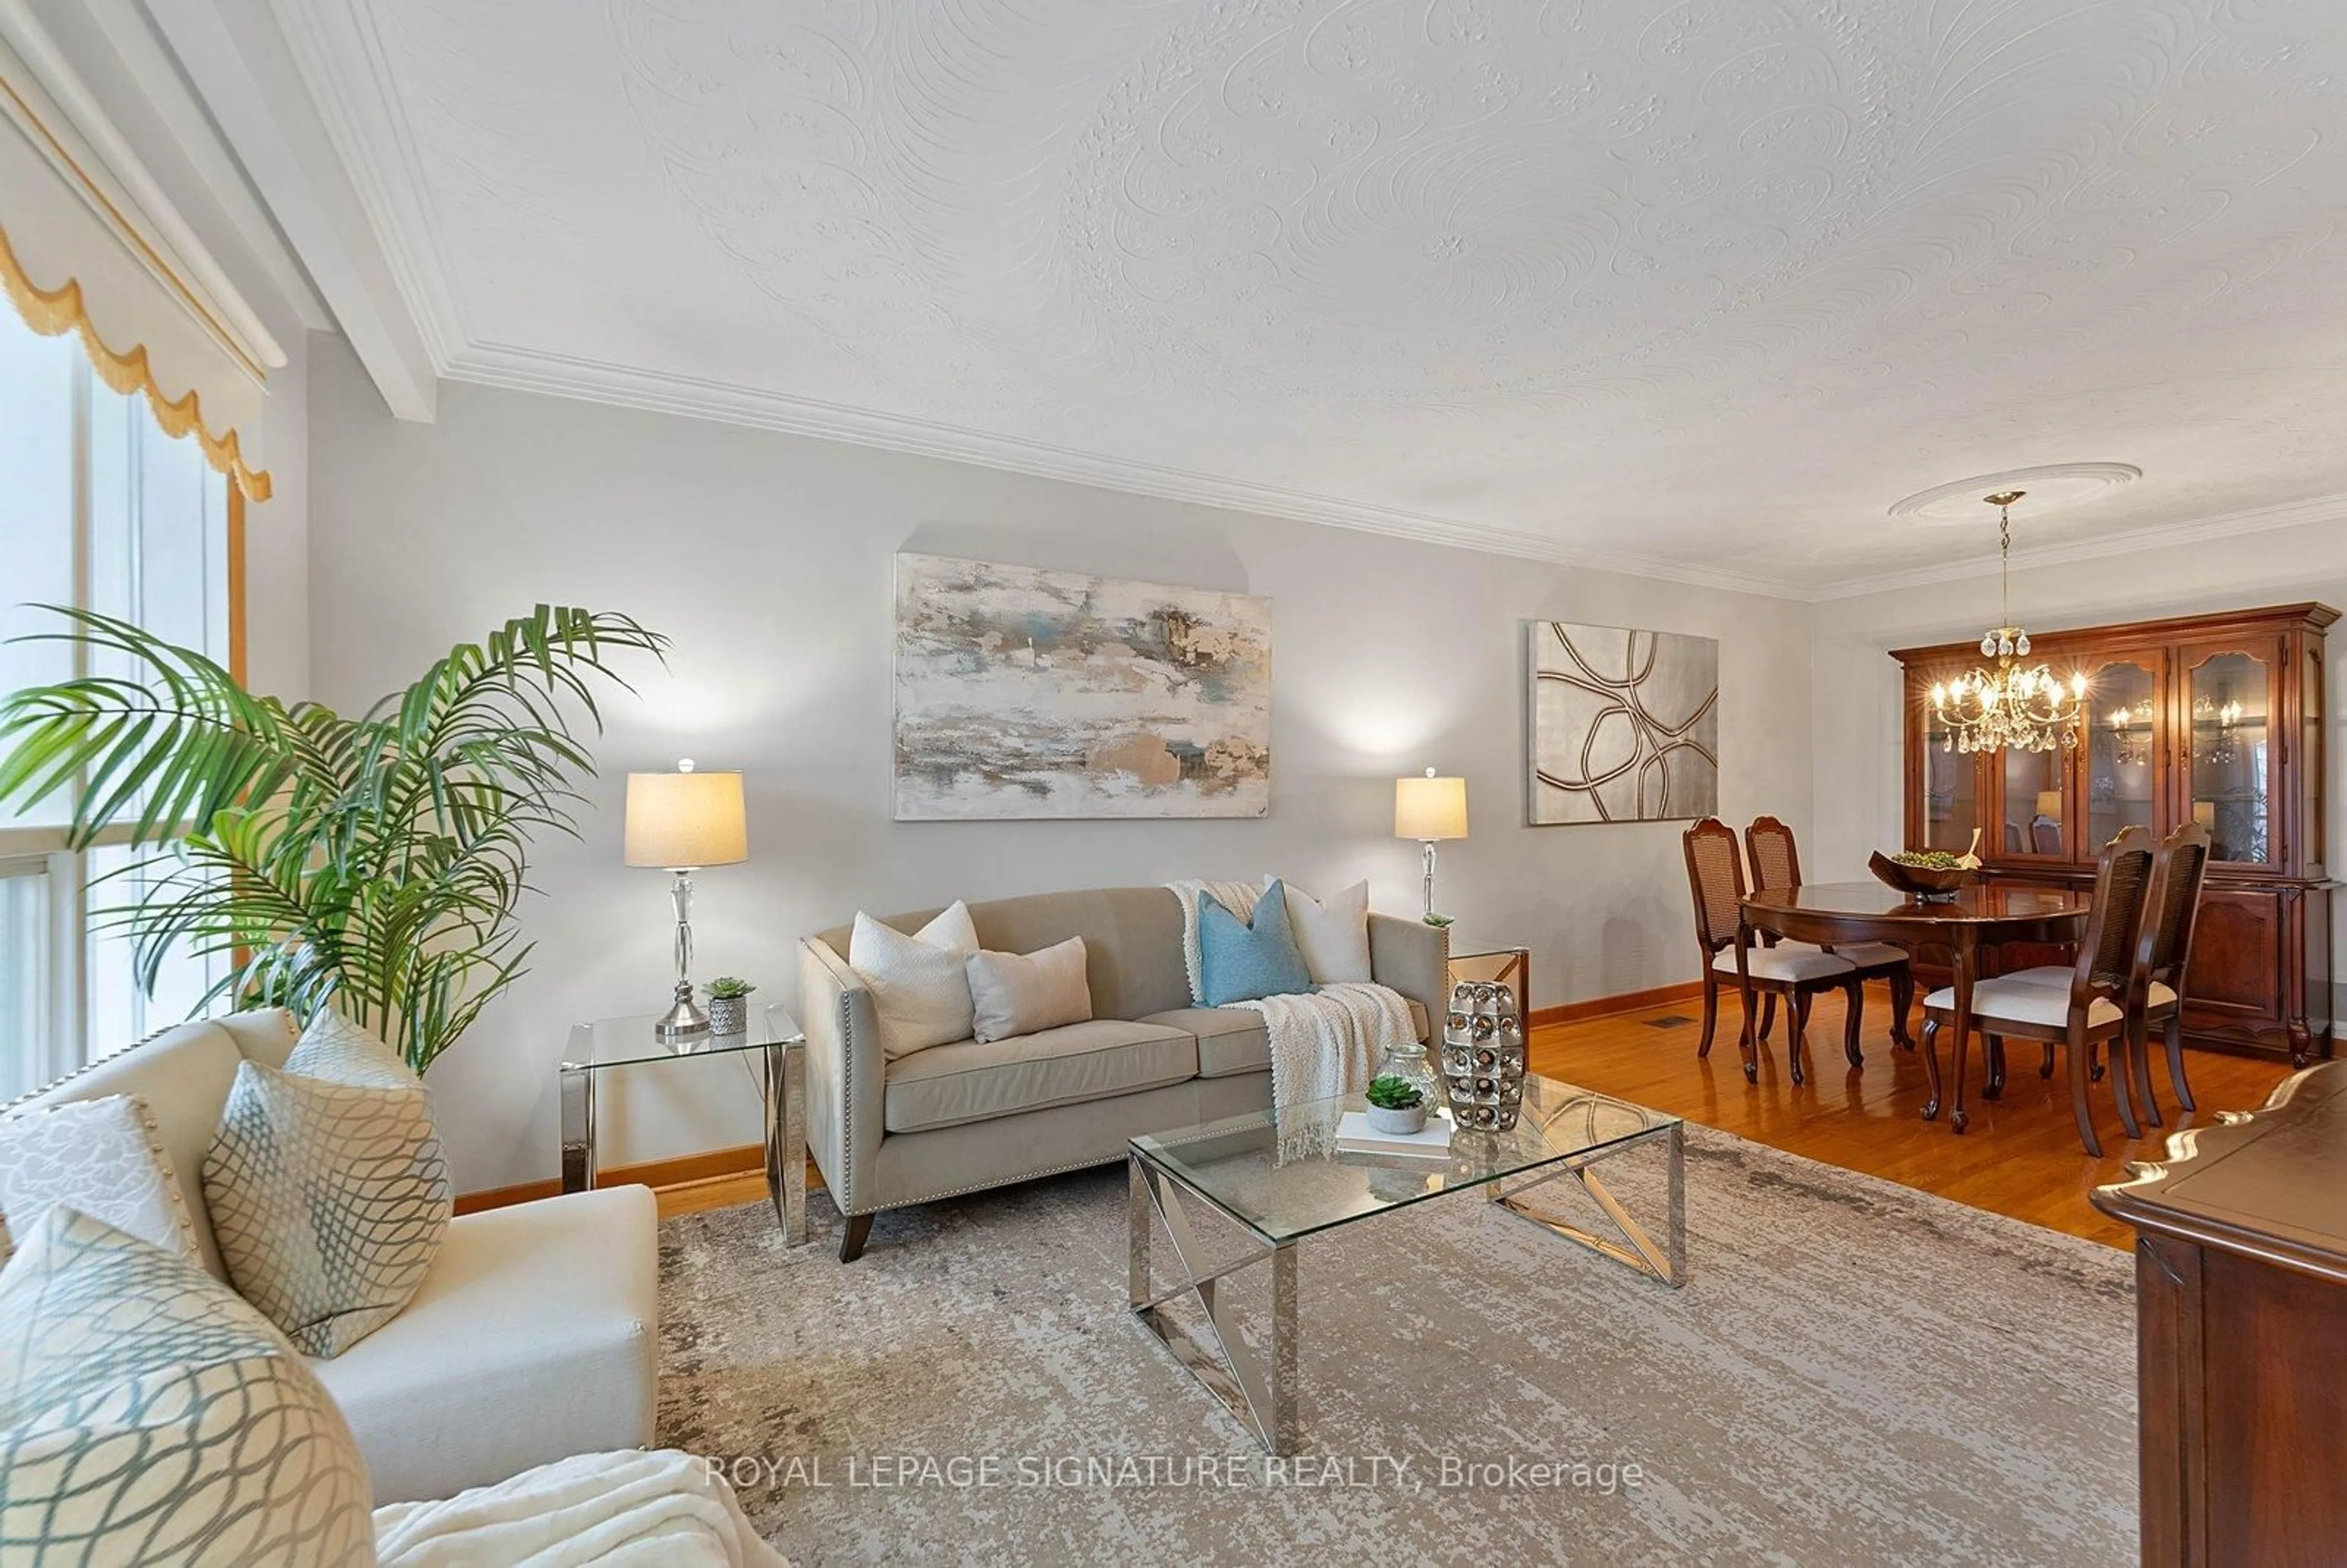
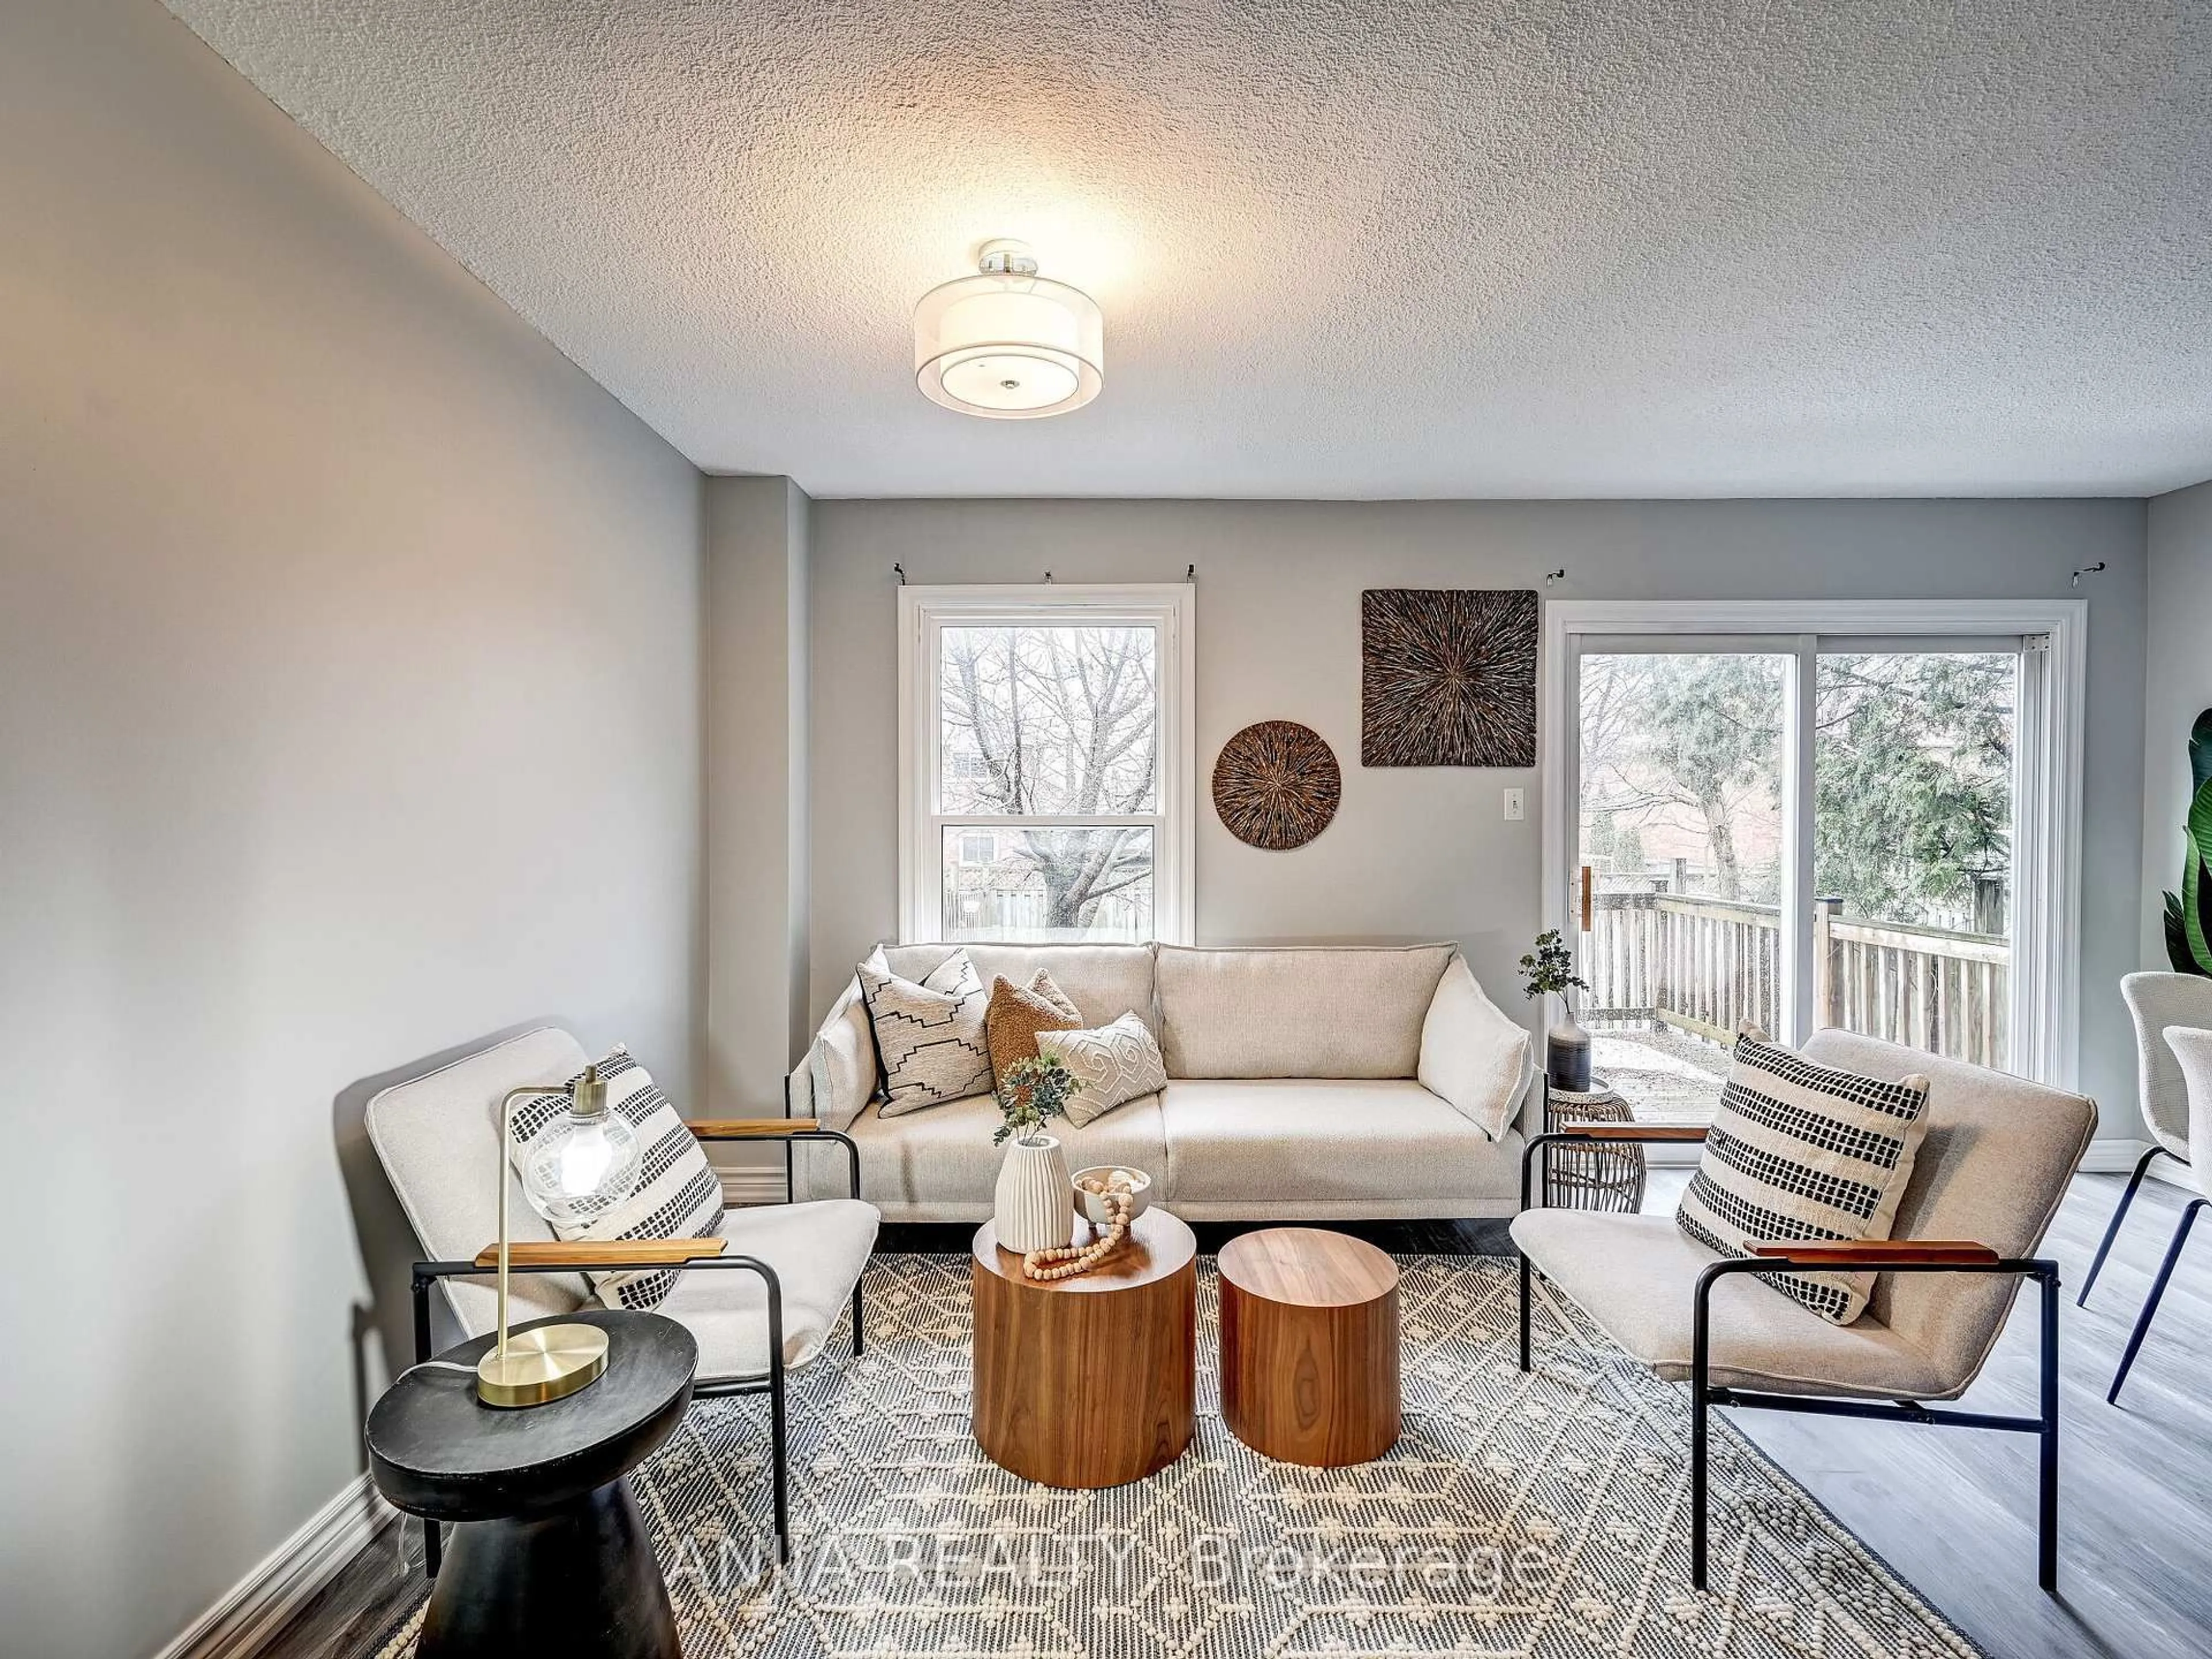
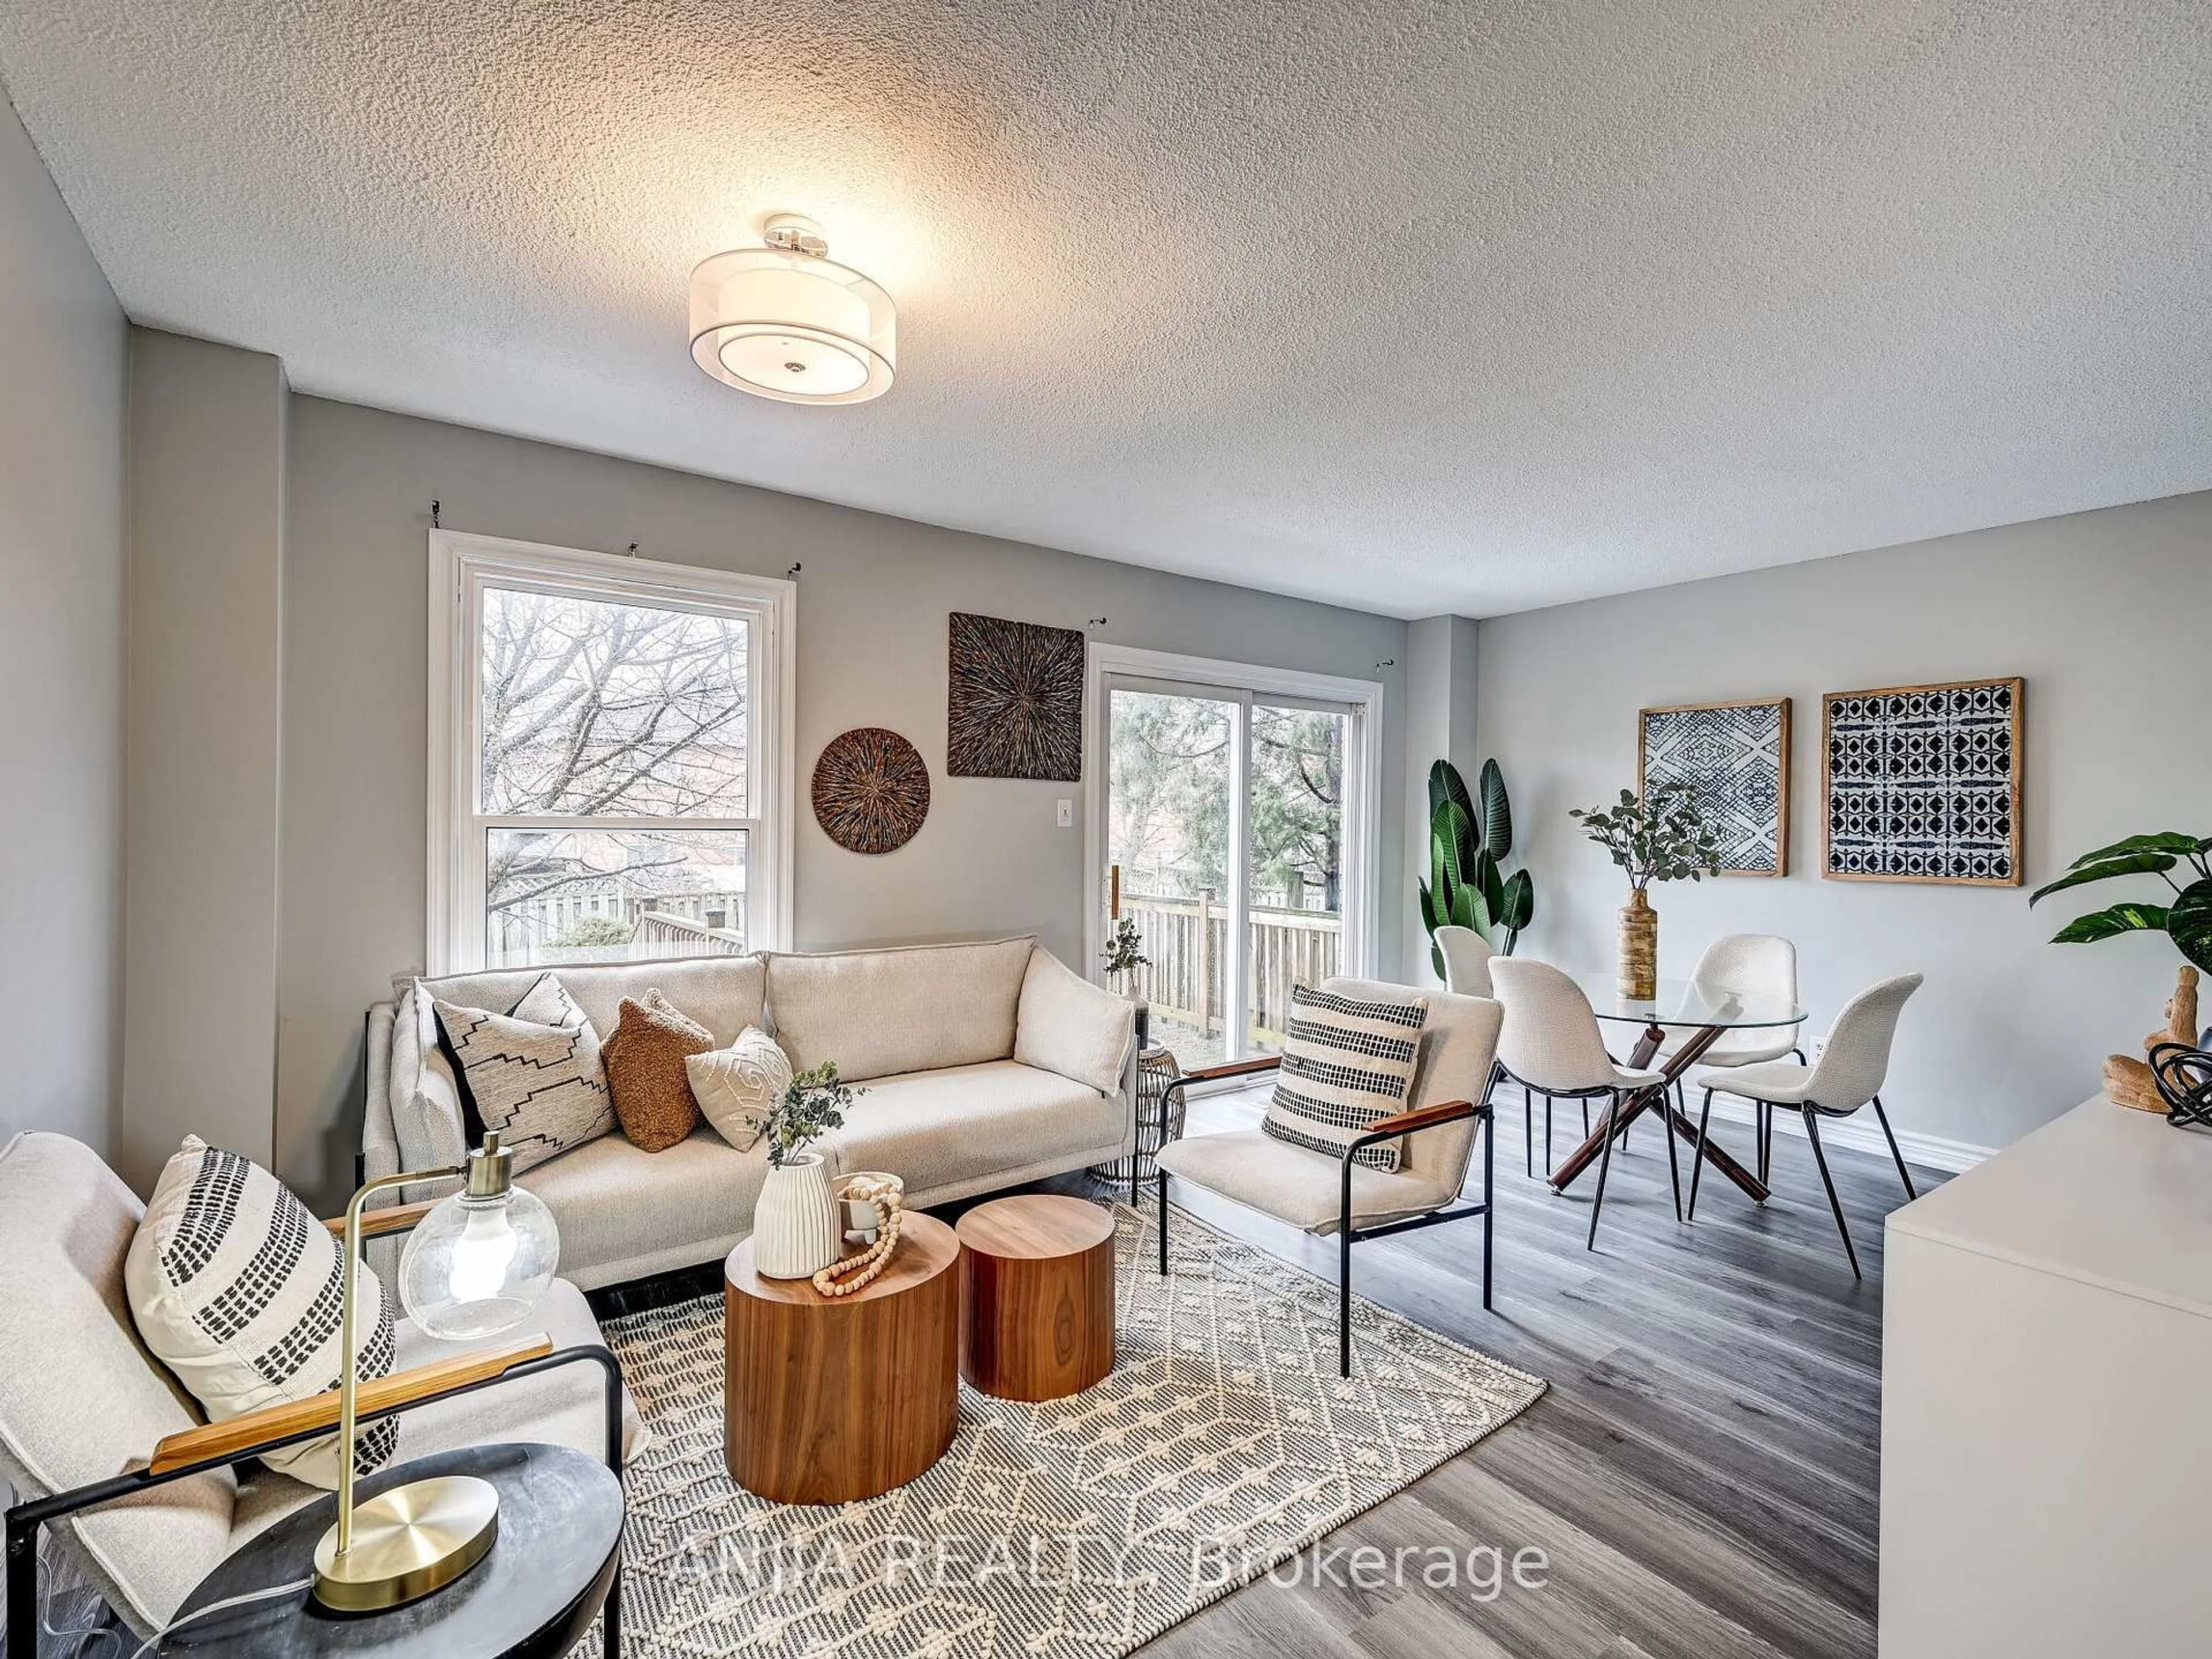
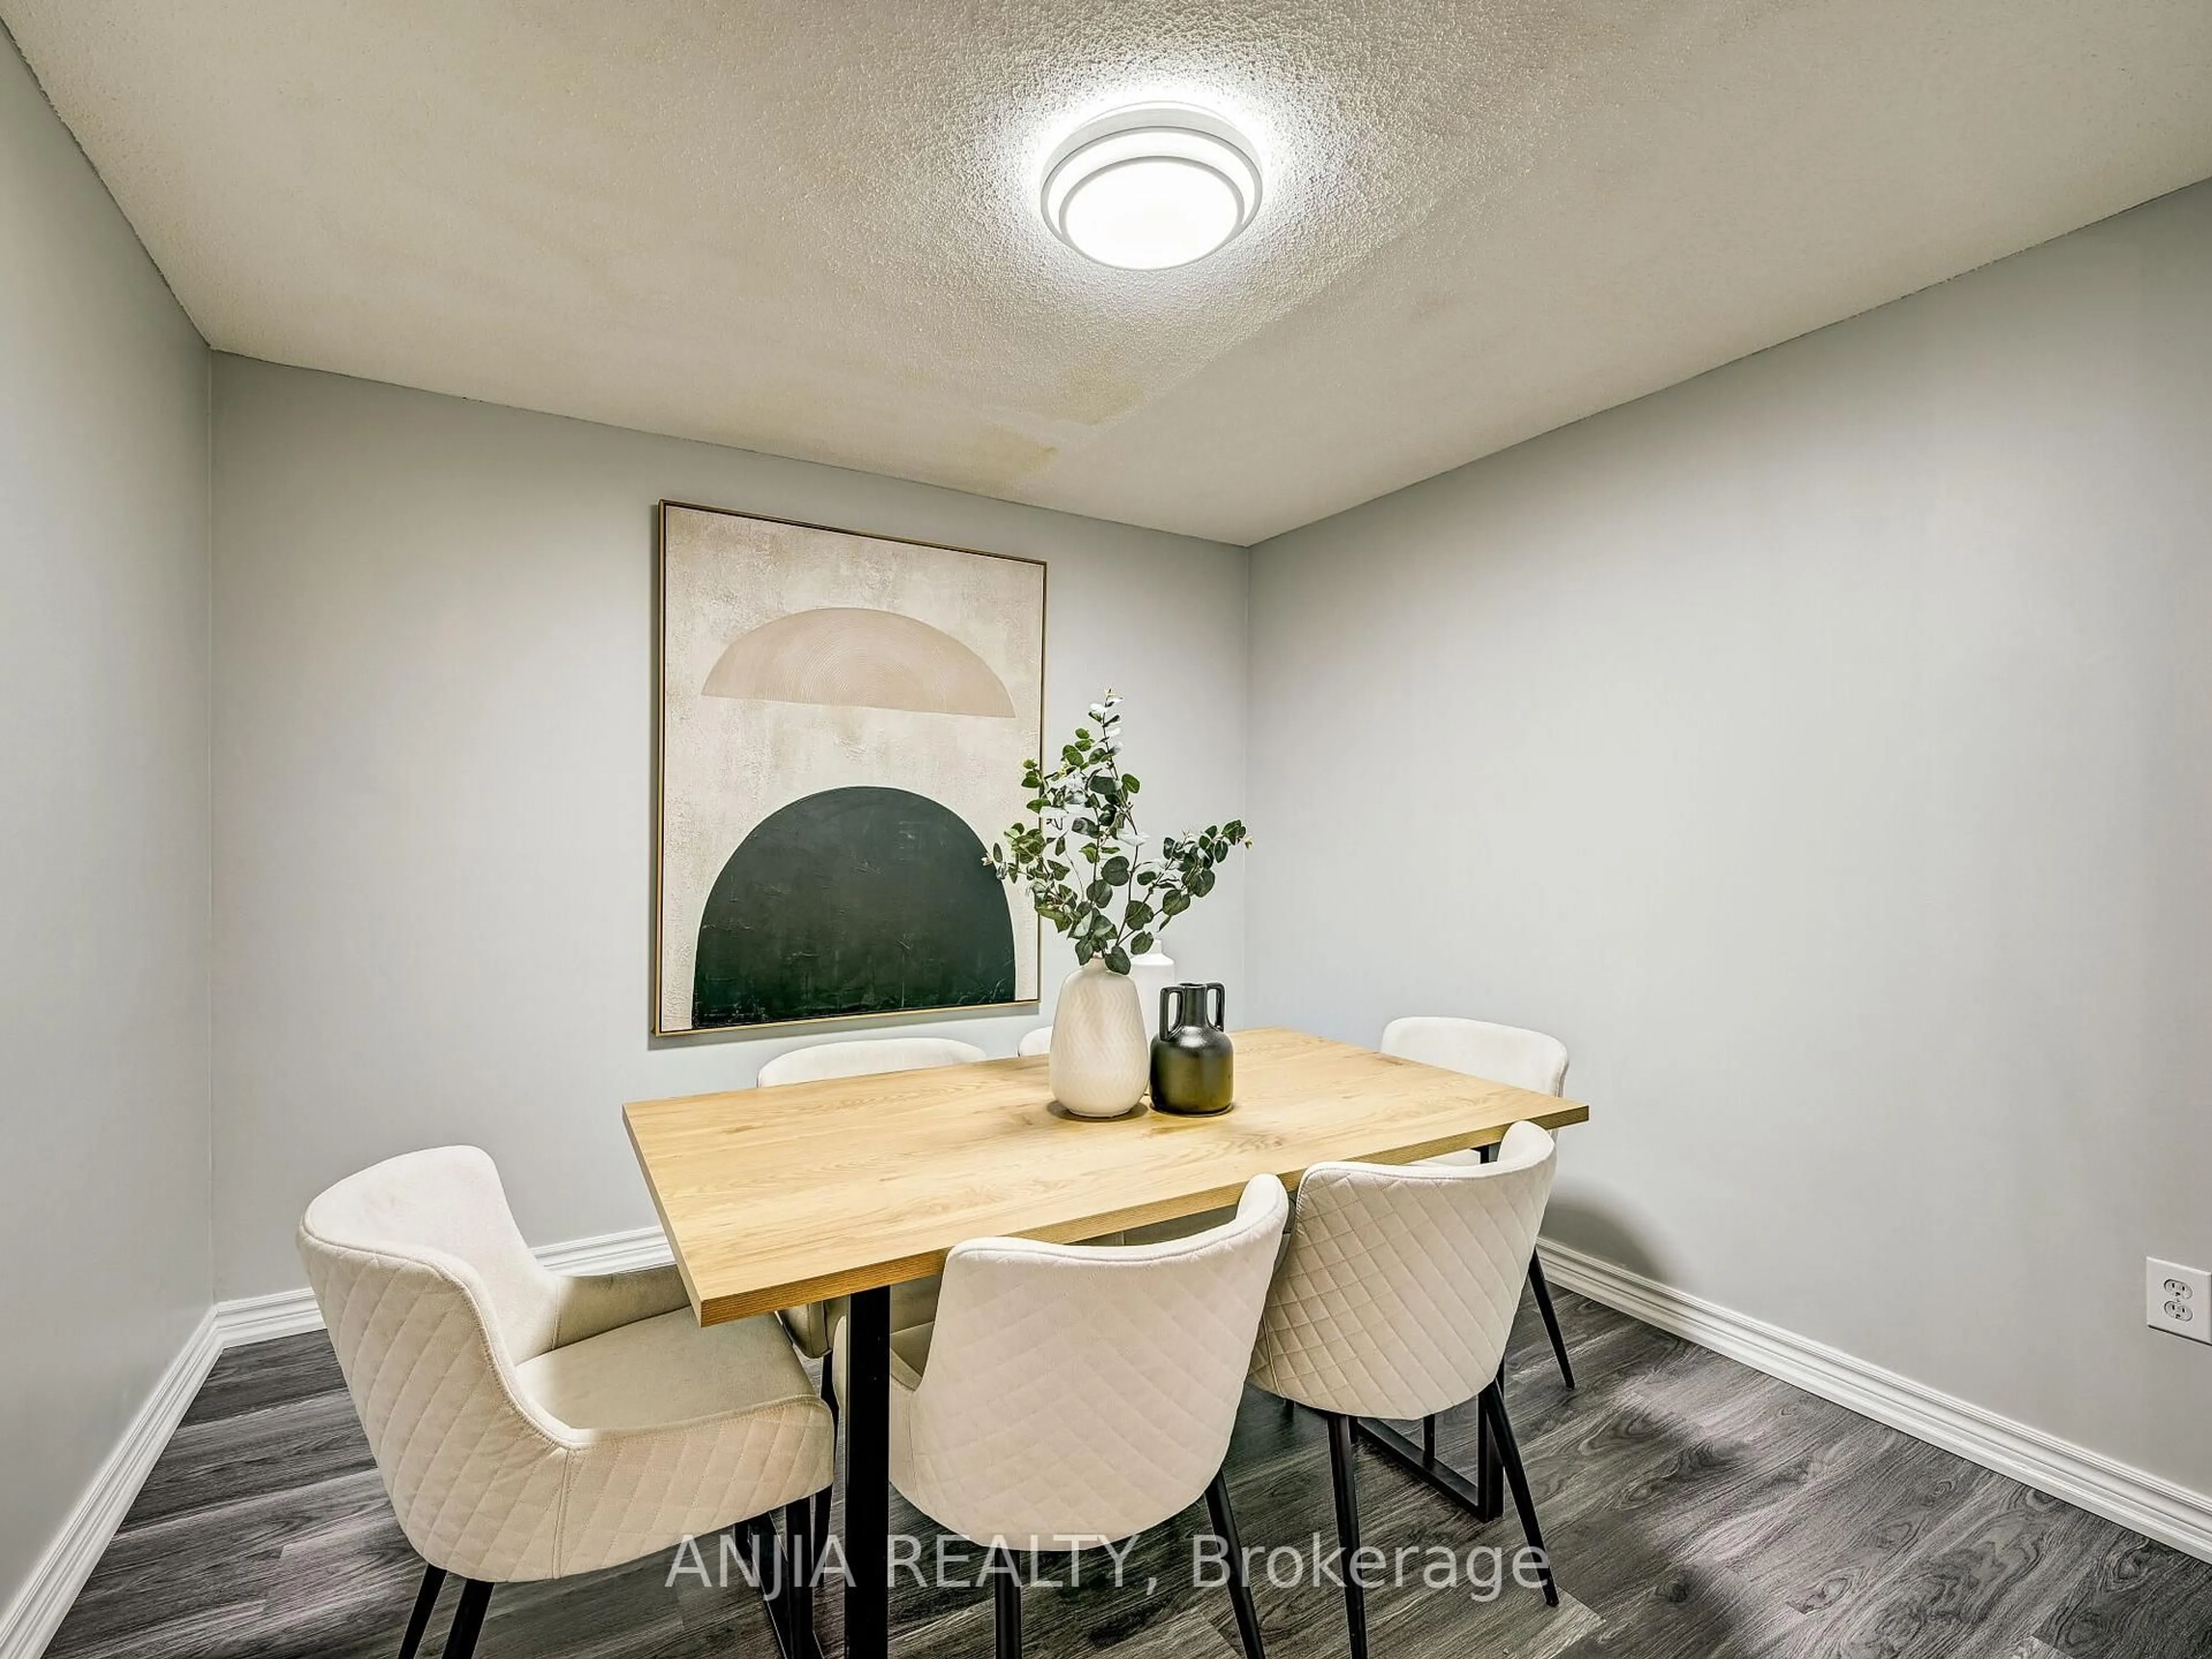
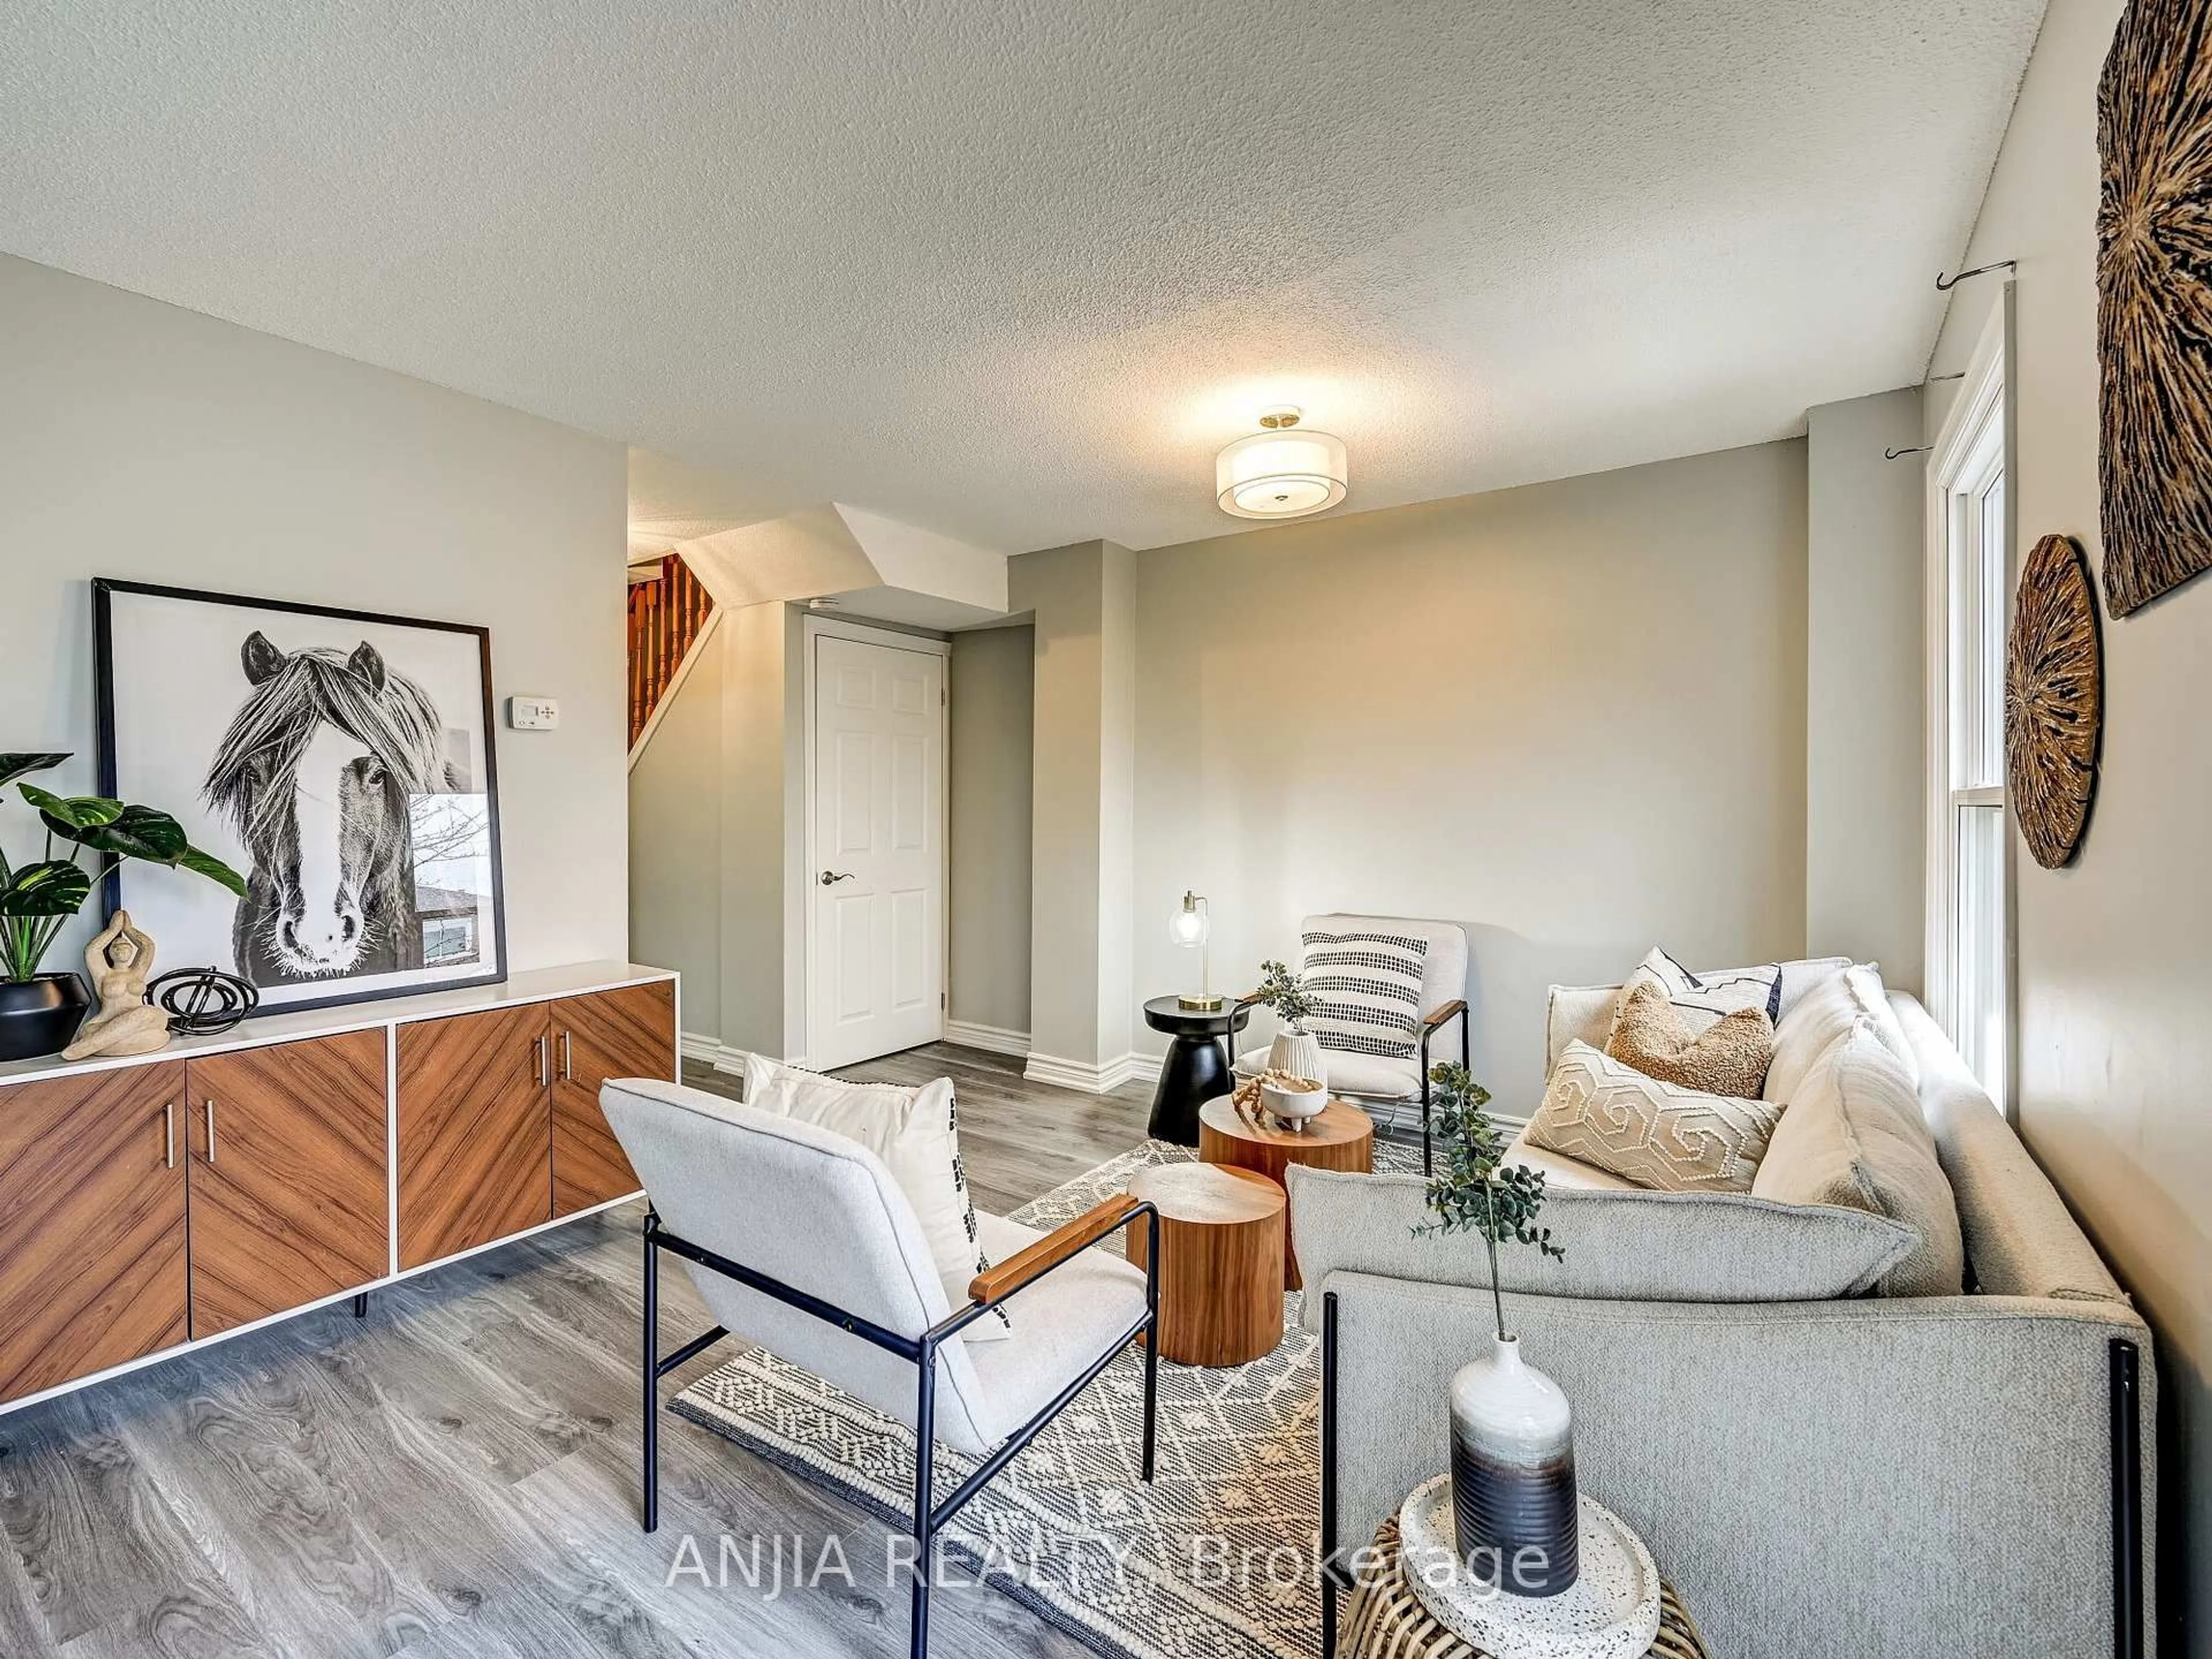
PRICED to SELL! This newly renovated property features 3 bedrooms and 2 full bathrooms, located in a highly sought-after community just steps from top schools (Randall PS, St. FX, MMHS, FMM) and recreation centres. Enjoy easy access to nearby parks and walking trails. The kitchen boasts upgraded quartz countertops, both bathrooms are brand new, and the home includes new flooring along with numerous additional upgrades throughout. The renovated basement offers a fantastic space for living or entertaining.Photos have been virtually staged
Property Details
Interior
Features
Exterior
Features
Parking
Garage spaces -
Garage type -
Total parking spaces 4
Property History
 22
22