Home with brick exterior material, street for 51 Campania Cres, Toronto Ontario M1V 2E8

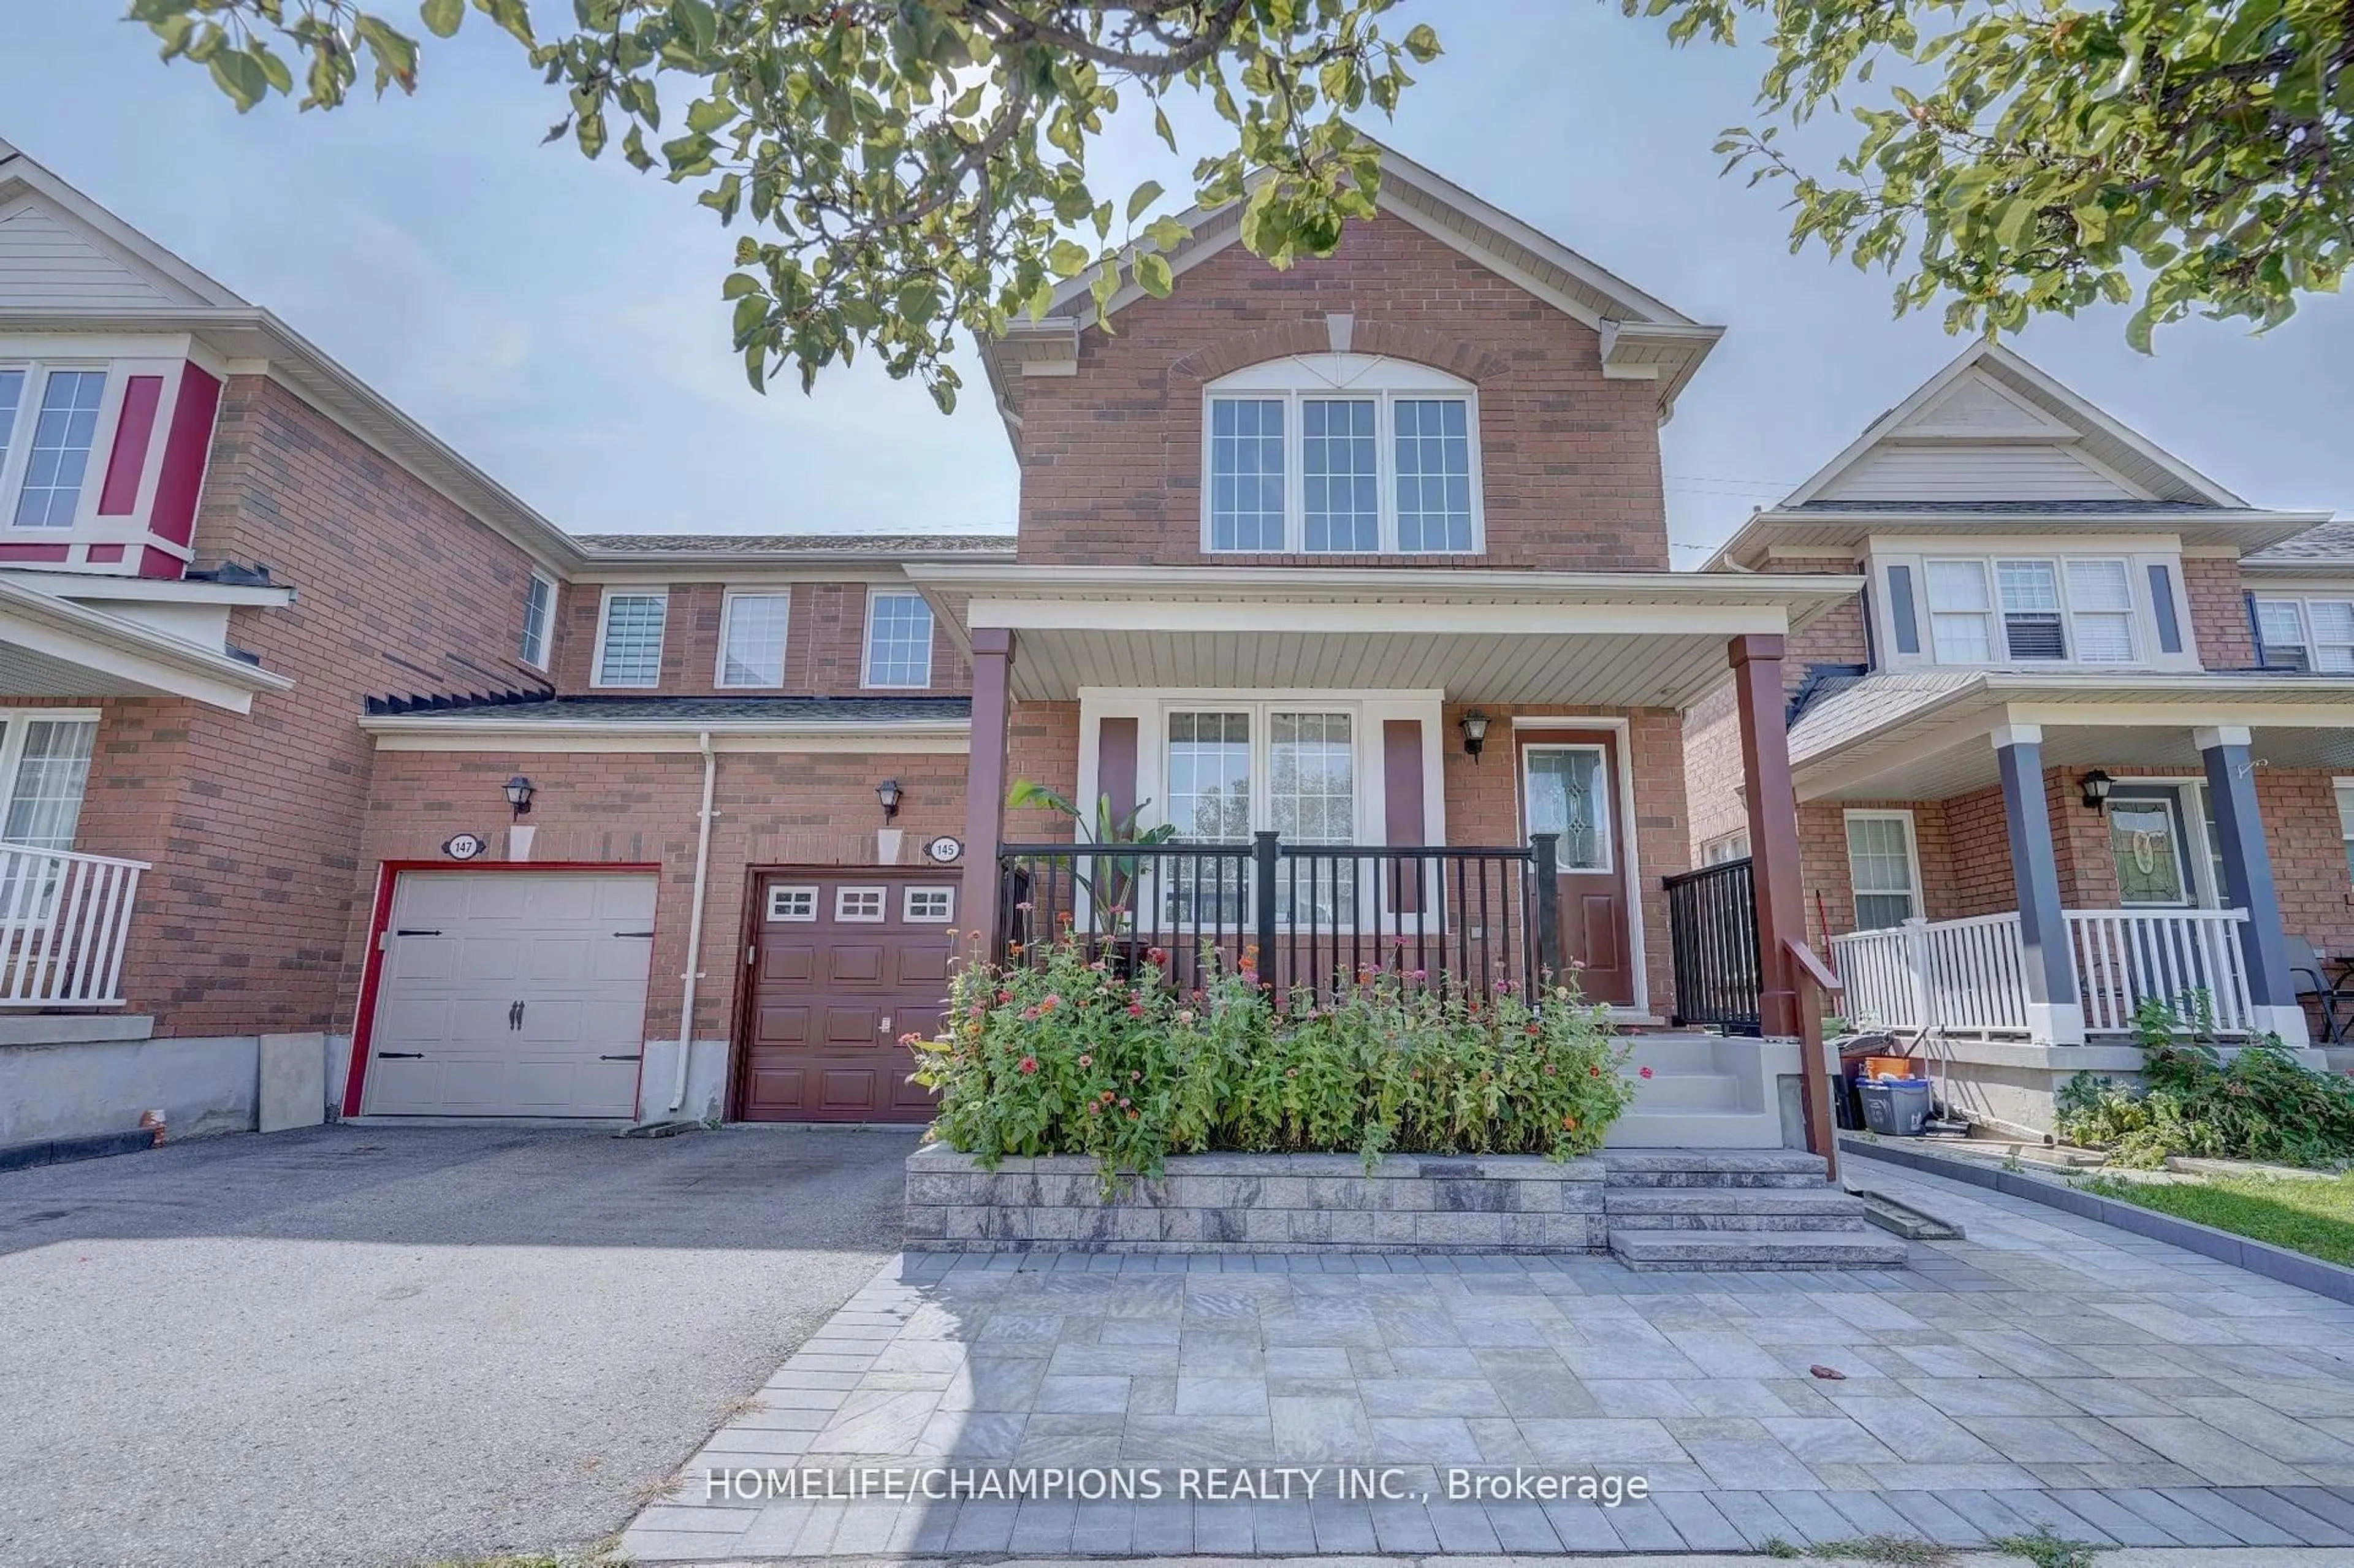
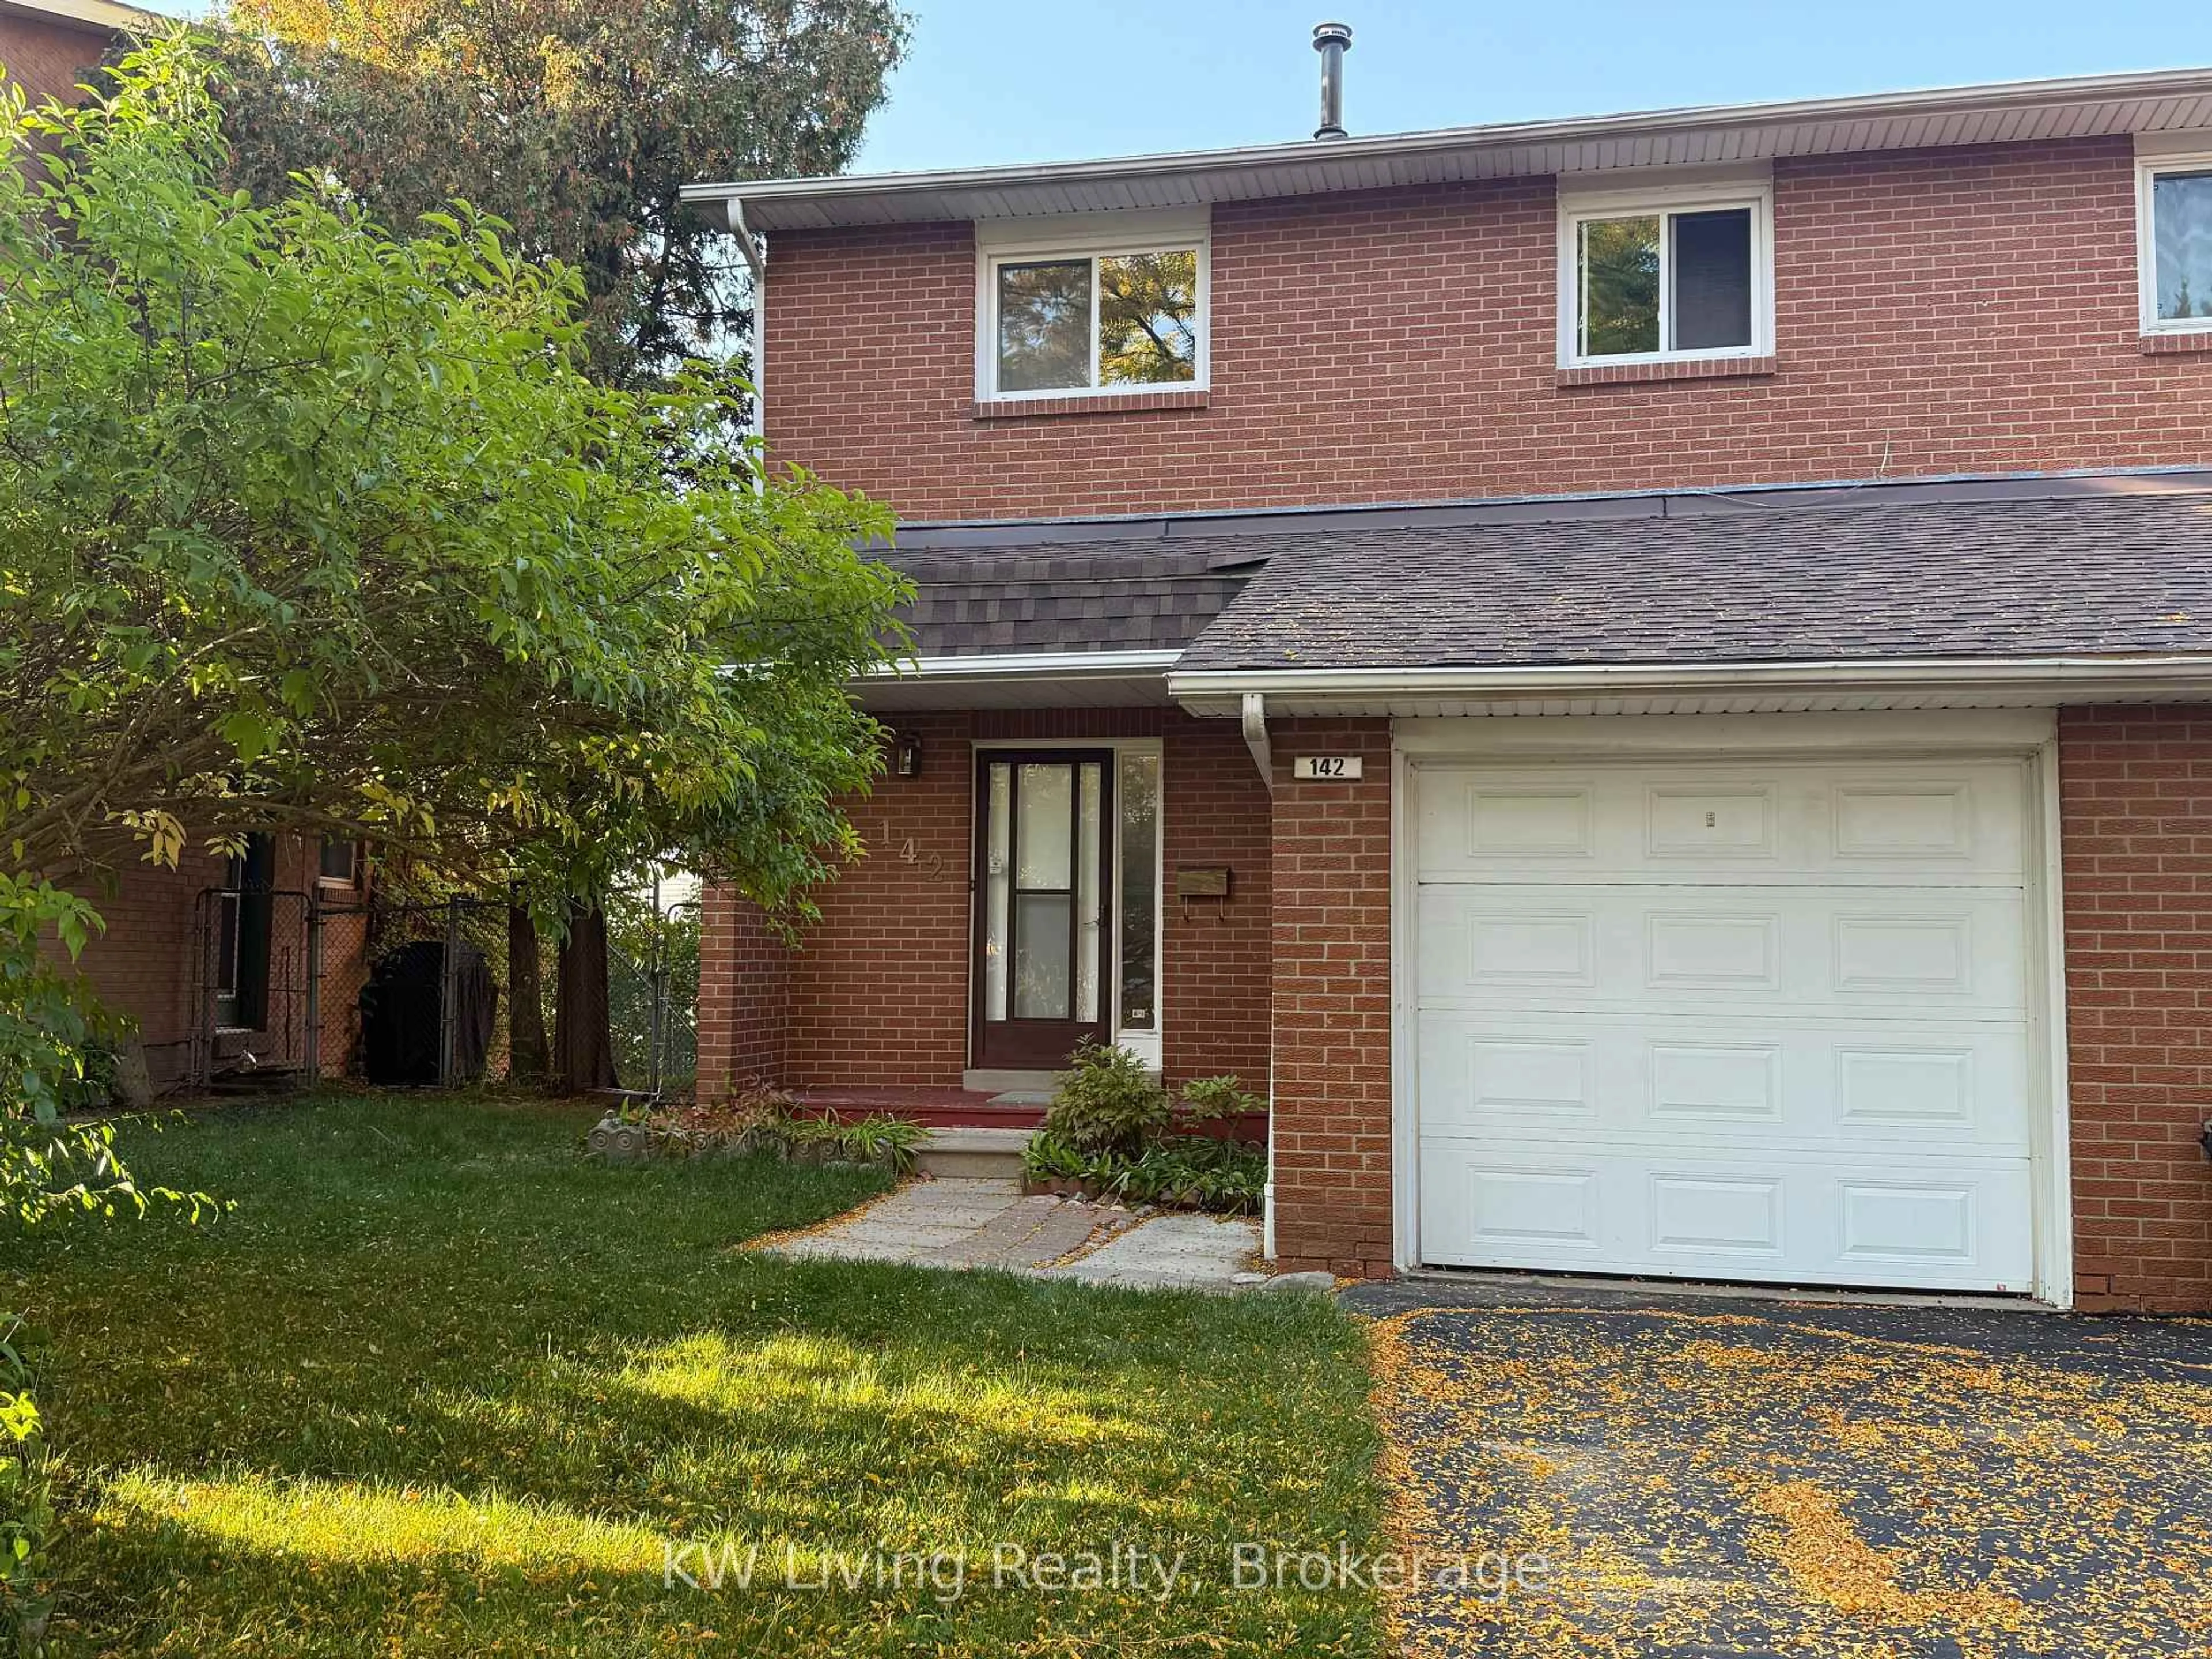
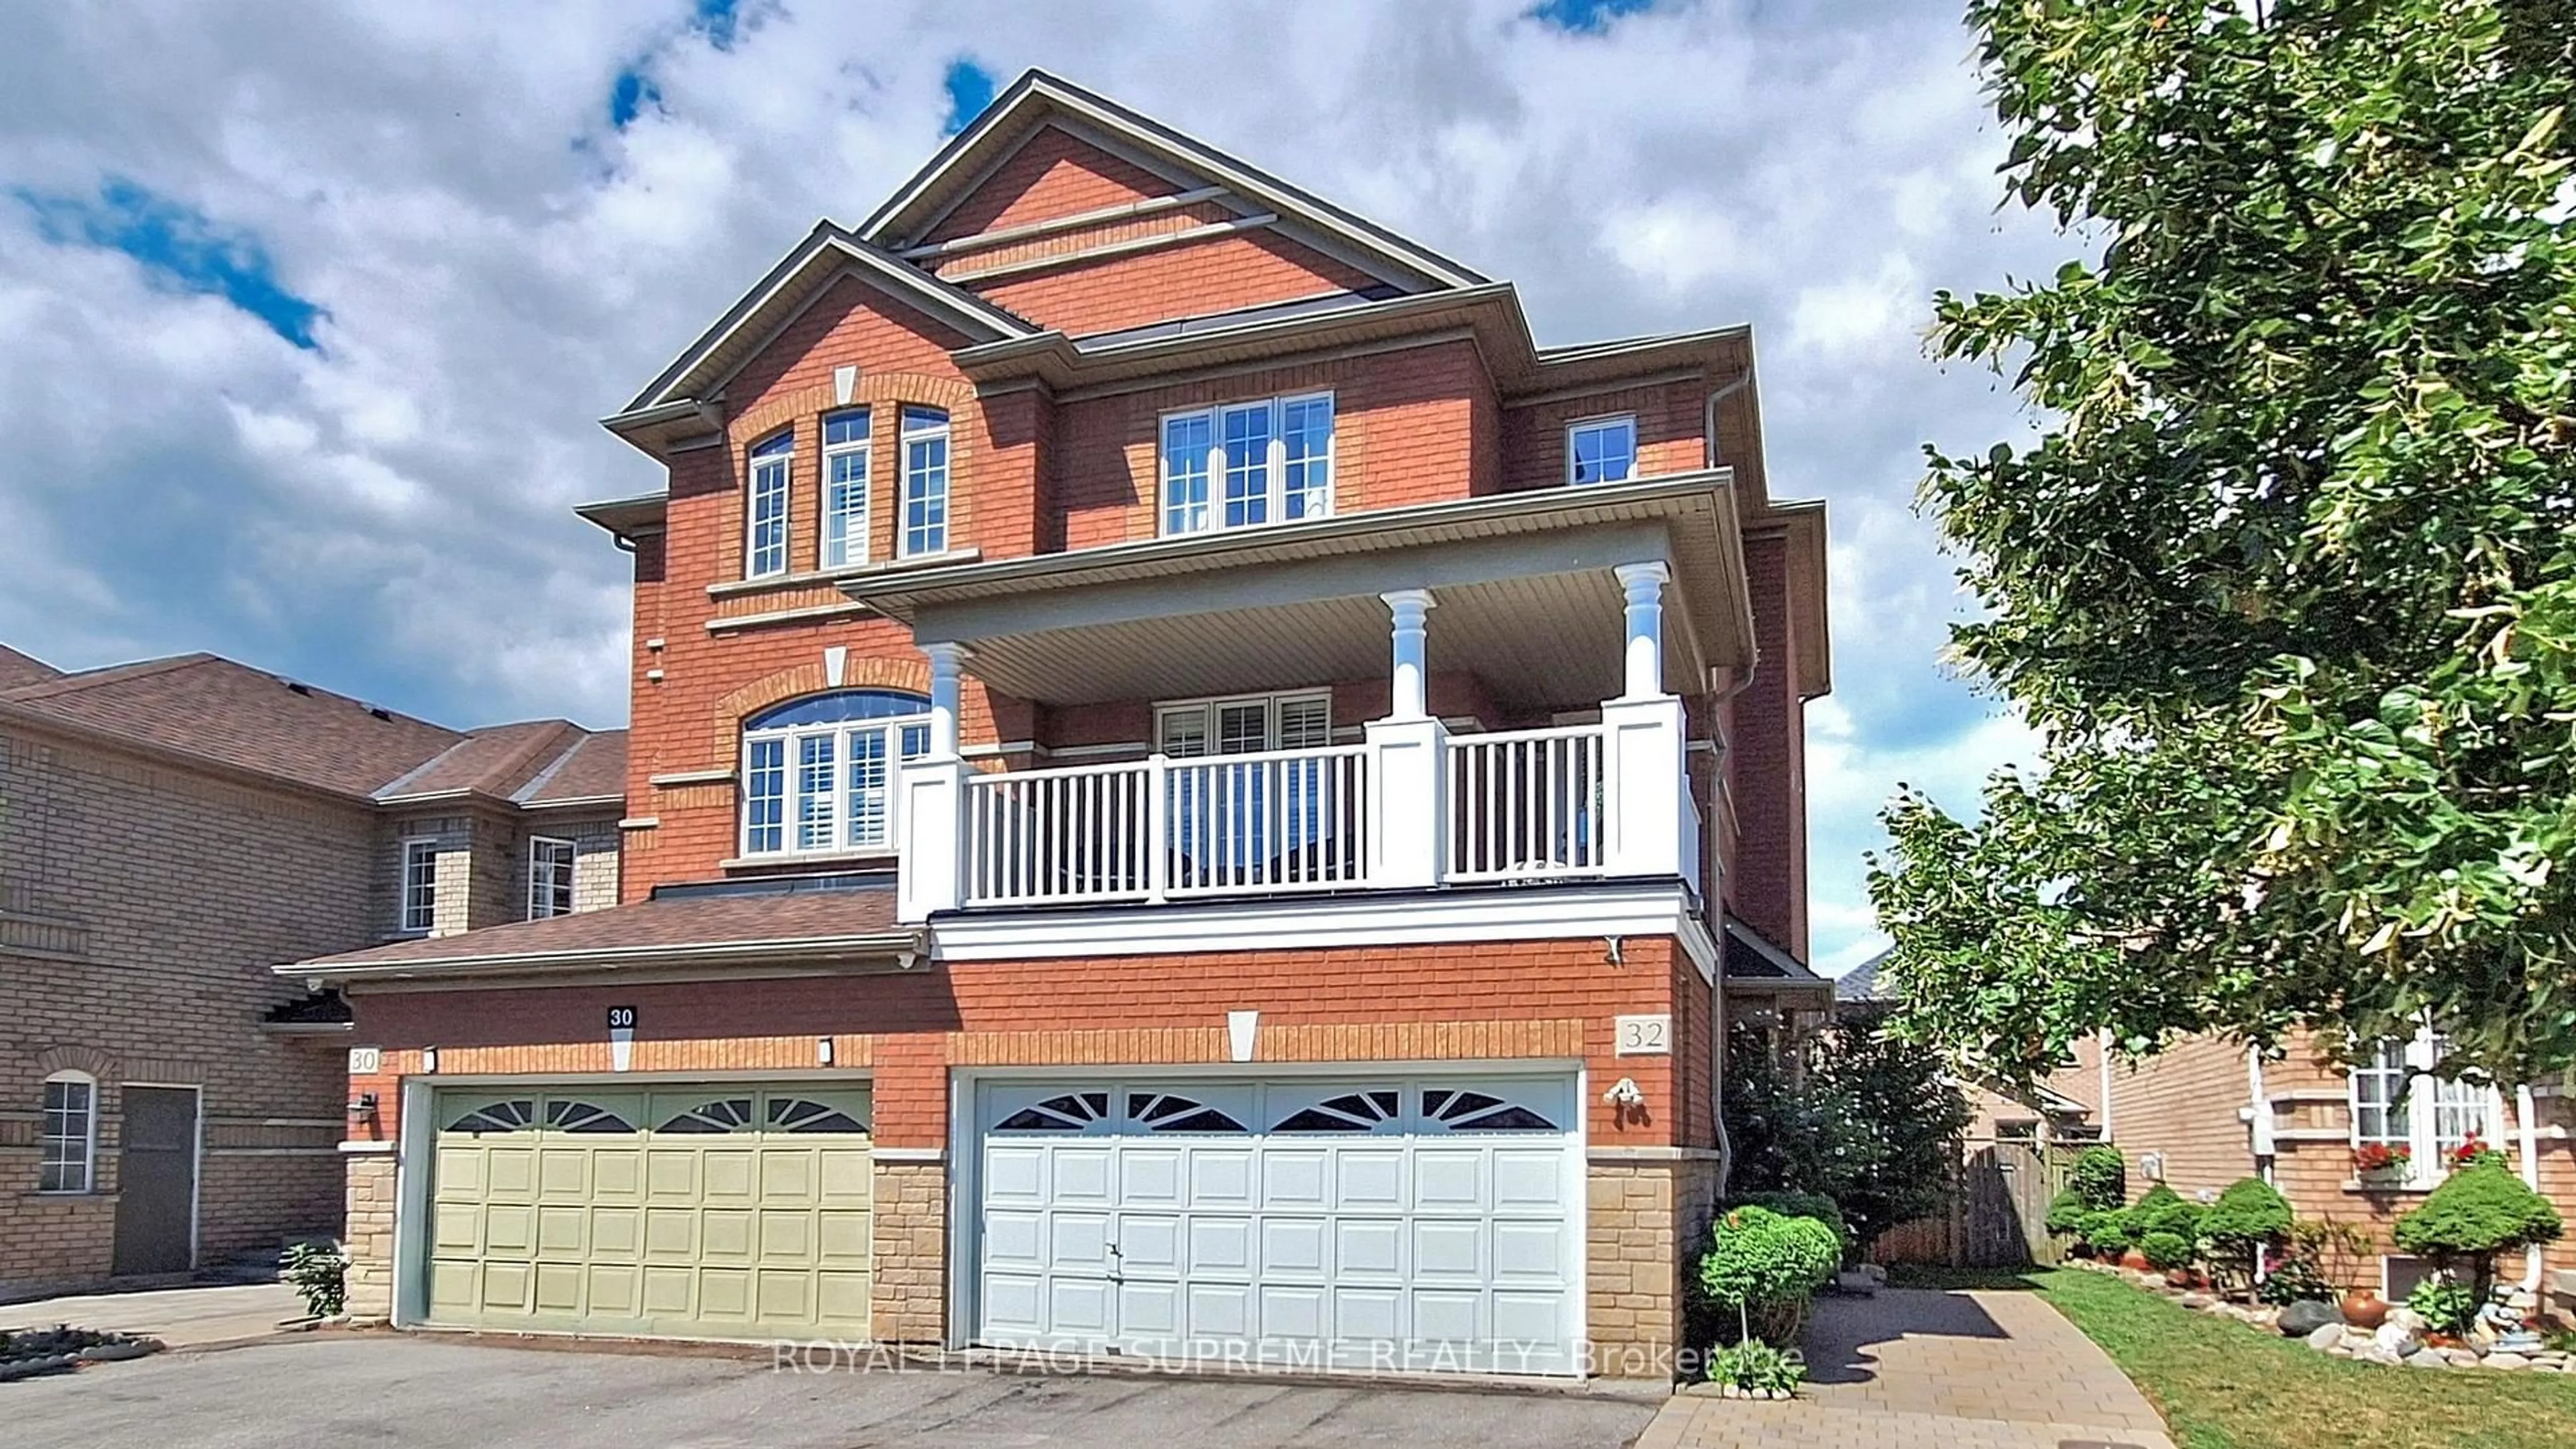
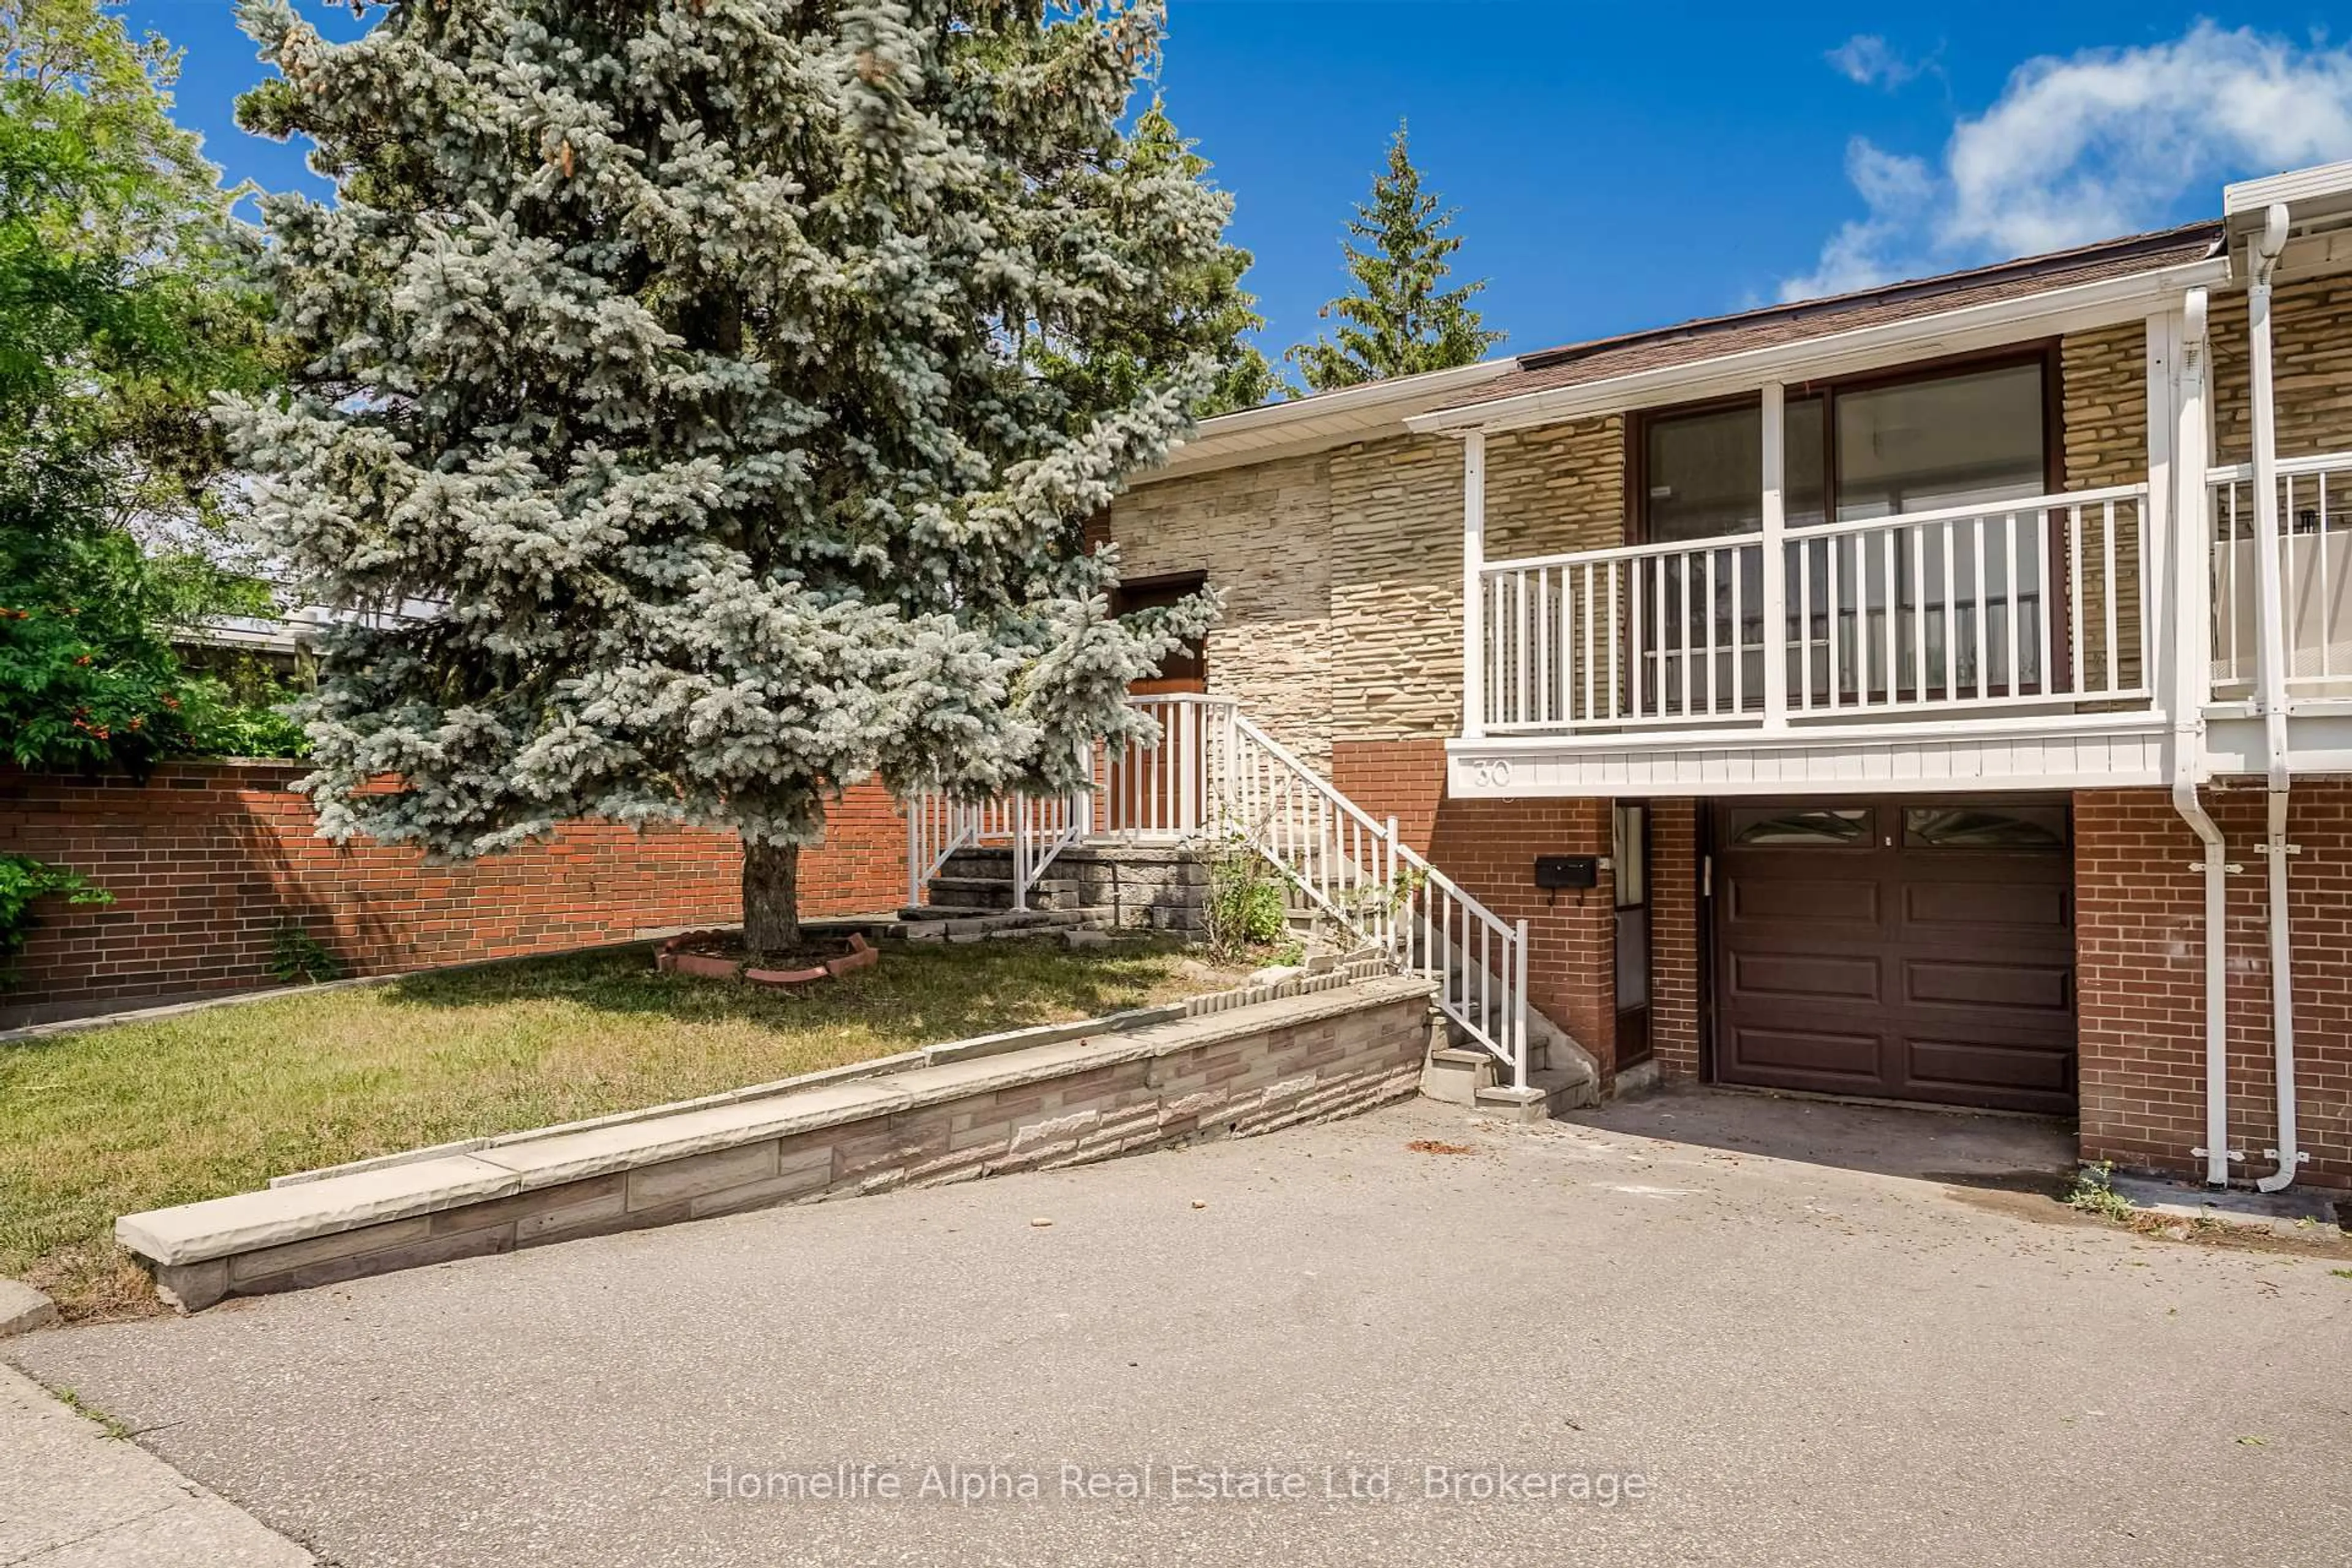
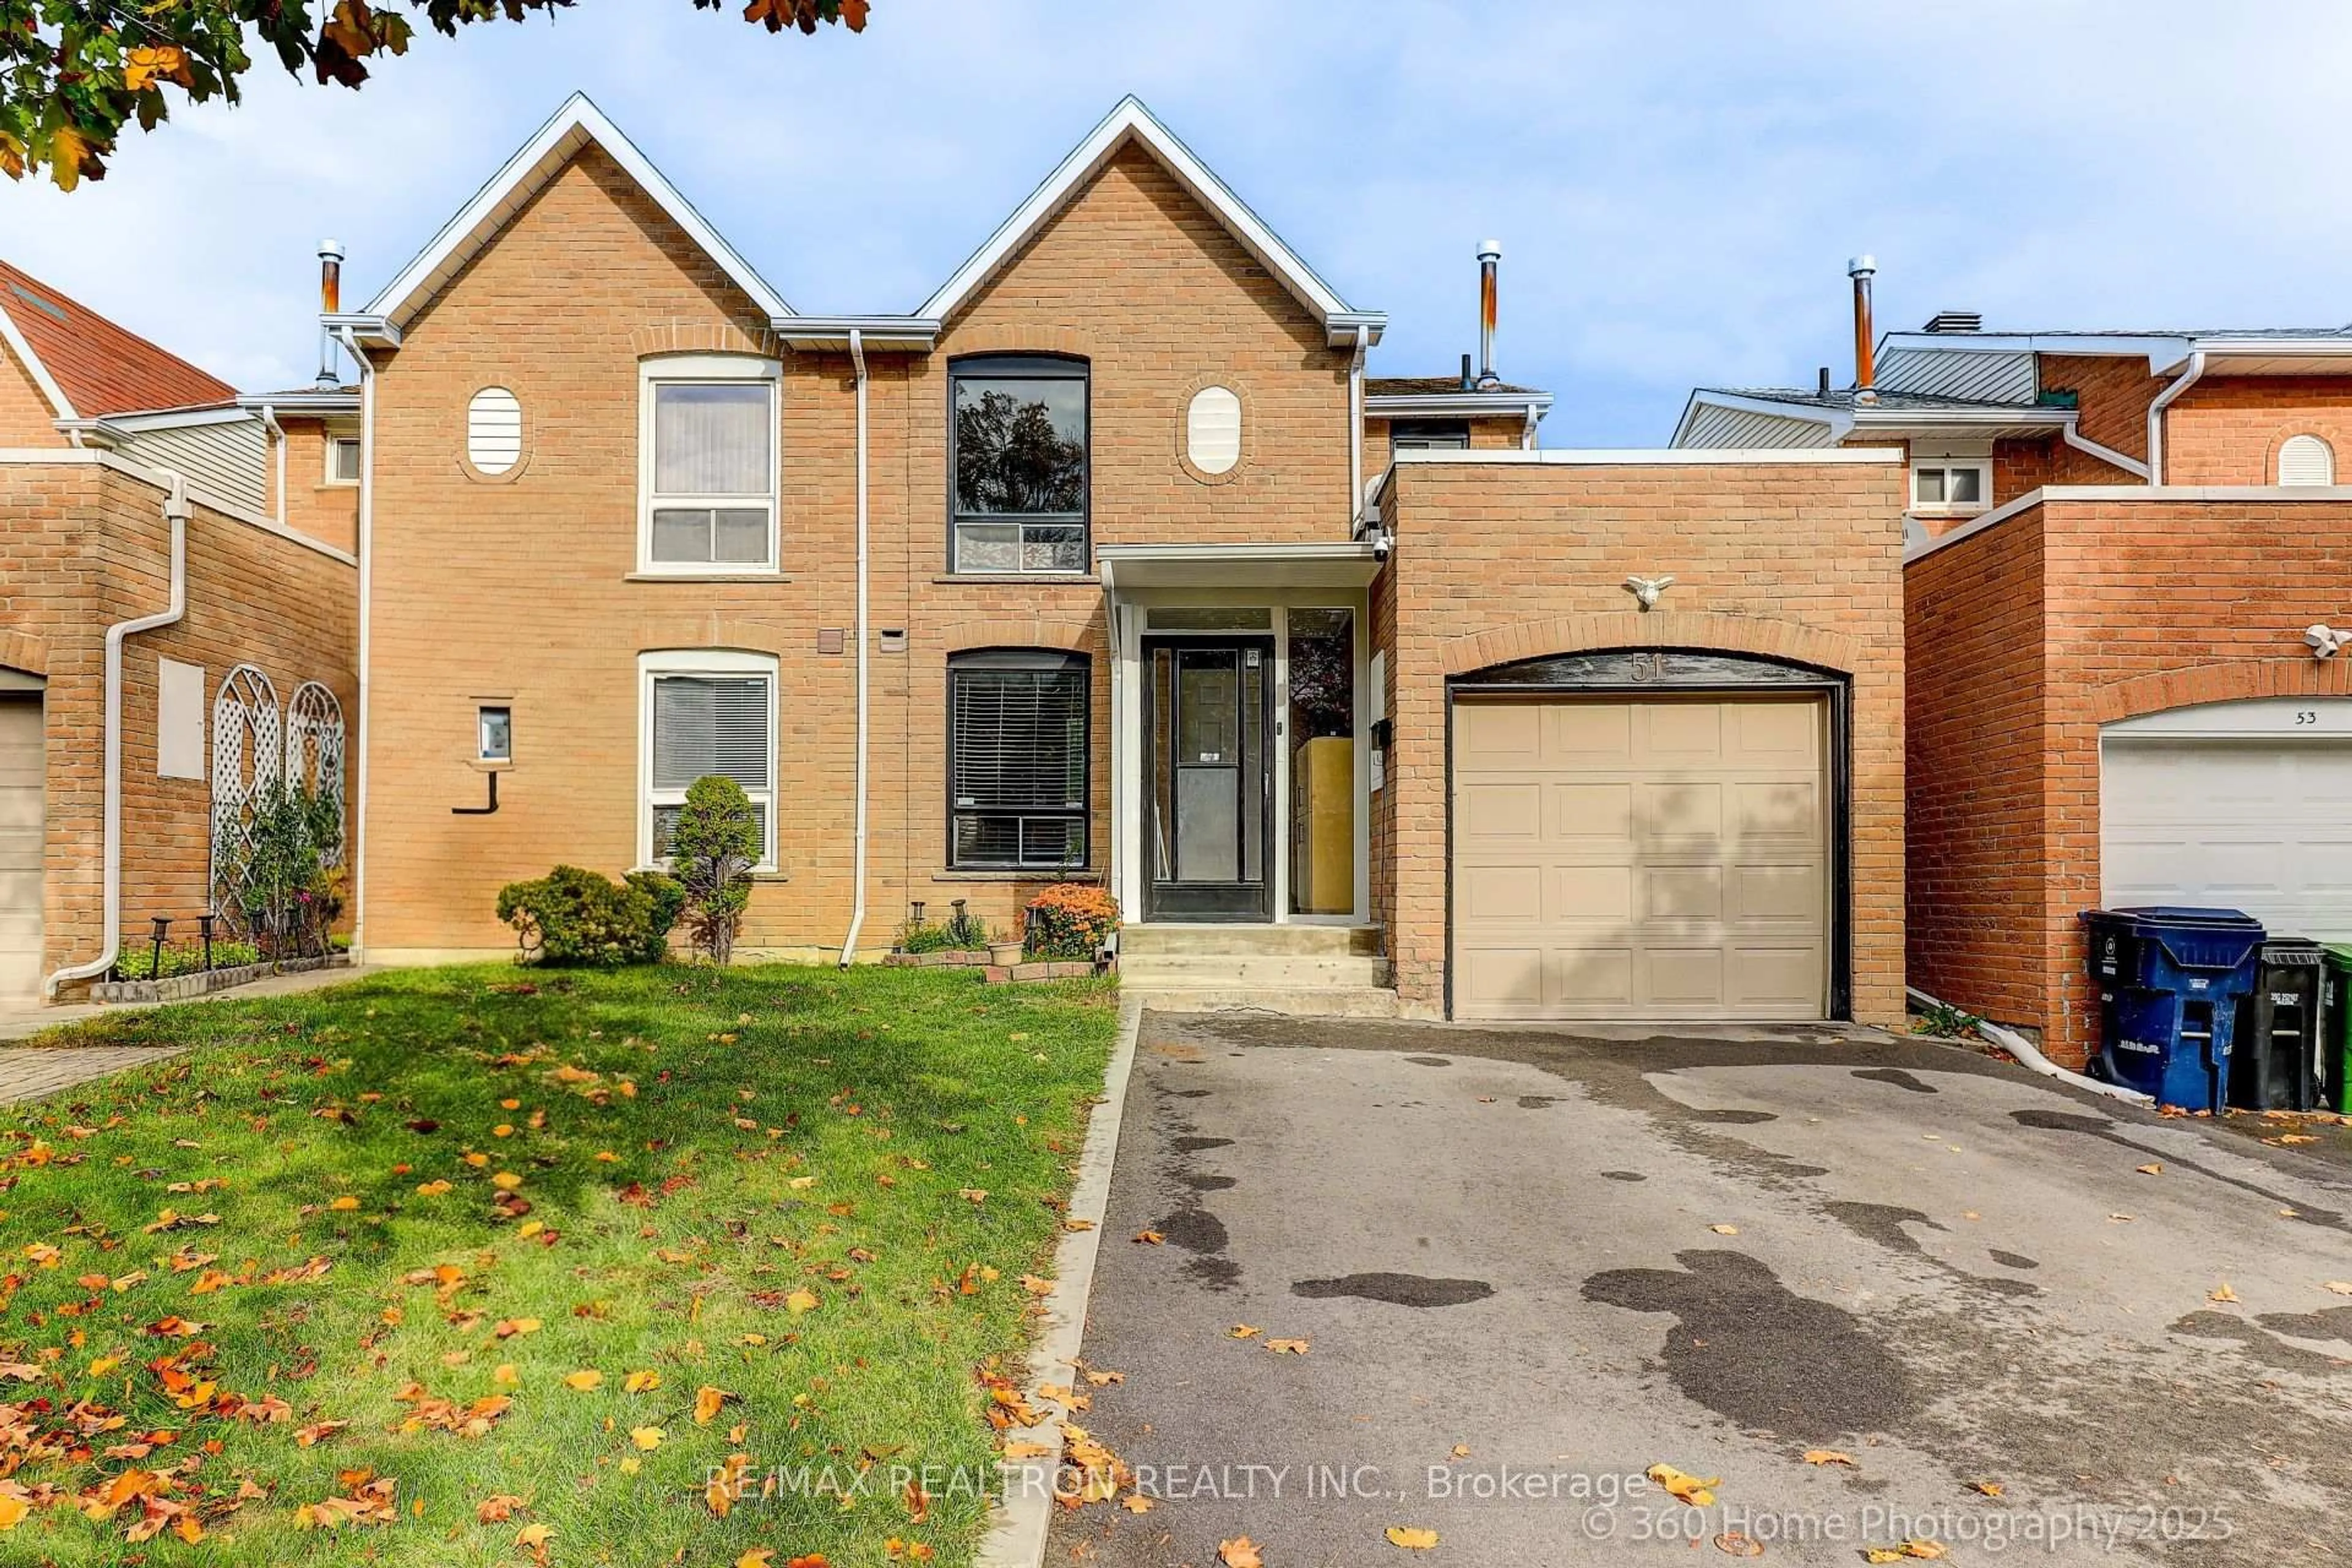
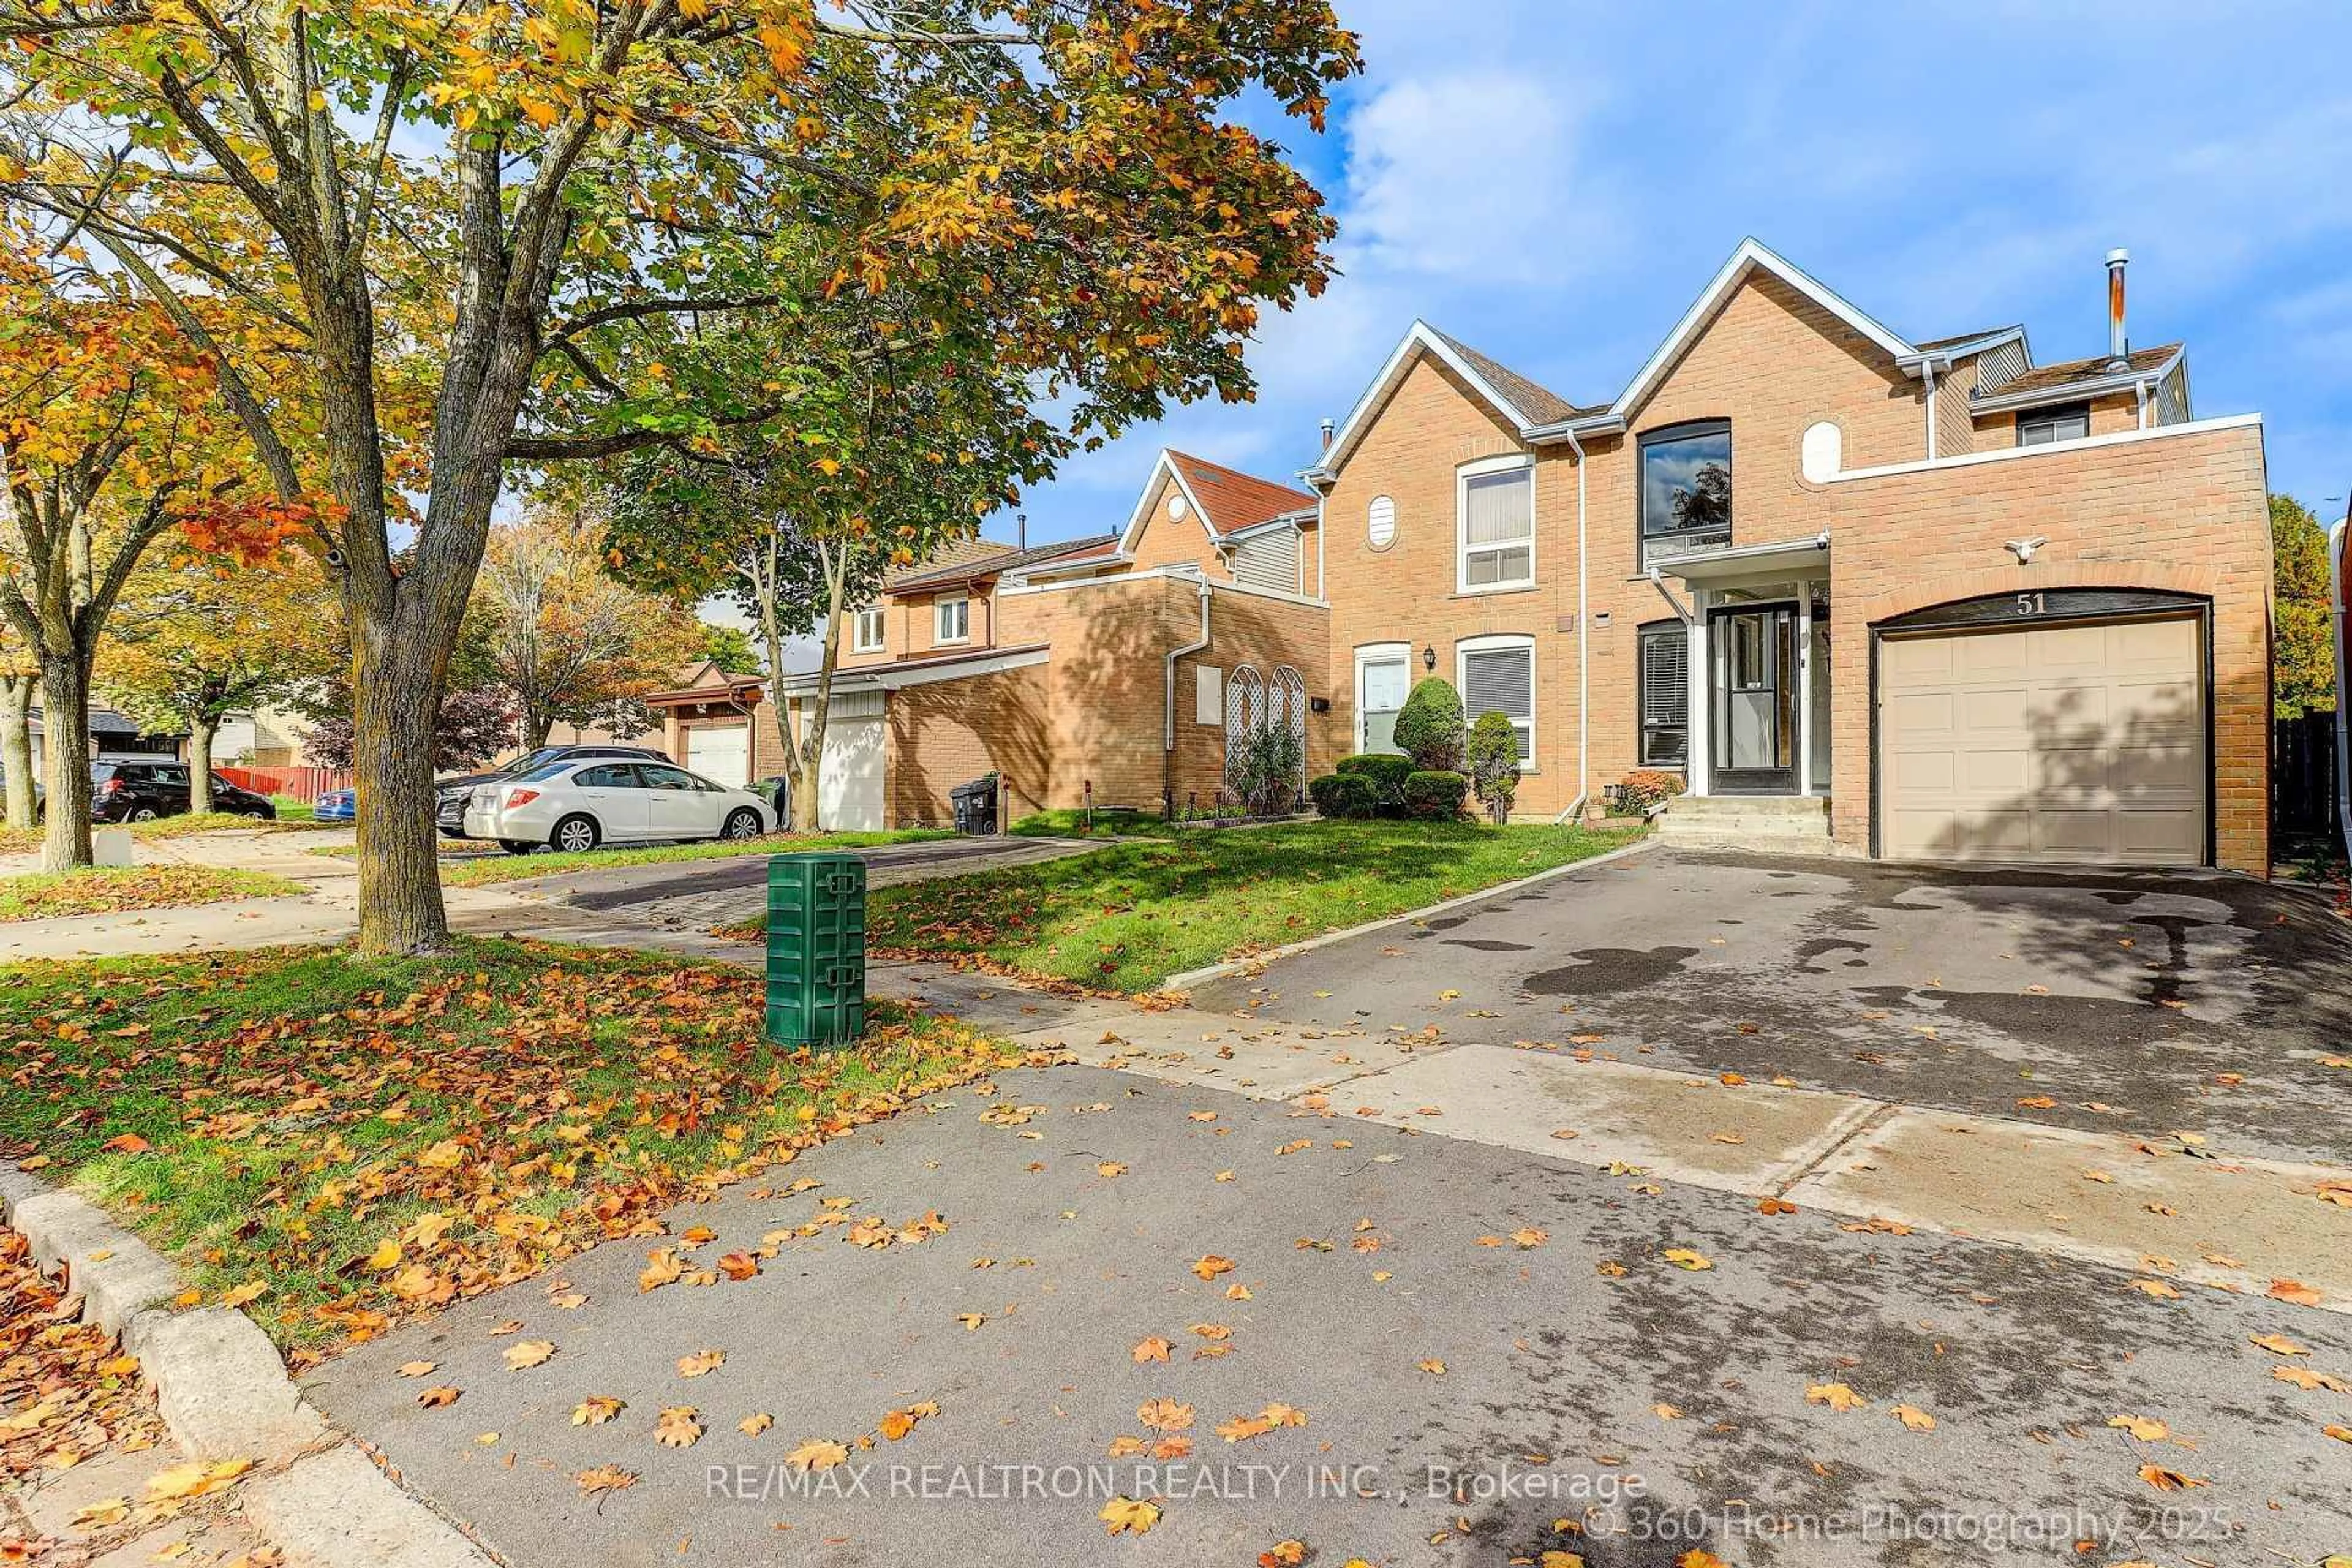
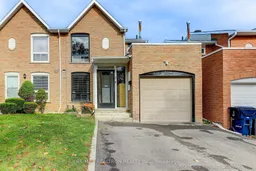
51 Campania Cres, Toronto, Ontario M1V 2E8

Semi-Detached
3 + 1
4
~1100-1500 sqft
$1,118,000
Get pre-qualifiedPowered by nesto
Buy with Wahi to get
Up to
$11,180Cashback
Semi-Detached
3 + 1
4
~1100-1500 sqft

Contact us about this property

Call

Highlights

Property Estimate

Estimated valueNot available

Price/Sqft$881/sqft

Monthly cost

Open Calculator

CMA Subject Property

Curious about what homes are selling for in this area?

Get a report on comparable homes with helpful insights and trends.

00

*Based on last 30 days

Description

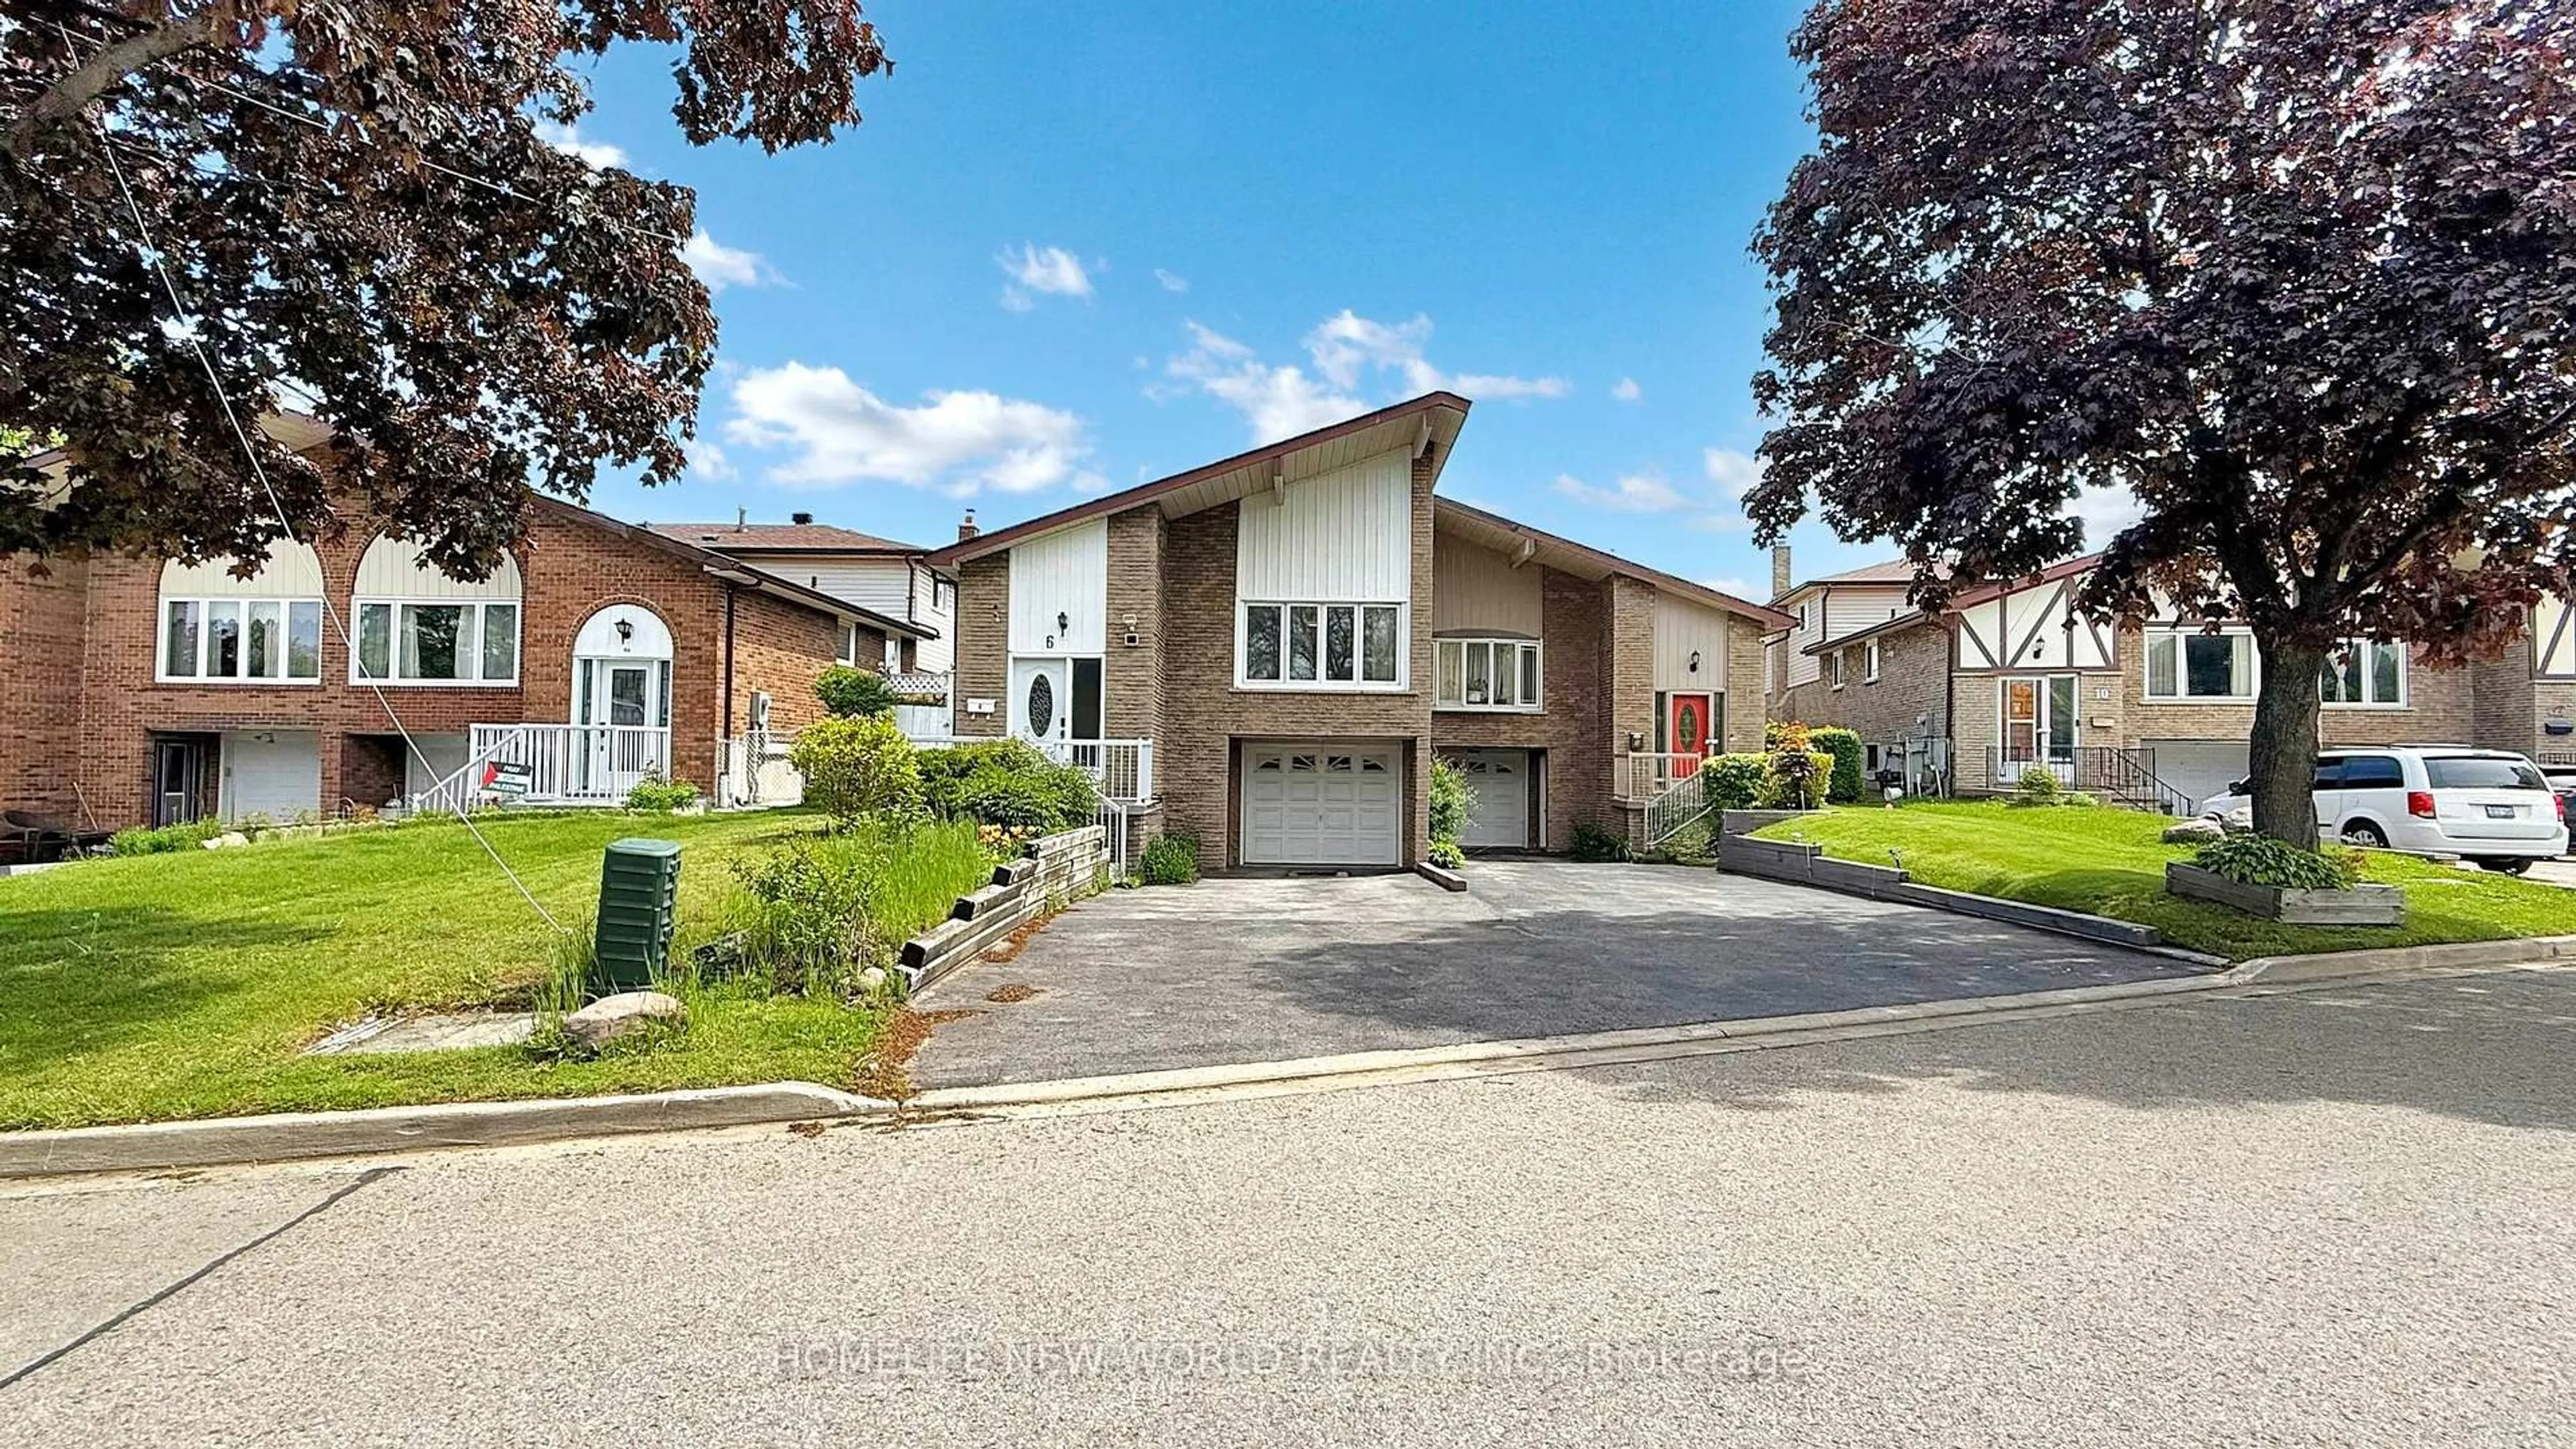
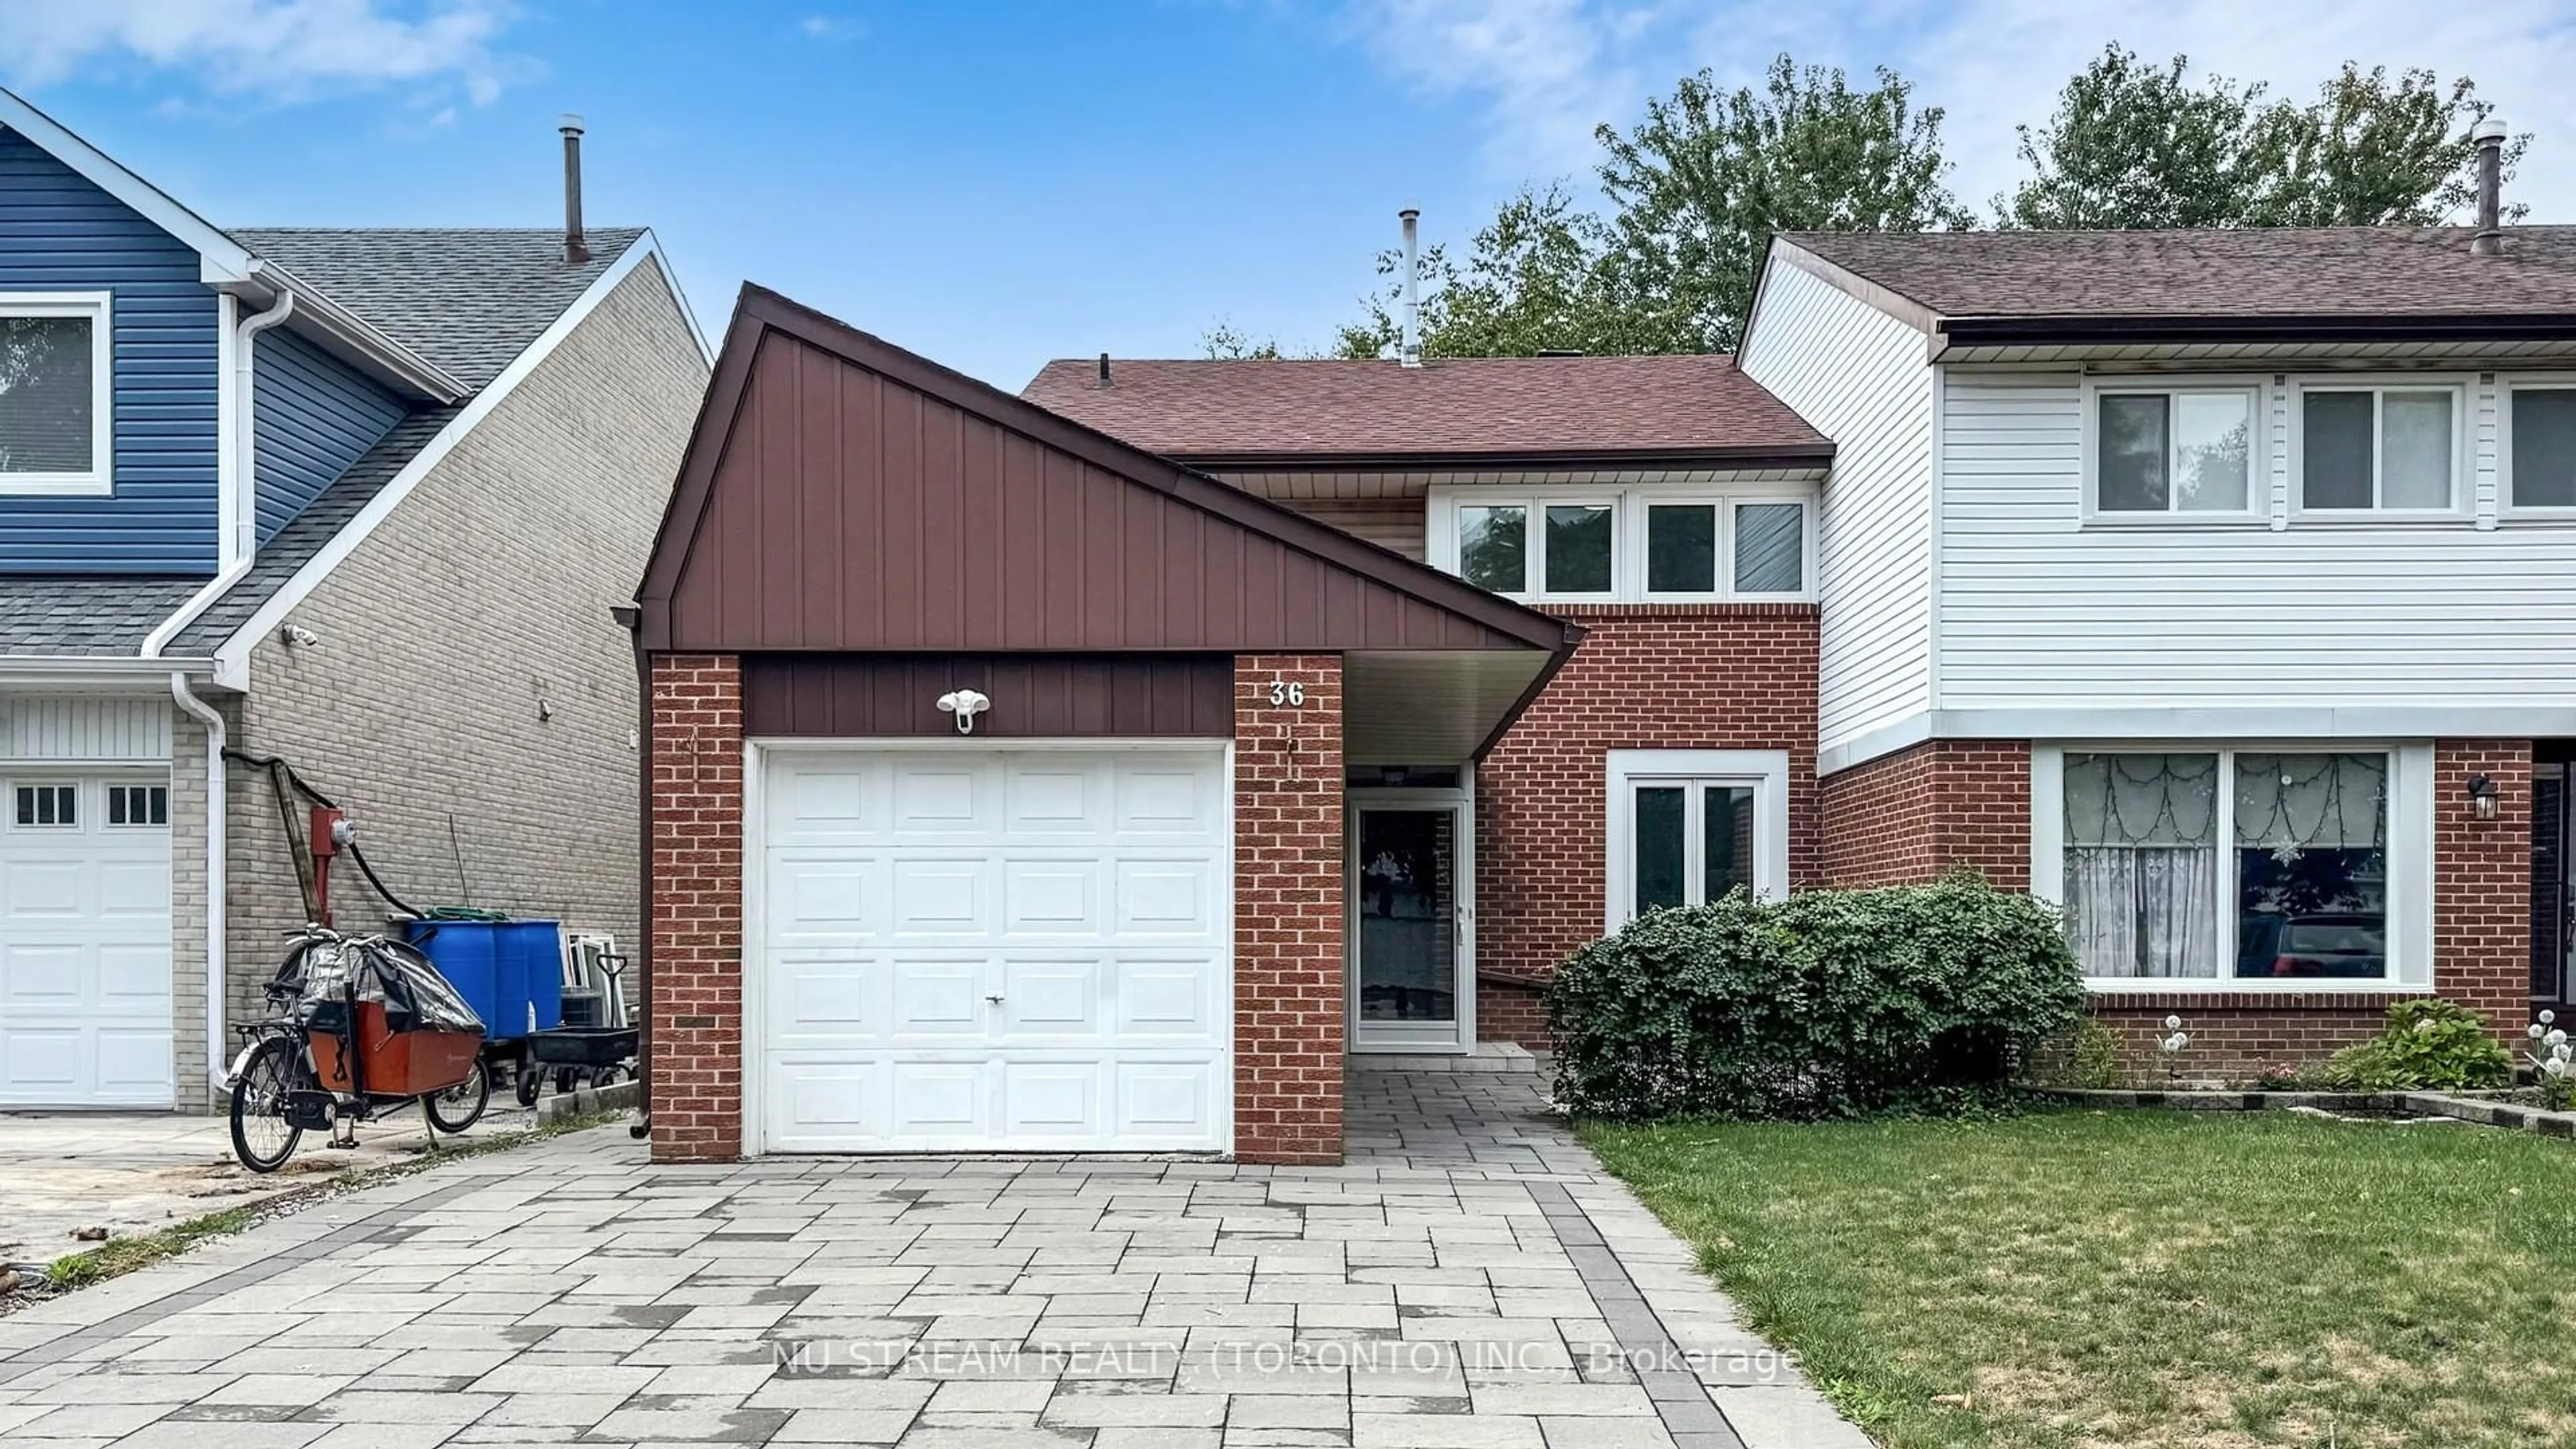
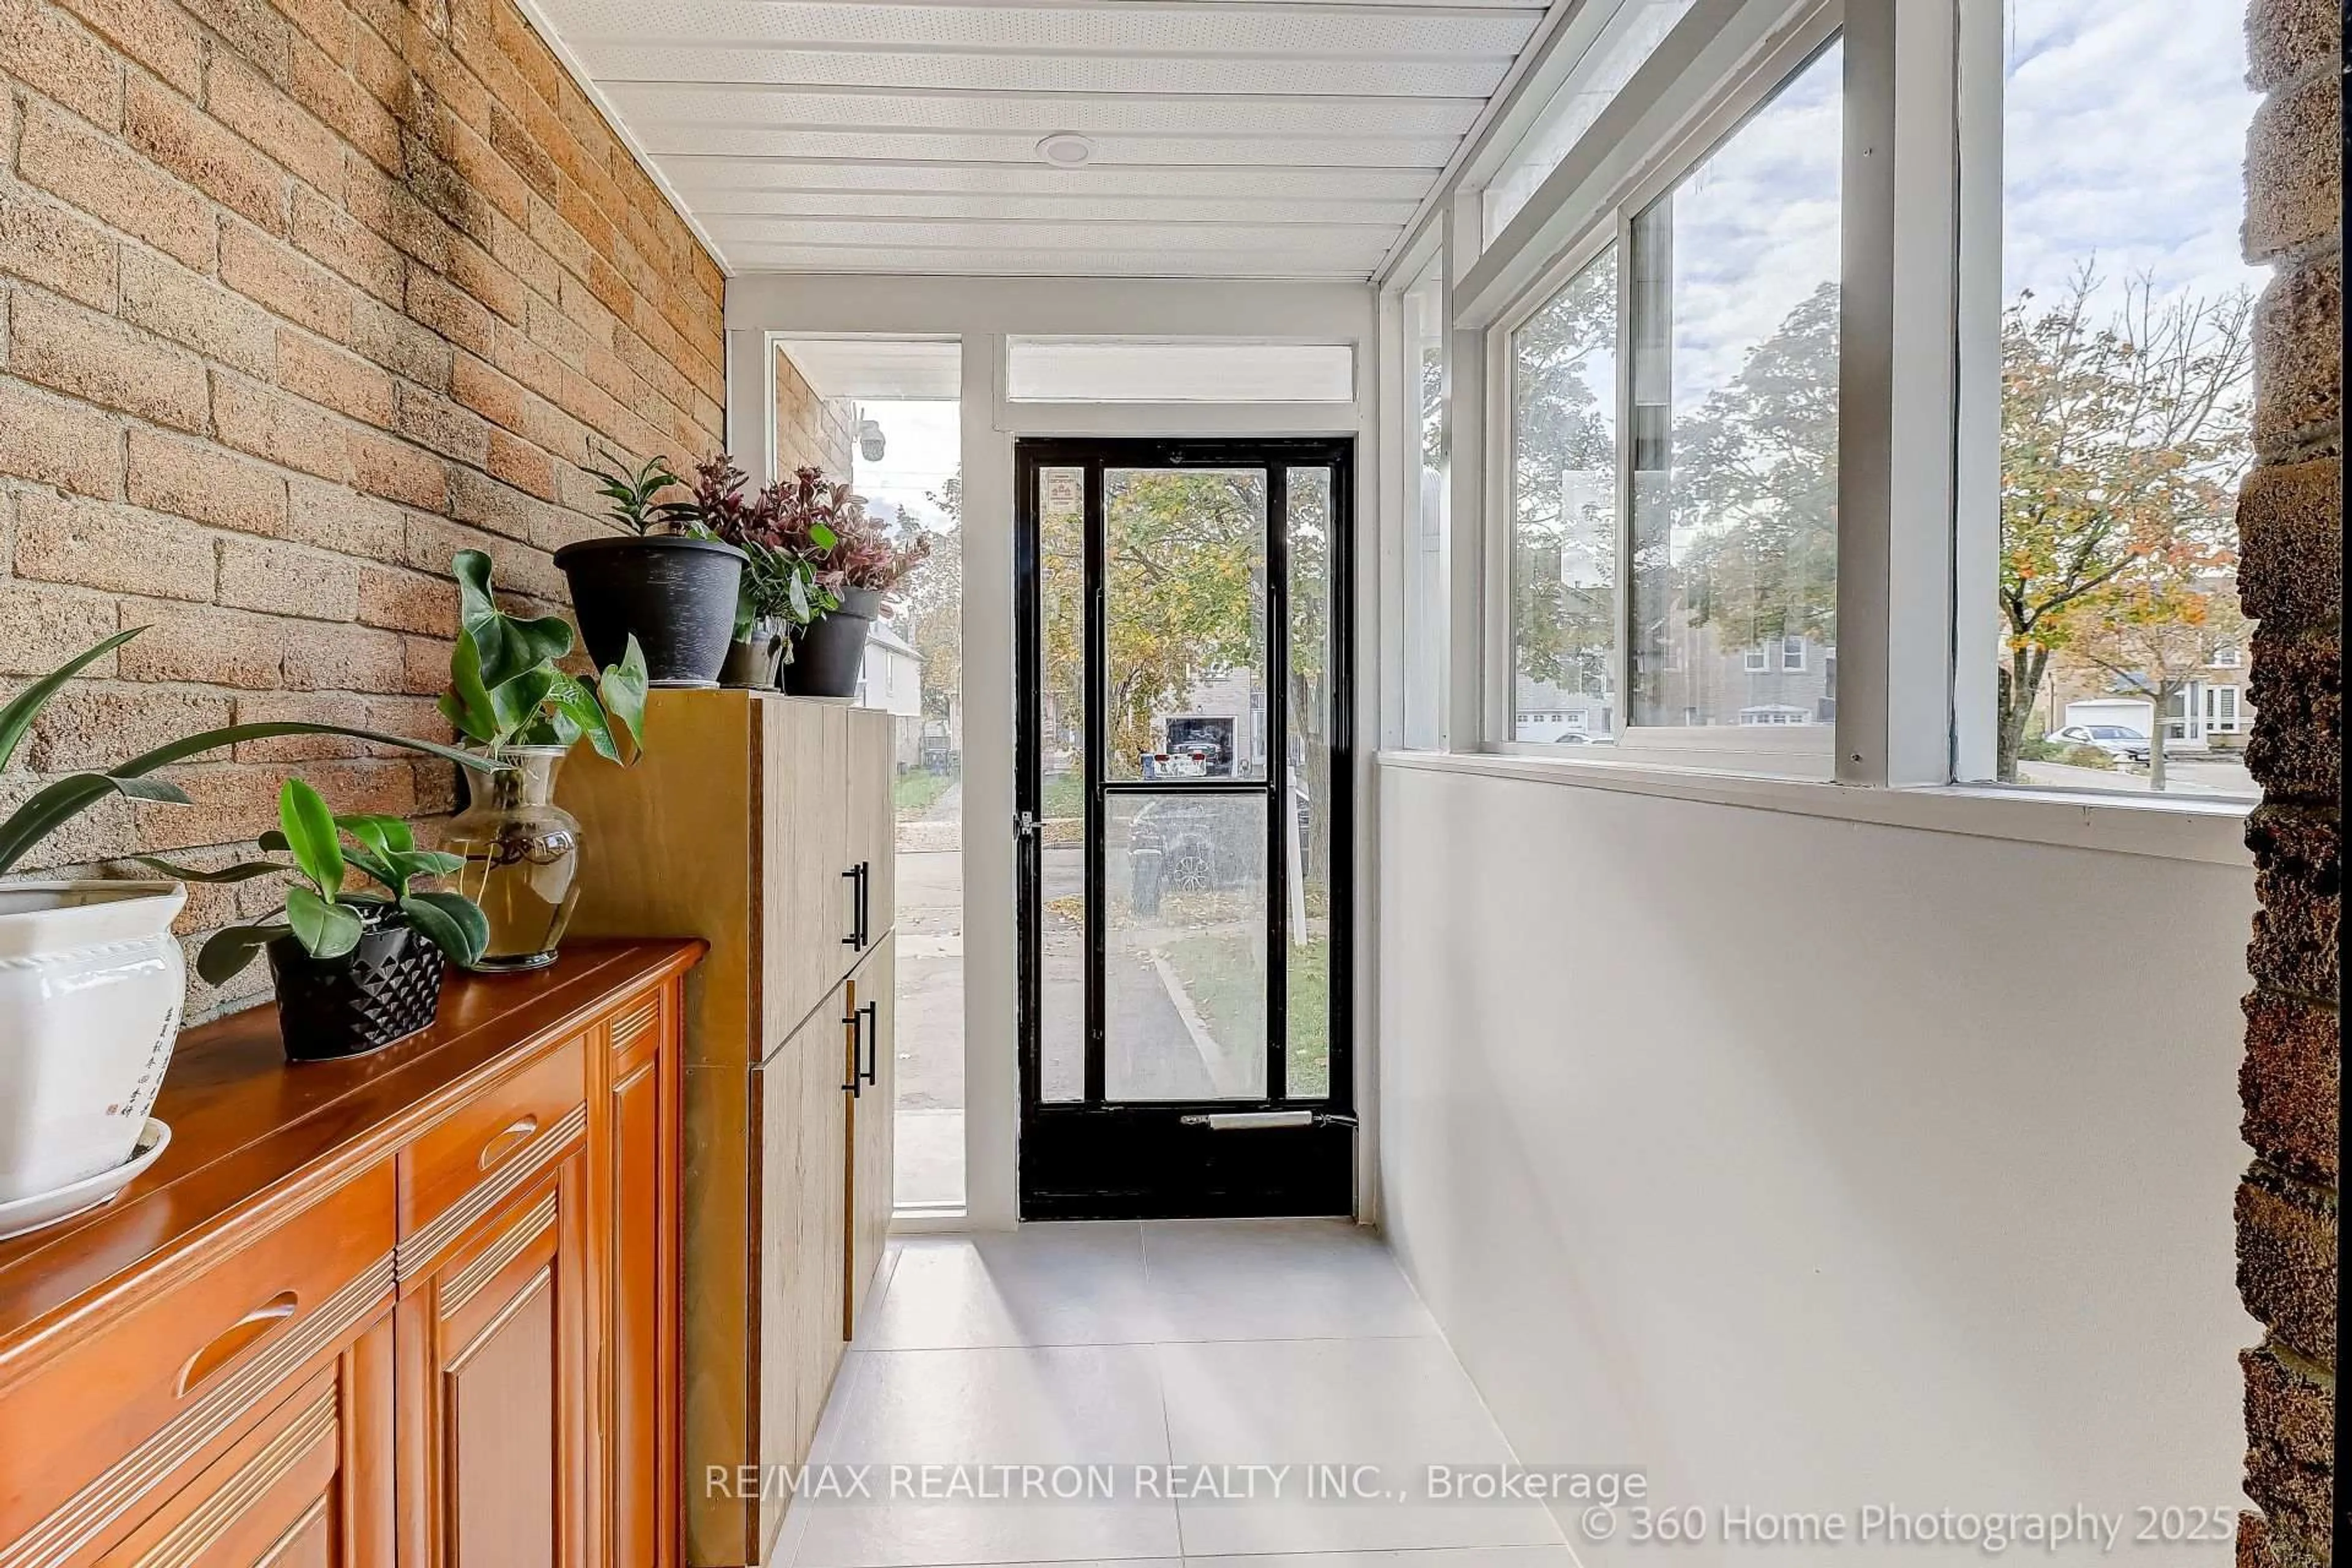
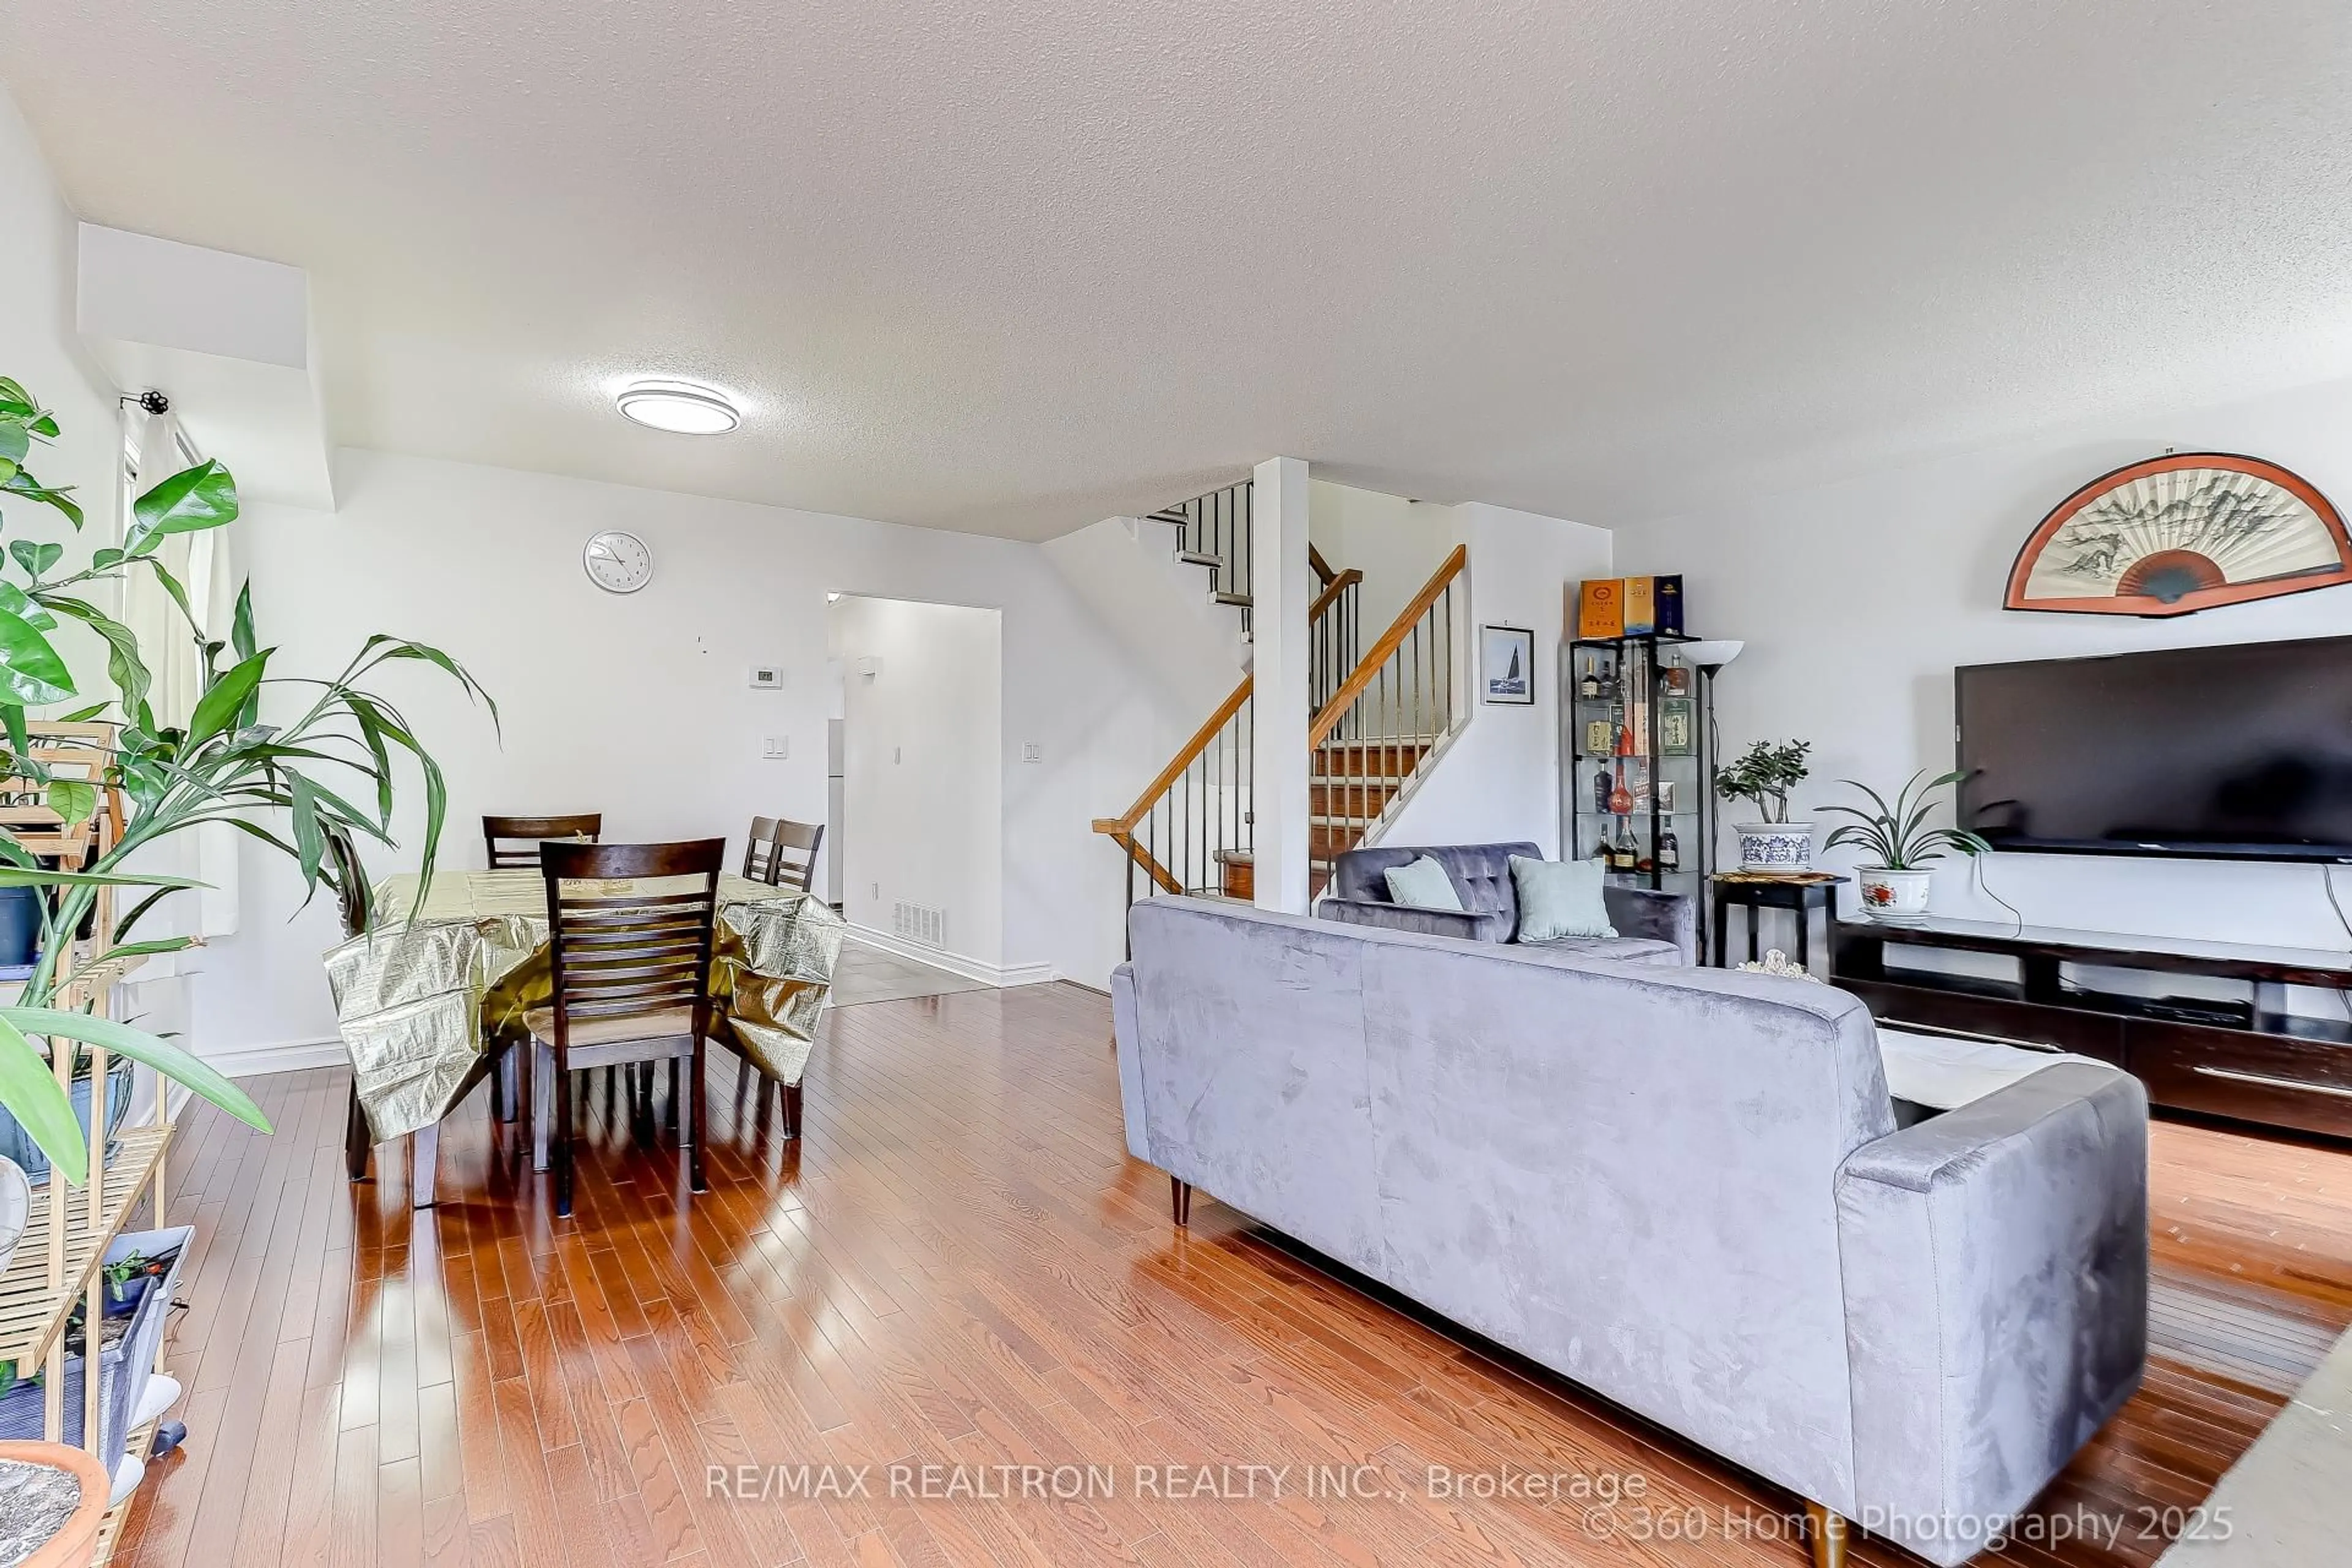
A Rarely Offered Milliken Community Semi-Detached Home! A recently built enclosed front porch provides a welcoming entryway and an additional cozy spot for your family . Gorgeous Upgraded Bedrooms With Modern Designed Washrooms. Finished Basement To Entertain. Side Entrance Door. Main Floor Laundry. Newer Furnace And A/C. Fully interlocked backyard, designed for both elegance and easy upkeep. Convenient Catwalk To Mcnicoll Accessible To Bus Stops. 5 Min Drive To Milliken Go Train. Walking Distance To Port Royal Park, Schools, And Popular Restaurants And Medical Building.


Property Details

Style2-Storey
View-
Age of property-
SqFt~1100-1500 SqFt
Lot Size2,917 SqFt(116.71 x 25)
Parking Spaces3
MLS ®NumberE12481872
Community NameMilliken Mills East
Data SourceTRREB
Listing byRE/MAX REALTRON REALTY INC.

Features

Heating: Forced Air
Cooling: Central Air
Fireplace
Basement: Sep Entrance, Finished

2nd Floor

Primary

15.32 x 13.09

Large Closet / Semi Ensuite / Laminate

2nd Br

12.24 x 10.66

Closet / Laminate / Window

3rd Br

12.24 x 8.83

Laminate / Large Closet / Window


Features

Lot size: 2,917 SqFt

Parking

Garage spaces 1

Garage type Attached

Other parking spaces 2

Total parking spaces 3


Property History

Date unavailable
ListedActive
$1,118,000
< 1h on market
history photo preview25
Listing by trreb®

Market Data - Milliken Mills East

Geo Zone Map ThumbnailMilliken Mills East

Strong Buyer's Market

View Market Data

Semi-Detached house - for the past 30 days

Buyer's market Seller's market

Avg. Days on Market

Past 30 days

7 days

Compared to

2024

0 day

2023

35 days

2022

14 days

New Listings

Past 30 days

3 listings

Compared to

2024

5 listings

2023

1 listing

2022

6 listings

Units sold

Past 30 days

1 unit

Compared to

2024

0 unit

2023

1 unit

2022

3 units

Median Sold Price

Past 30 days

$1,142,000

Compared to

2023

$1,050,000

2022

$1,018,999


Population and Demographics

Overview

Total population 25866
Average household income $114,708

Age (%)

0 to 19
18%
20 to 34
21%
35 to 49
17%
50 to 64
22%
65 and plus
21%

Household composition (%)

Single family
75%
Single person
16%
Multi person
5%
Multi family
4%

Mother tongue (%)

Yue (Cantonese)
32%
English
27%
Mandarin
19%
Tamil
6%
Punjabi (Panjabi)
2%
Urdu
2%
Tagalog (Pilipino, Filipino)
1%
Hakka
1%
Others
1%
Gujarati
1%

House tenancy (%)

Owners
84%
Renters
16%

What’s nearby?Essentials within 5 km

Local Logic

Transportation Scores

Estimated Budget