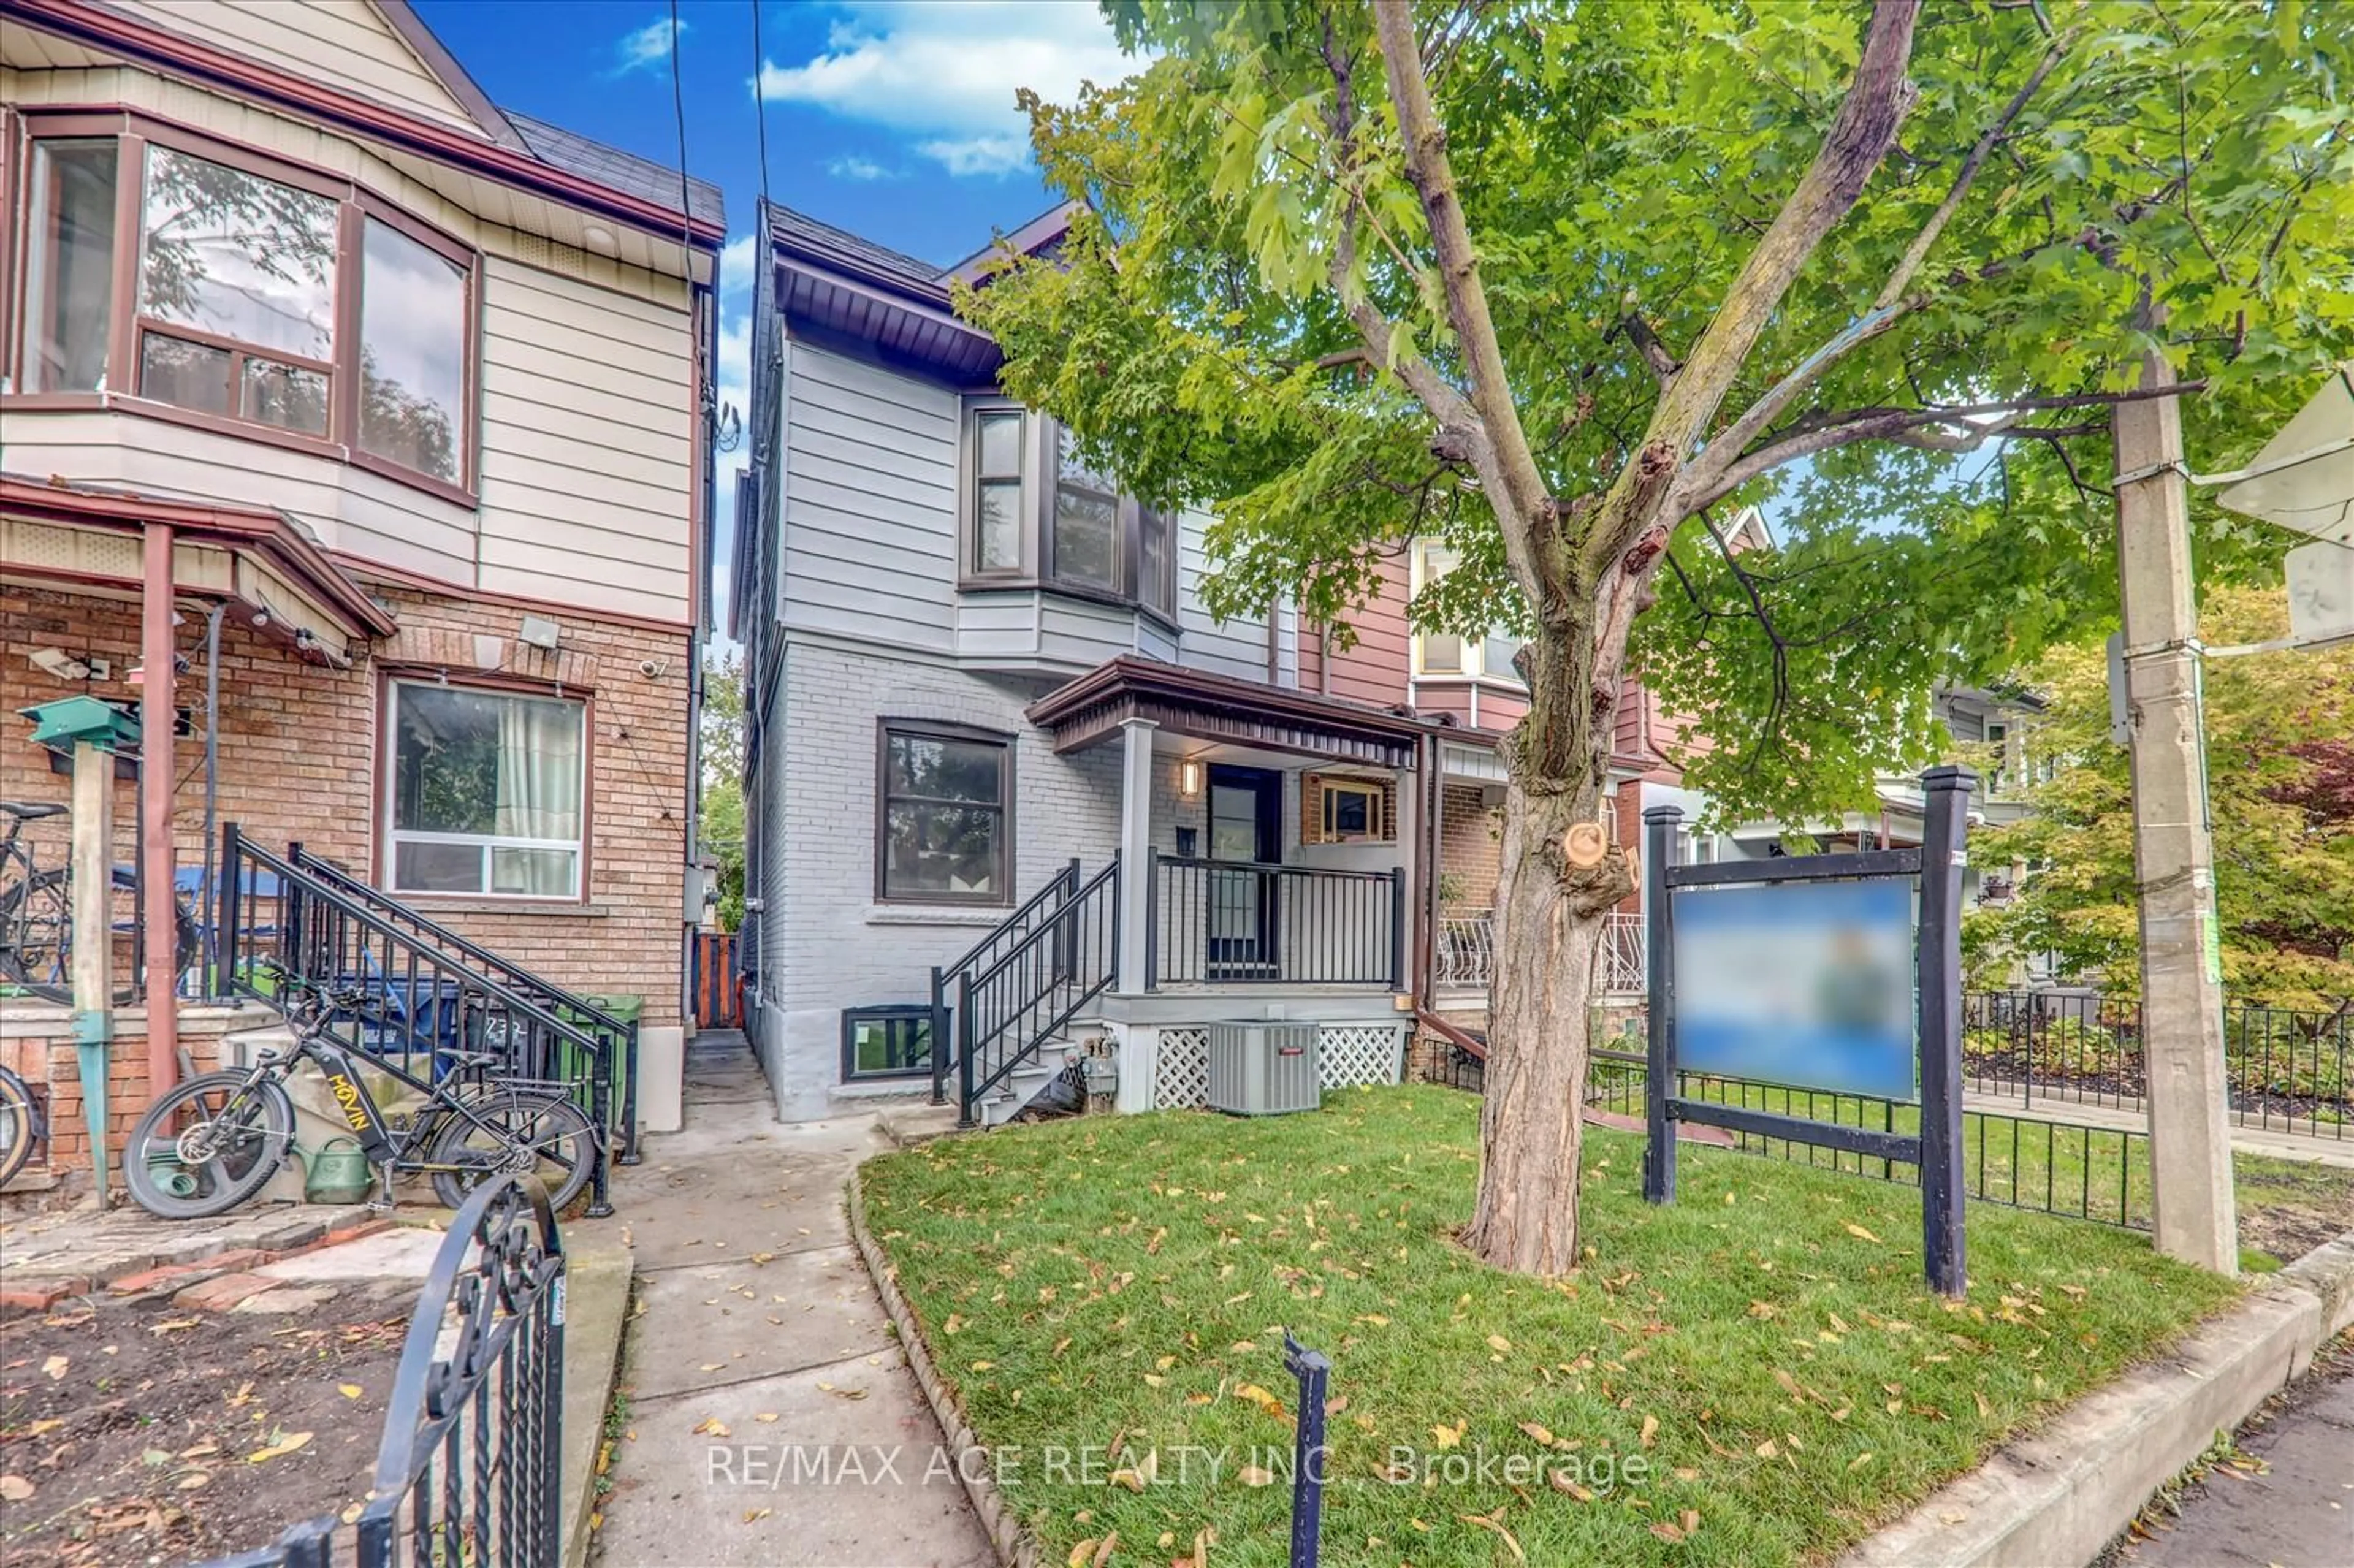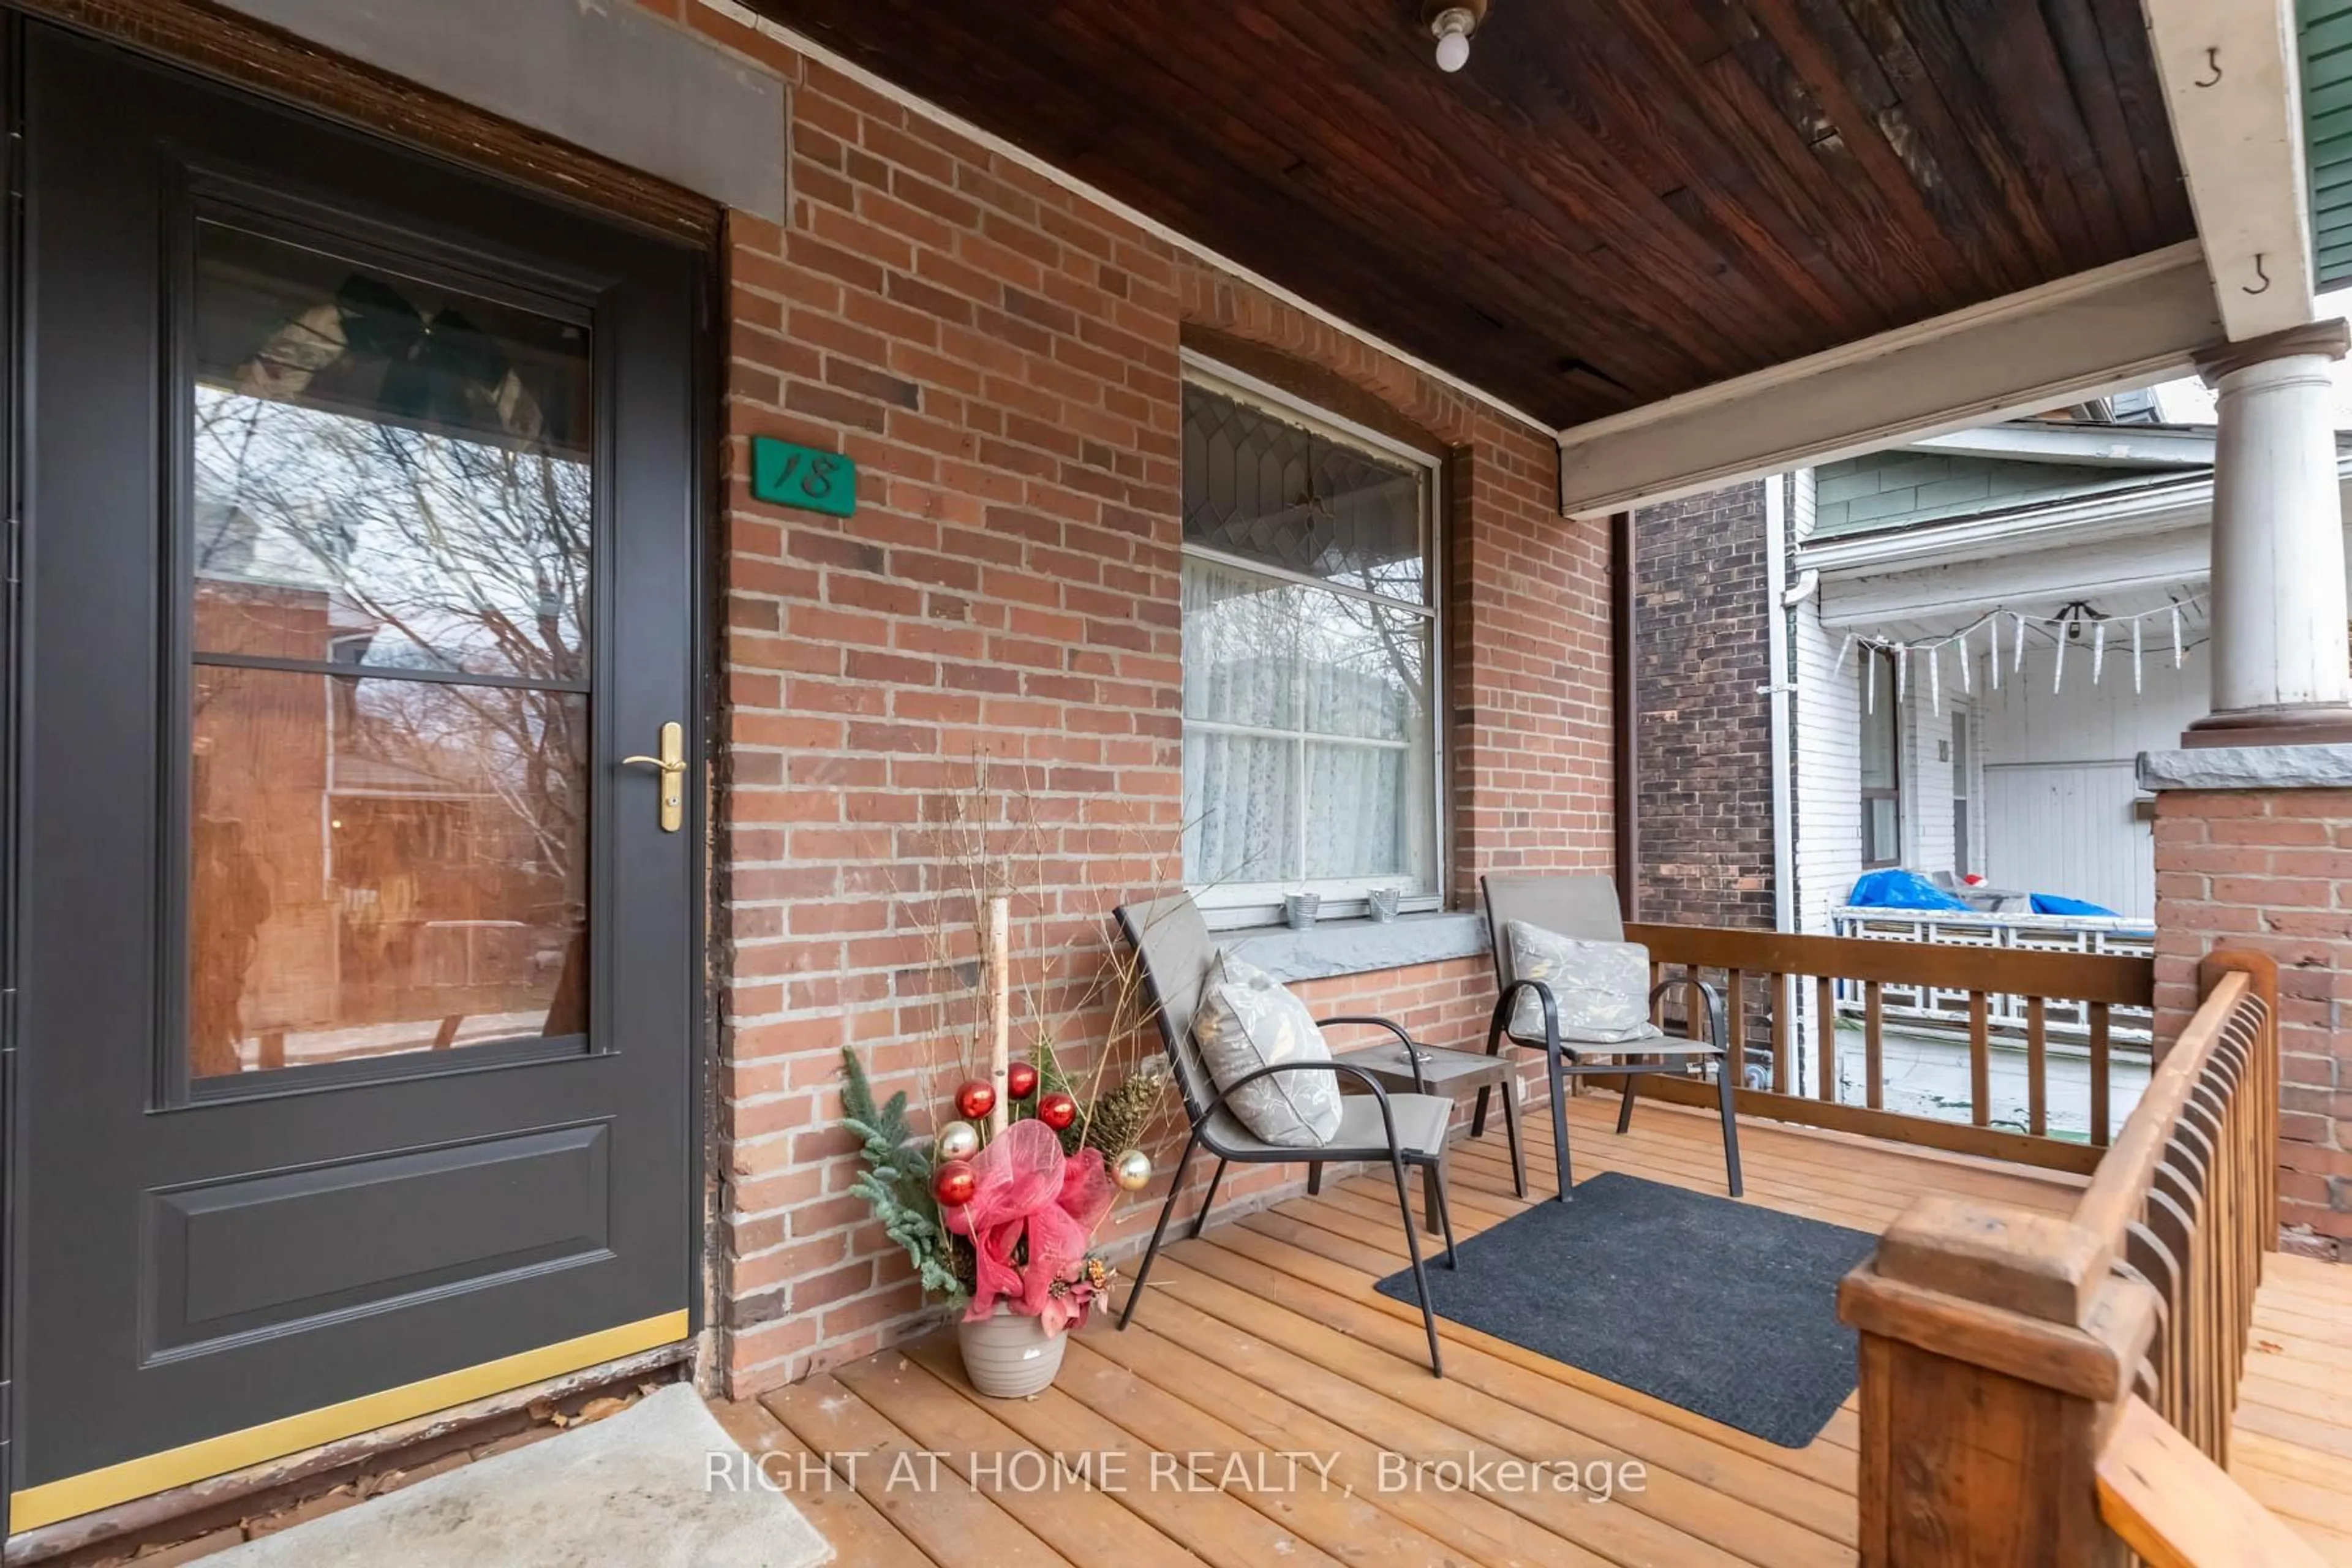
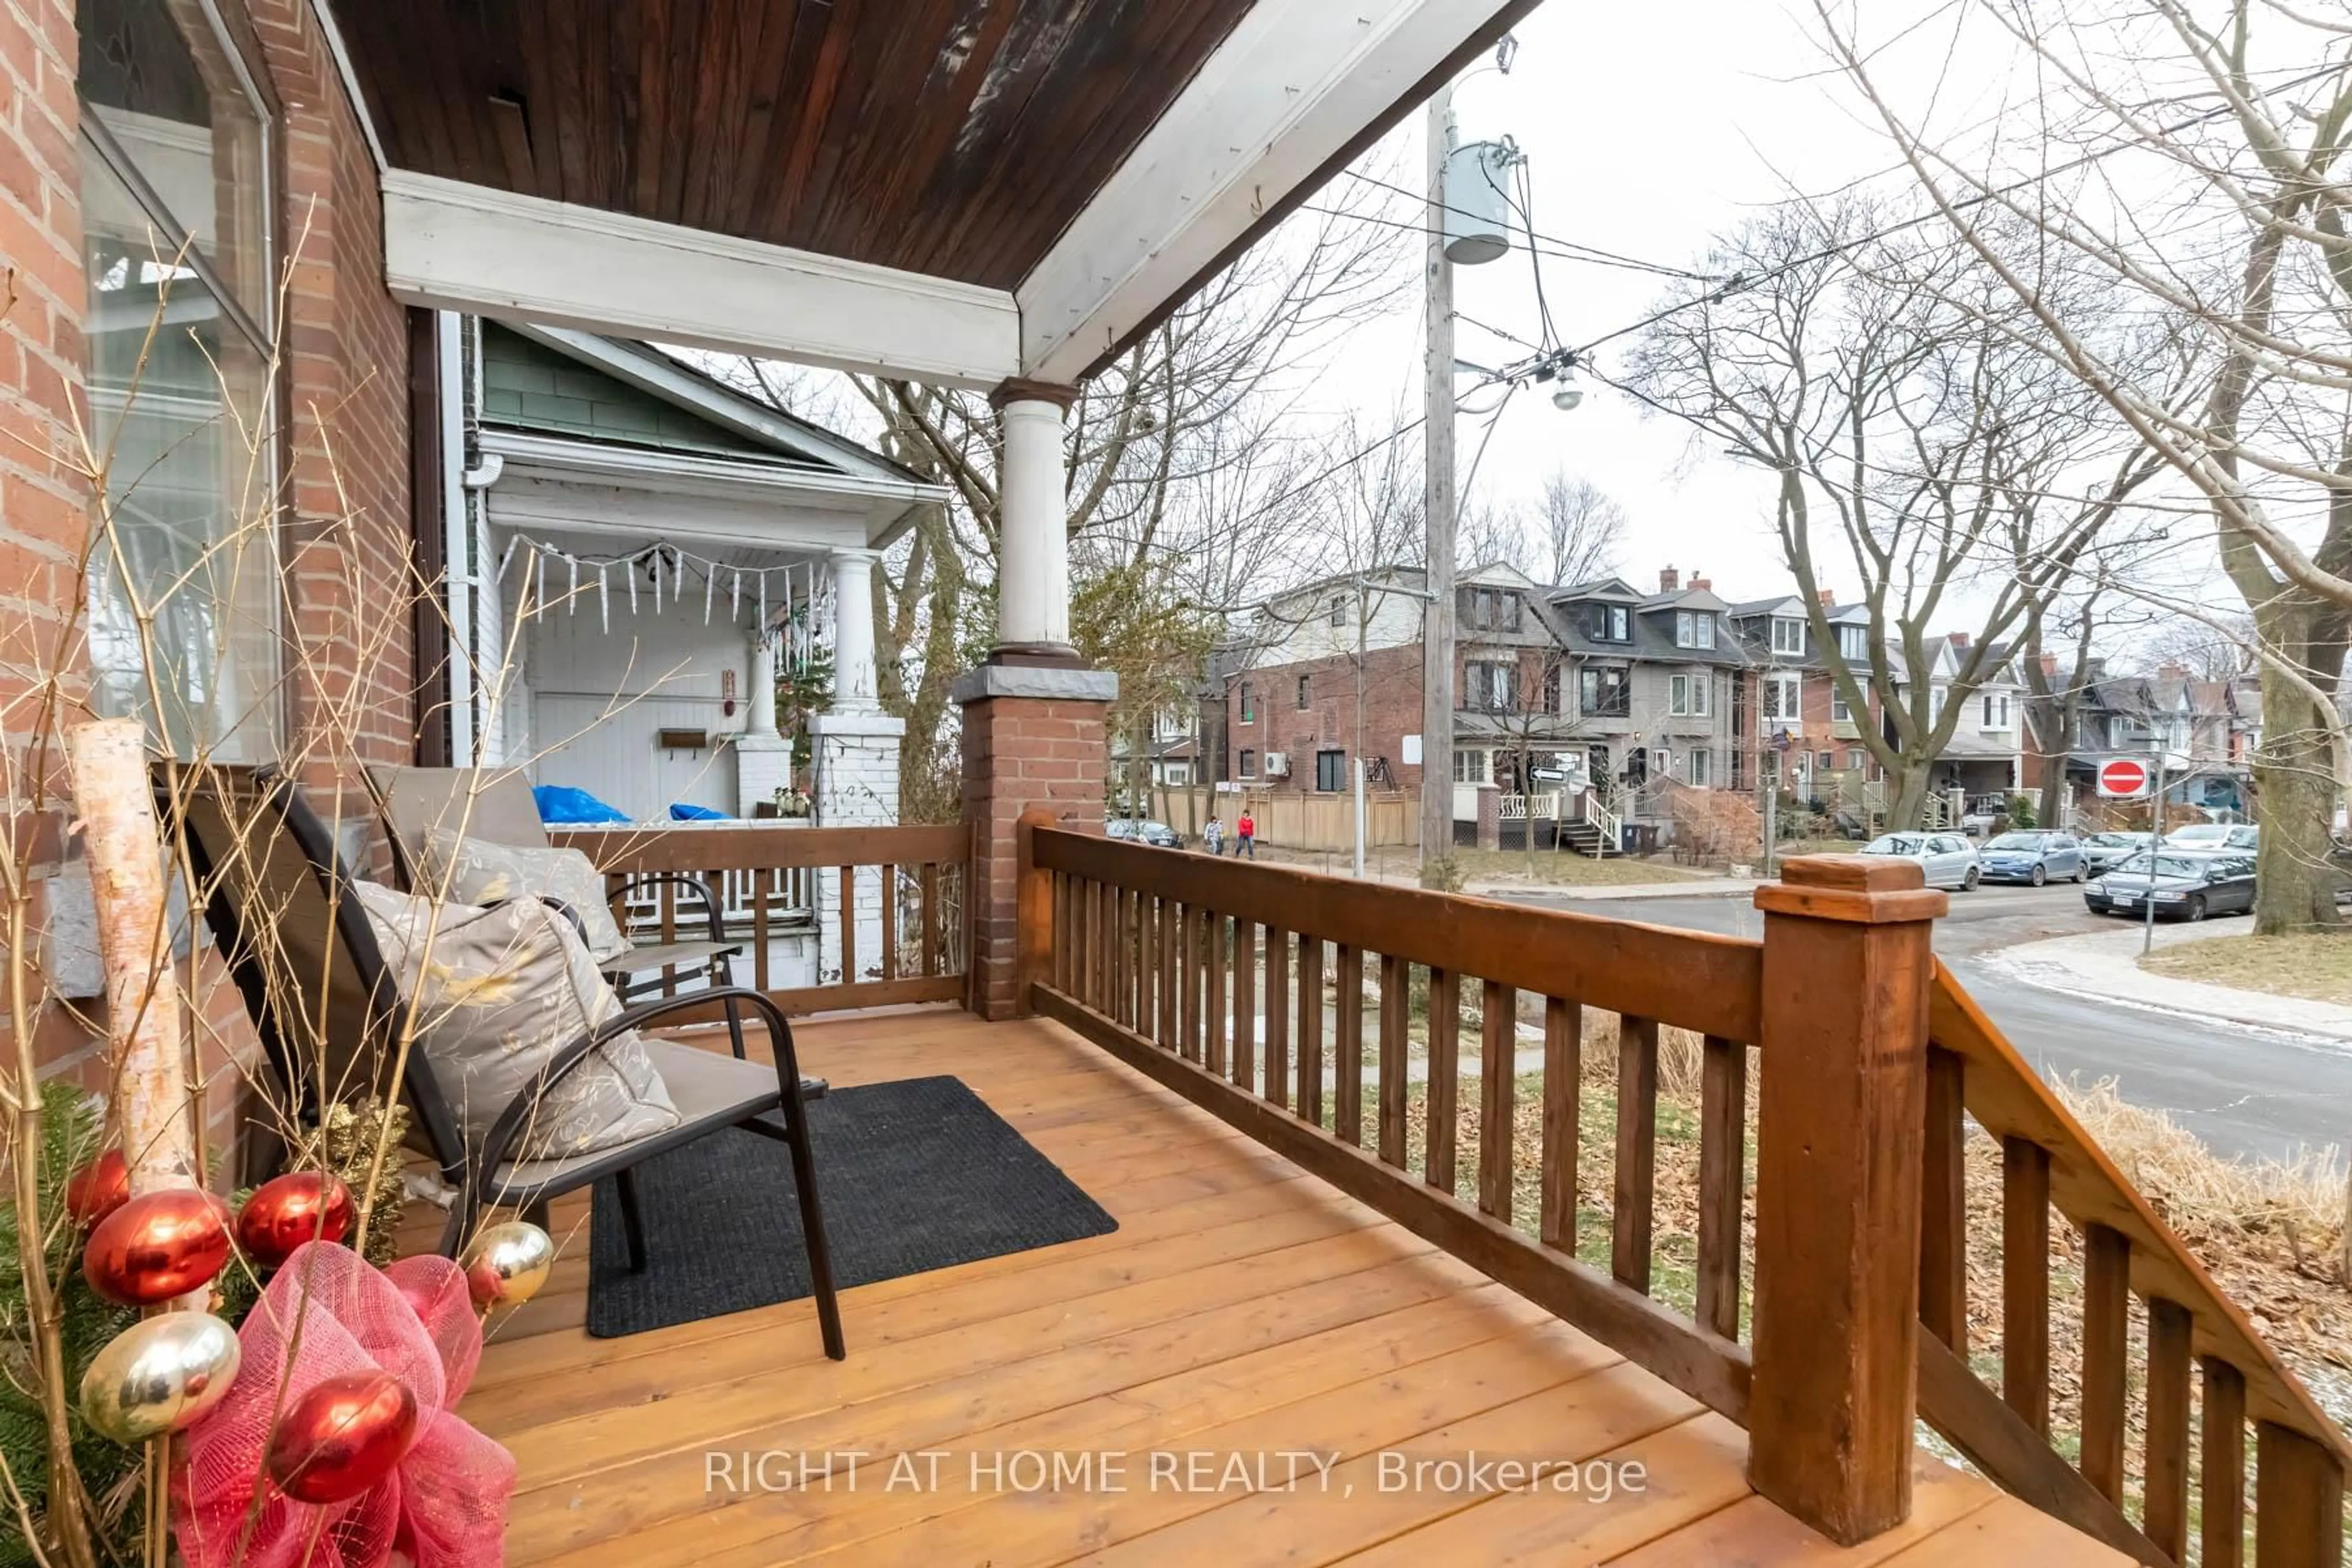
18 Mallon Ave, Toronto, Ontario M4M 1P8
Contact us about this property
Highlights
Estimated valueThis is the price Wahi expects this property to sell for.
The calculation is powered by our Instant Home Value Estimate, which uses current market and property price trends to estimate your home’s value with a 90% accuracy rate.Not available
Price/Sqft$1,023/sqft
Monthly cost
Open Calculator
Description
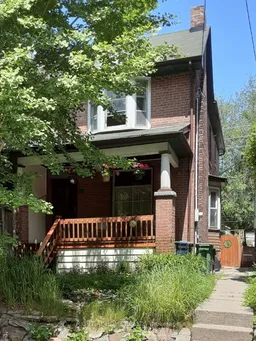
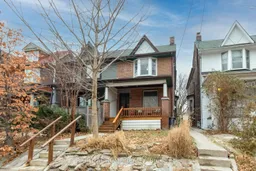
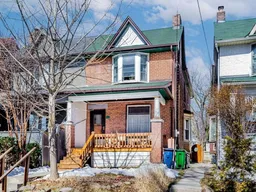
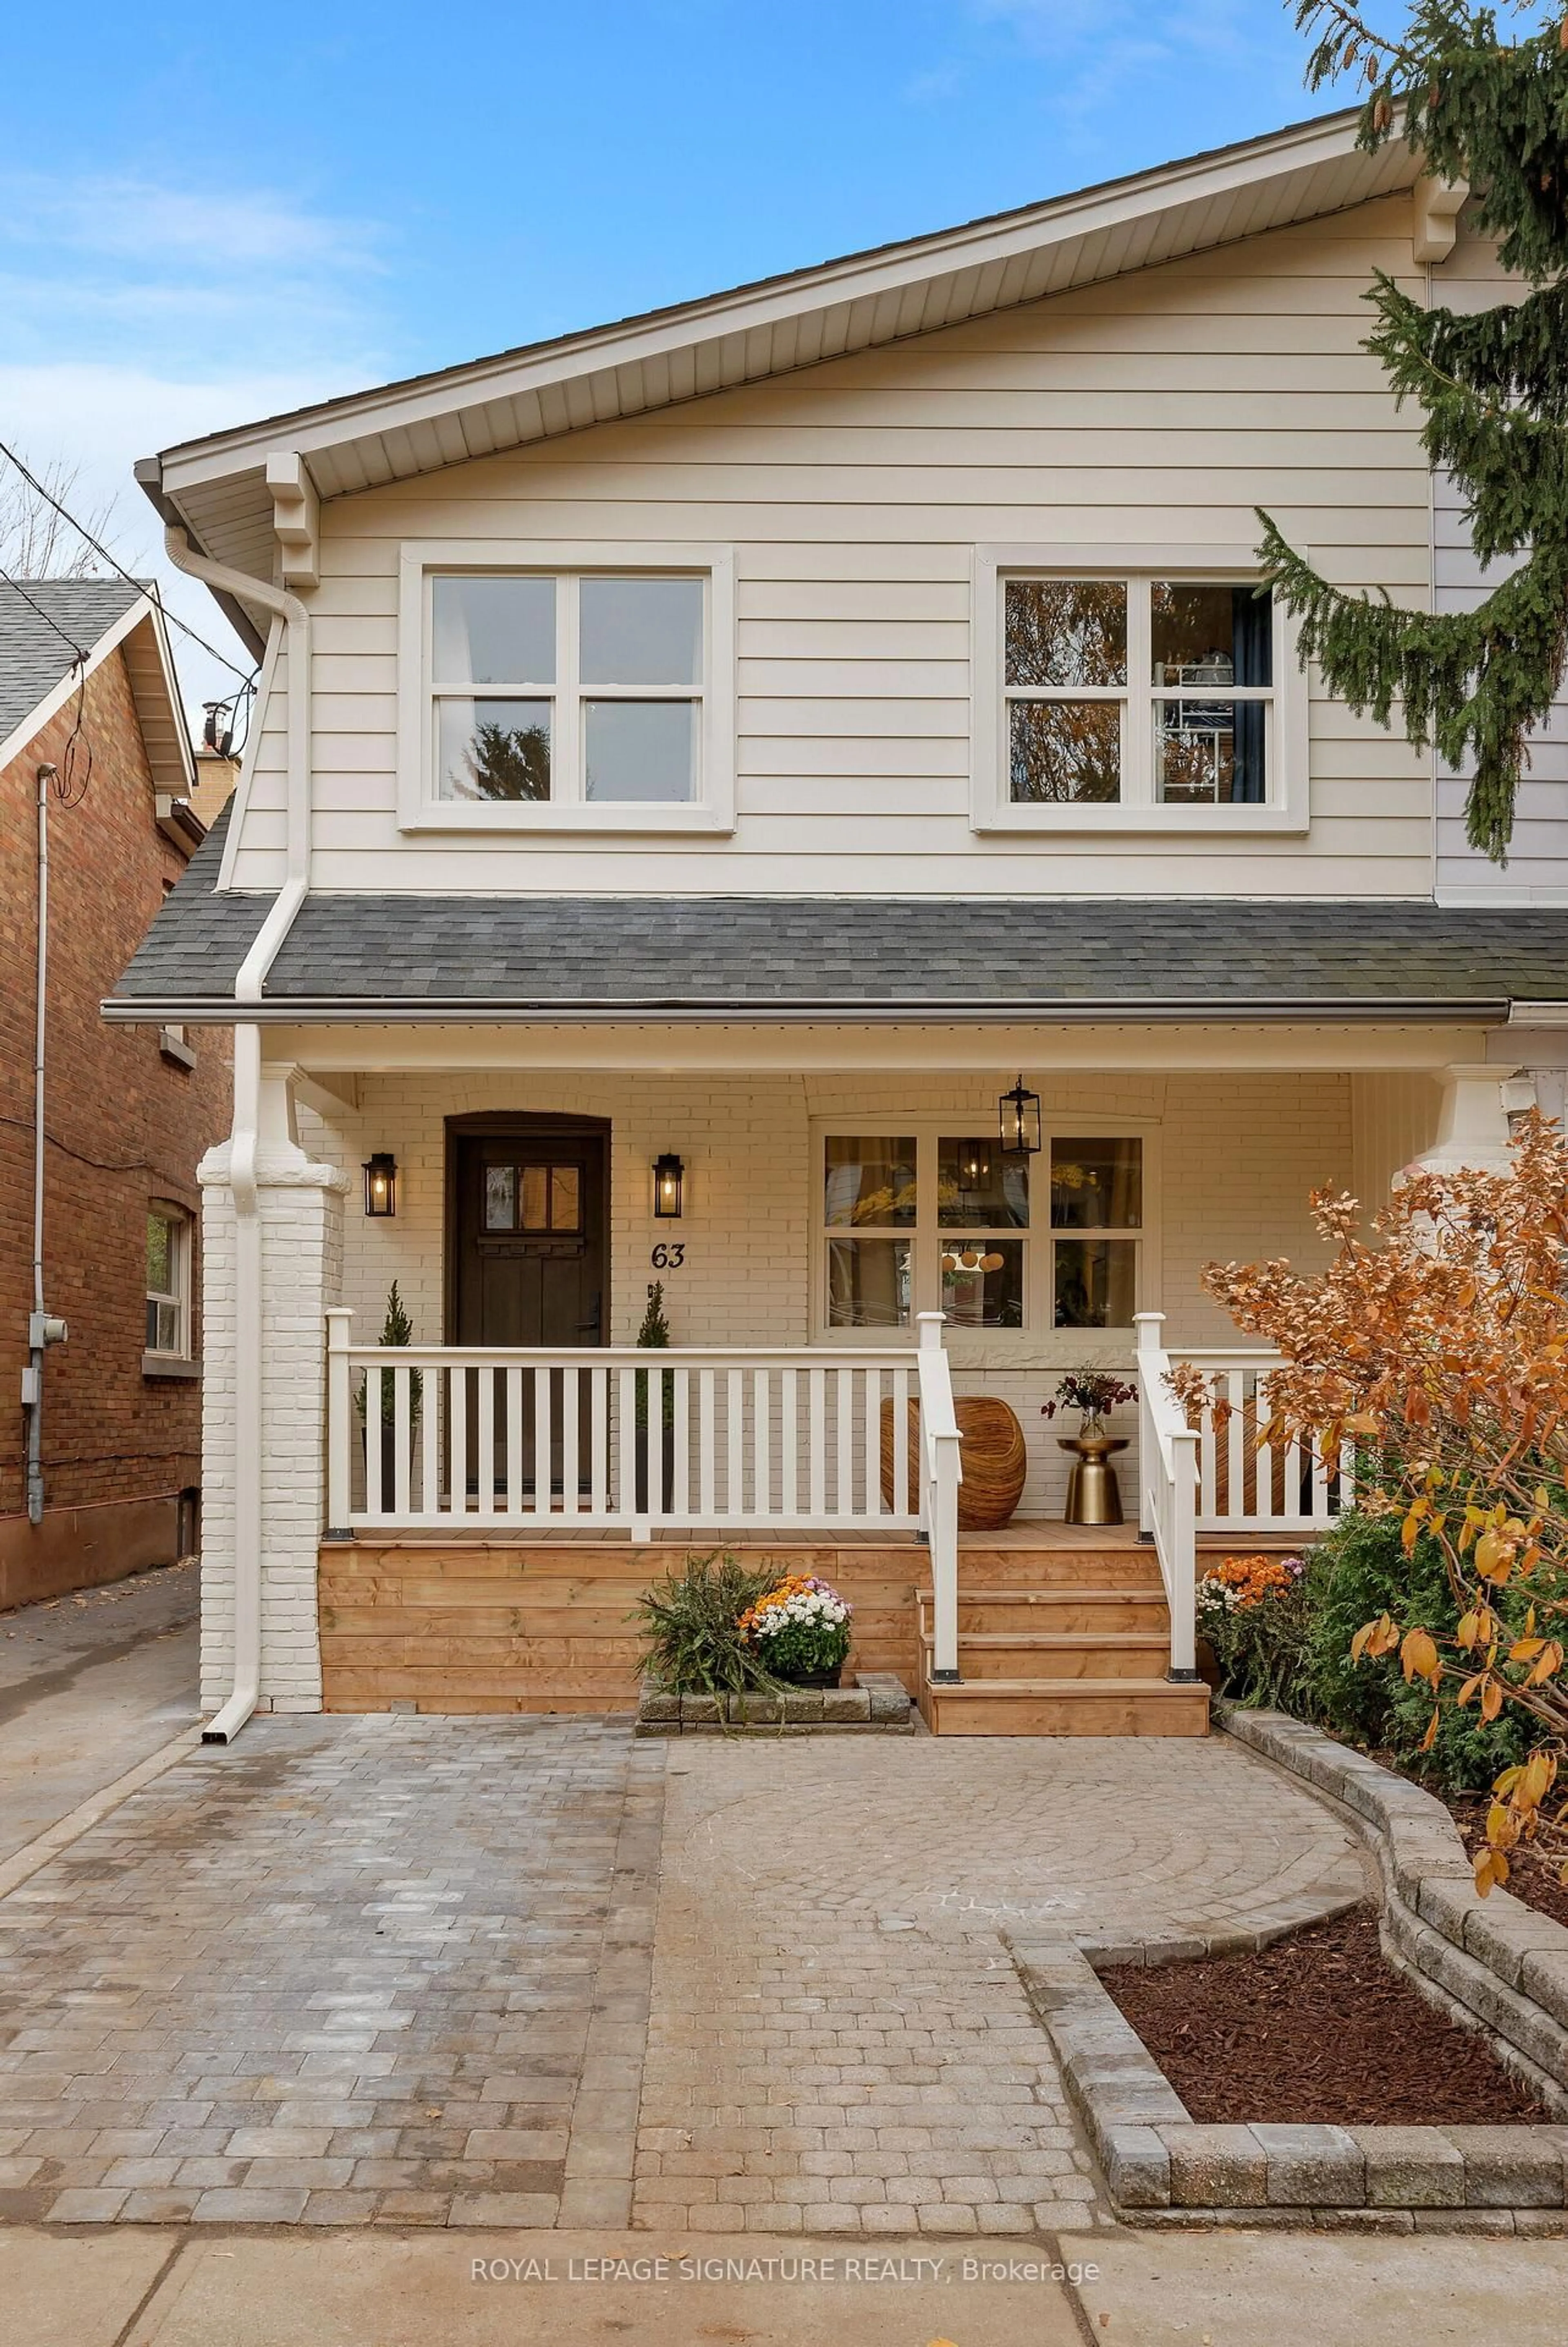
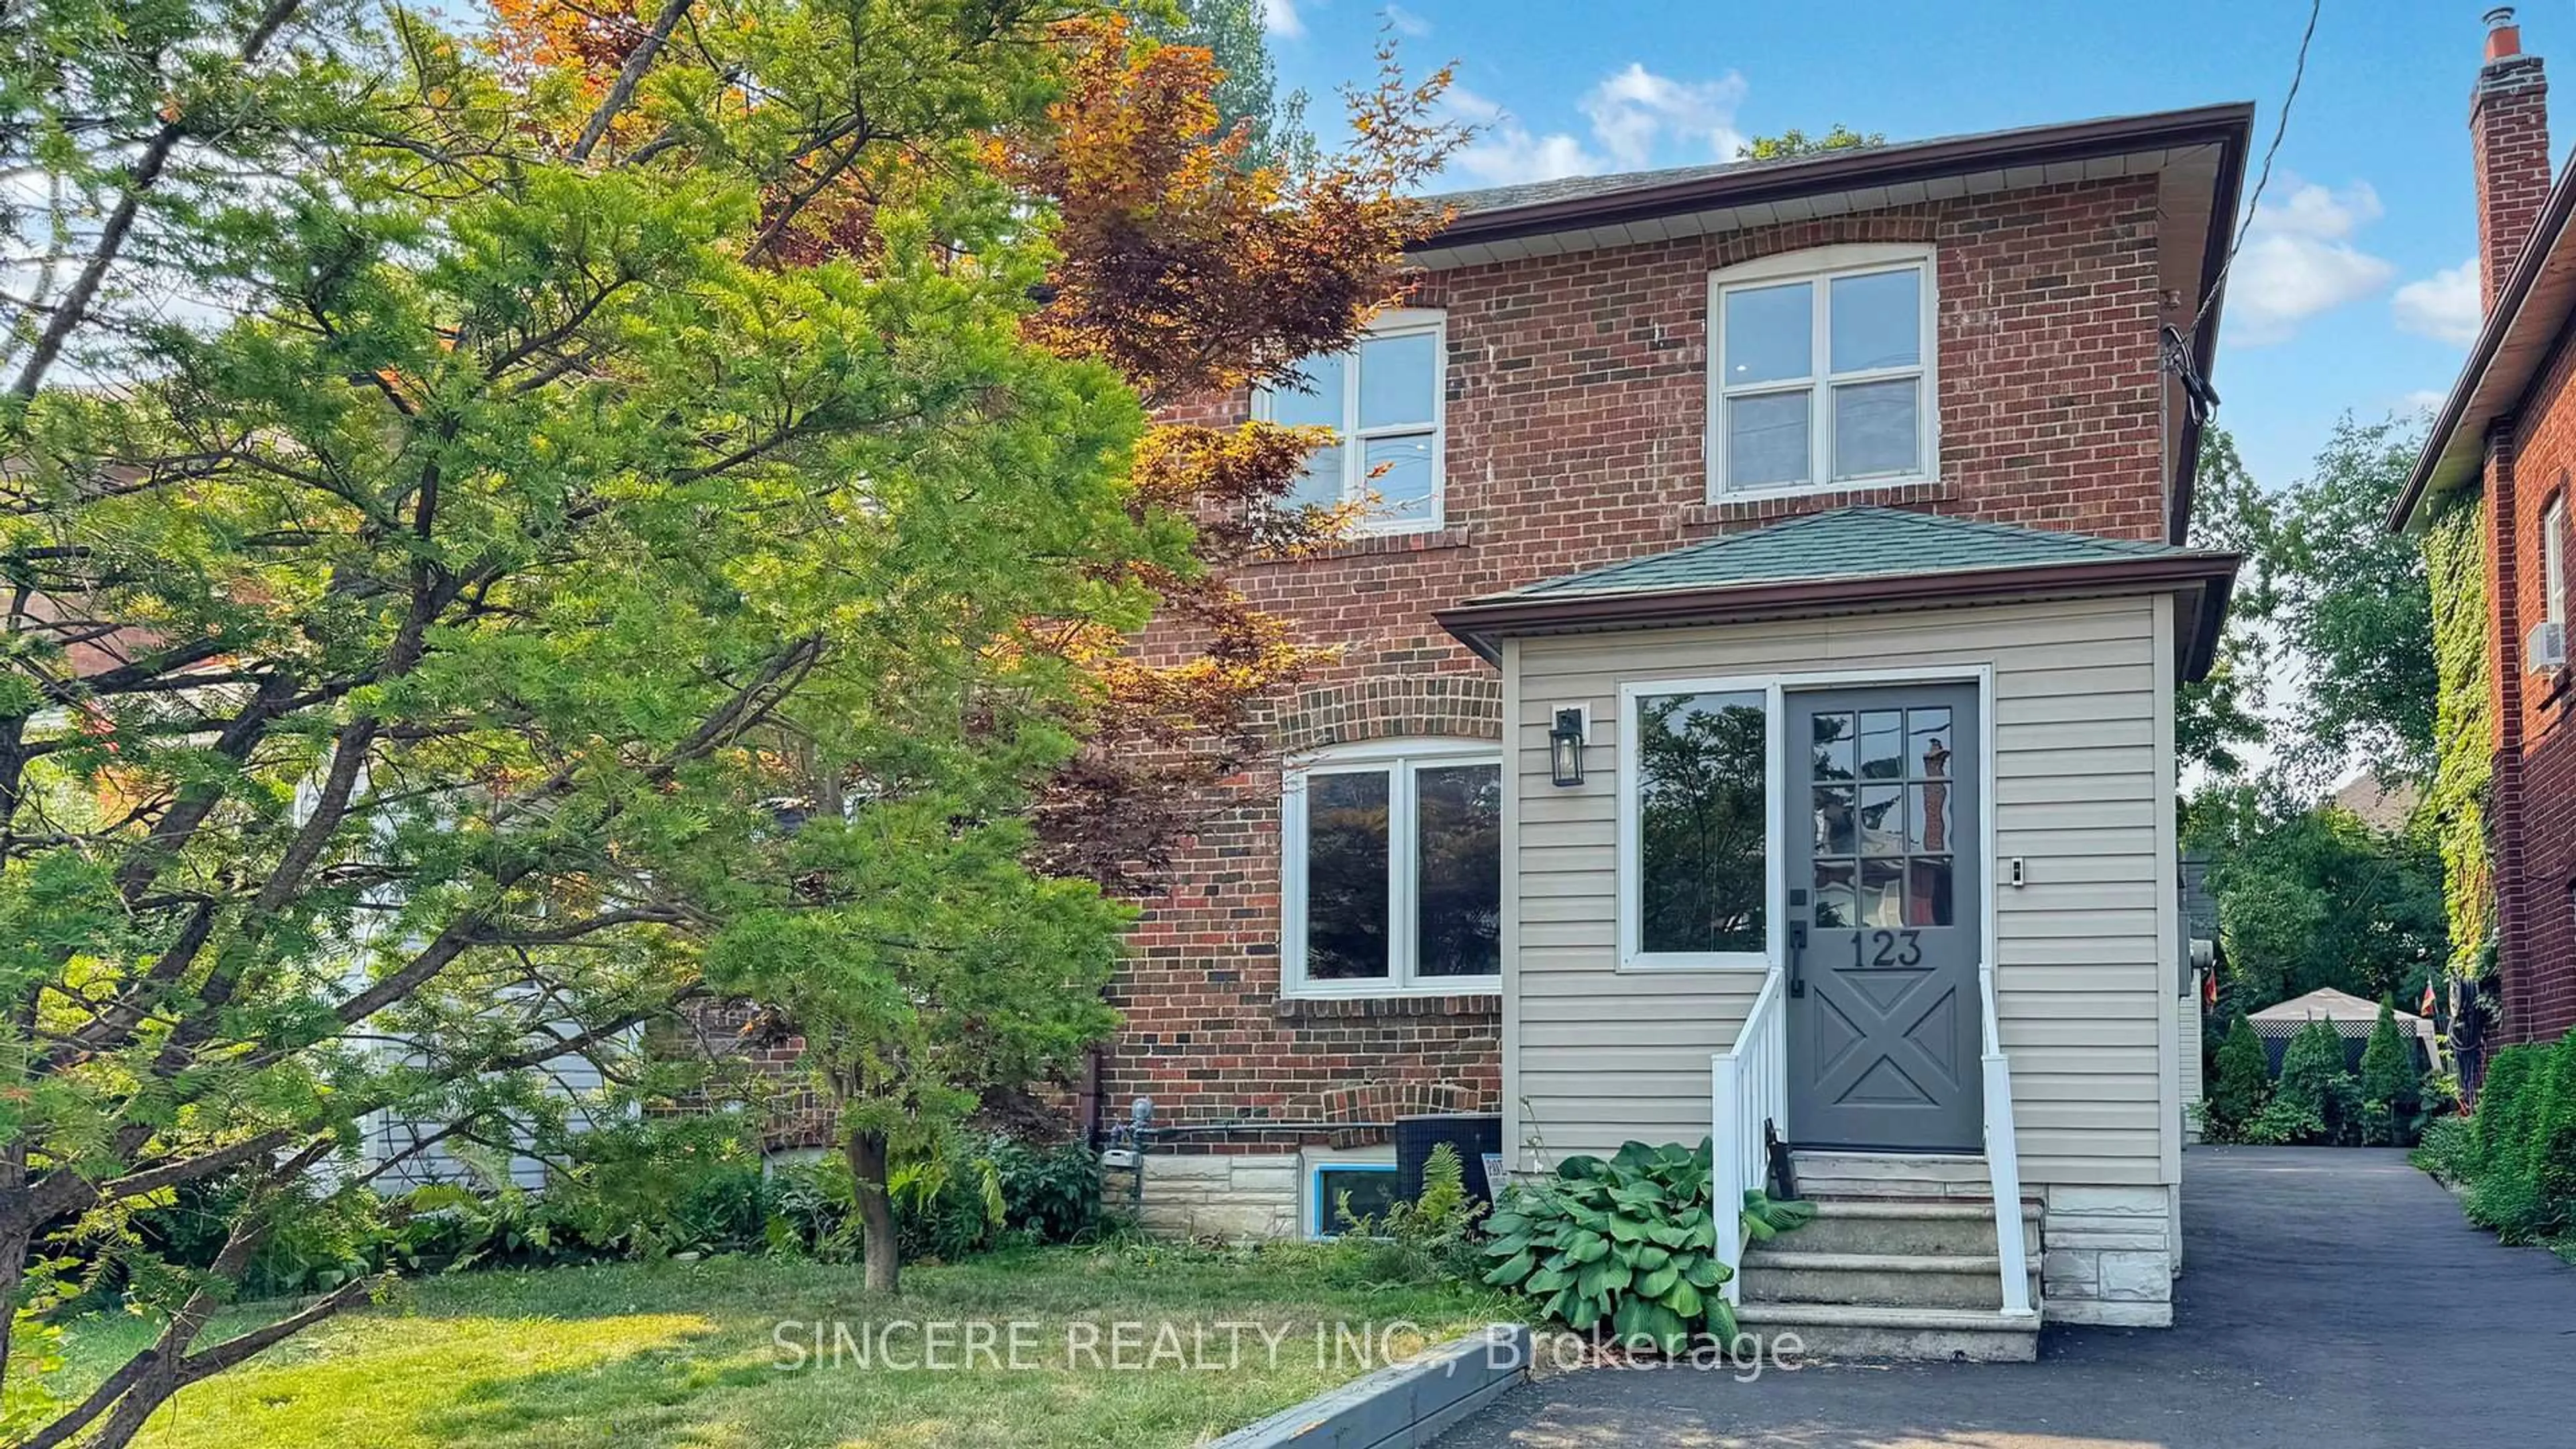
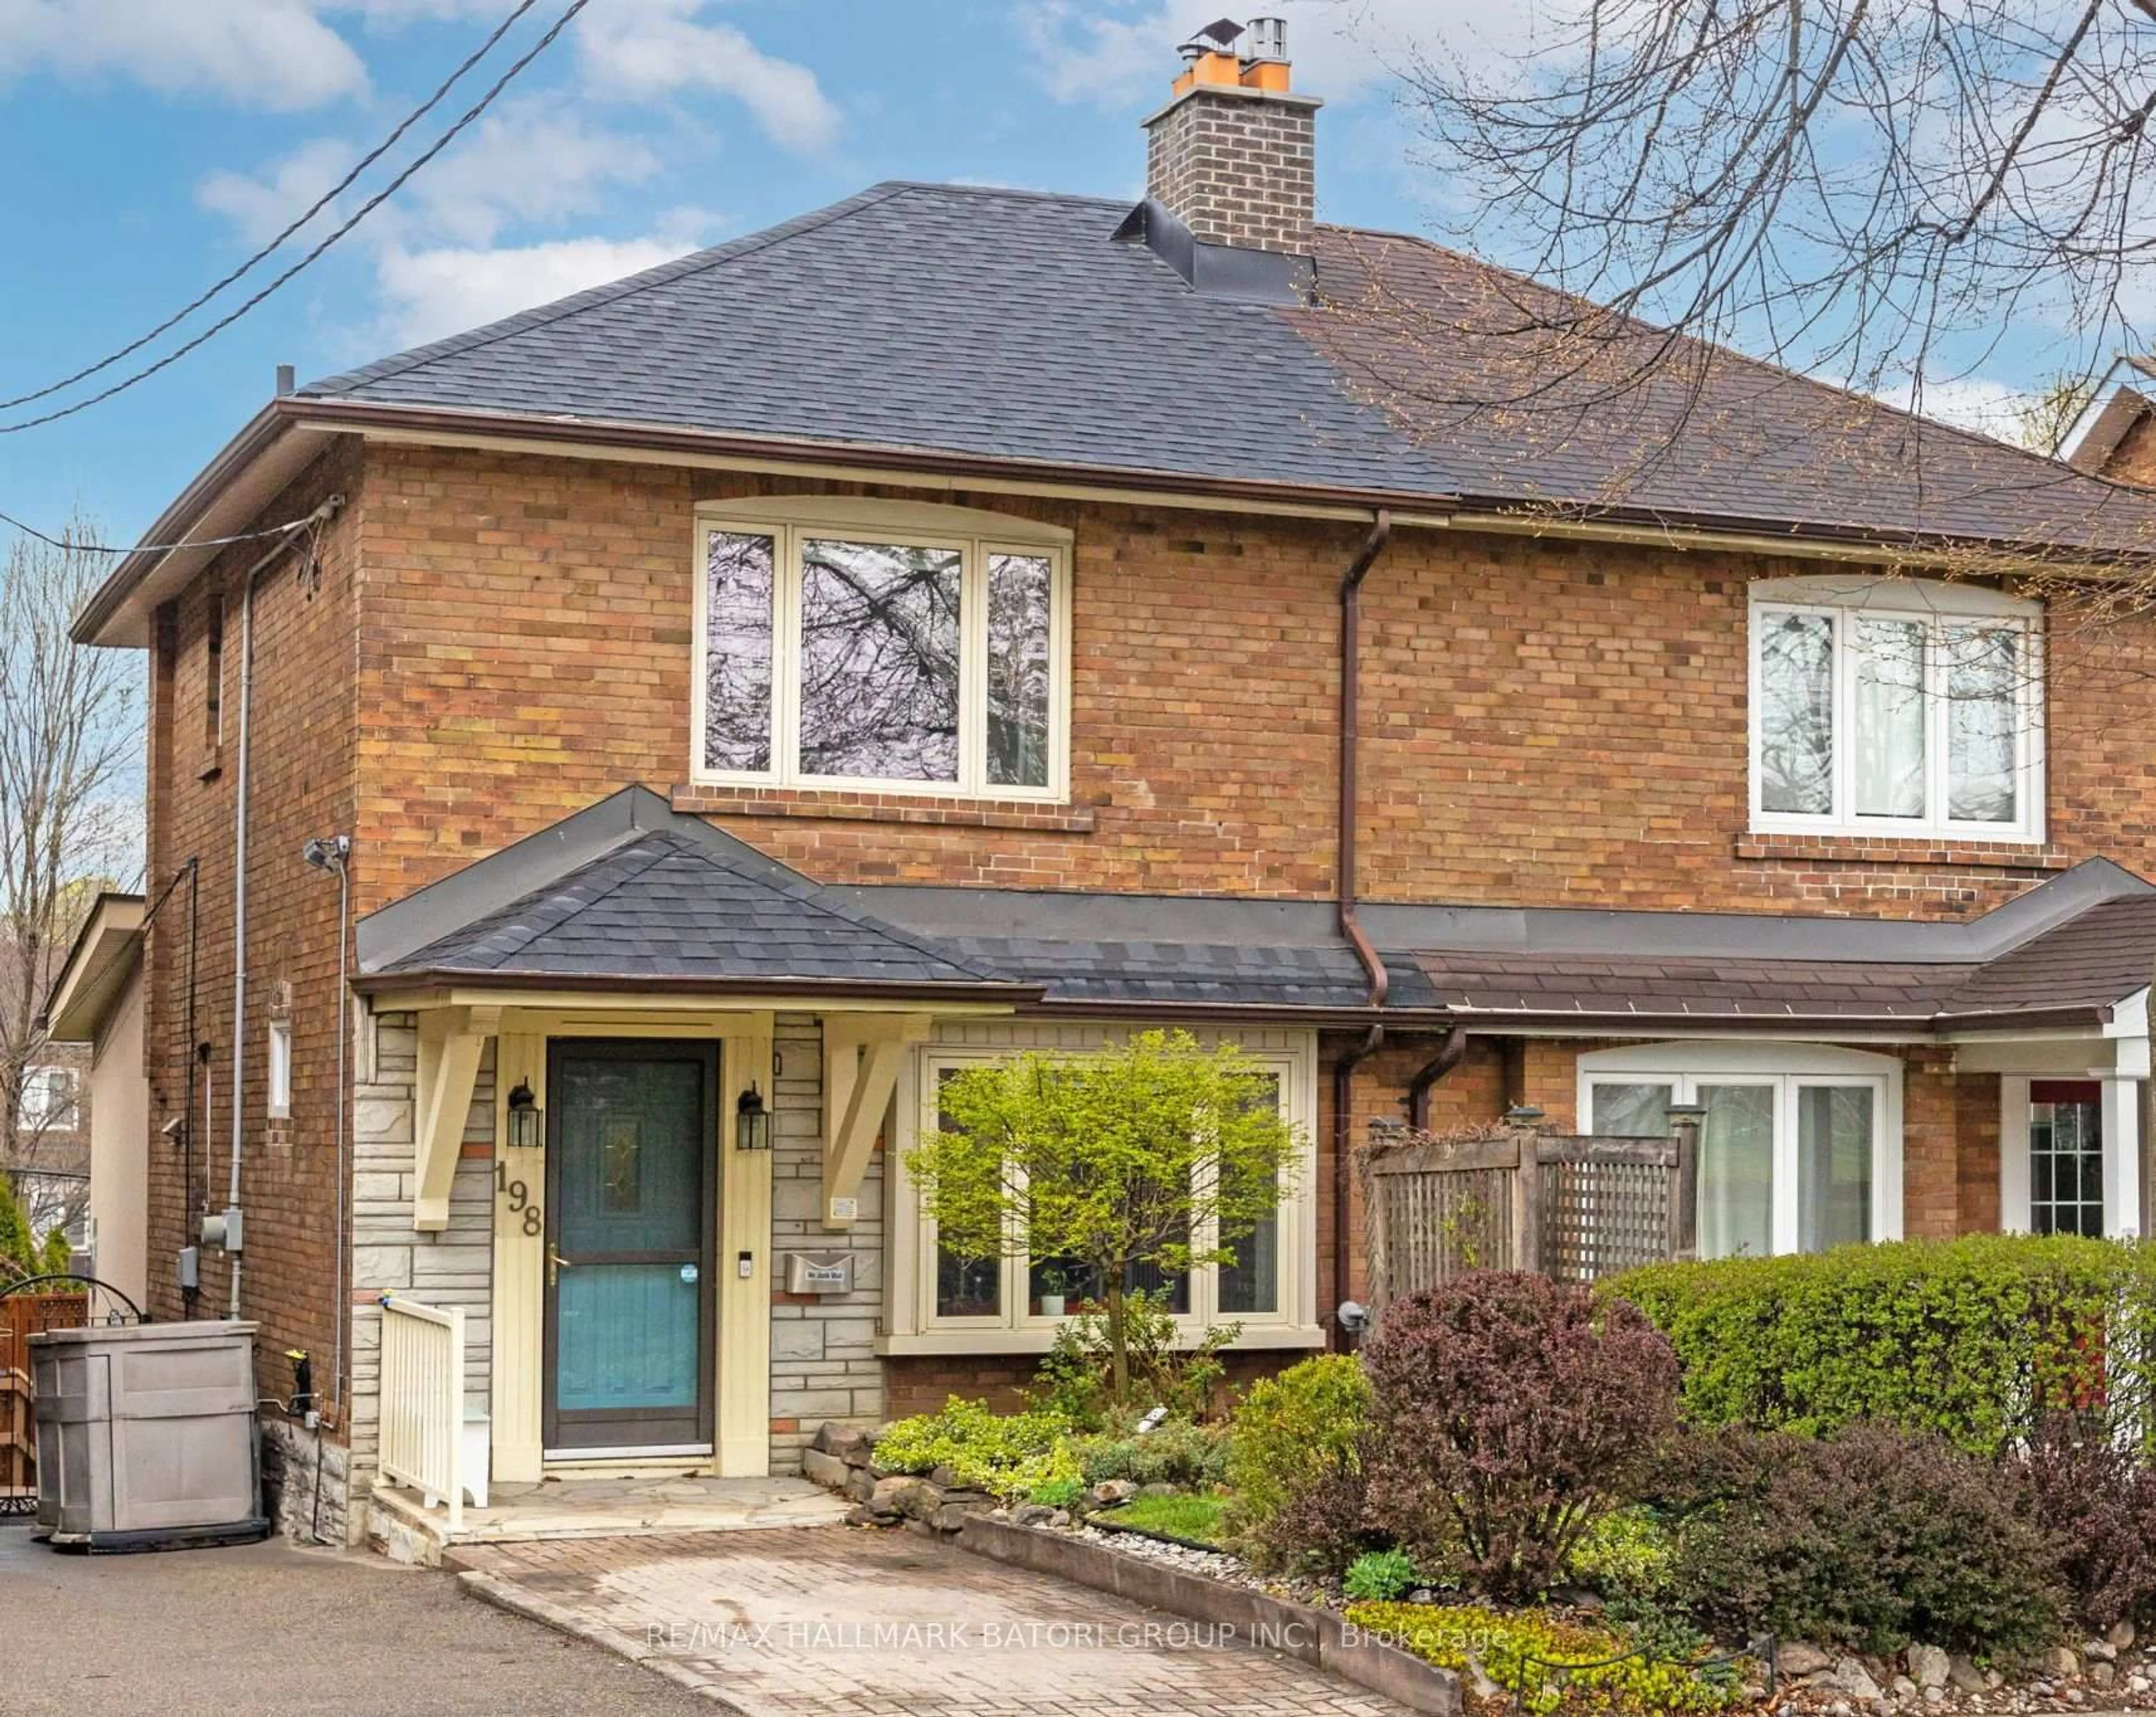
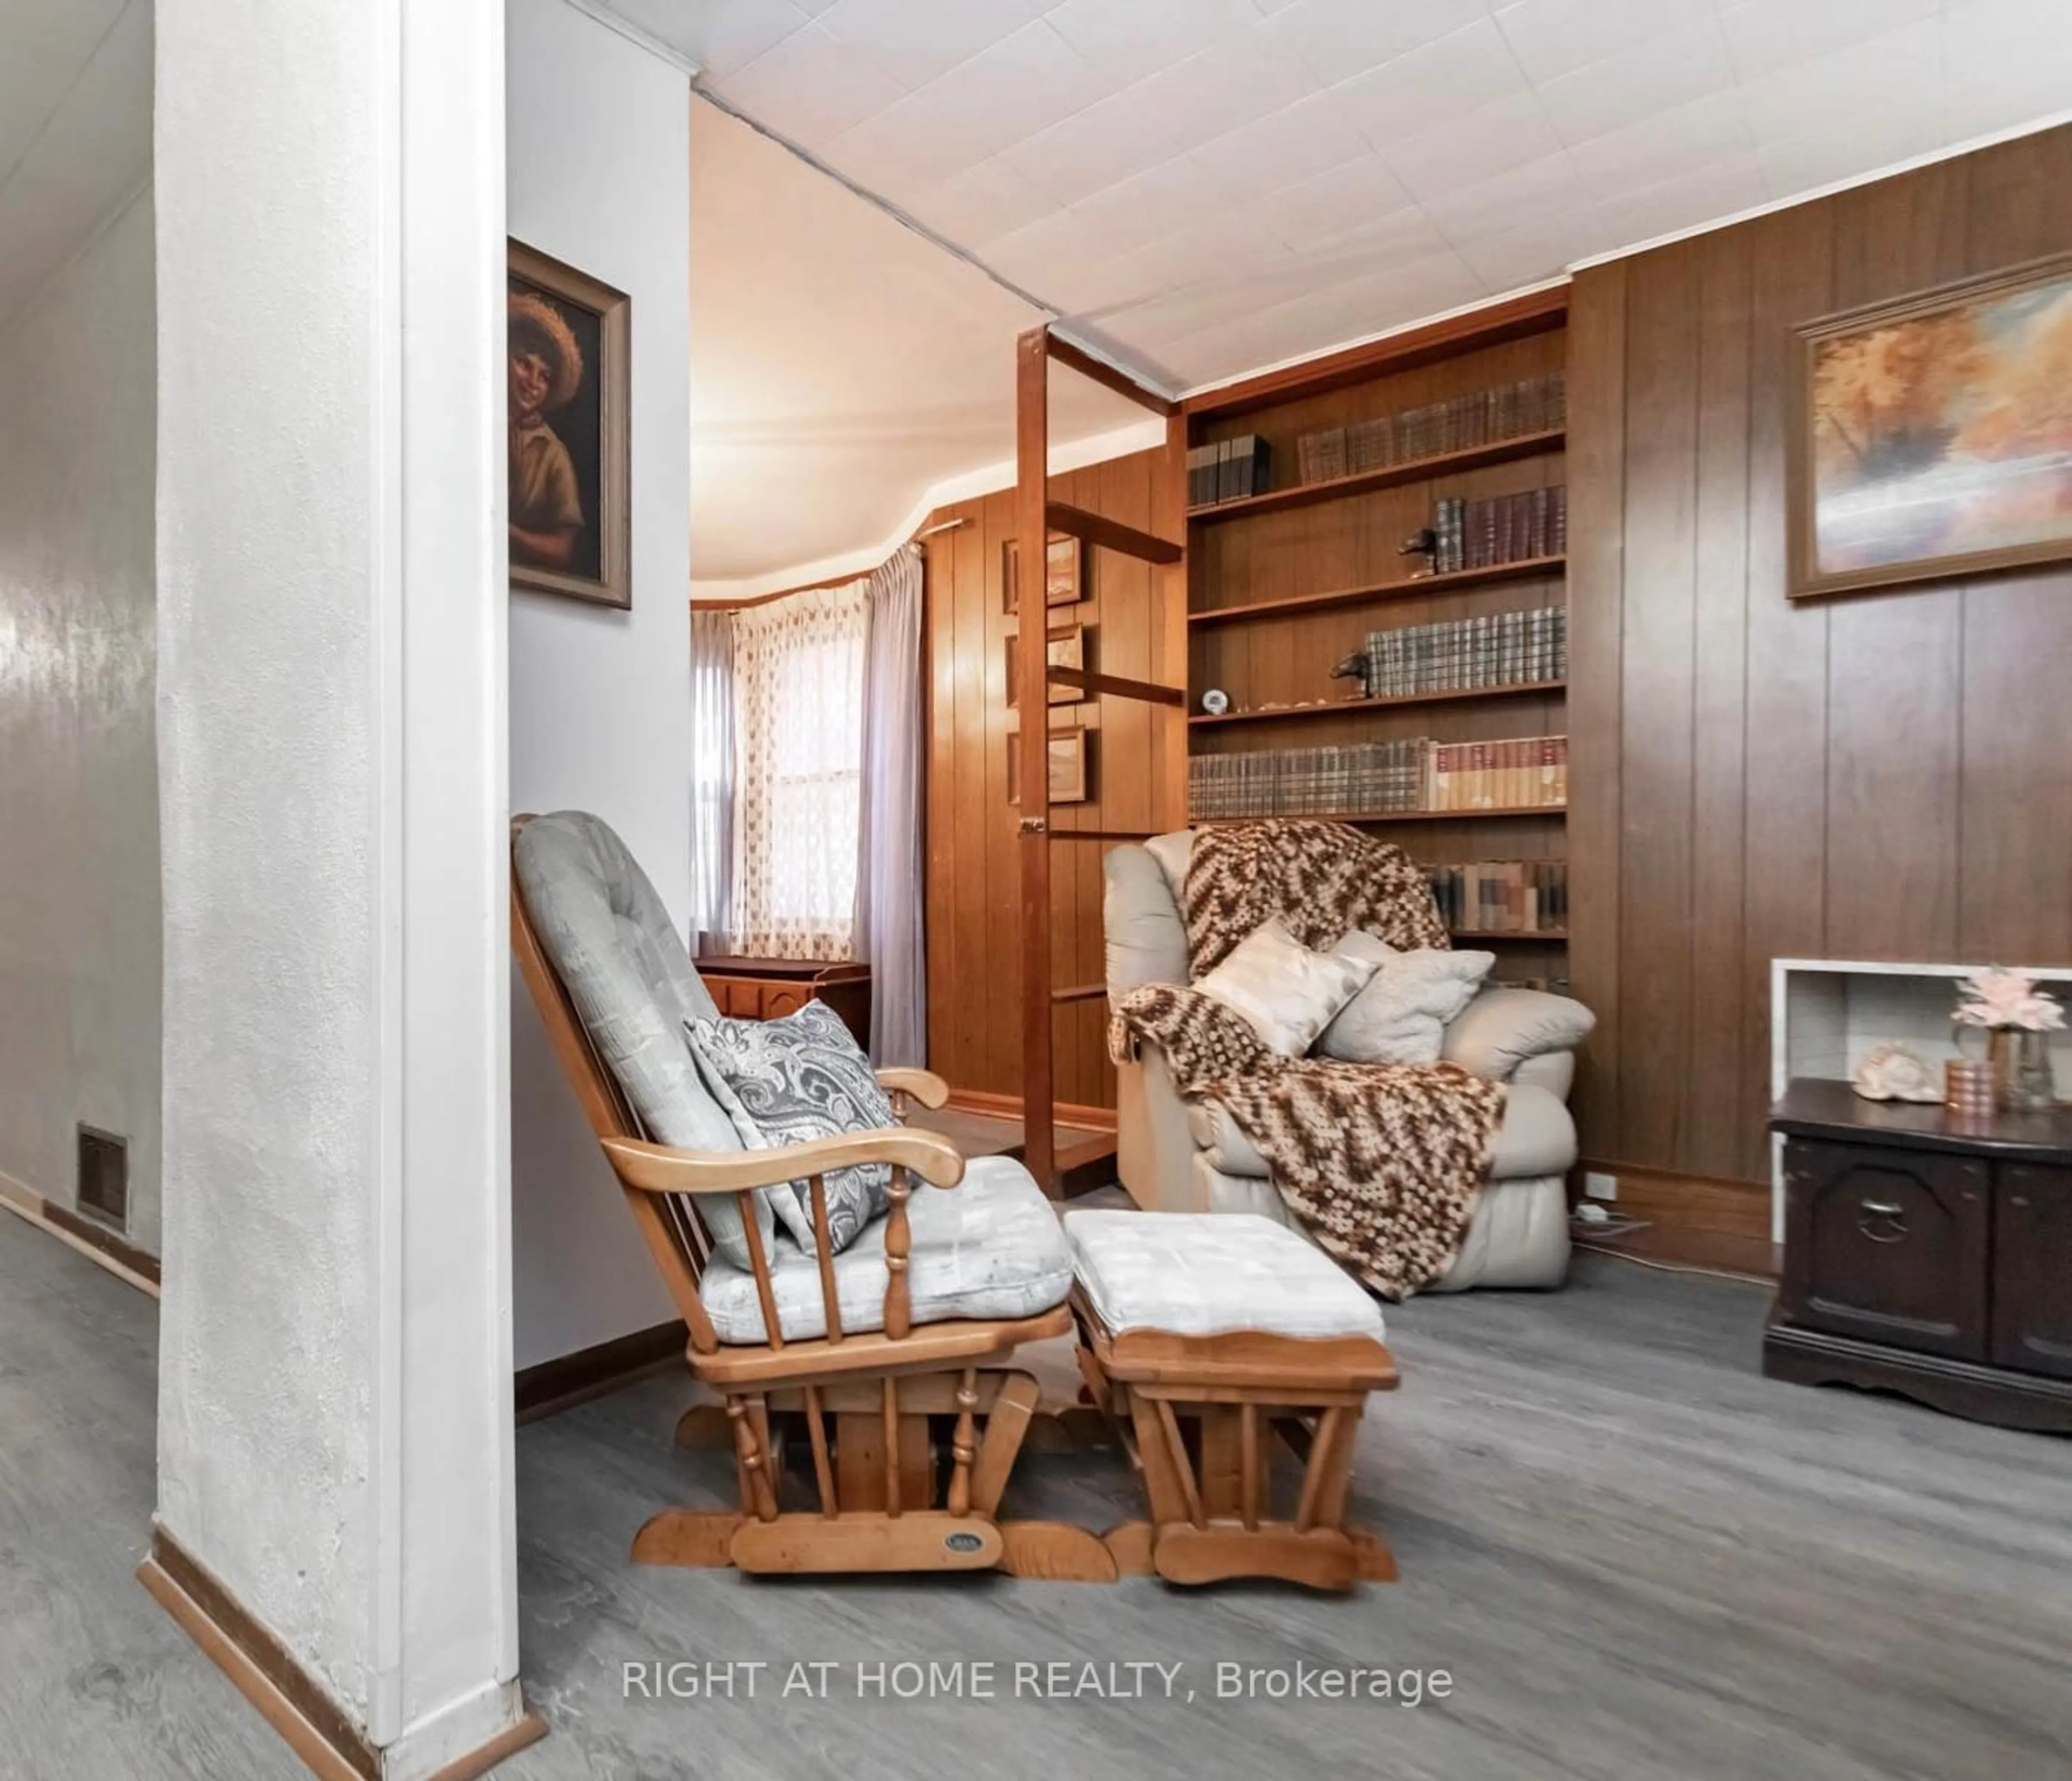
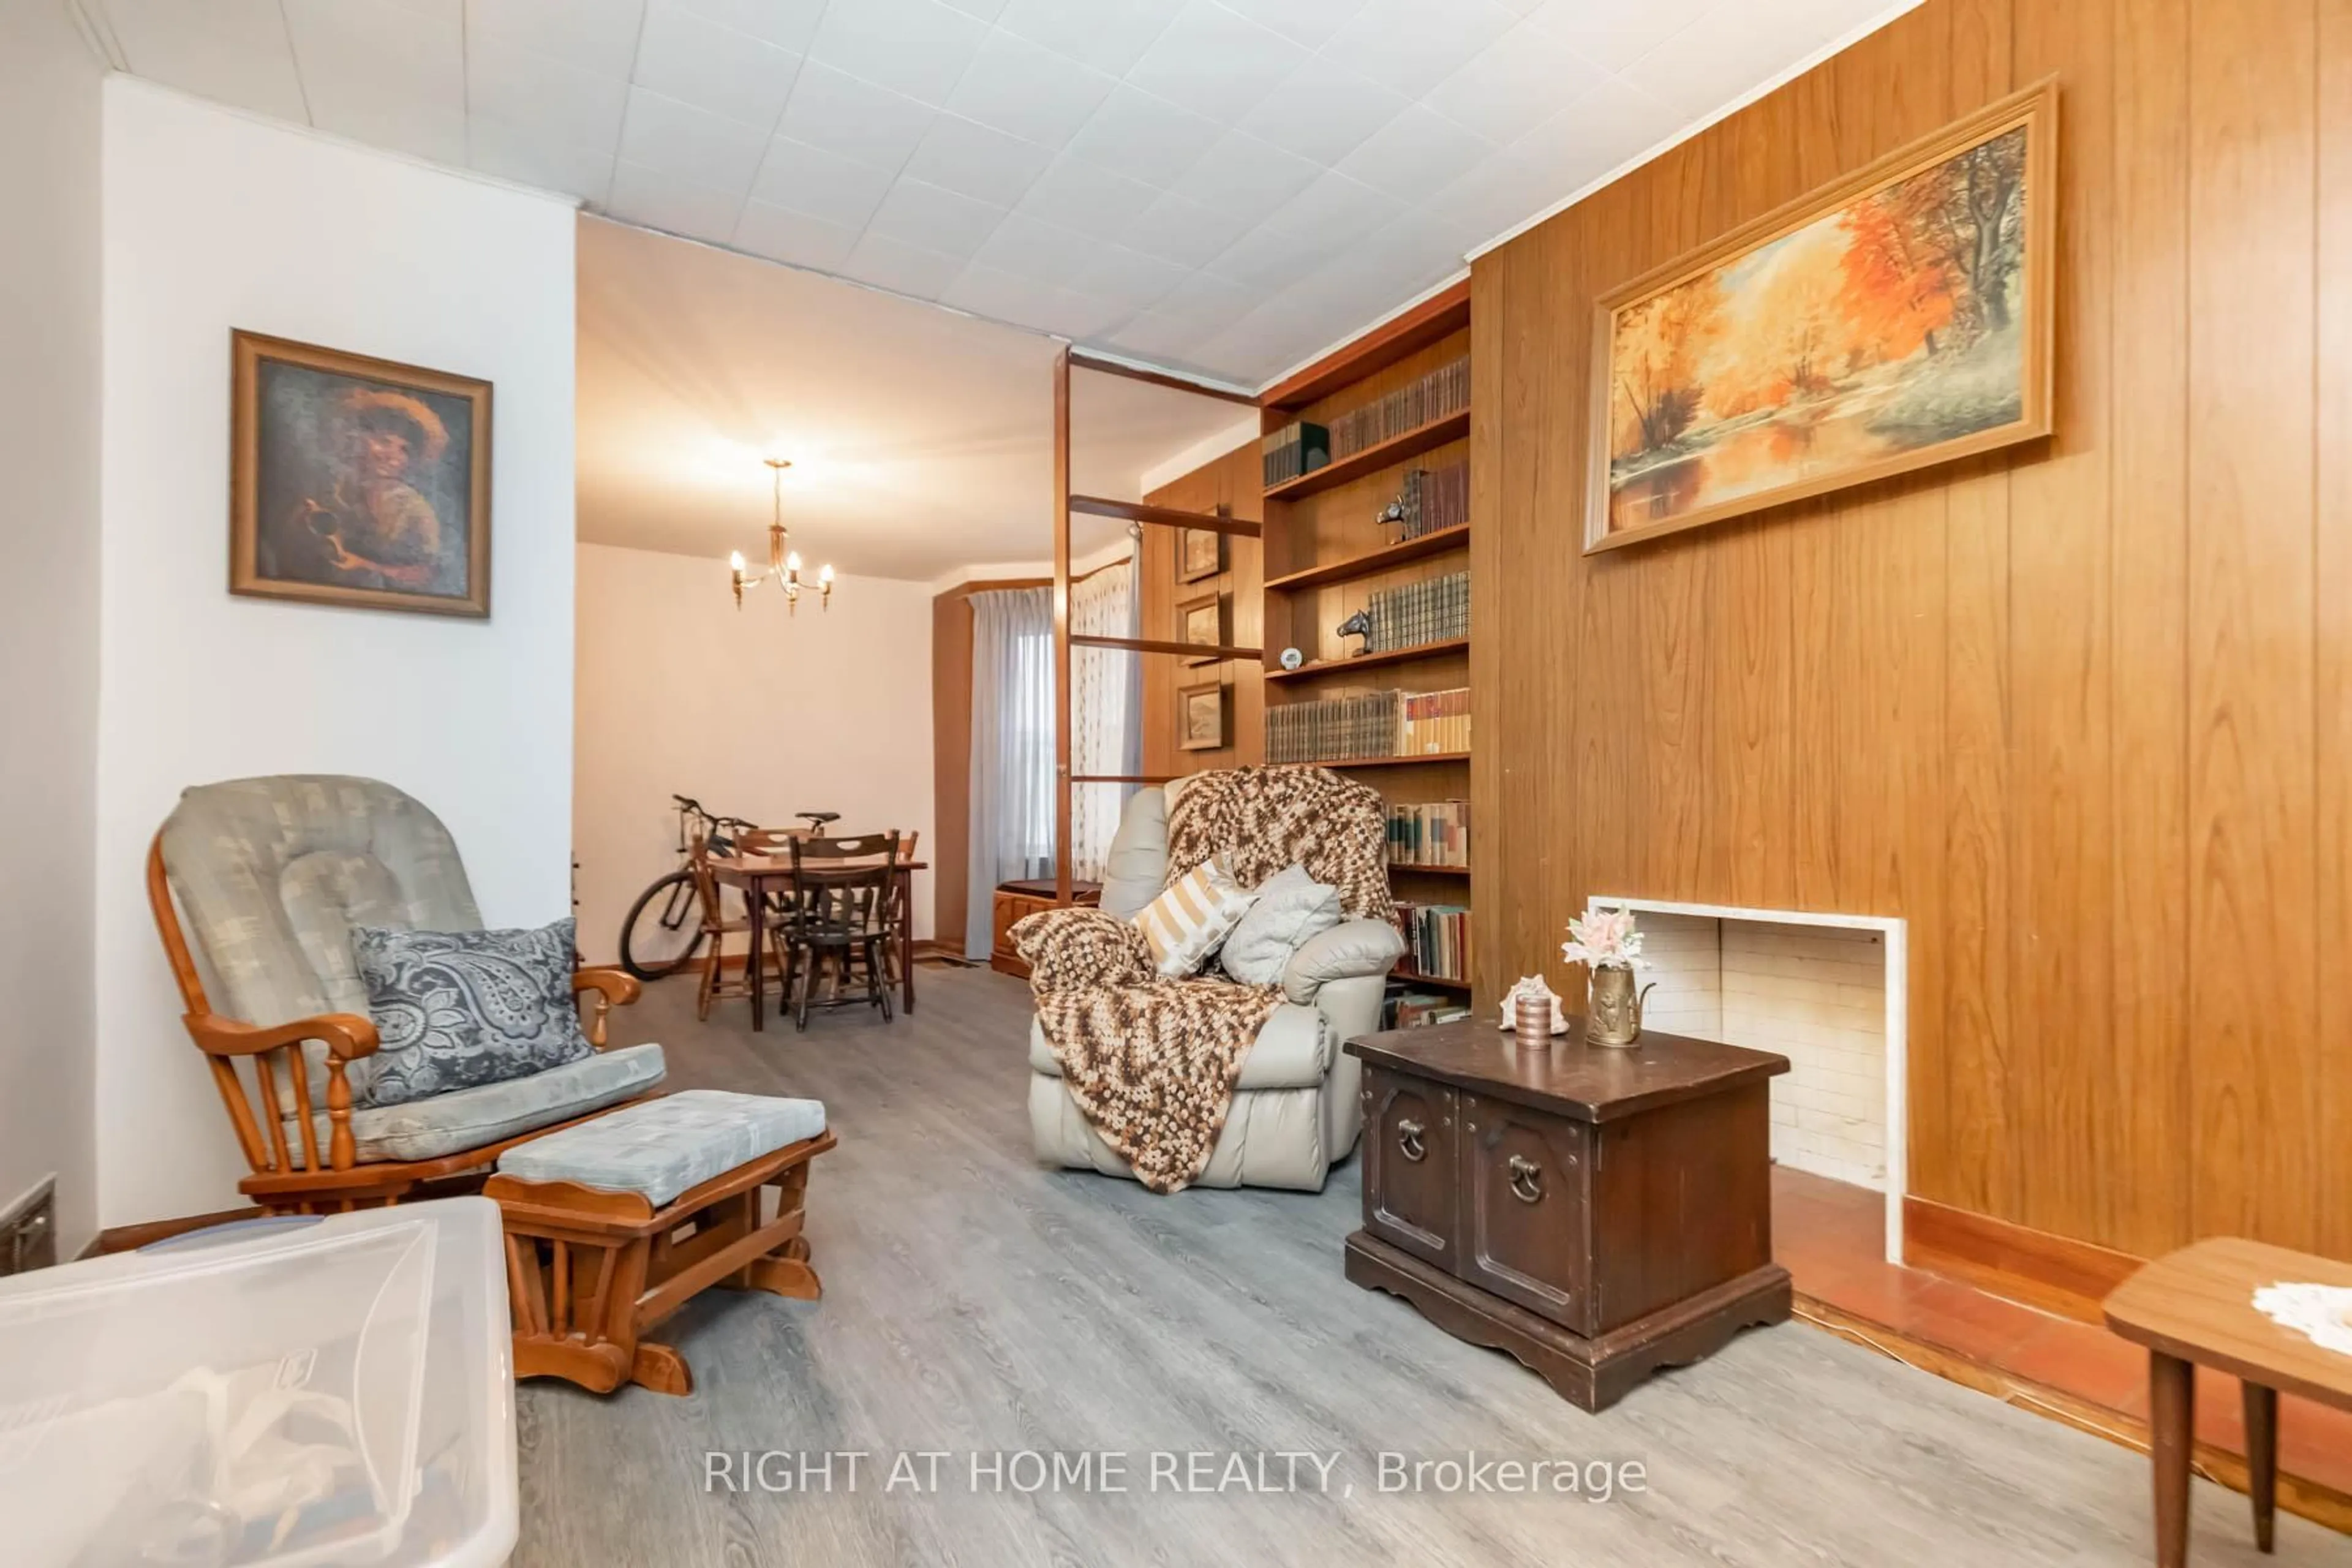
Rare opportunity to live in the heart of Leslieville - one of the most desirable tree lined enclave; 3 bedroom, 2 bath brick home has high ceilings& large principal rooms, some original features have been preserved; hardwood under vinyl in LR & DR; 2 fireplaces (currently non-operational; great opportunity to personalize; large backyard; 1 private parking spot @ rear; steps to shopping, restaurants, shopping, TTC; easy walk to beach;
Property Details
Interior
Features
Main Floor
Living
3.75 x 3.17Vinyl Floor
Dining
4.3 x 3.43Vinyl Floor / Bay Window
Kitchen
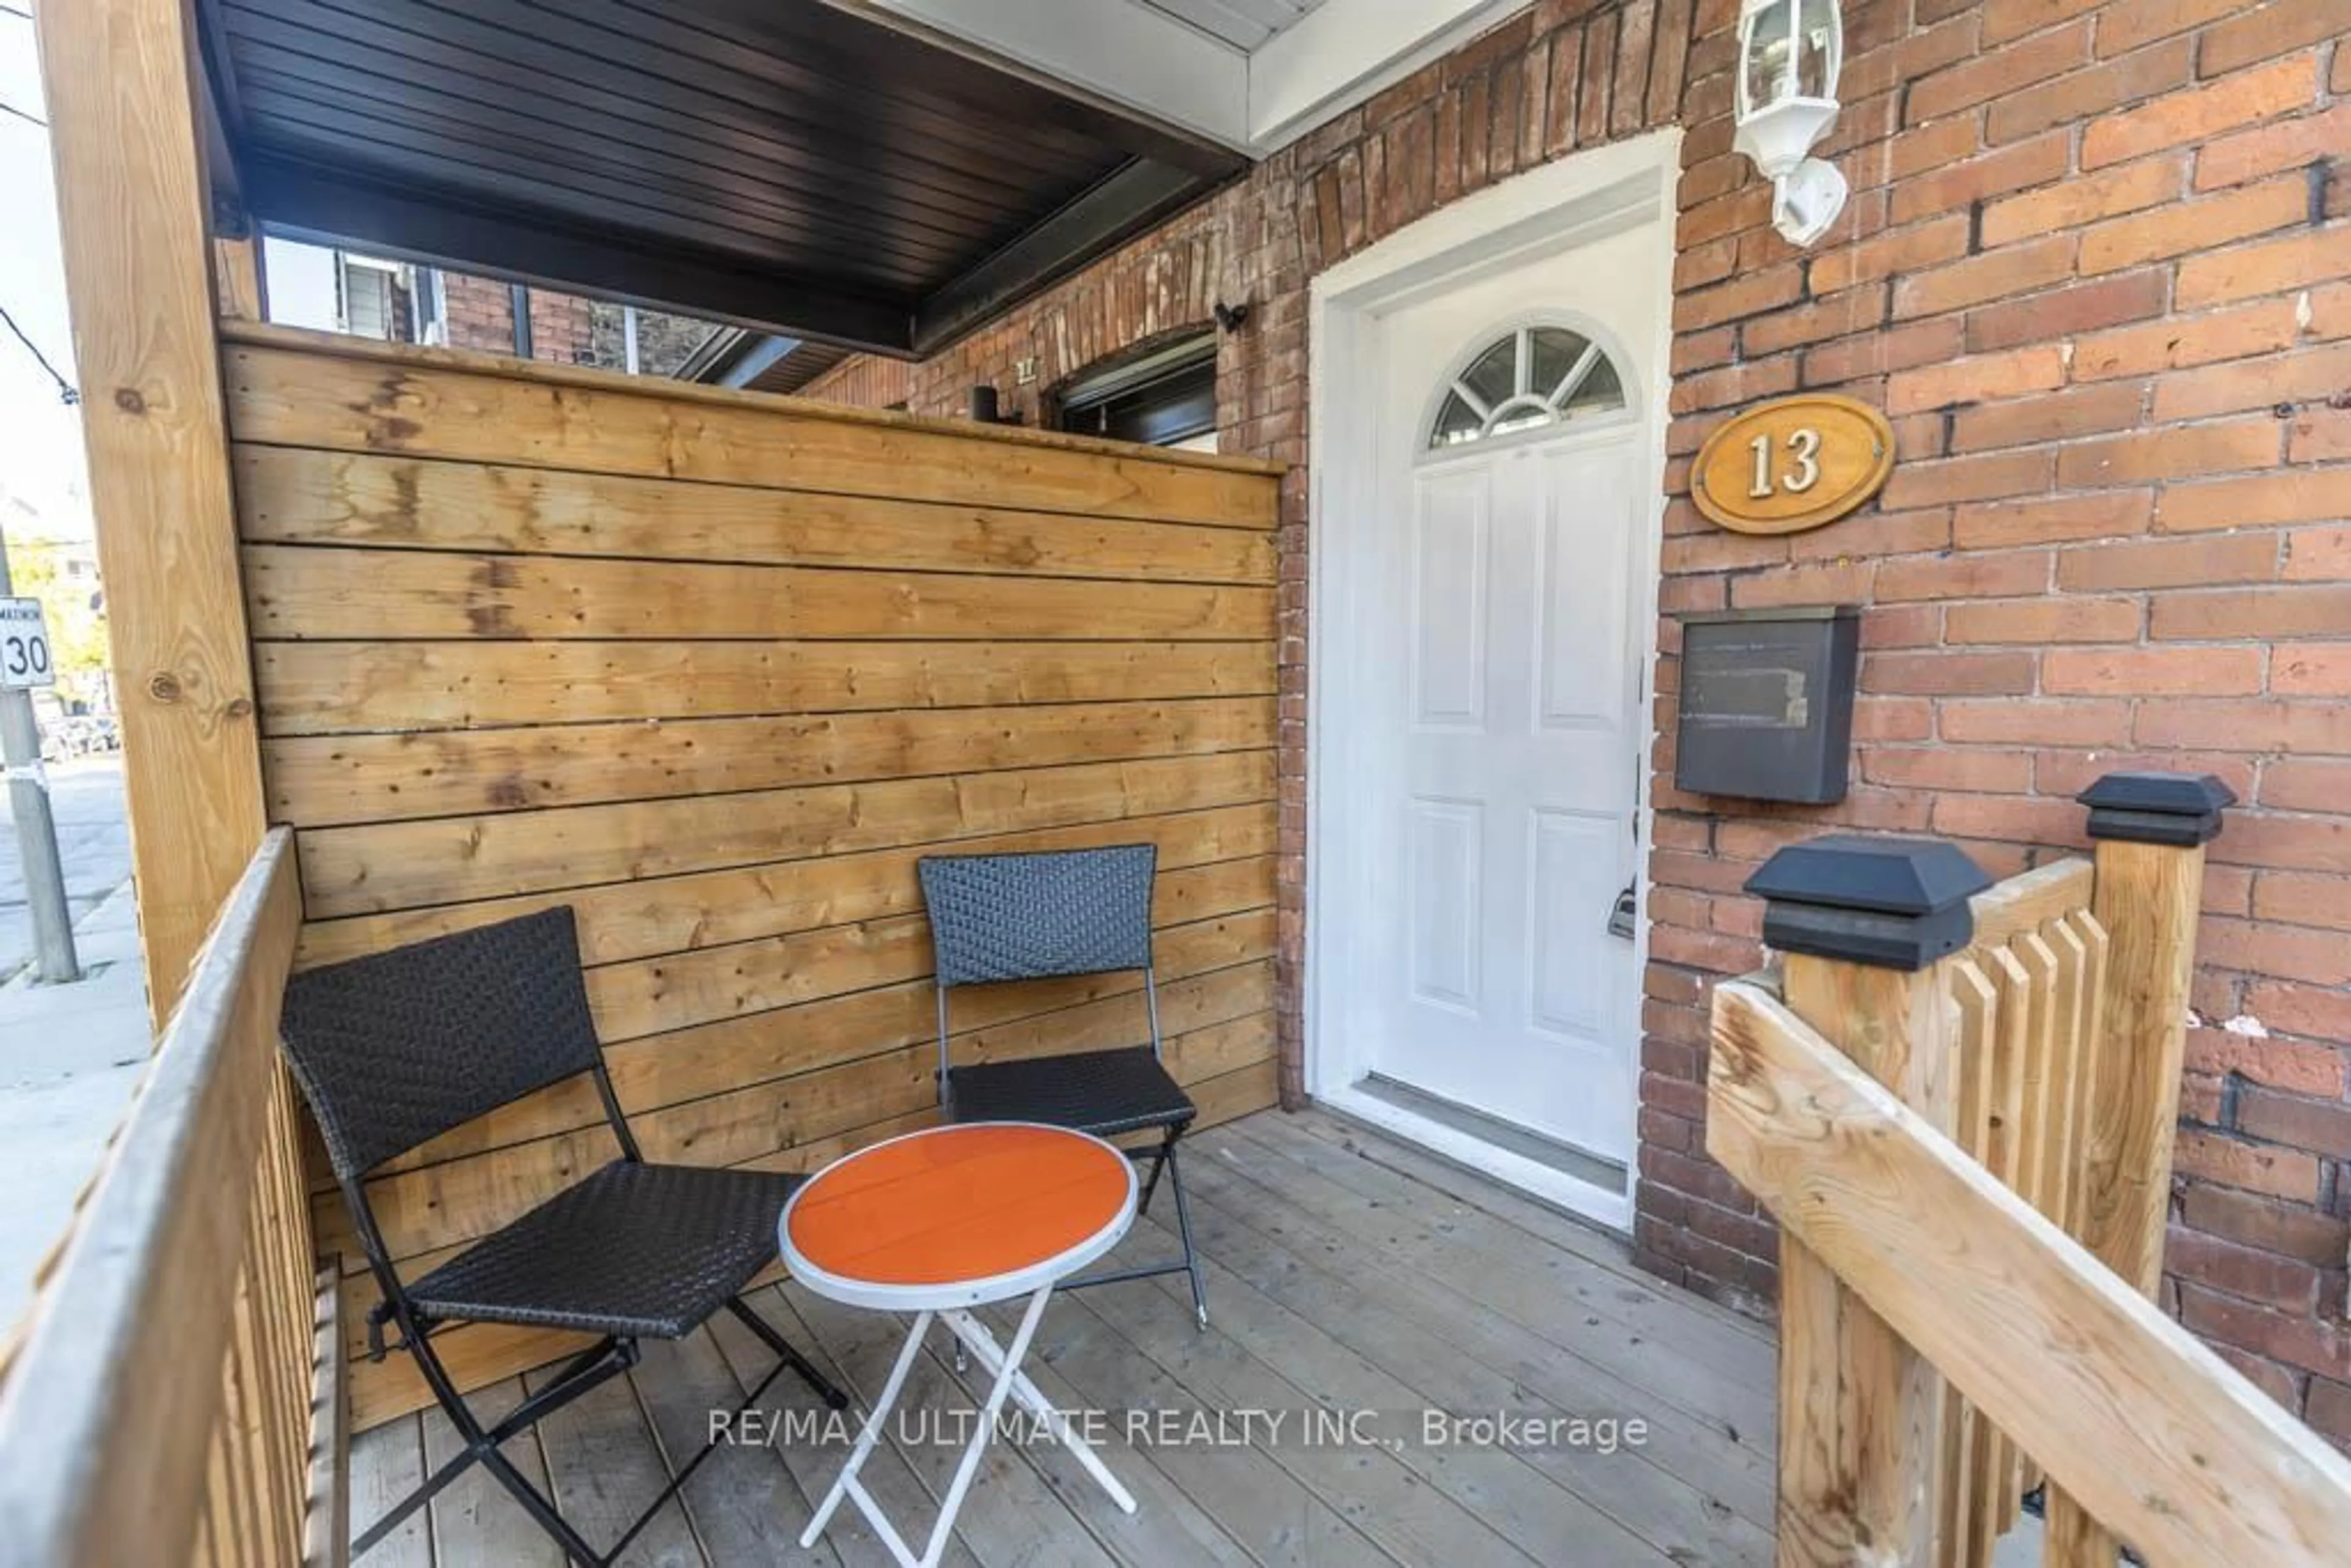
4.65 x 3.692 Pc Bath / W/O To Porch
Exterior
Features
Parking
Garage spaces -
Garage type -
Total parking spaces 1
Property History
 27
27