trreb/IMG-C14096804_0ba764ba5bf1eb103c1ea5c148020a9605403a17a0baf3aa197725e9b348e6a1.jpg
Re-listed 4 days ago

530 Richmond St, Toronto, Ontario M5V 1Y4

Other
-
-
~2224 sqft
$•••,•••
$1,349,000
Get pre-qualifiedPowered by nesto
Other
-
-
~2224 sqft

Contact us about this property

Call

Highlights

Property Estimate

Days on market4 days

Total days on market
75 days

Estimated valueNot available

Price/Sqft$606/sqft

Monthly cost

Open Calculator

Description

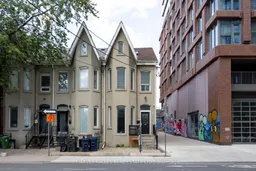
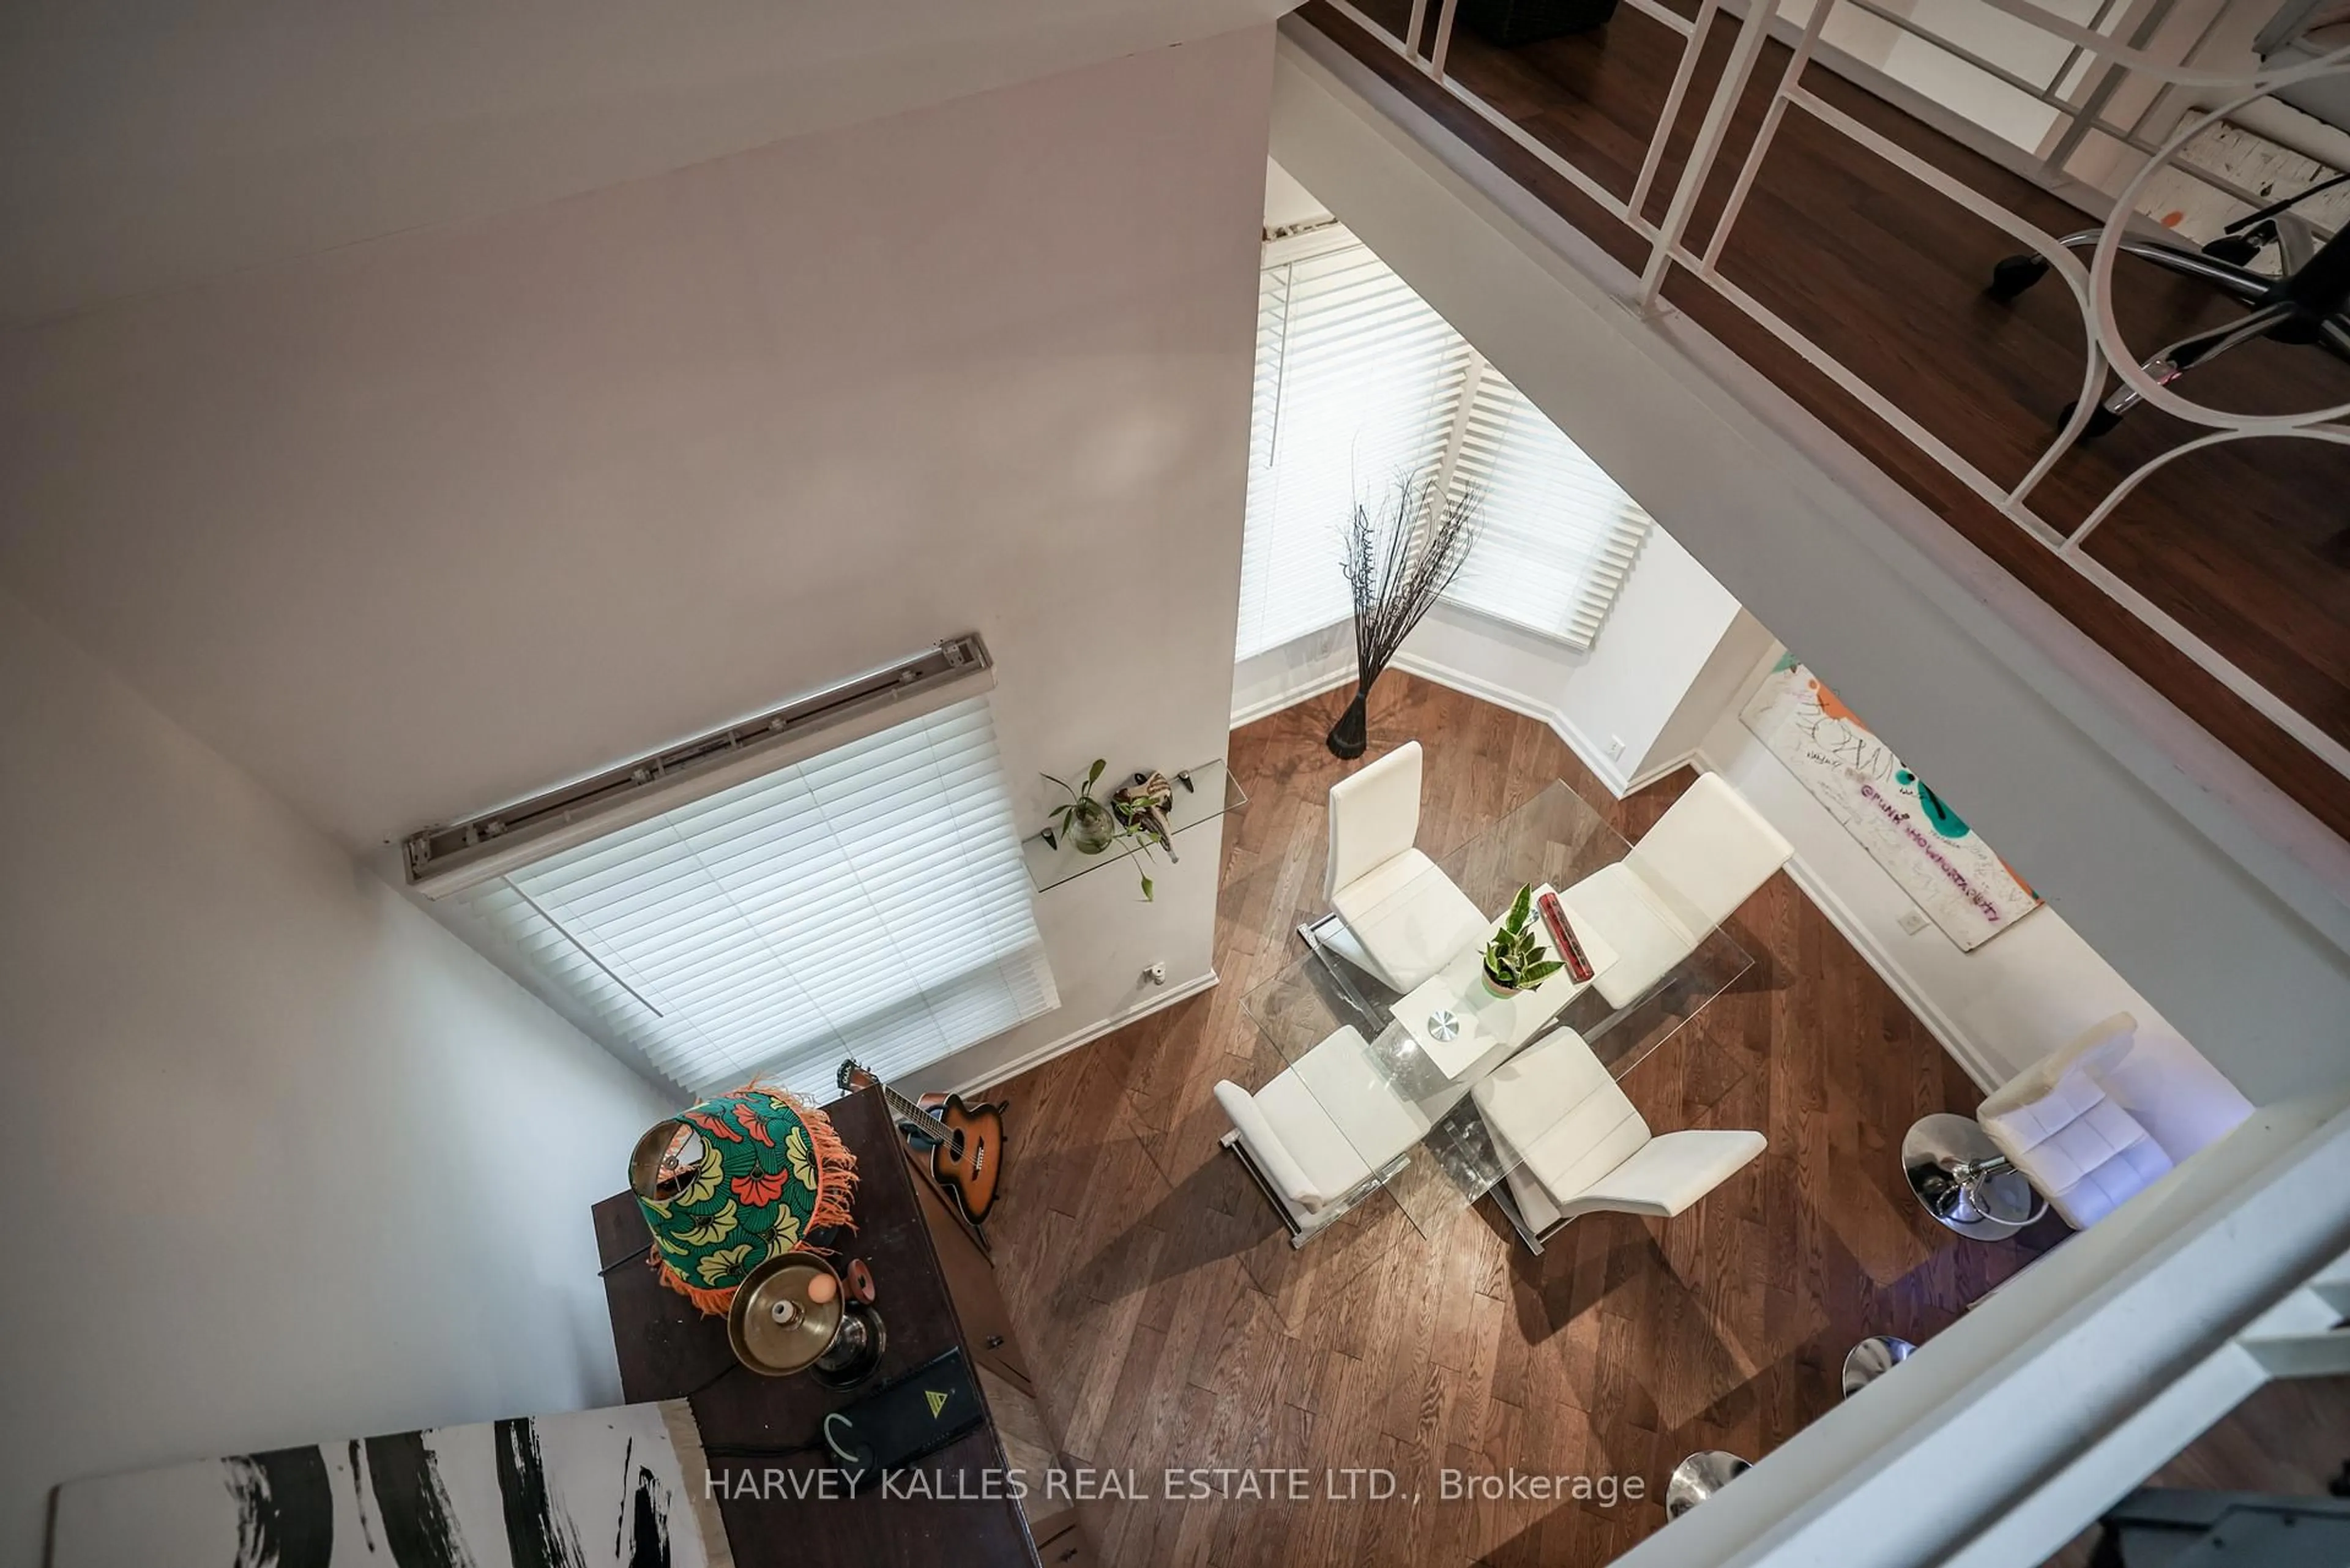
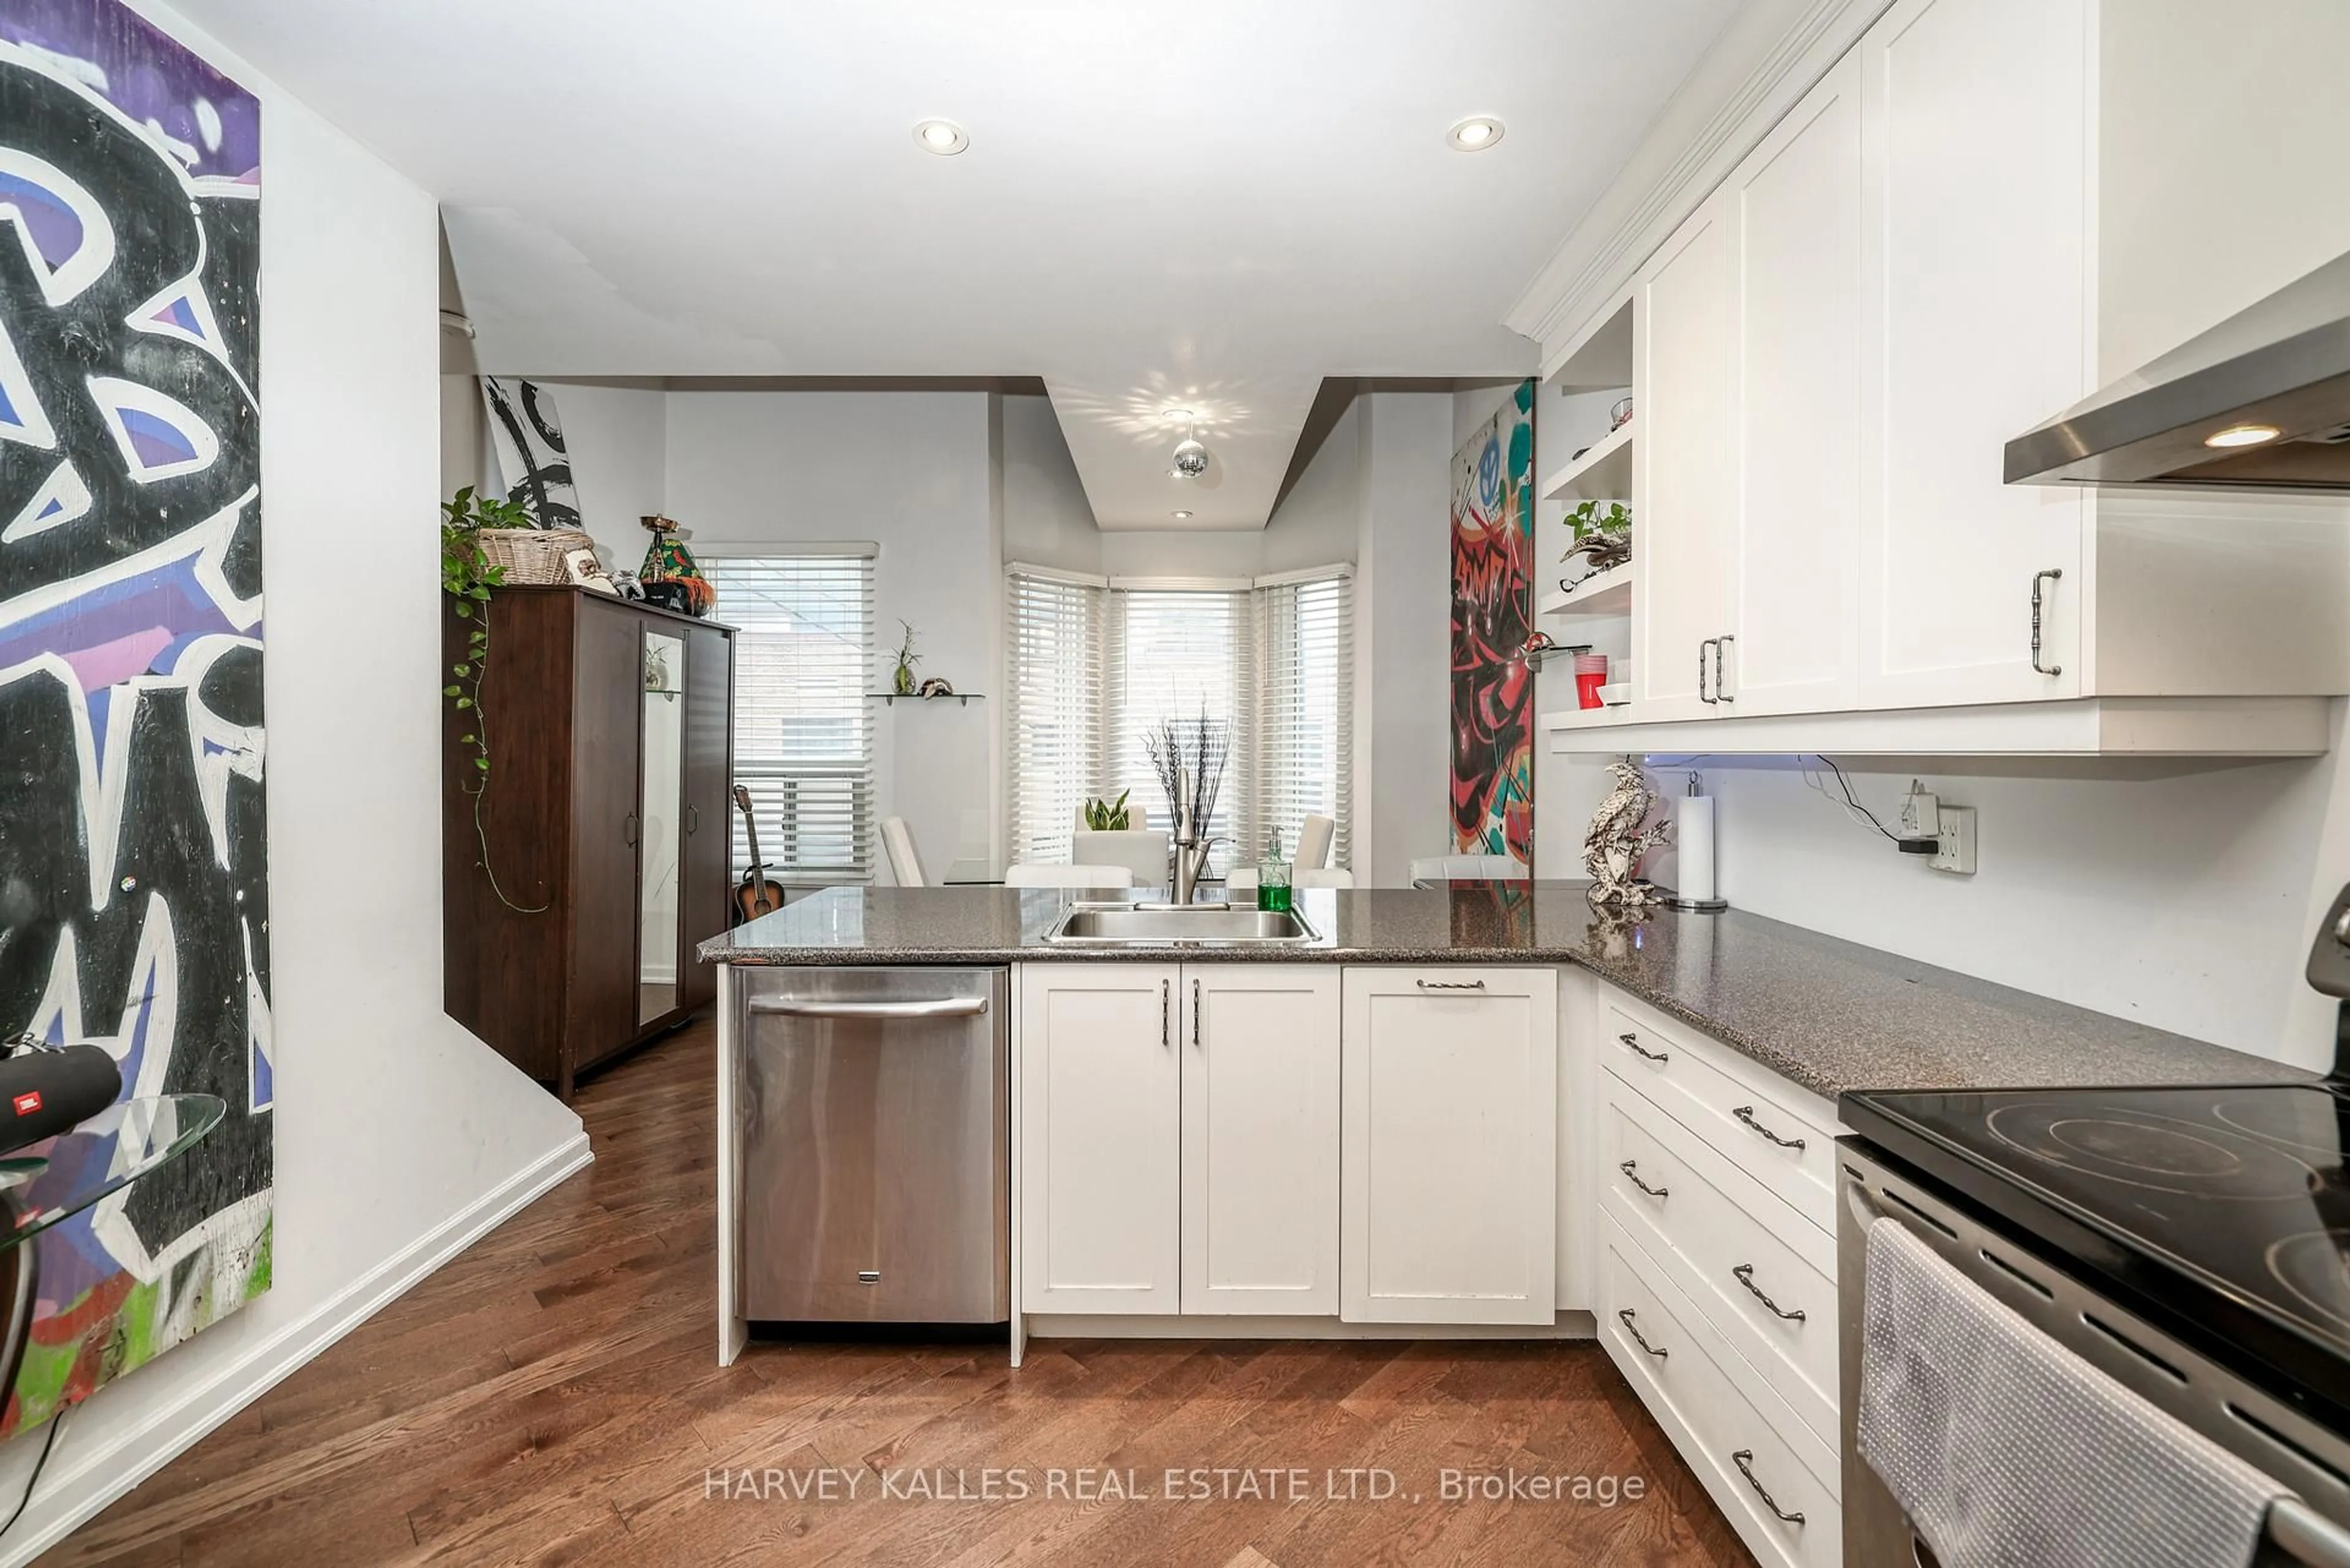
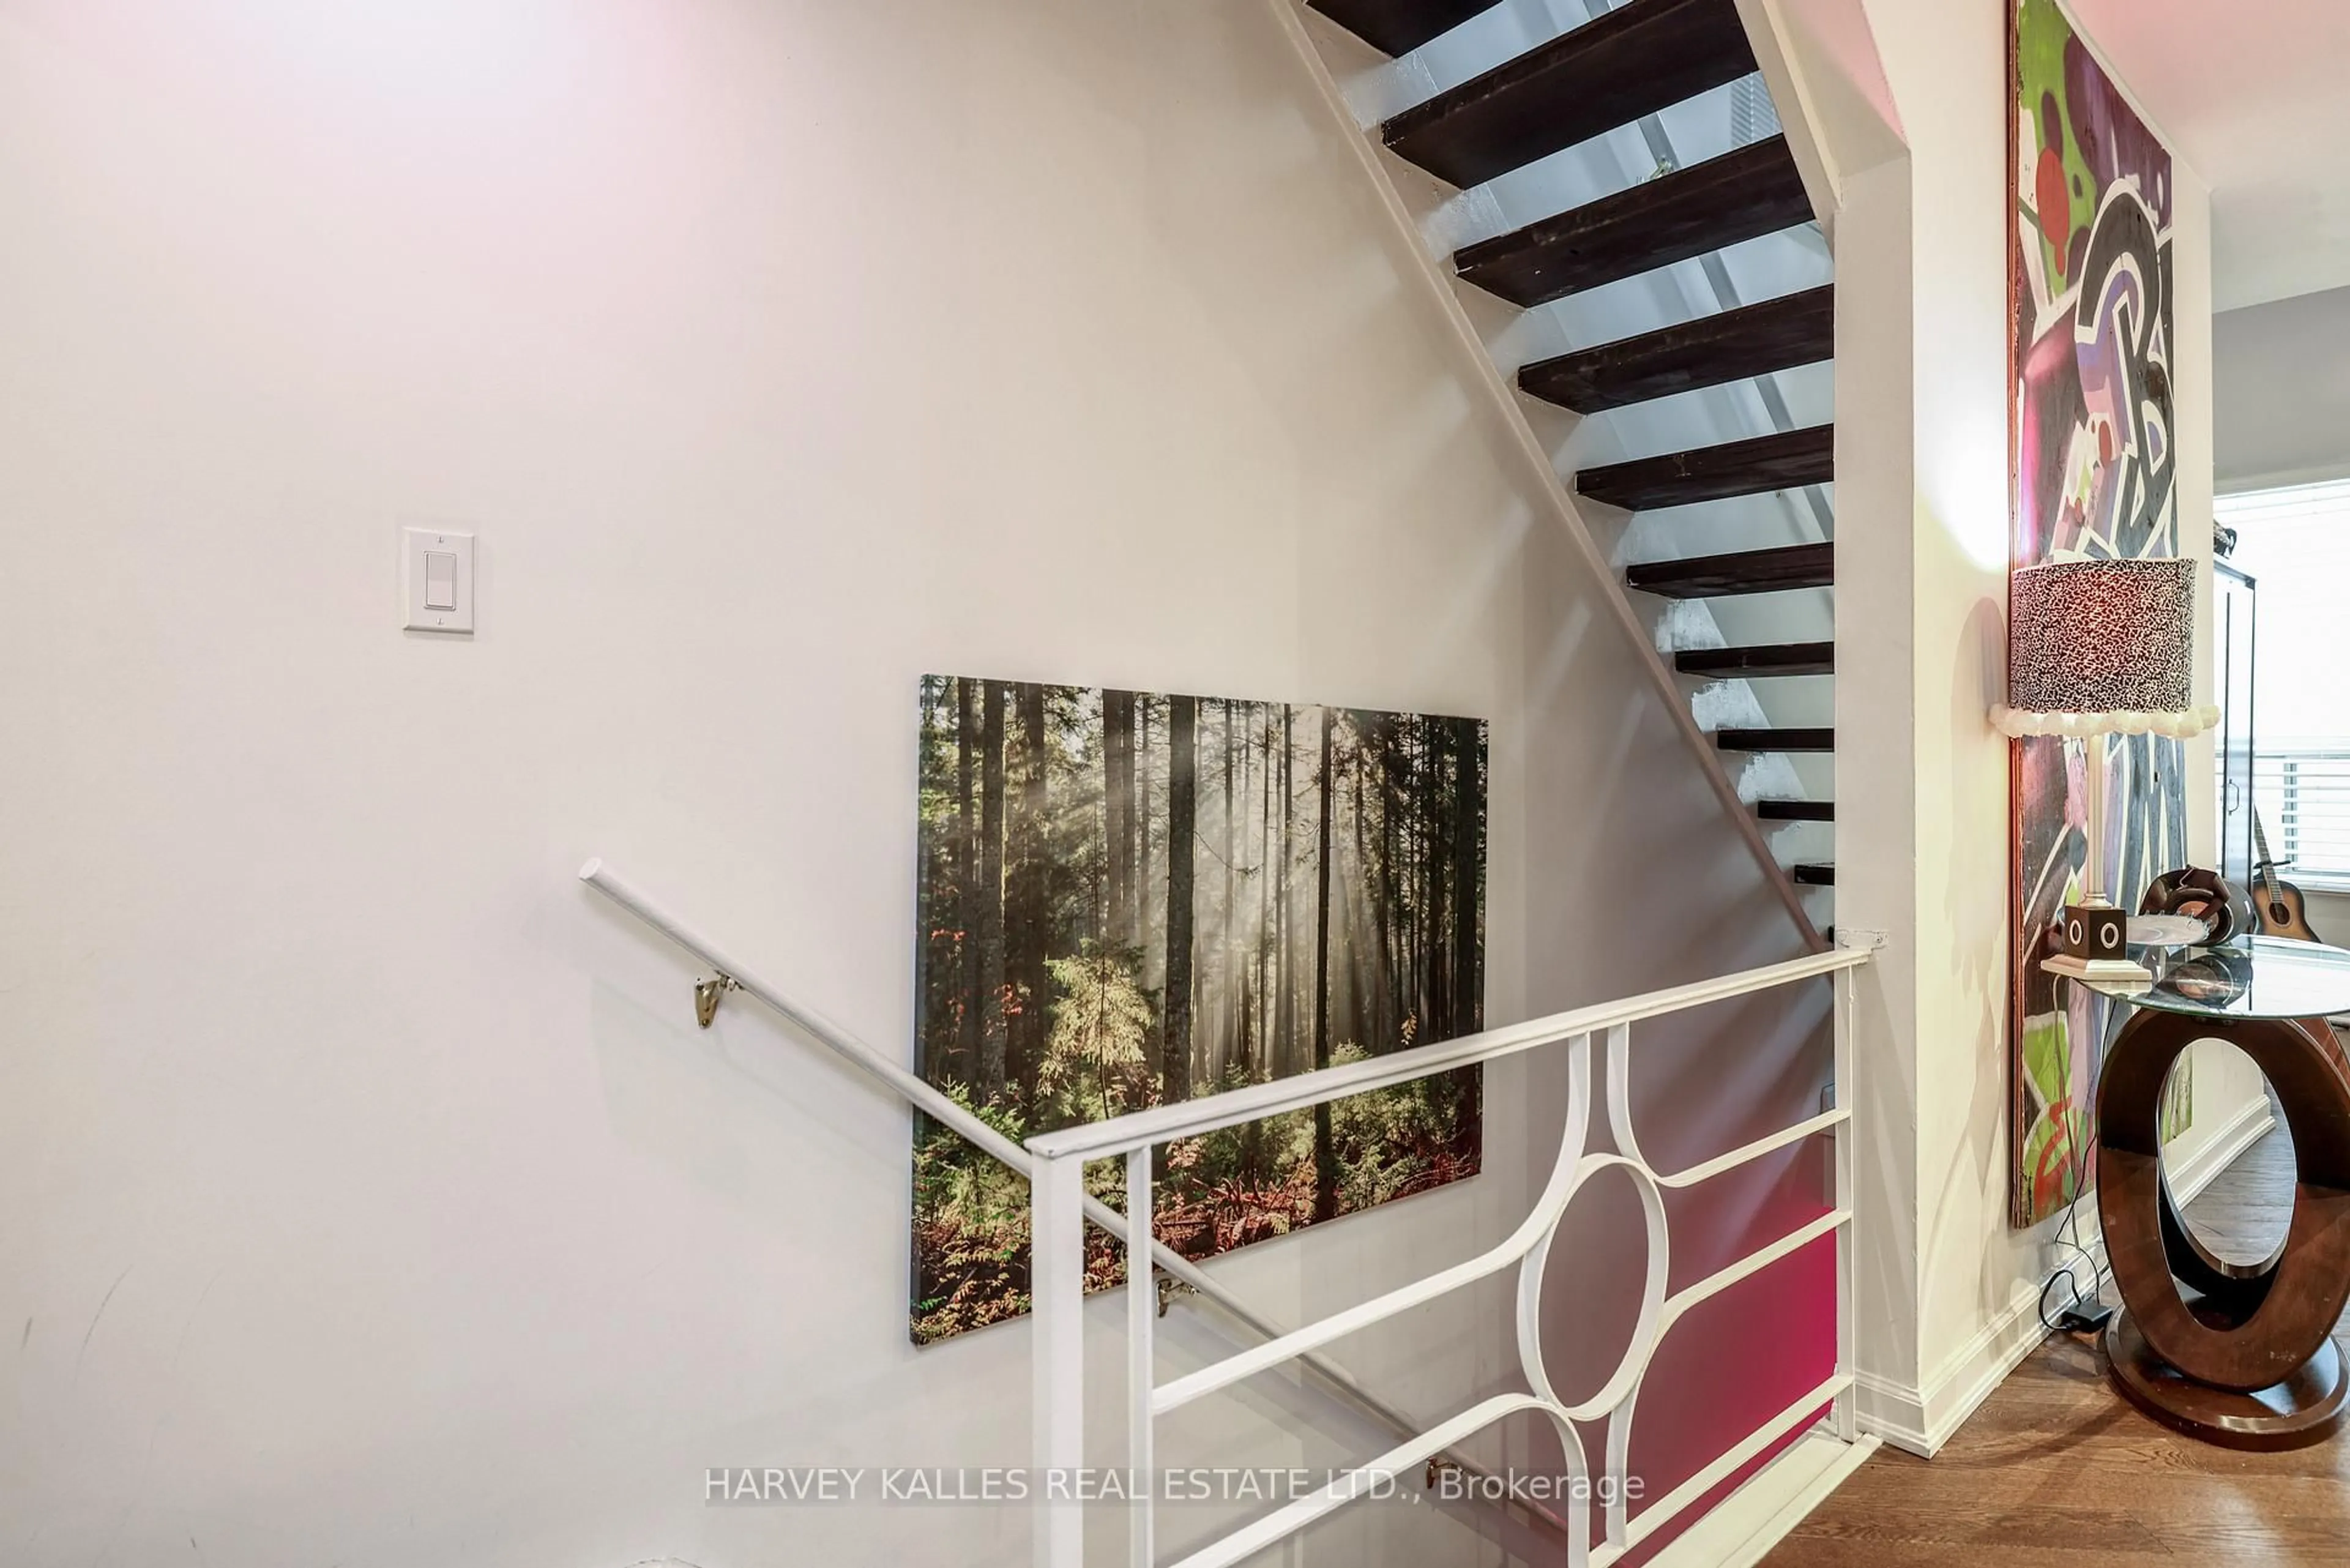
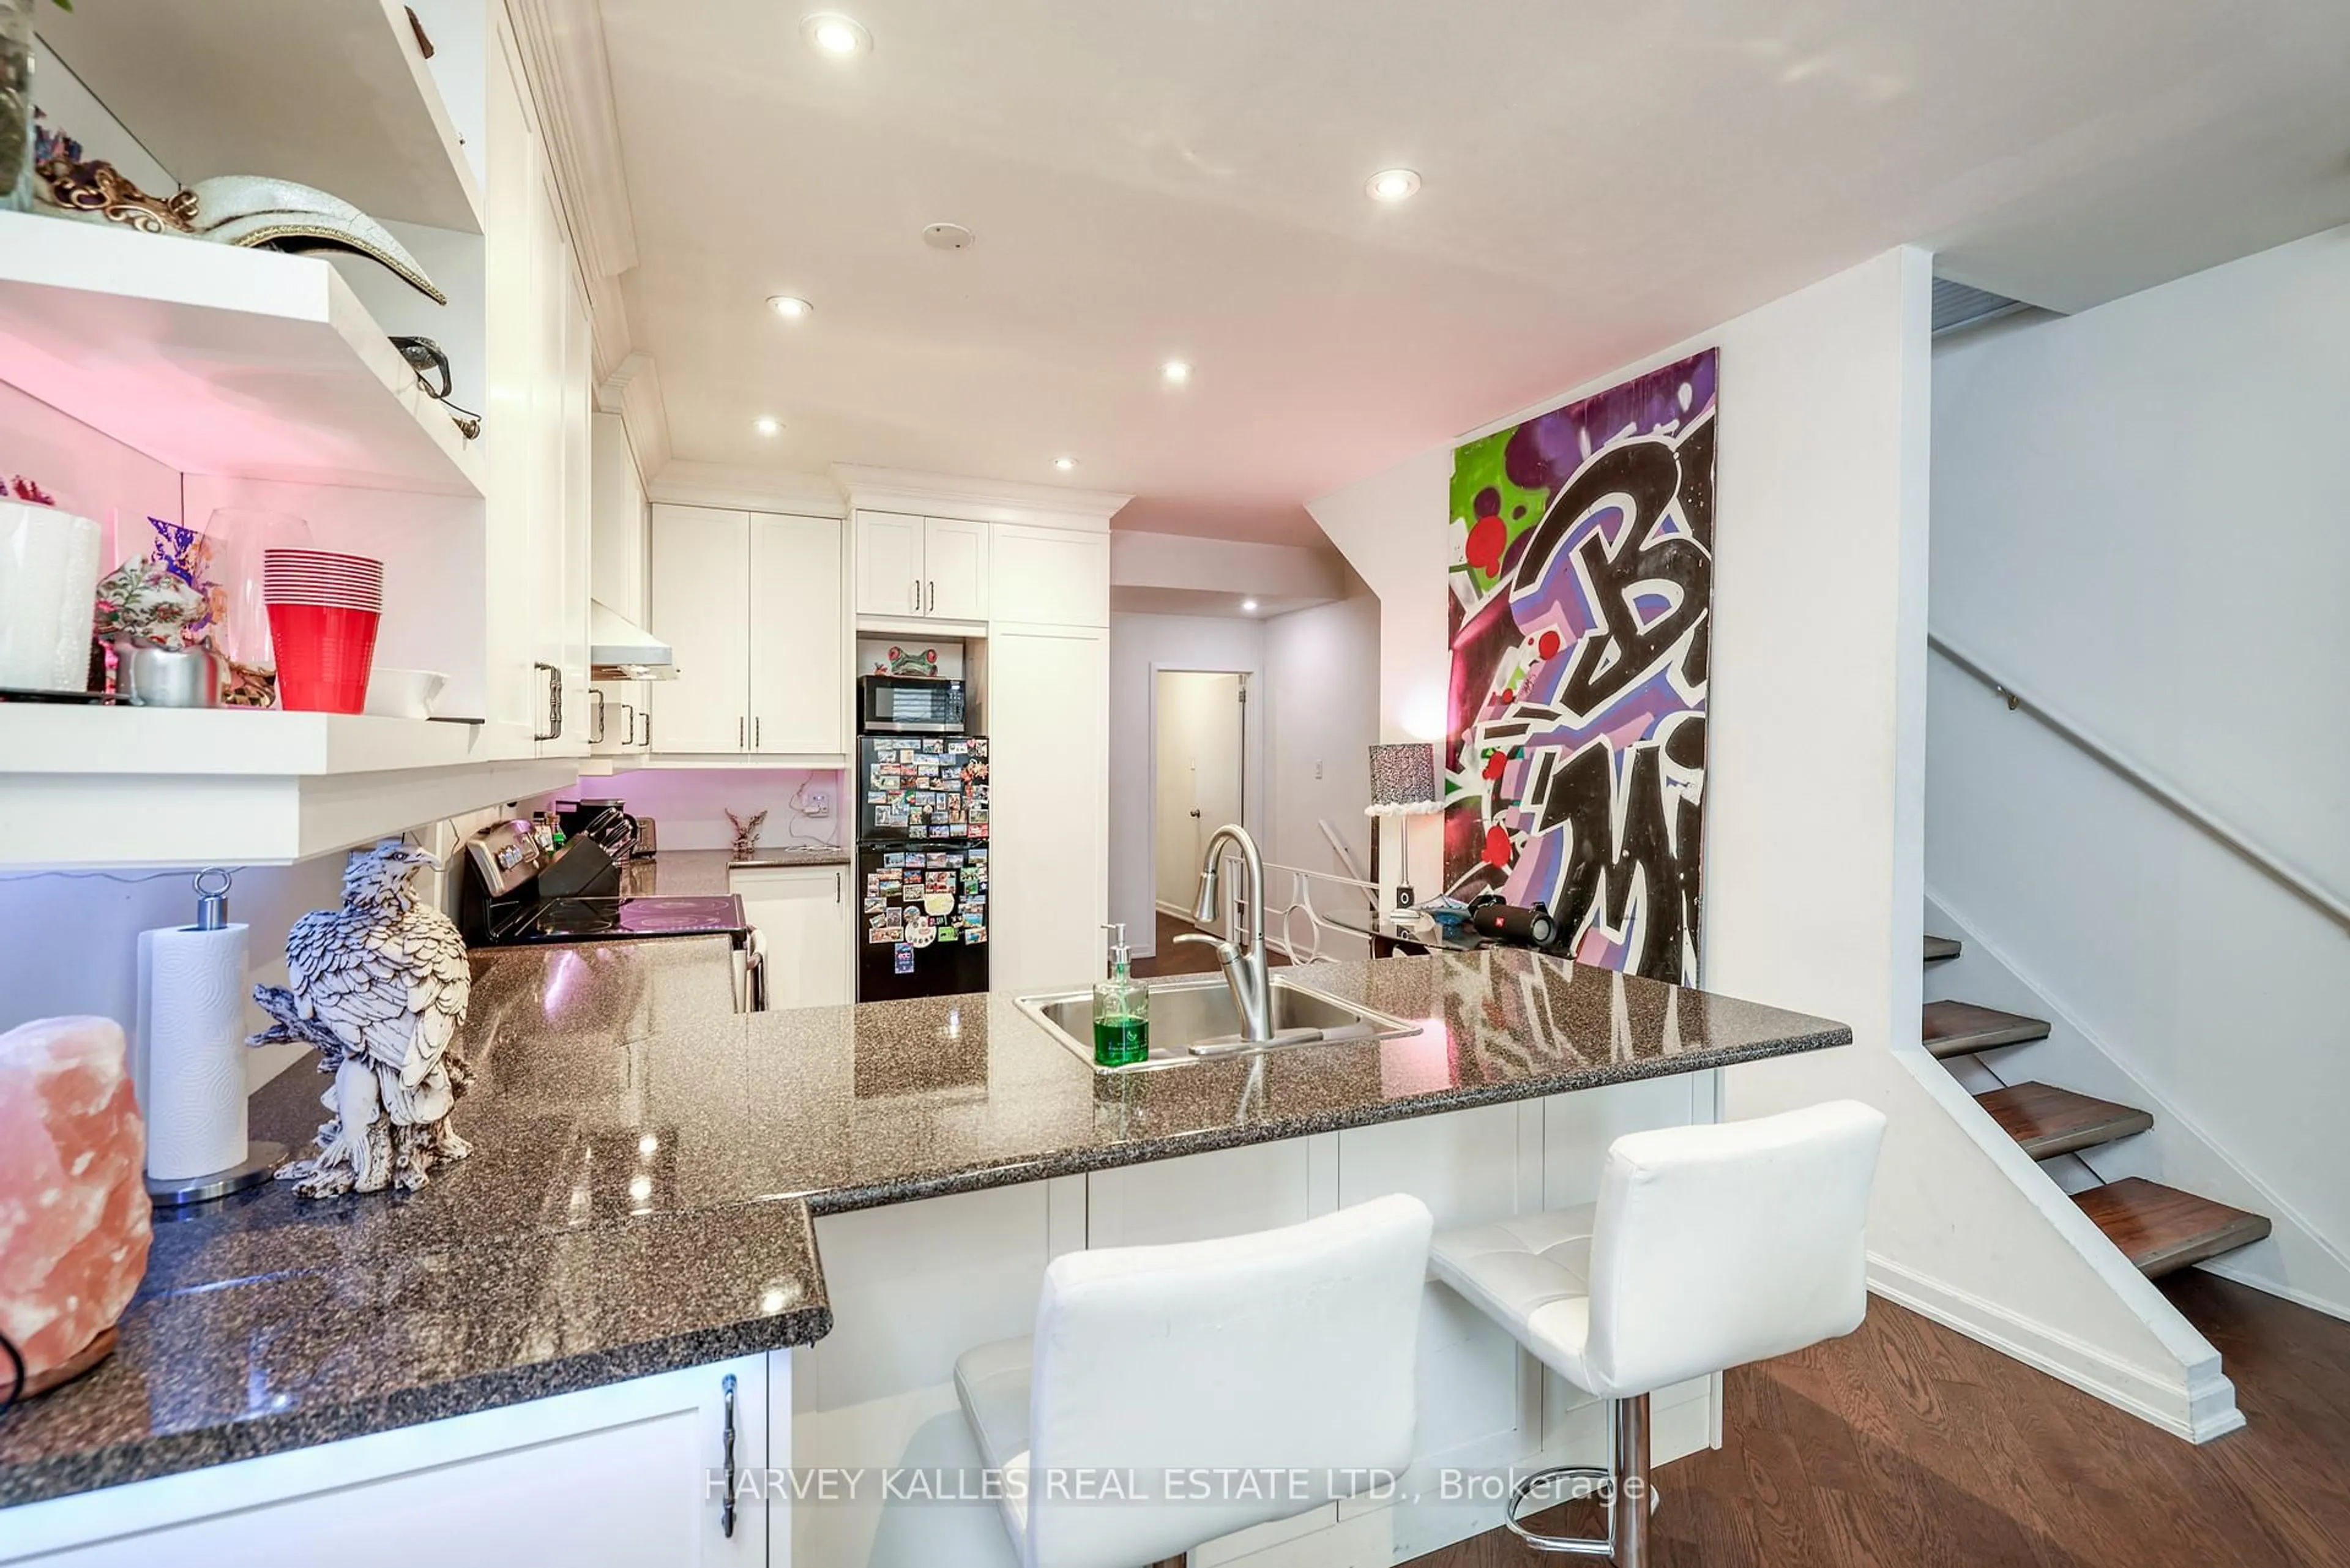
Fully renovated duplex with flexible CRE (Commercial Residential Employment) zoning permitting residential, retail and office use. The property features 4 bedrooms, 3 bathrooms, 2 full kitchens, 2 laundries and 2 expansive decks across two-and-a-half floors, upper unit consists of 1126 sqft, lower unit 1098 sqft Both units are tenanted on a month-to-month basis. Freehold ownership in one of the city's most walkable pockets, all the space of a house with none of the monthly fees of a condo. Turnkey finishes throughout, minimal maintenance, exceptional location.


Property Details

StyleAccommodation
View-
Age of property-
SqFt~2224 SqFt
Lot Size1,194 SqFt(63.1 x 18.93)
Parking Spaces-
MLS ®NumberC14096804
Community NameEntertainment District
Data SourceTRREB
Listing byHARVEY KALLES REAL ESTATE LTD.

Features

Heating: Baseboard
Cooling: Y

Features

Lot size: 1,194 SqFt

Property History

Login required
Price changeActive
$•••,•••
Login required
Re-listed
$•••,•••
4 days on market
history photo preview32
Listing by trreb®
Property listed by HARVEY KALLES REAL ESTATE LTD., Brokerage
Agent Banner Image
Interested in this property?Get in touch to get the inside scoop.

Market Data - Entertainment District

Geo Zone Map ThumbnailEntertainment District

Strong Buyer's Market

View Market Data

Other - for the past 30 days

Buyer's market Seller's market

Avg. Days on Market

Past 30 days

36 days

Compared to

2025

40 days

2024

40 days

2023

25 days

New Listings

Past 30 days

170 listings

Compared to

2025

257 listings

2024

301 listings

2023

259 listings

Units sold

Past 30 days

25 units

Compared to

2025

74 units

2024

65 units

2023

53 units

Median Sold Price

Past 30 days

$631,000

Compared to

2025

$598,500

2024

$670,000

2023

$770,000


Population and Demographics

Overview

Total population 32132
Average household income $172,021

Age (%)

0 to 19
7%
20 to 34
57%
35 to 49
22%
50 to 64
9%
65 and plus
5%

Household composition (%)

Single person
57%
Single family
32%
Multi person
11%
Multi family
0%

Mother tongue (%)

English
63%
Mandarin
10%
Yue (Cantonese)
4%
Spanish
3%
French
3%
Russian
2%
Arabic
2%
Hindi
2%
Korean
1%
Iranian Persian
1%
Others
1%

House tenancy (%)

Renters
61%
Owners
39%

What’s nearby?Essentials within 5 km

Local Logic

Transportation Scores

Estimated Budget