7 hours on Market

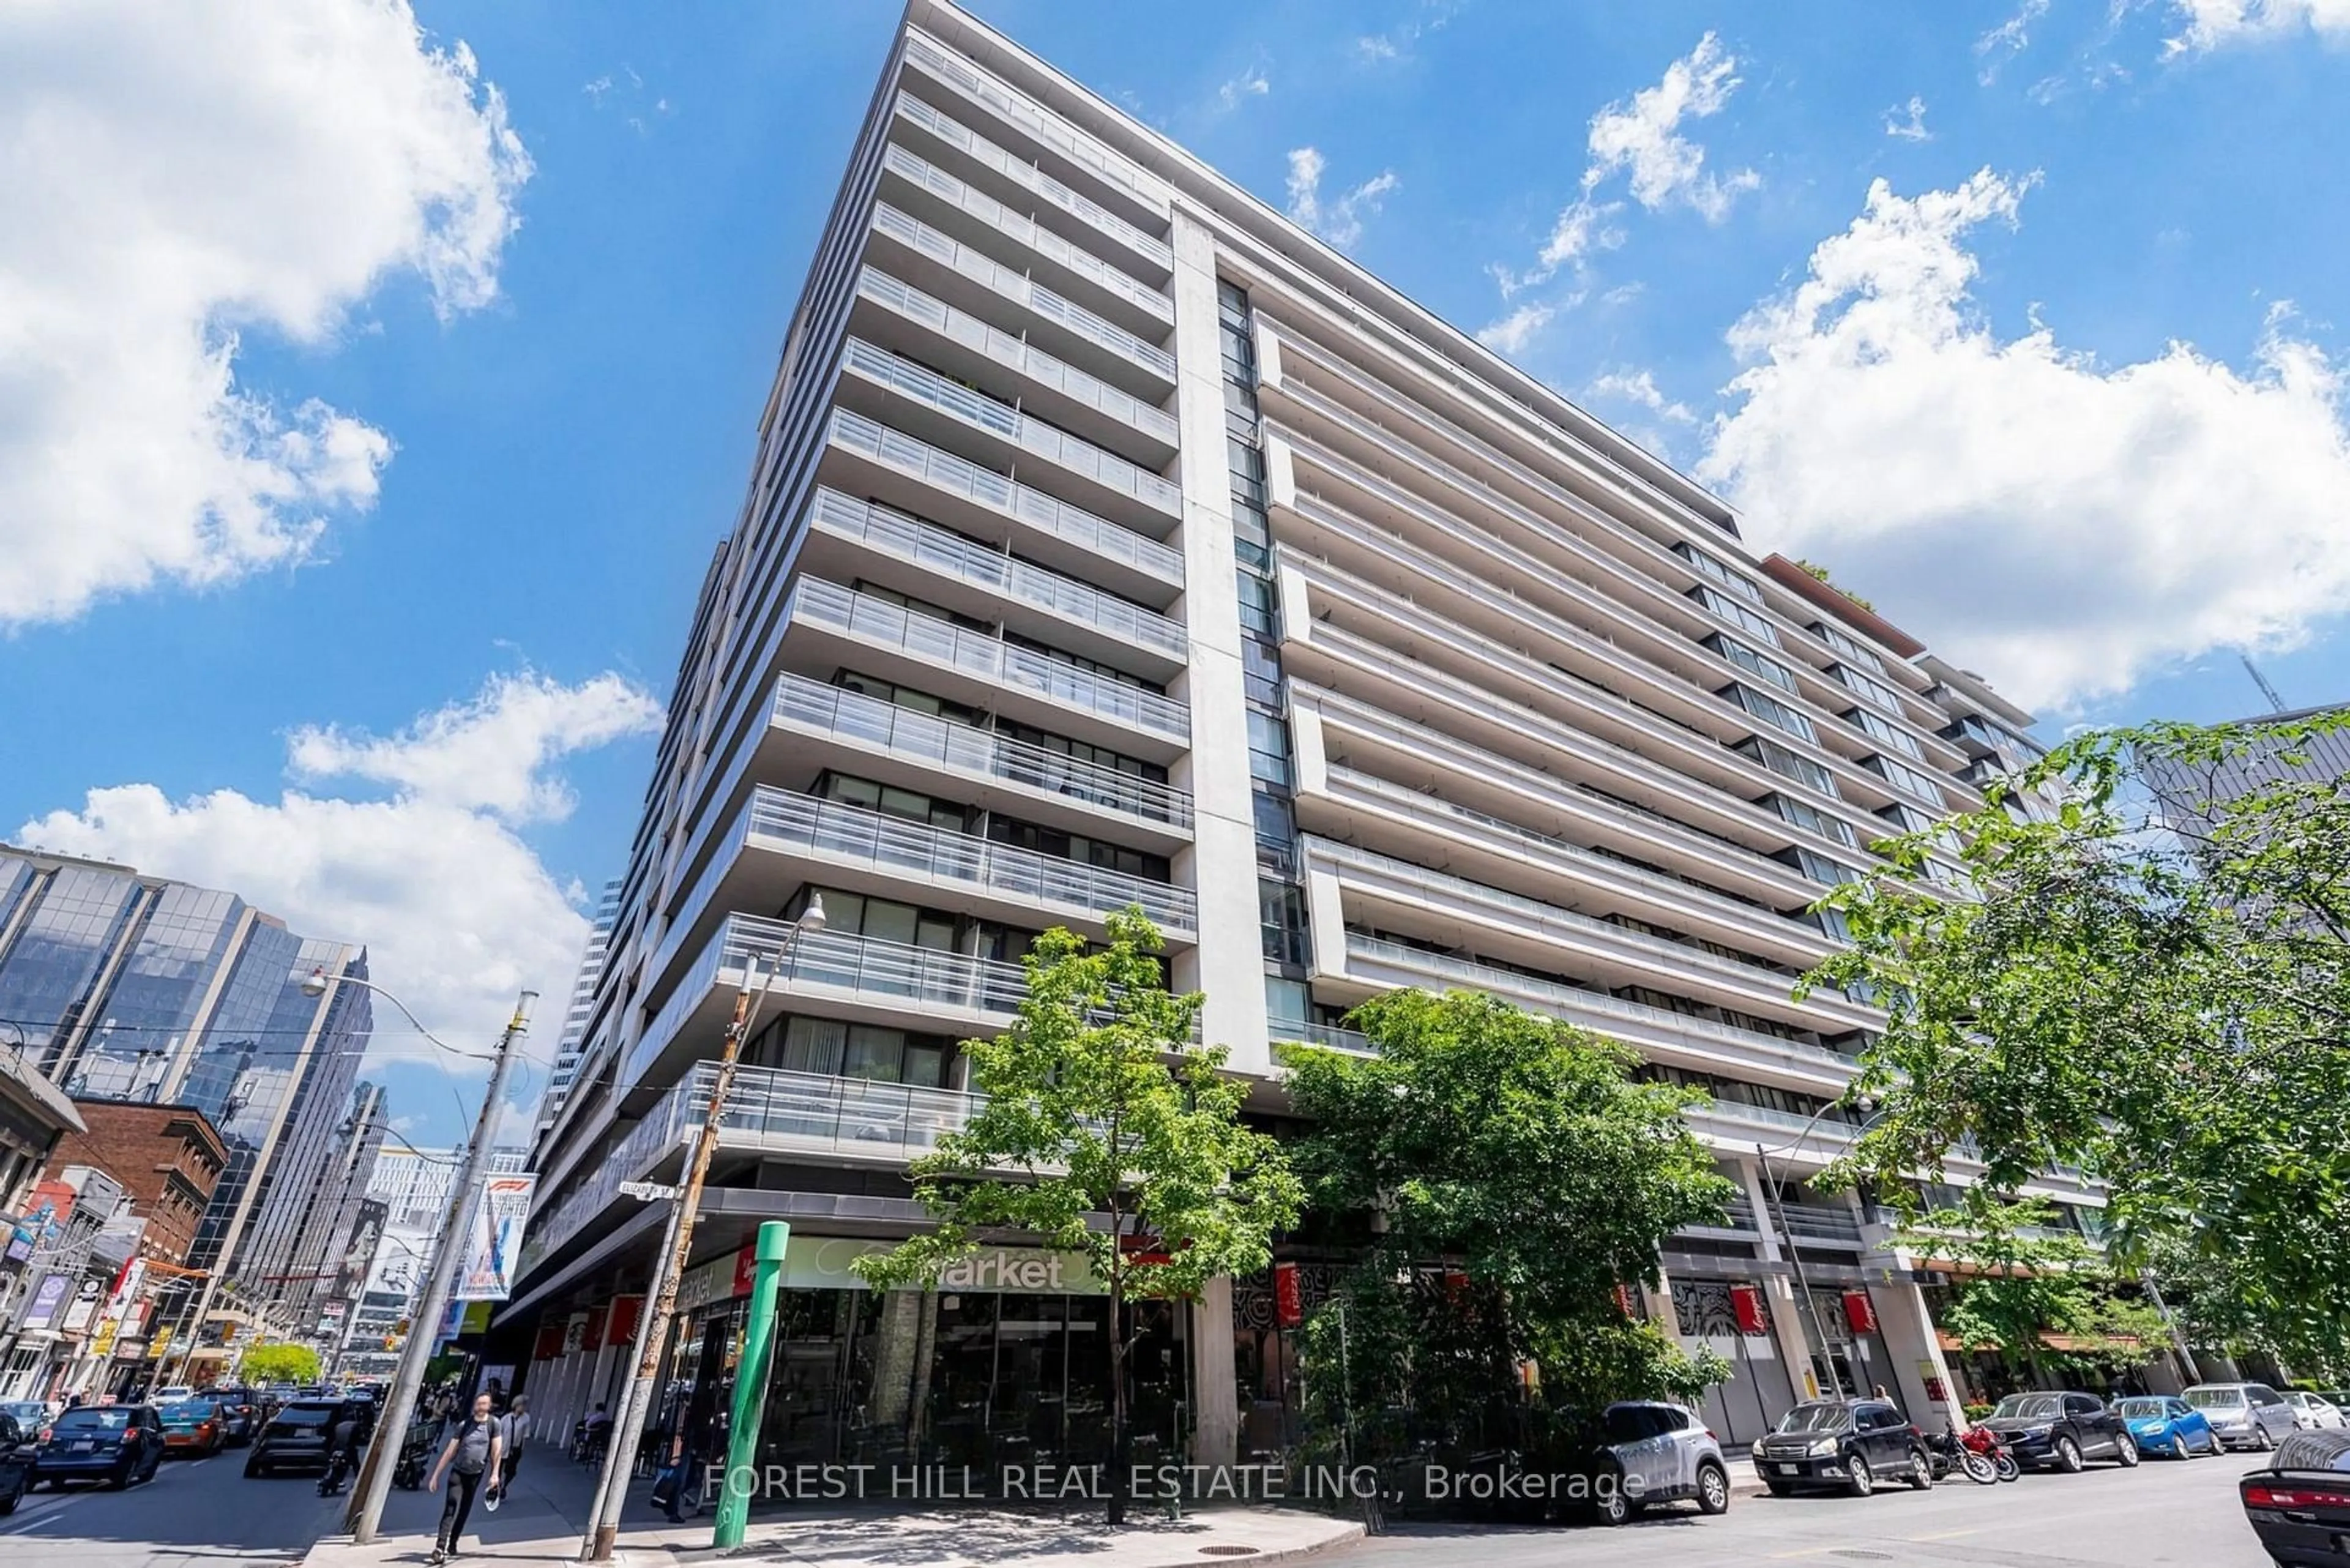
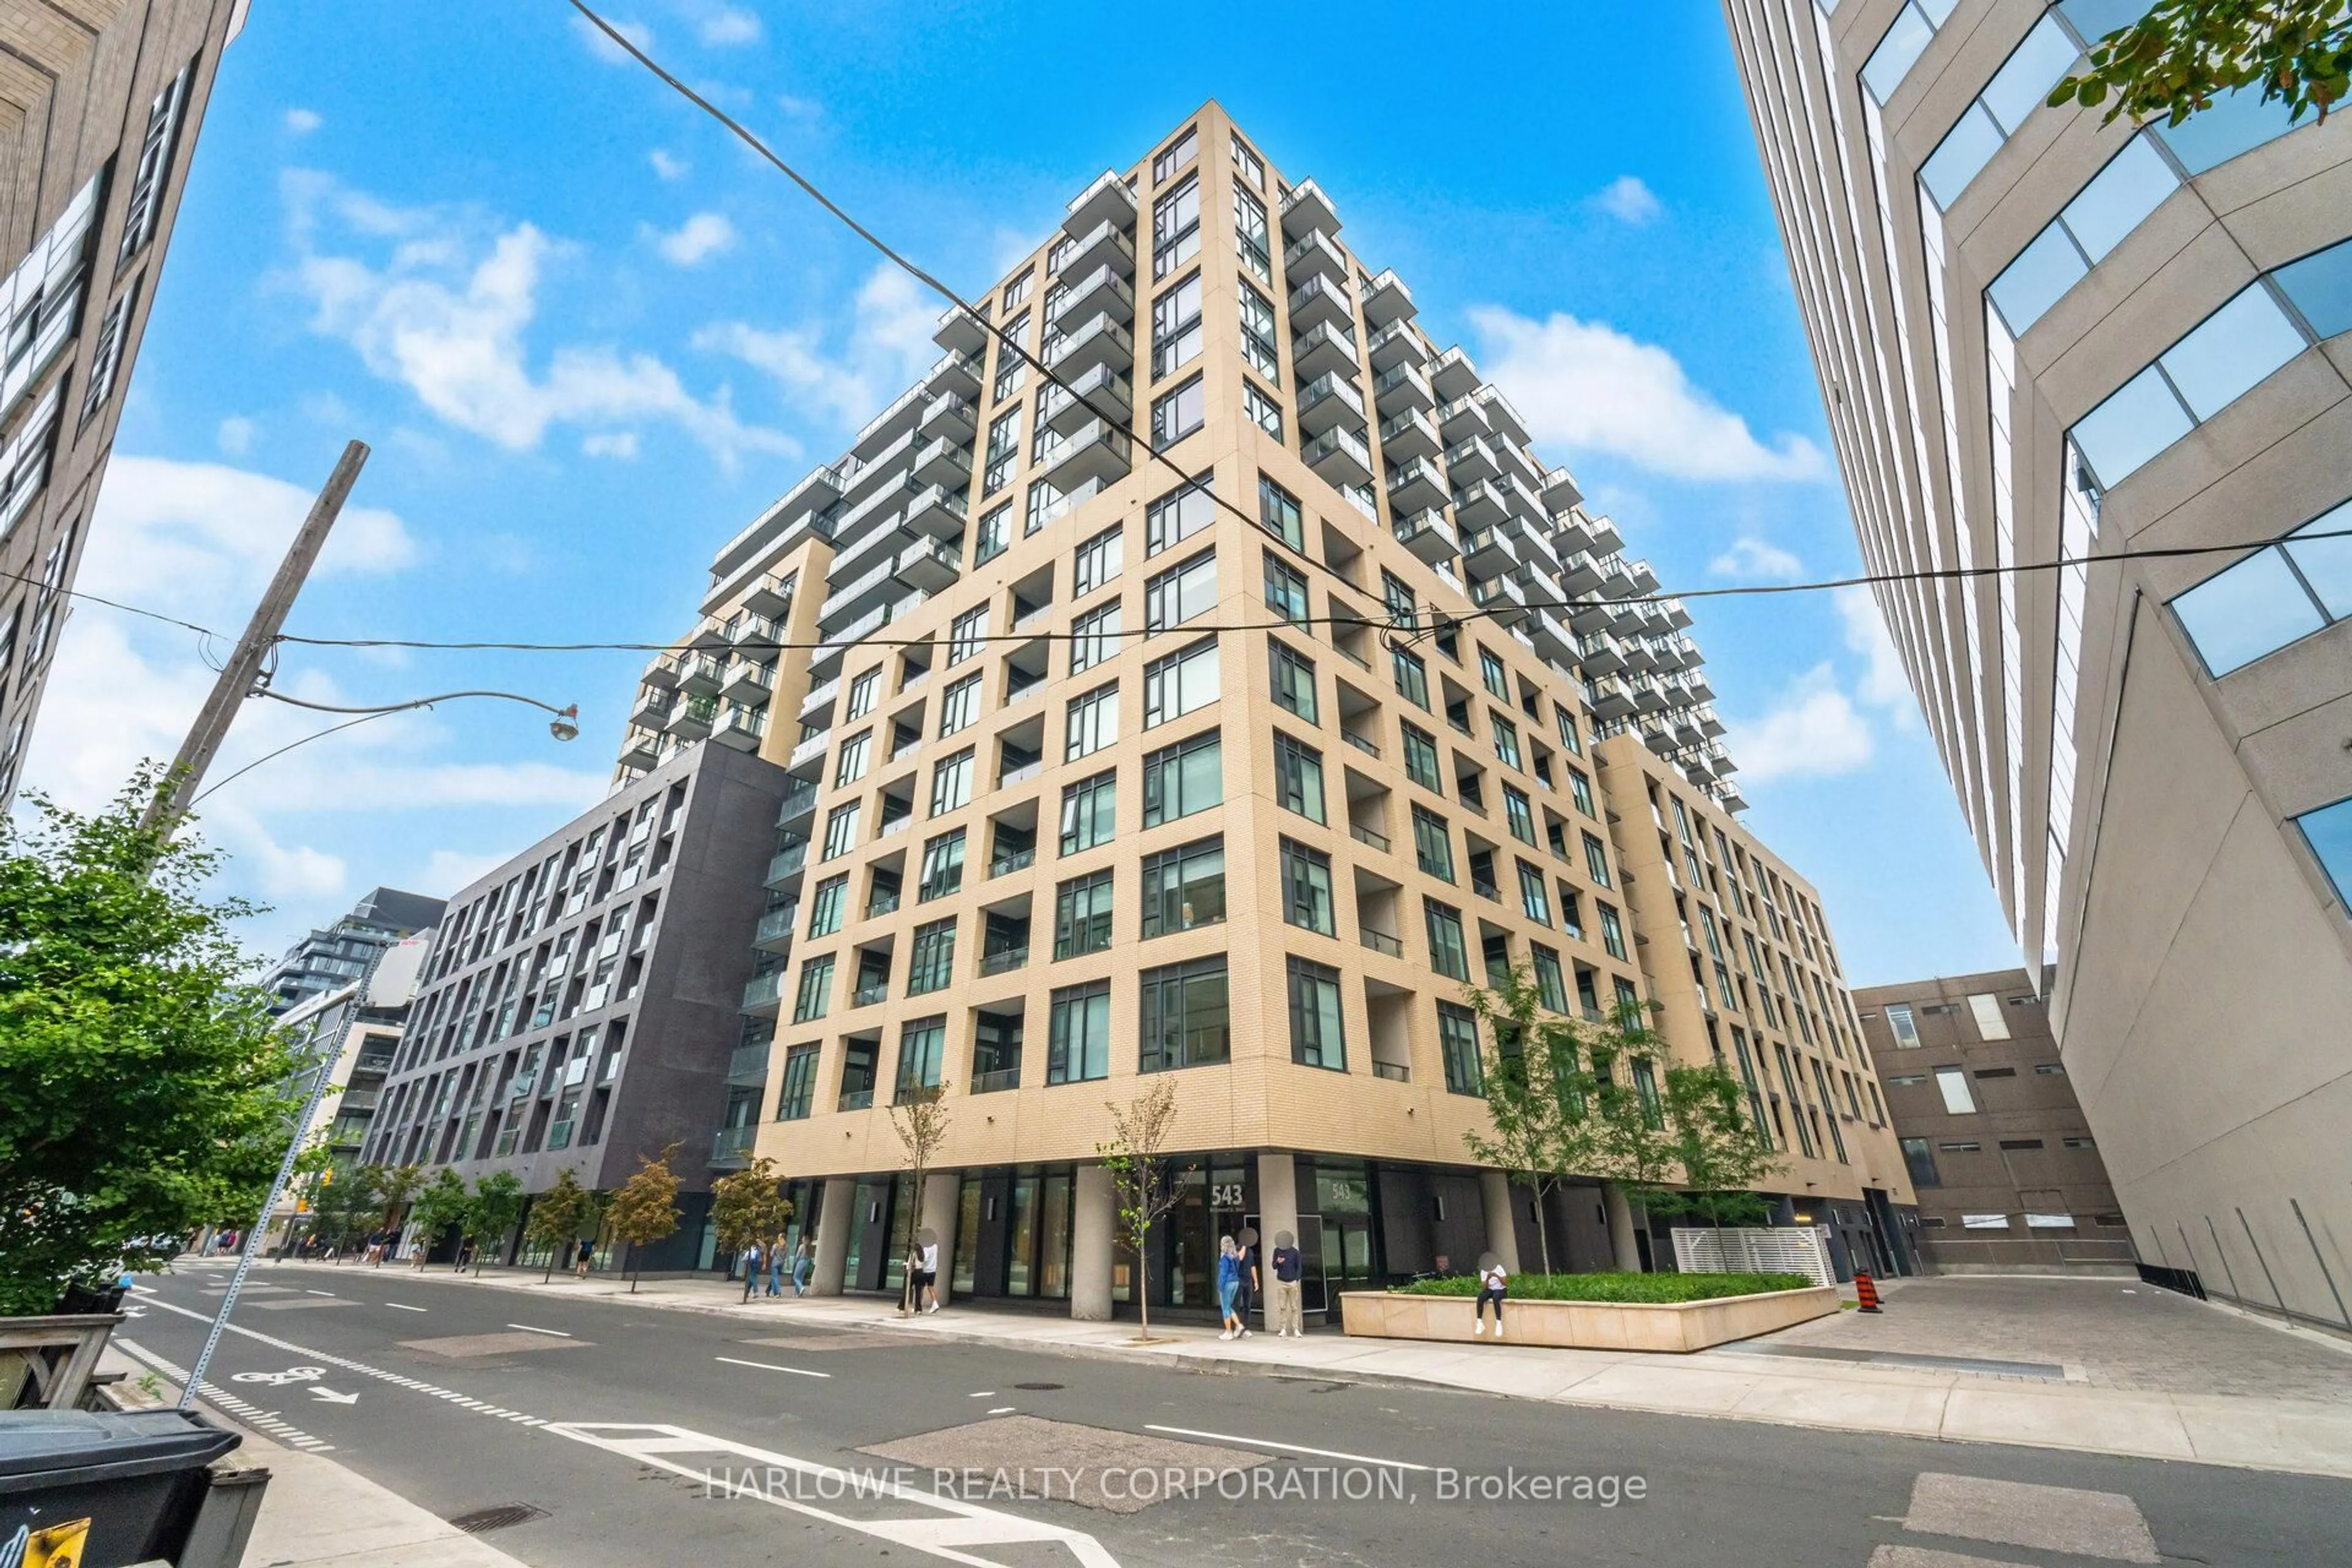
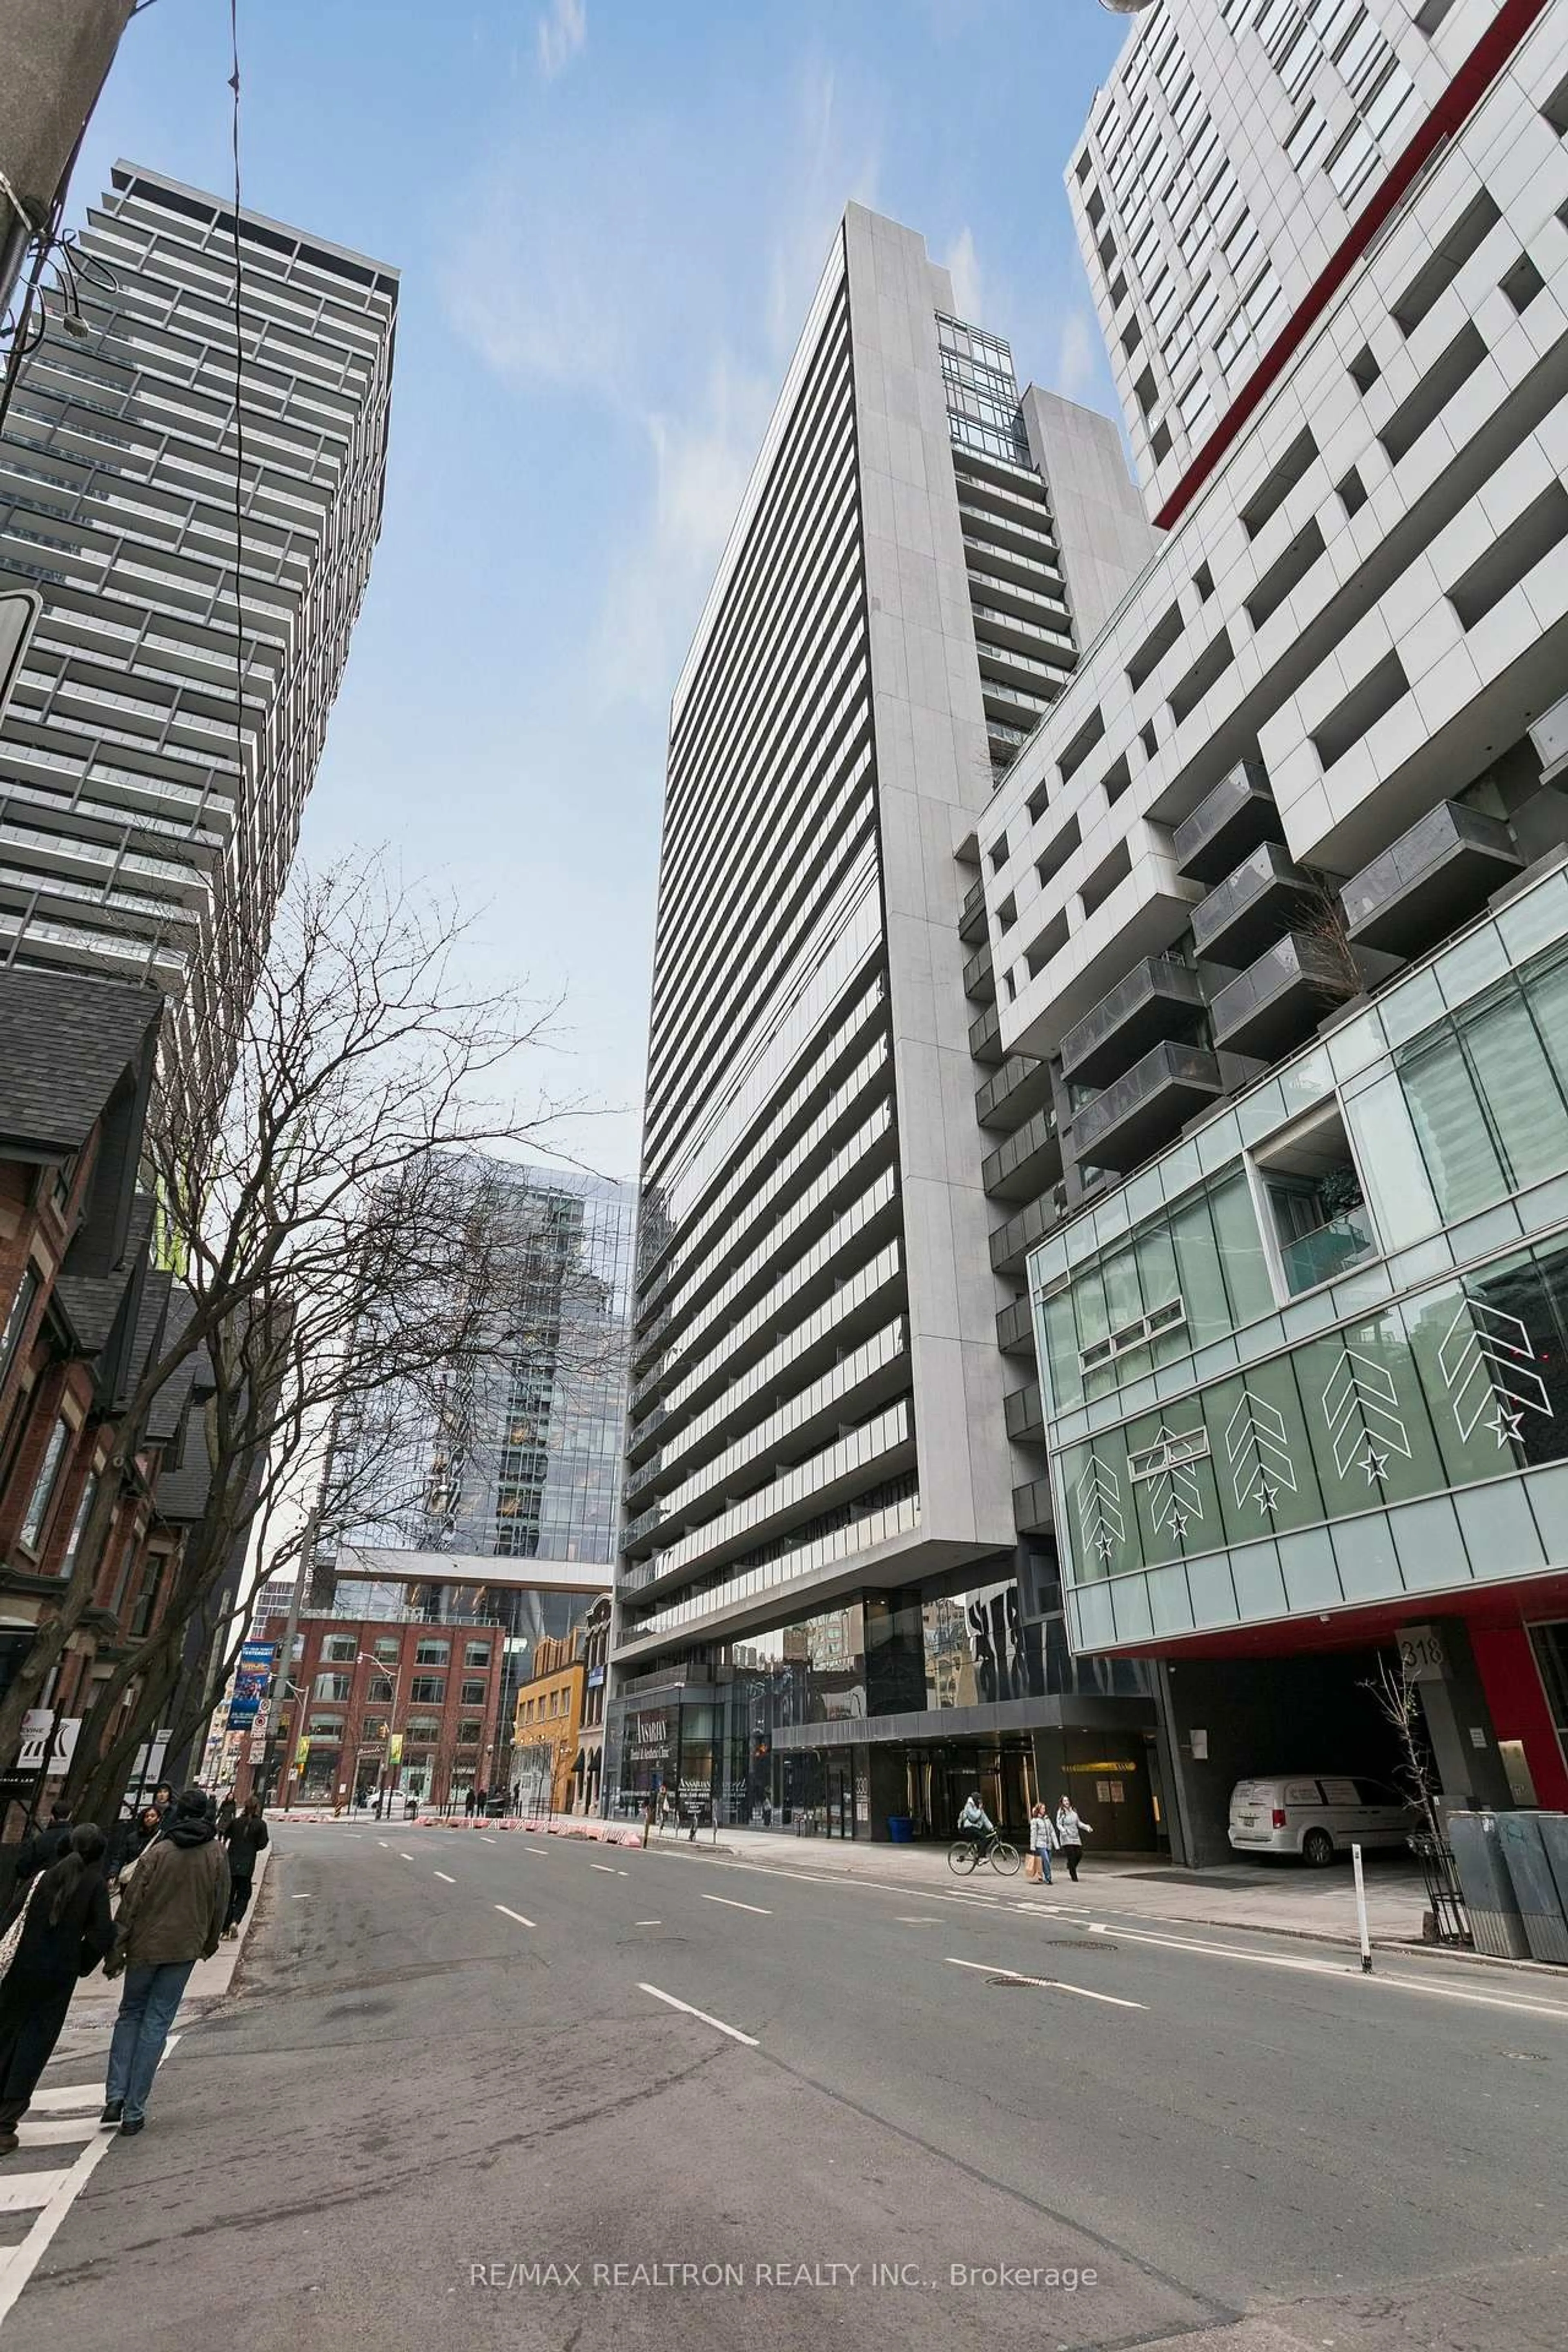
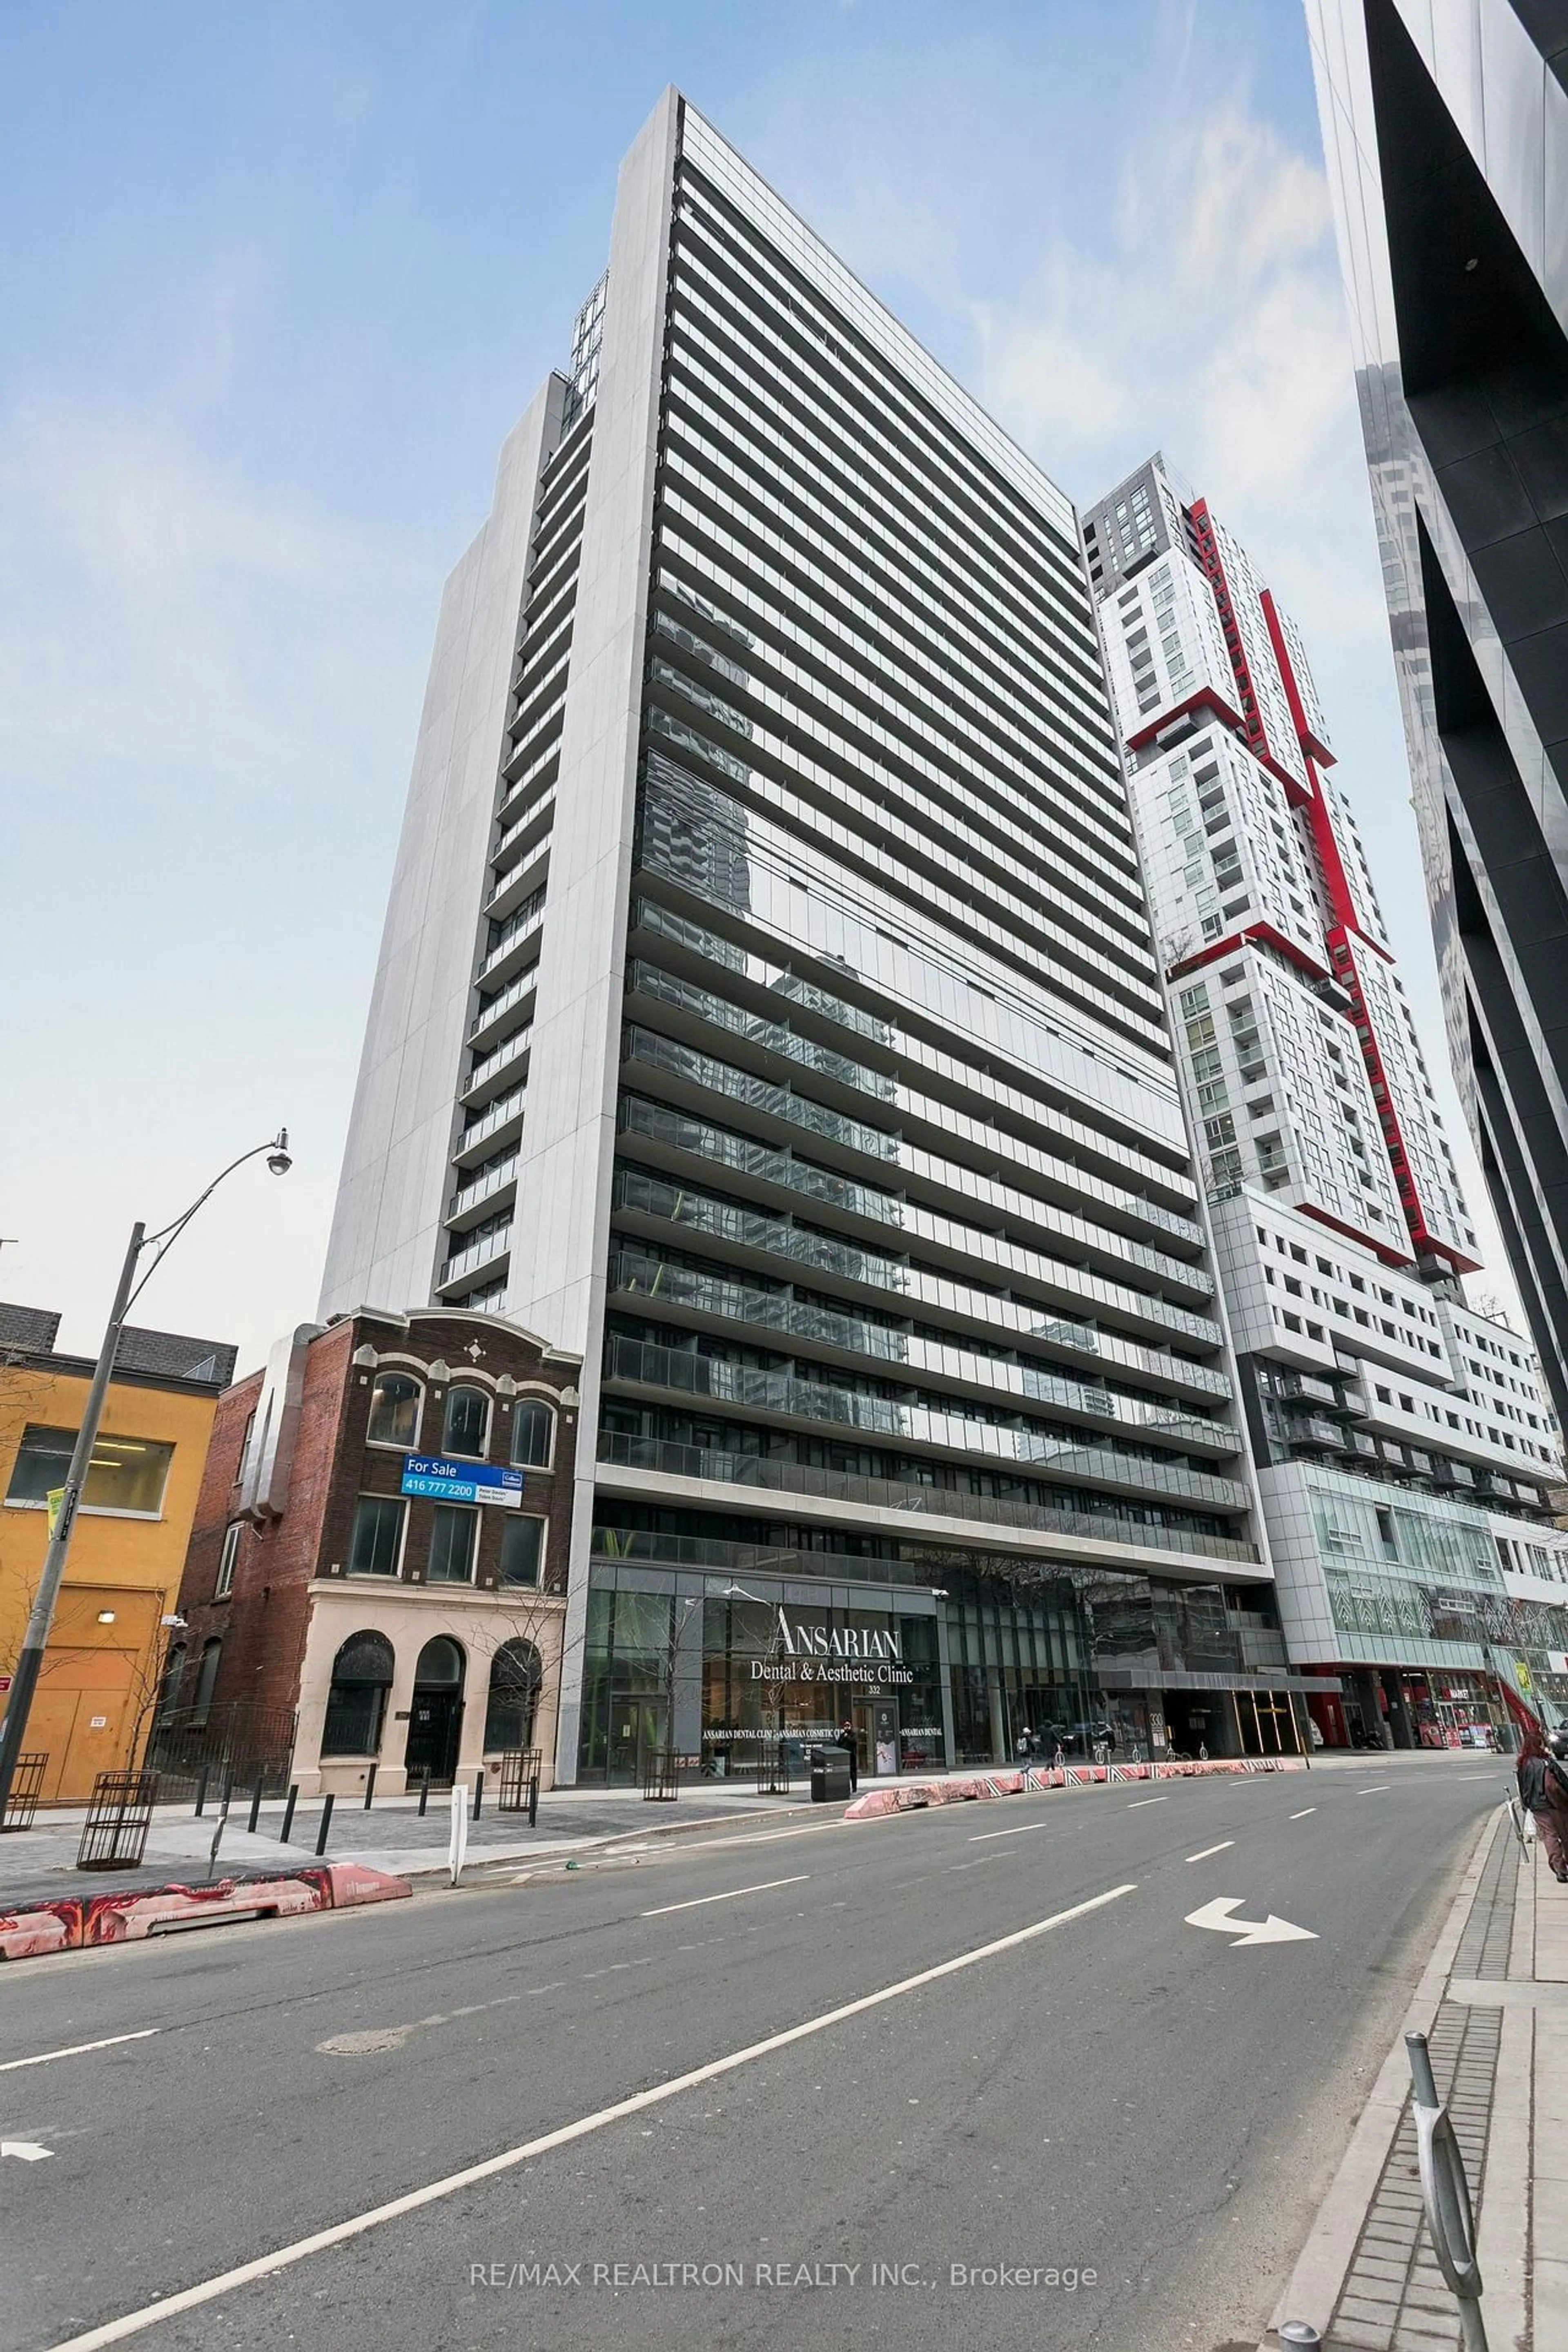
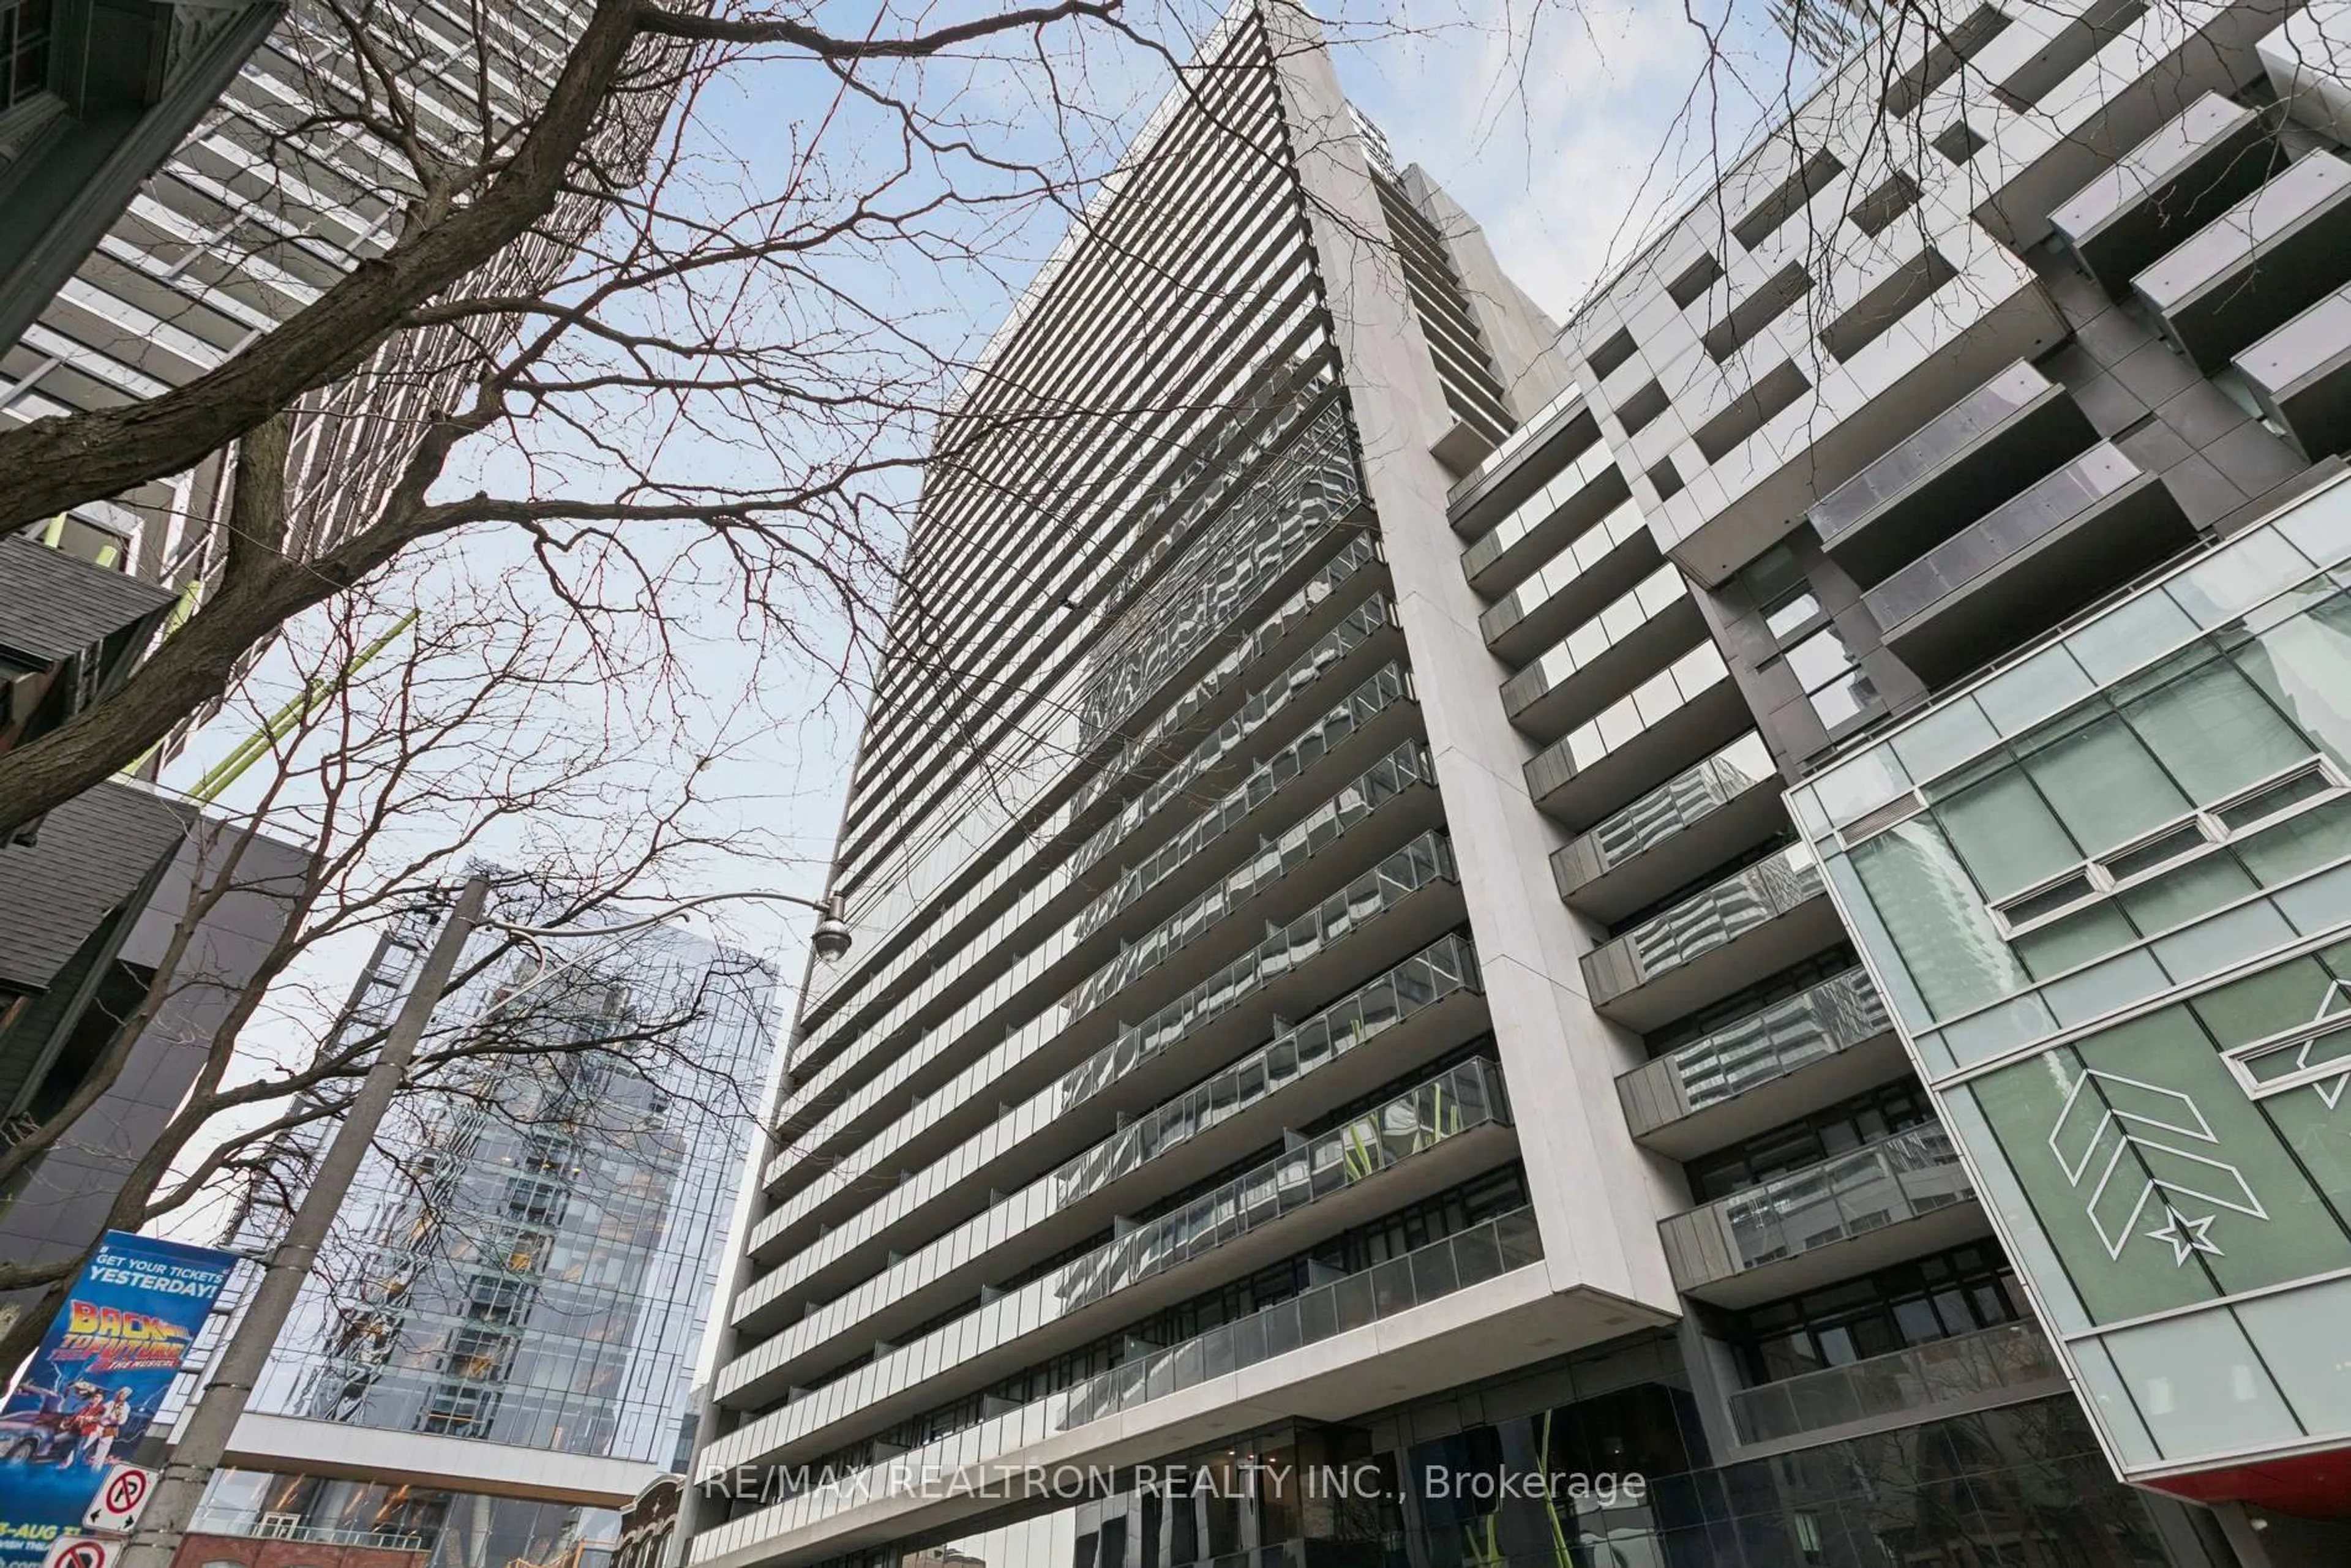
330 Richmond St #307, Toronto, Ontario M5V 1X2

In the same building:
-
Condo
1
1
~600-699 sqft
$558,000
Get pre-qualifiedPowered by nesto
Condo
1
1
~600-699 sqft

Contact us about this property

Call

Highlights

Property Estimate

Days on market7 hours

Estimated valueNot available

Price/Sqft$864/sqft

Monthly cost

Open Calculator

Description

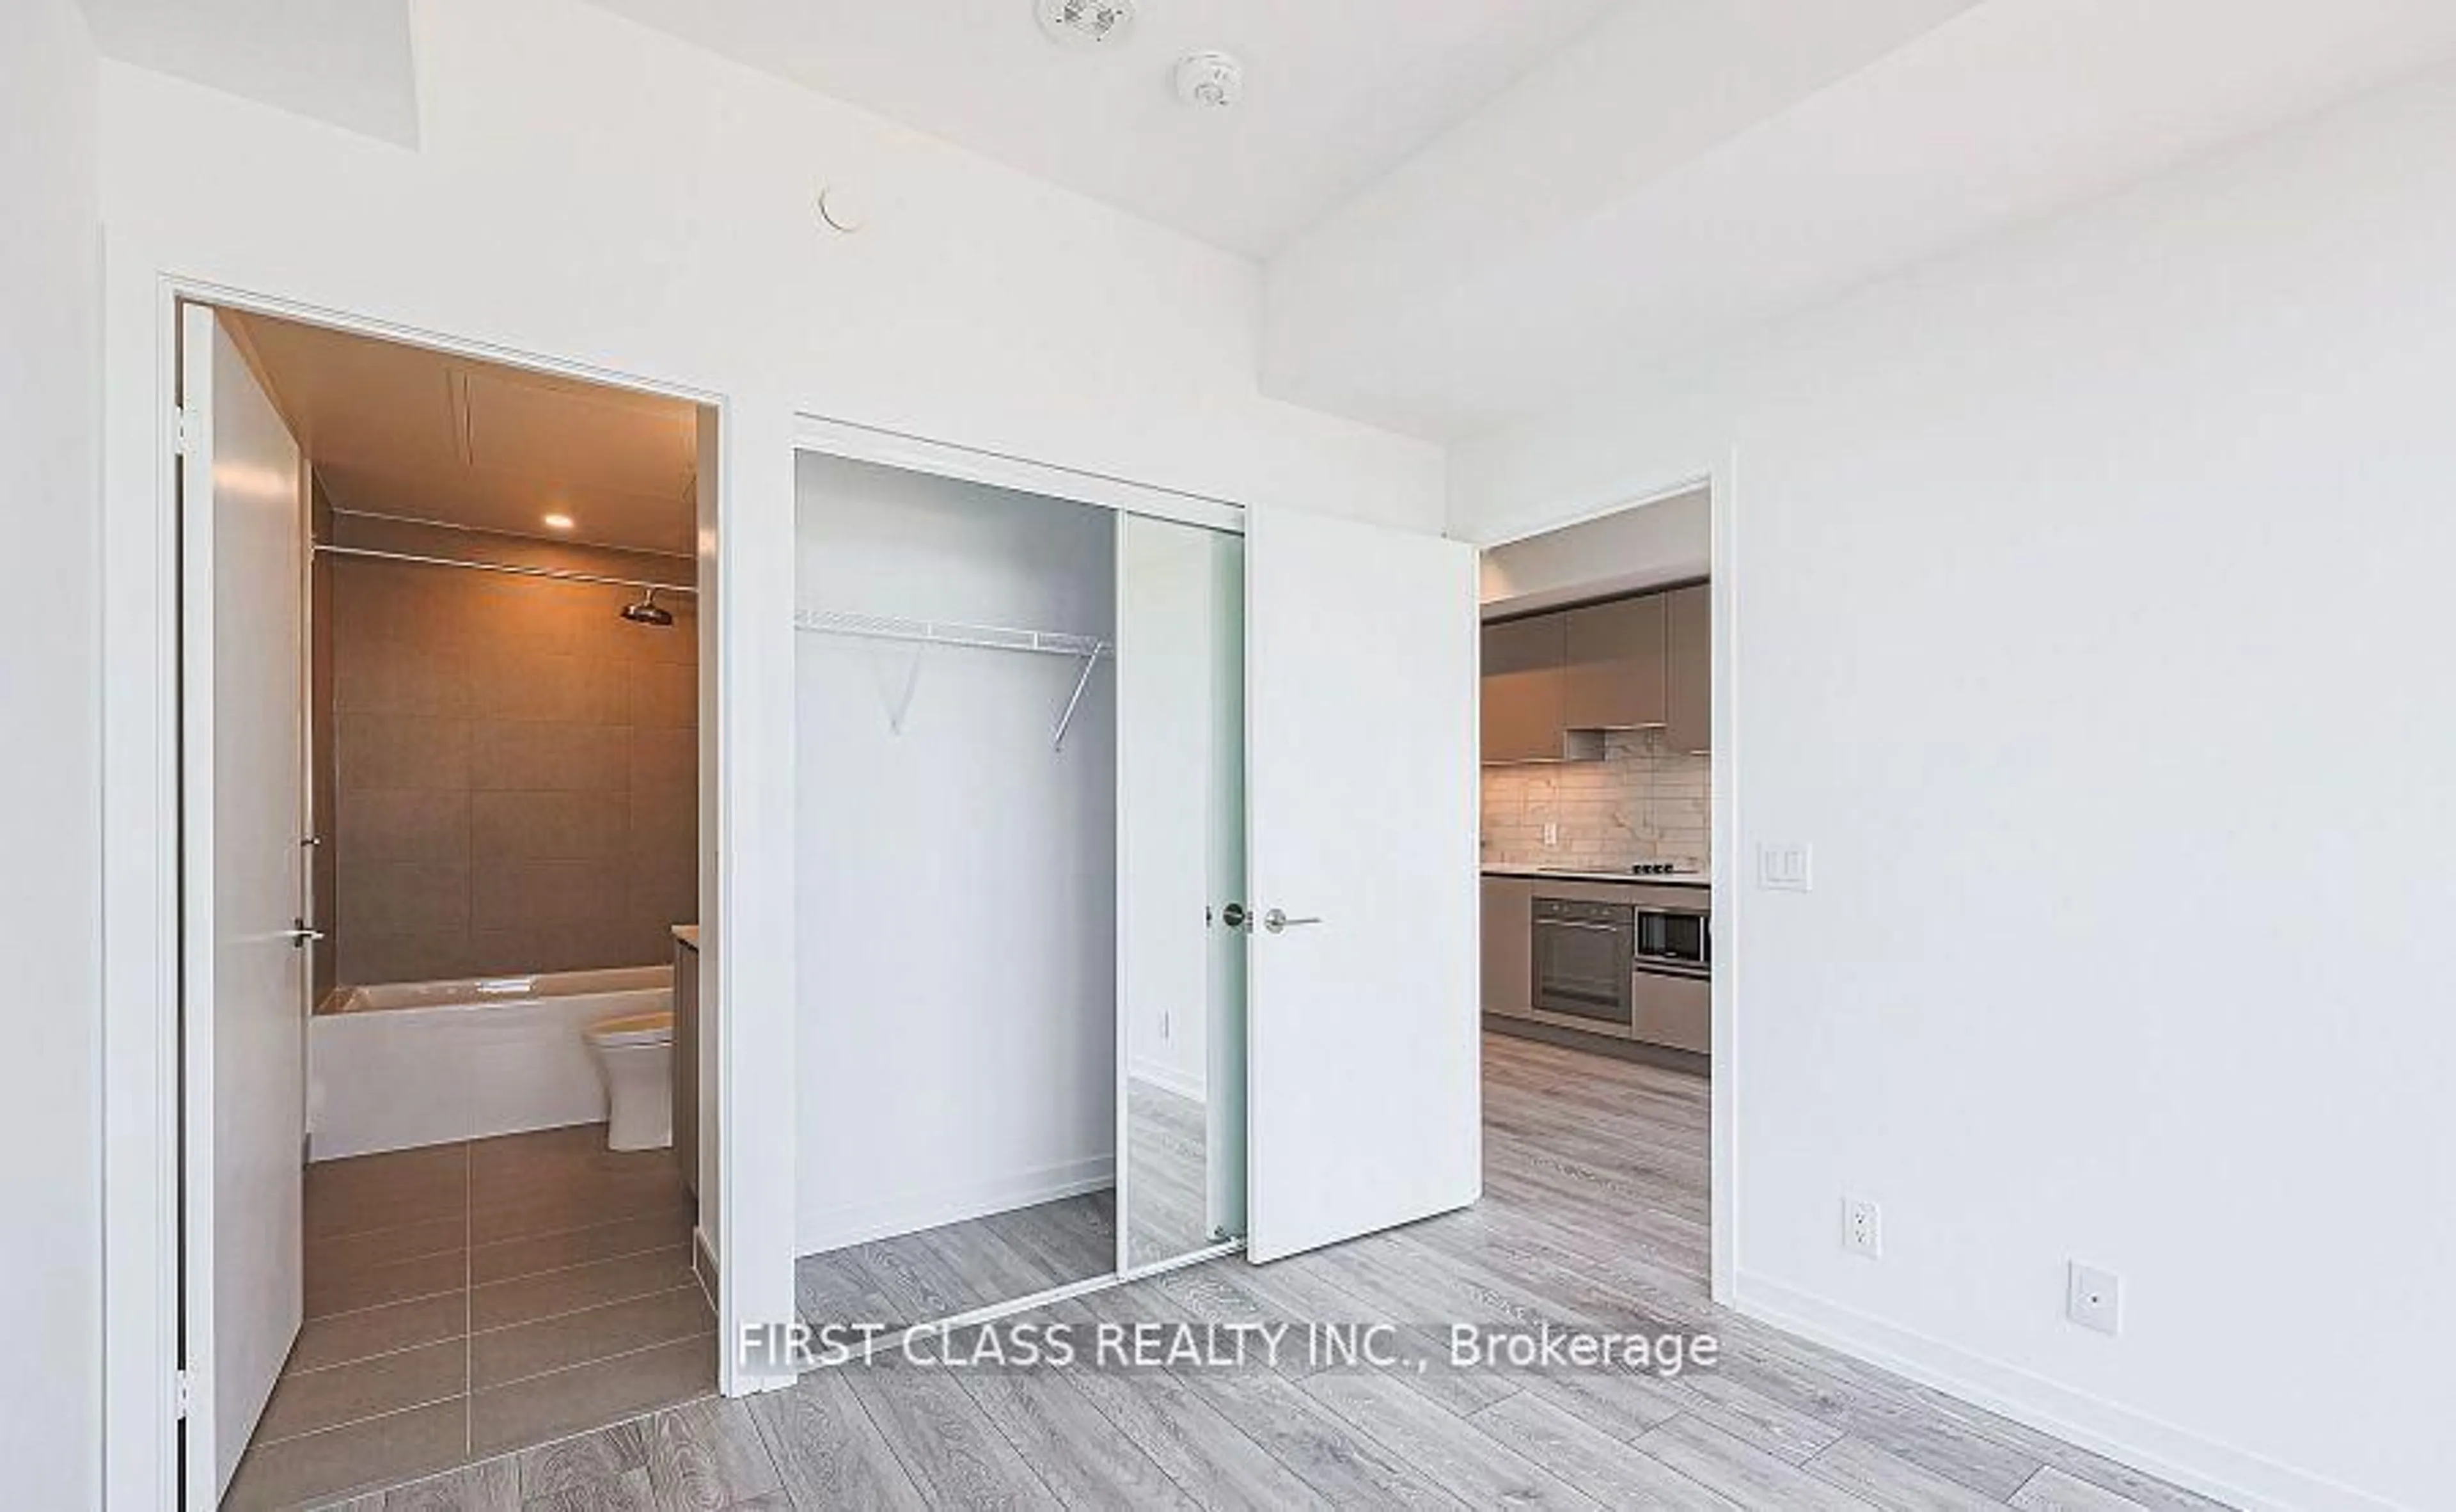
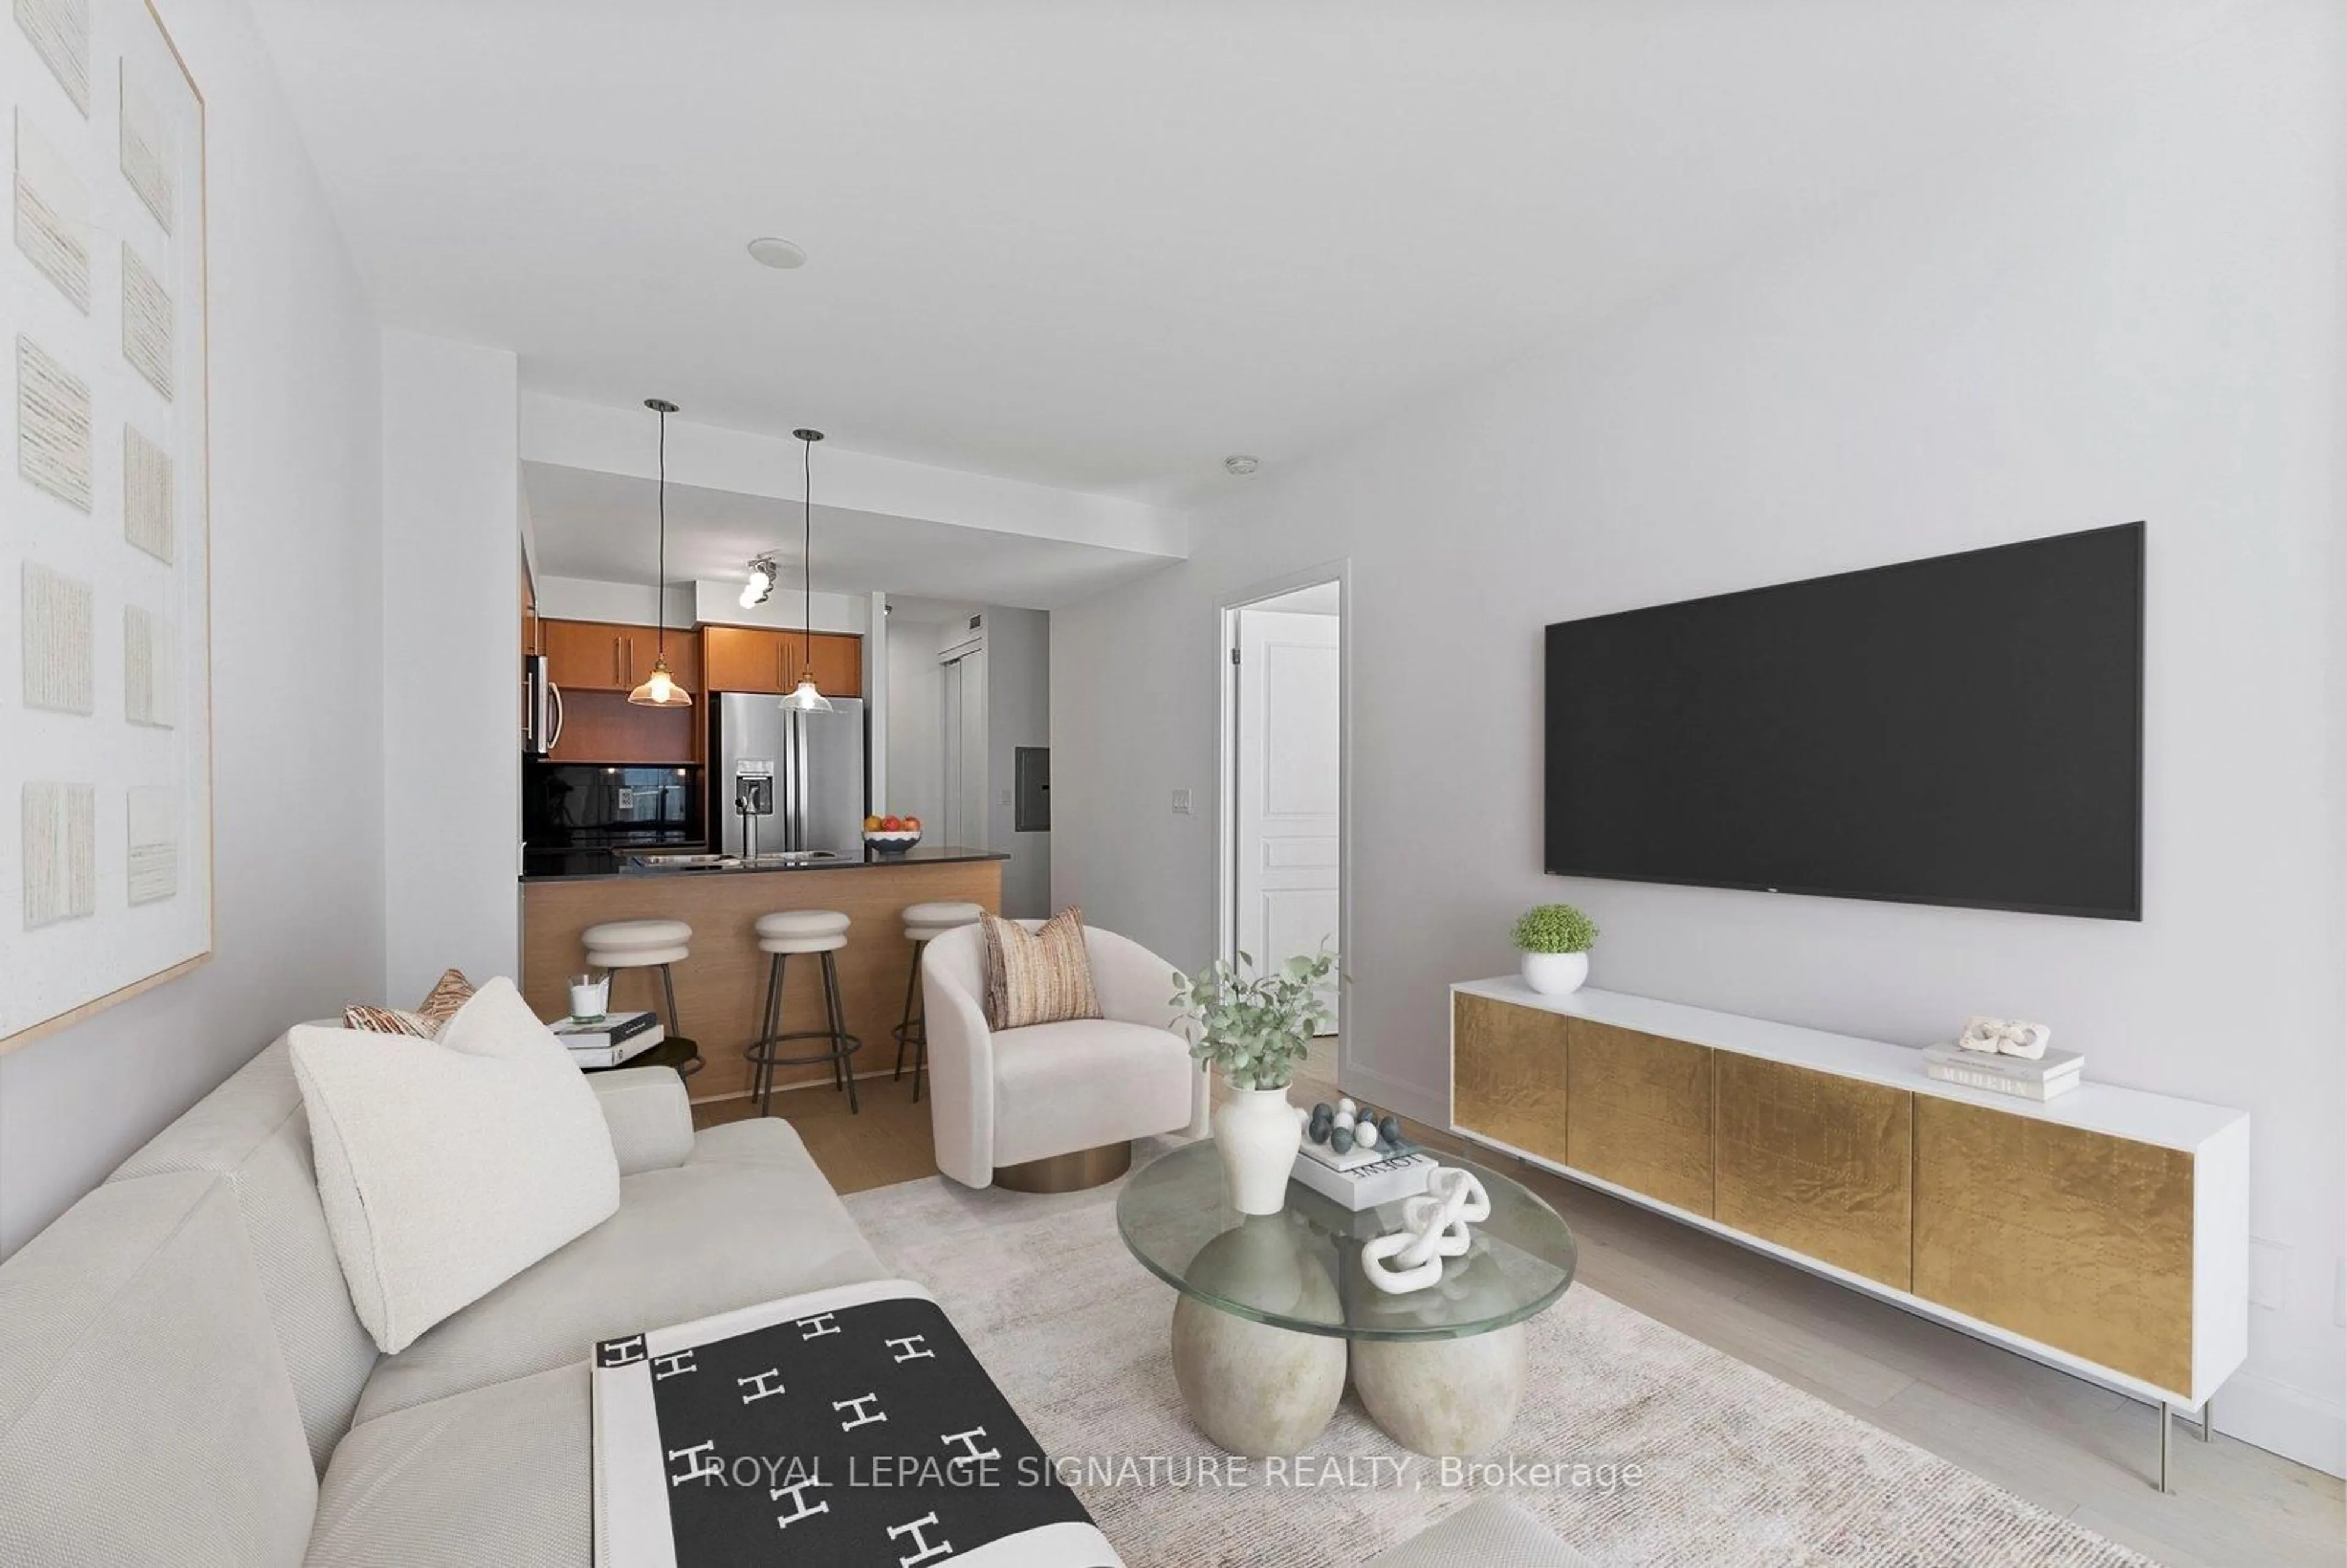
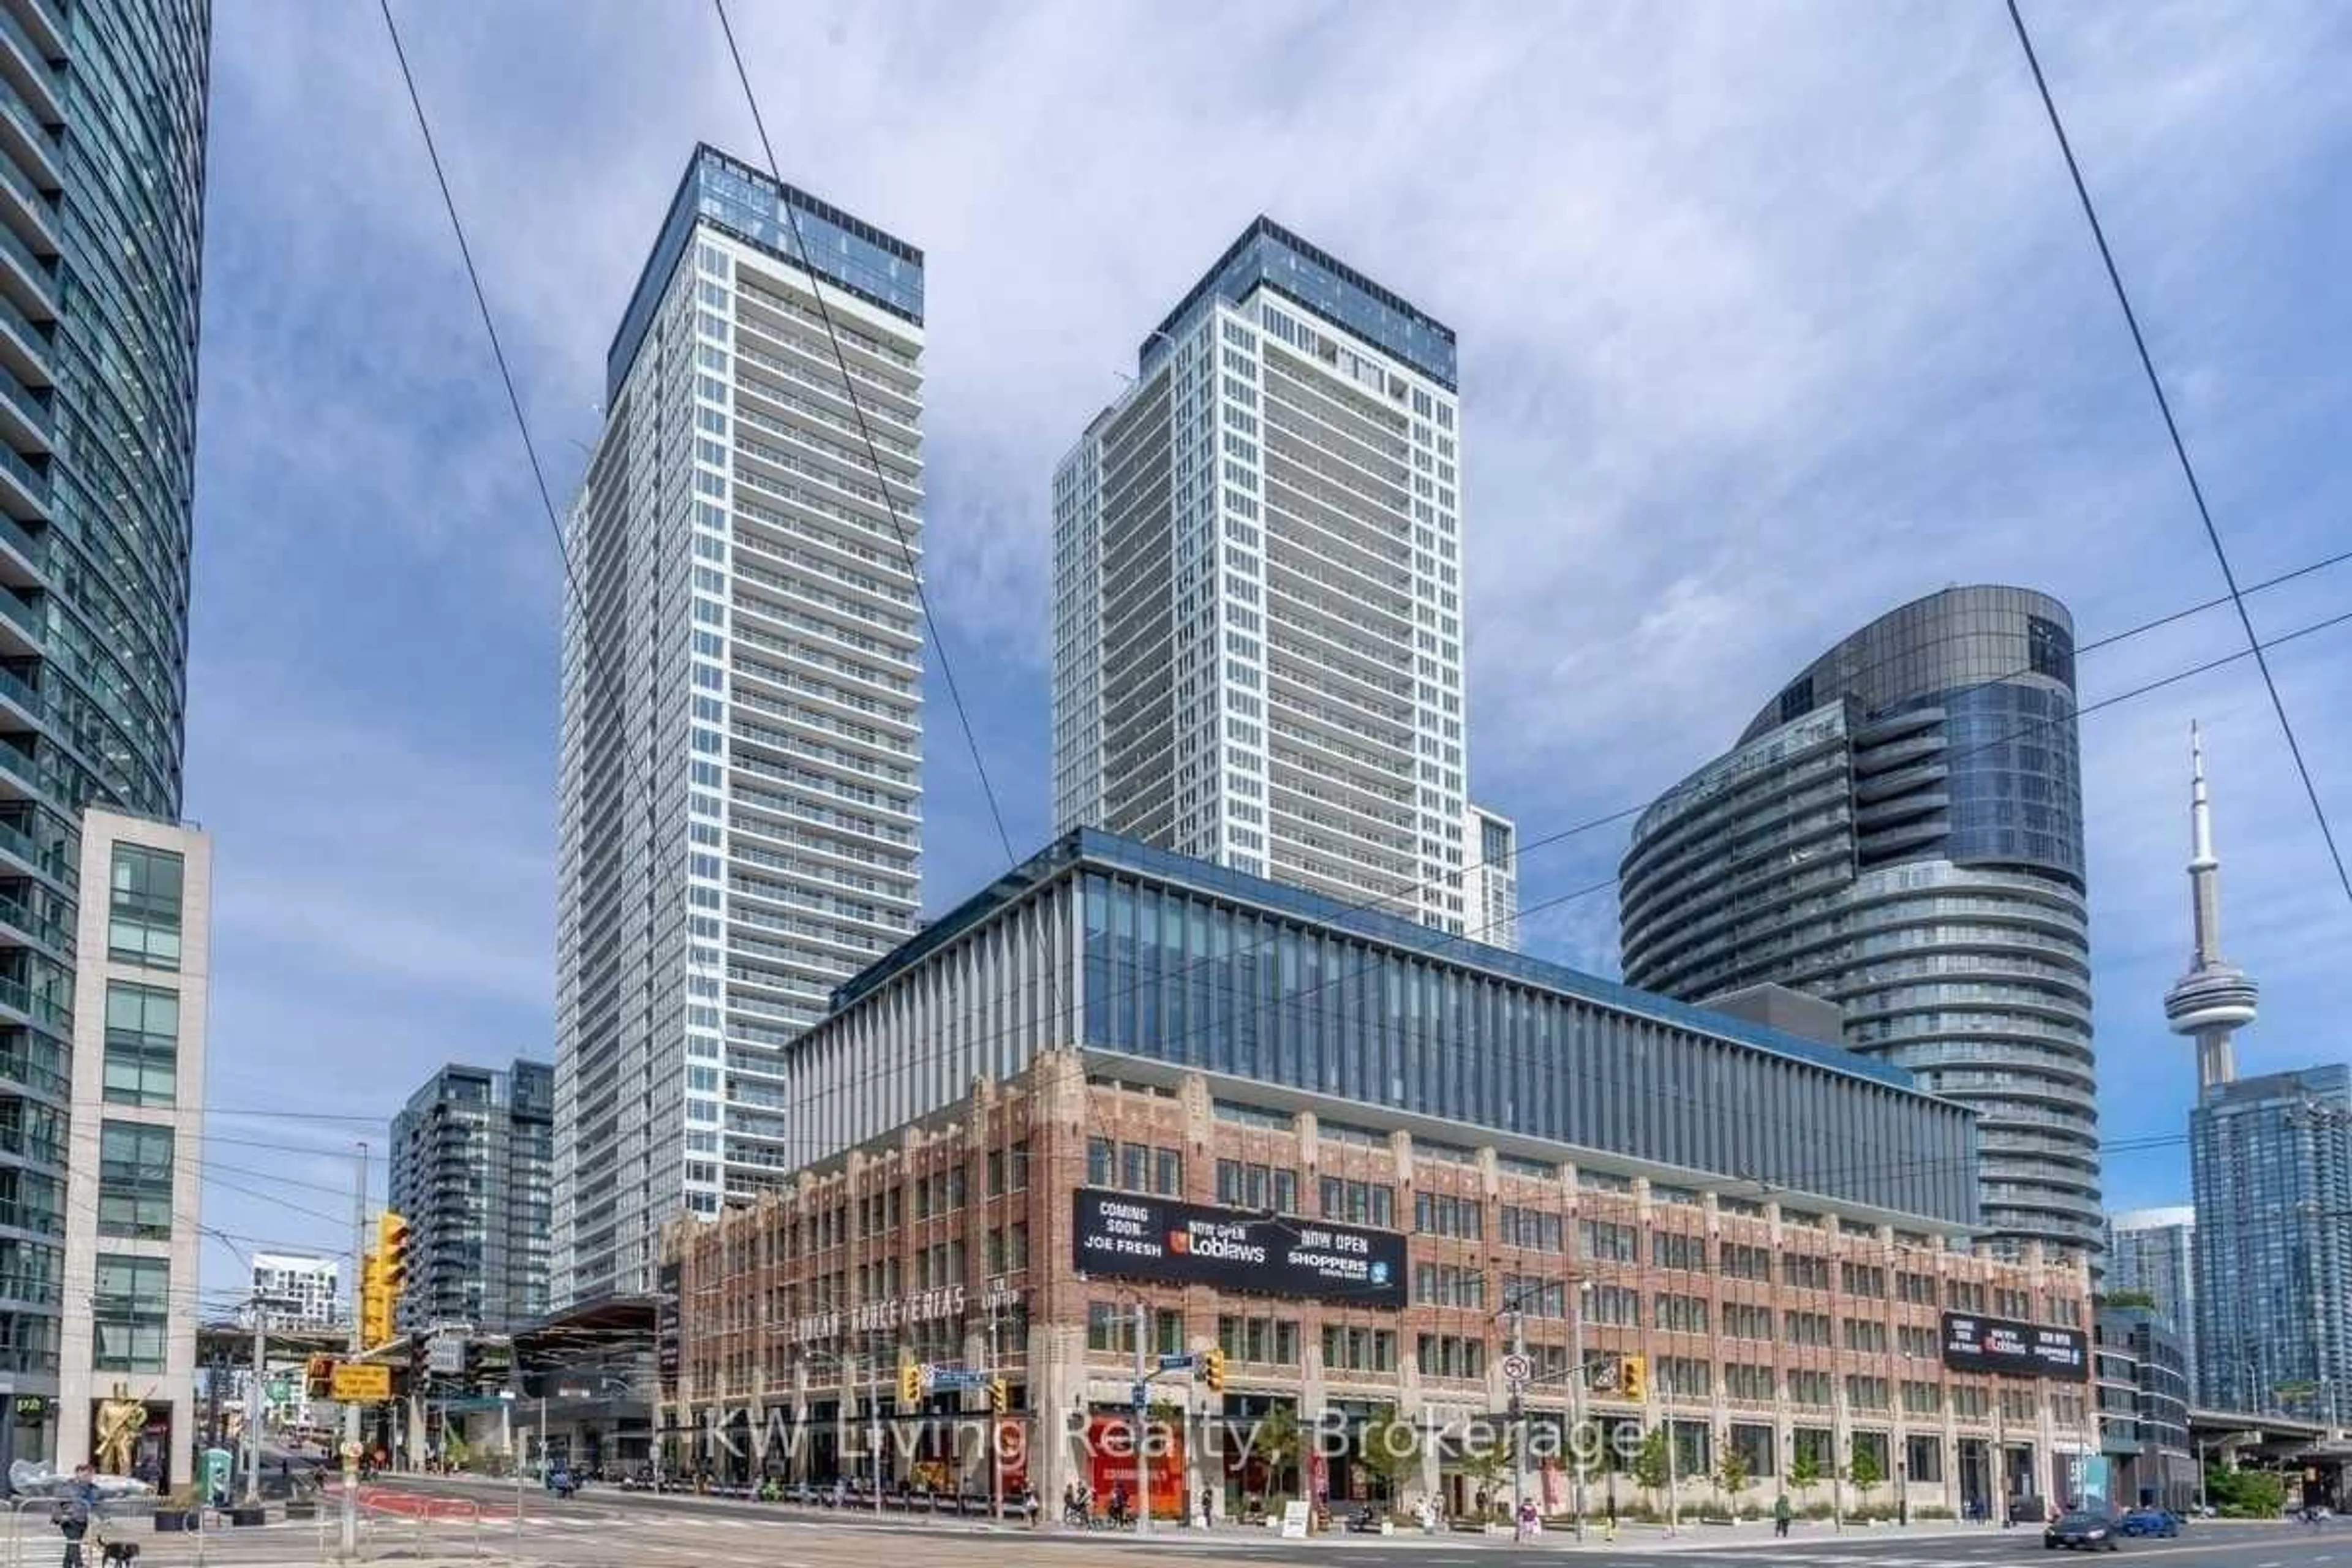
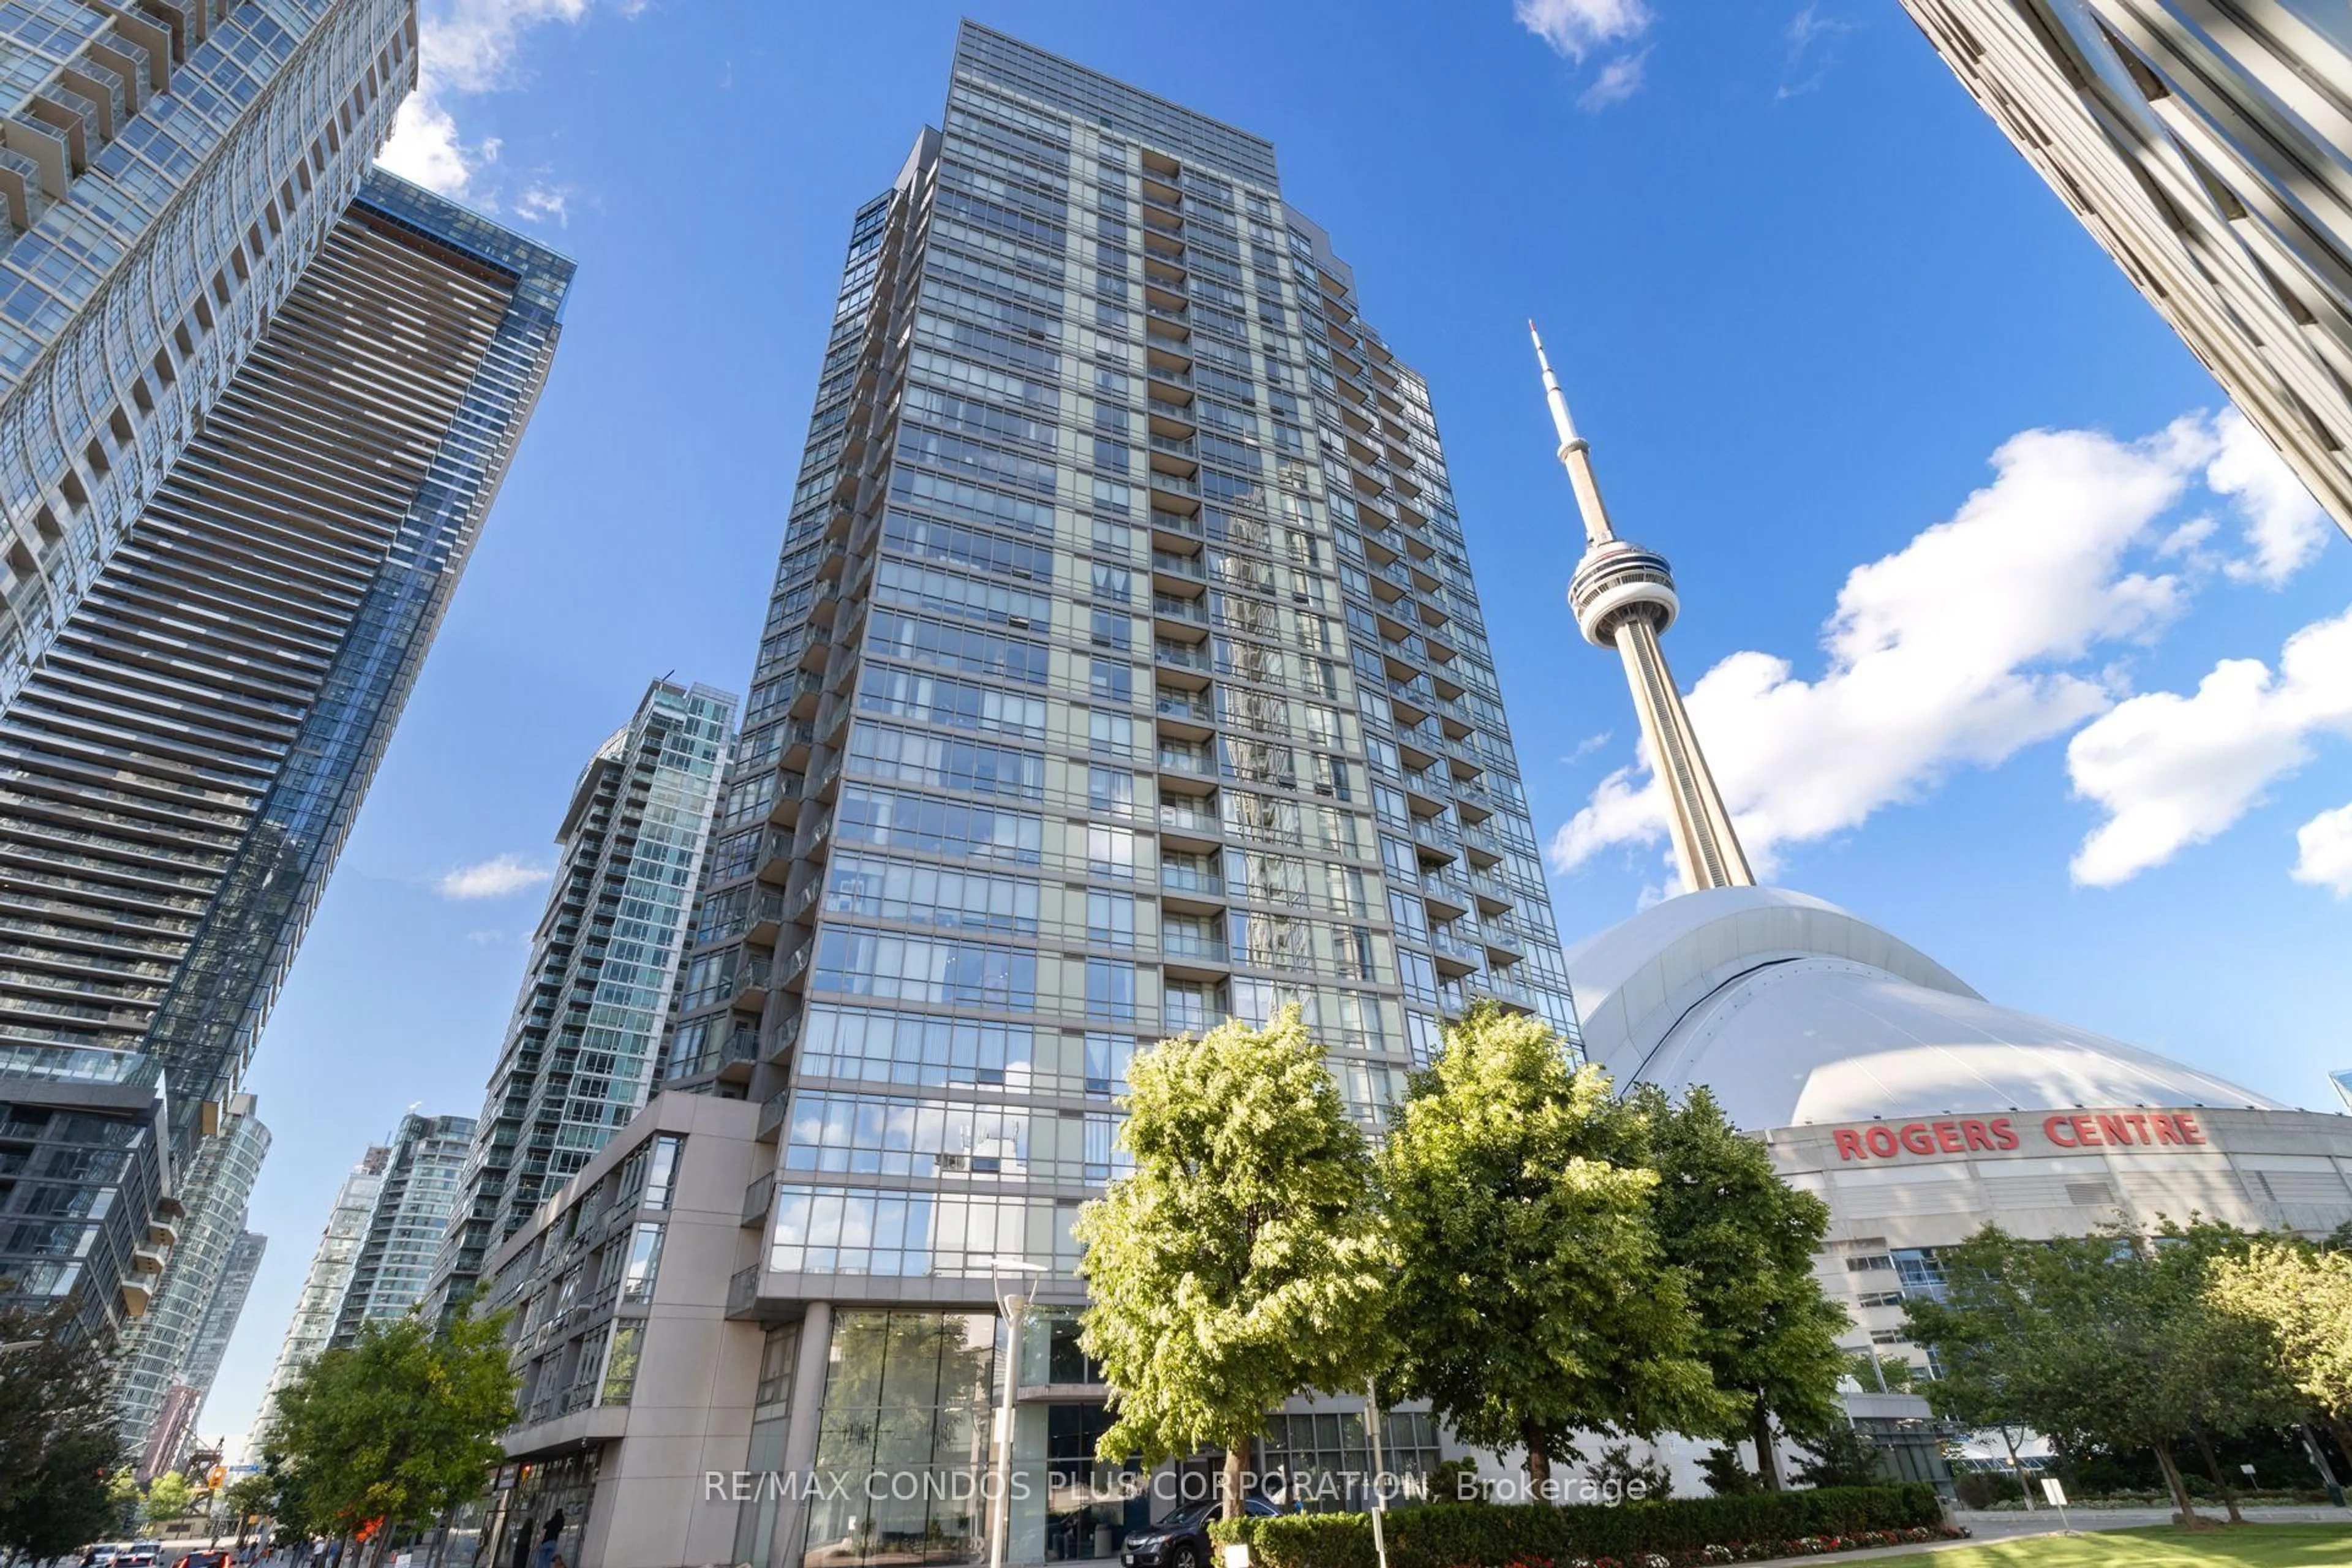
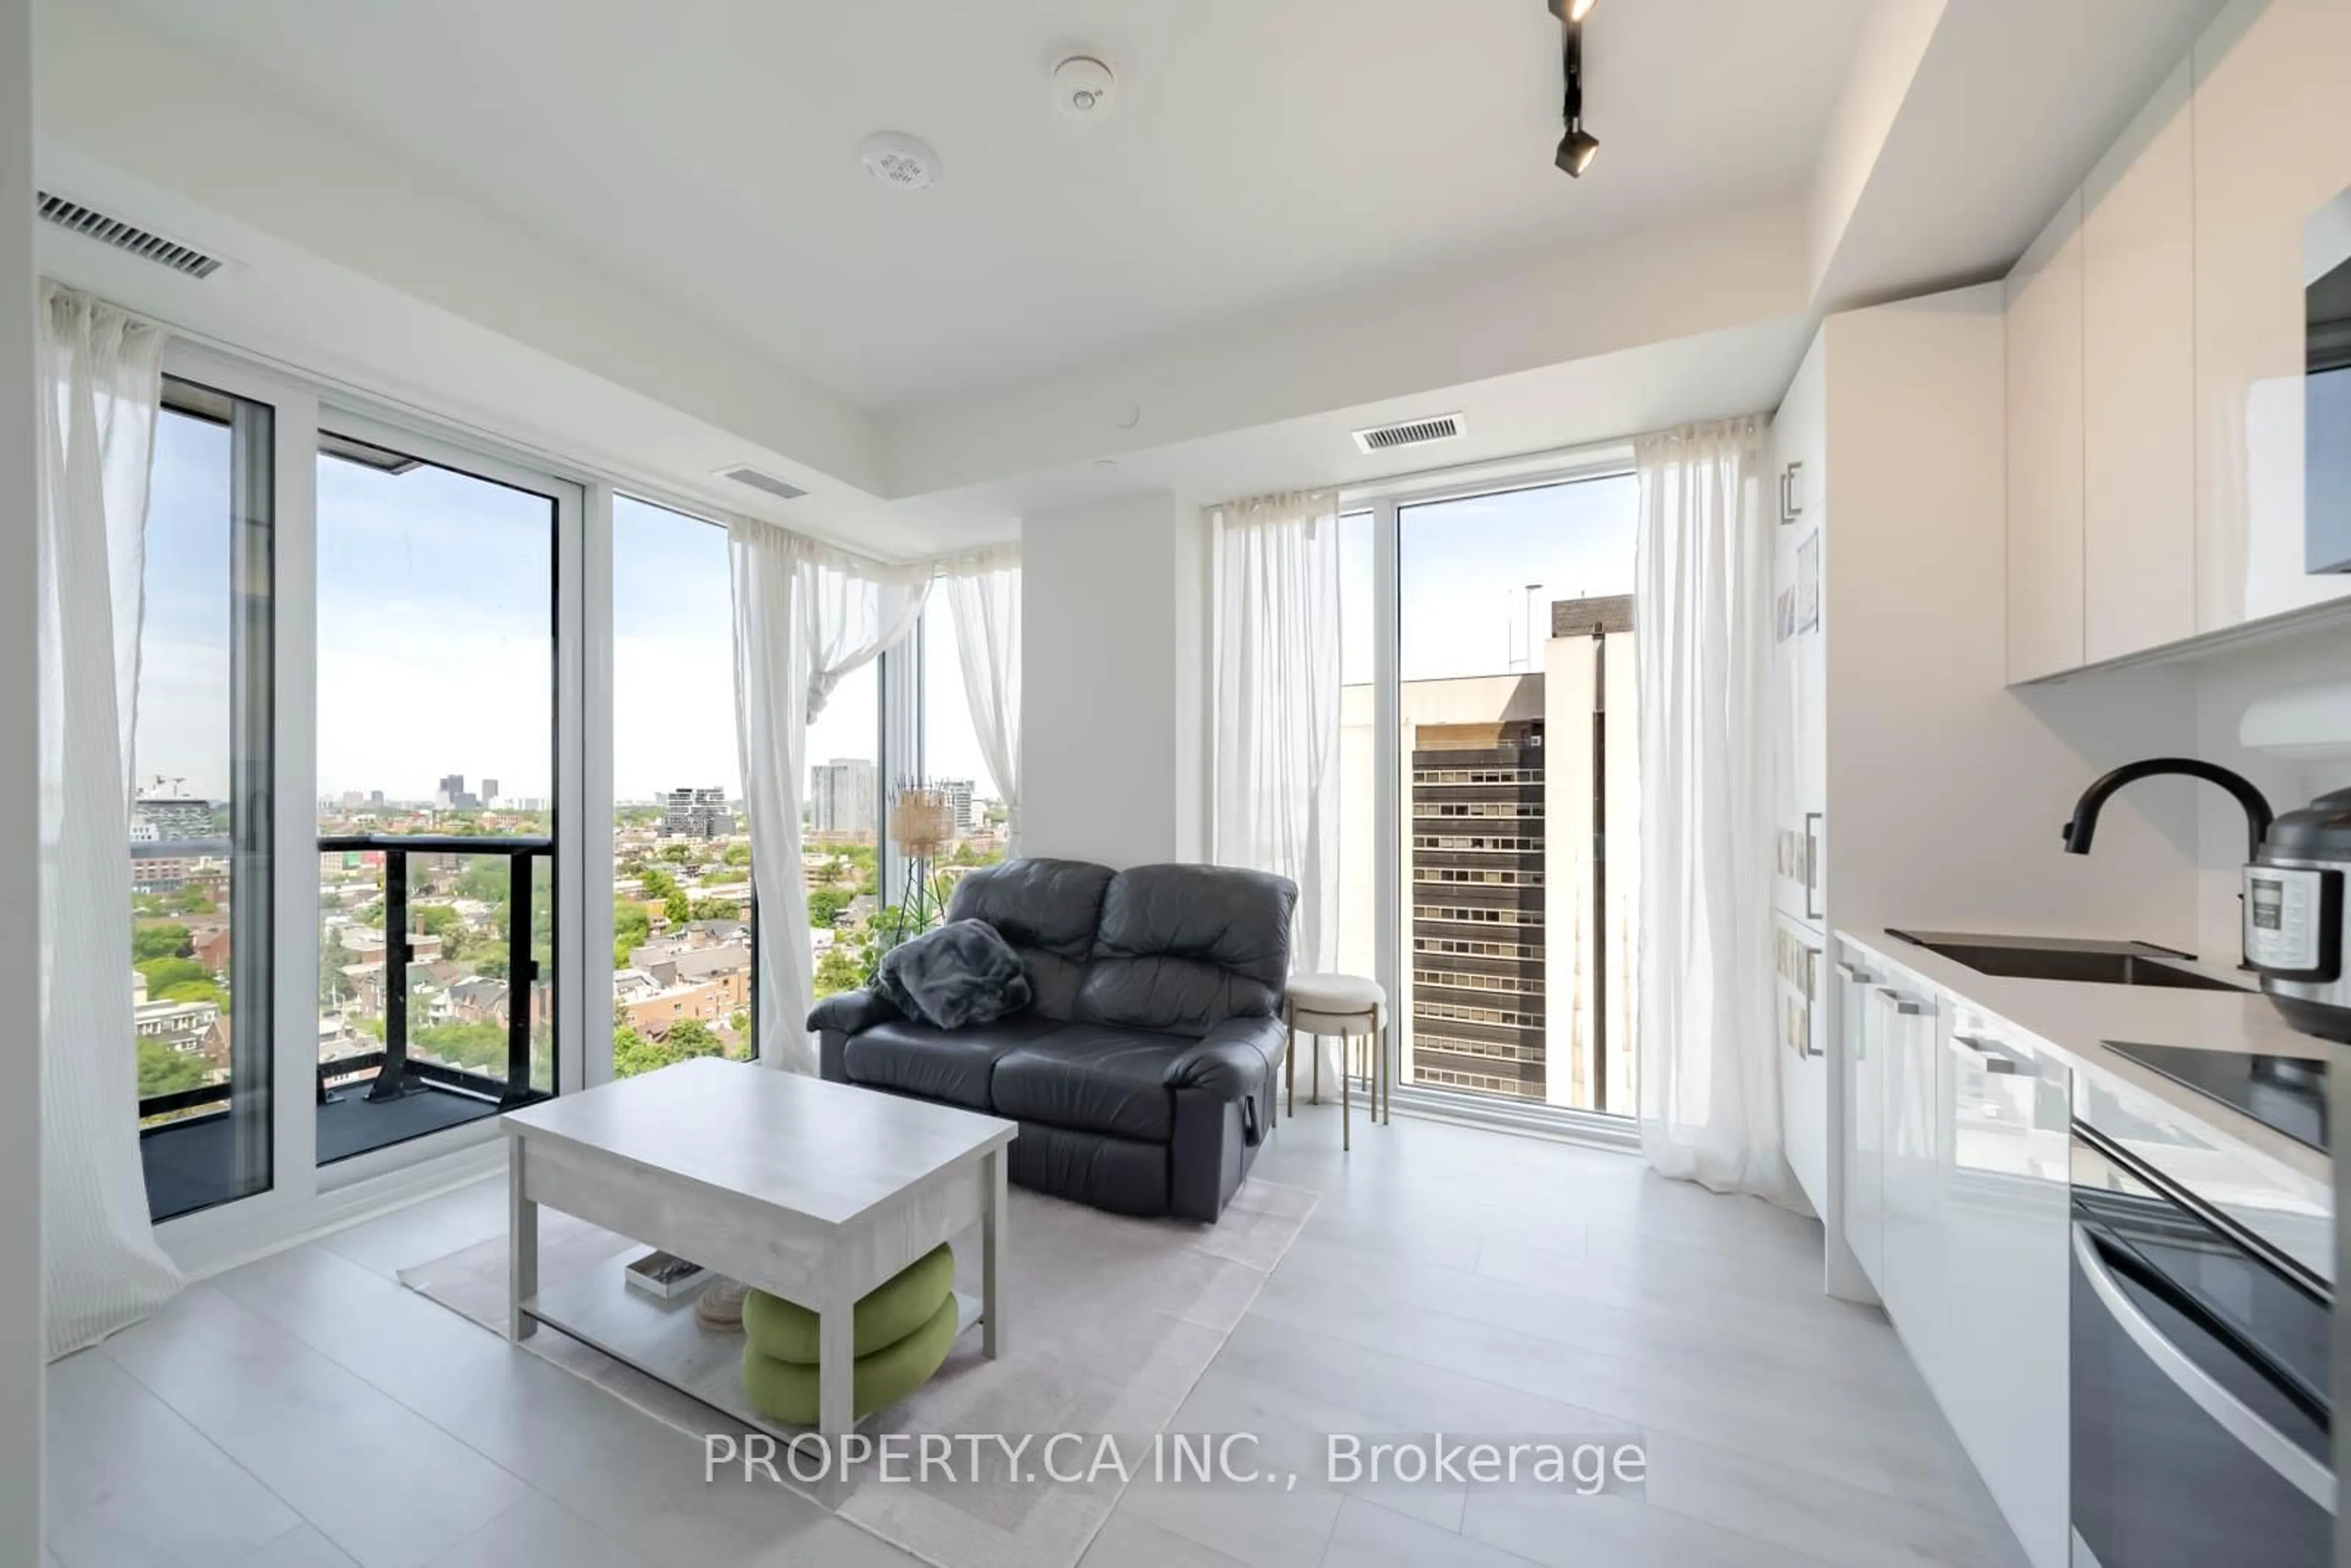
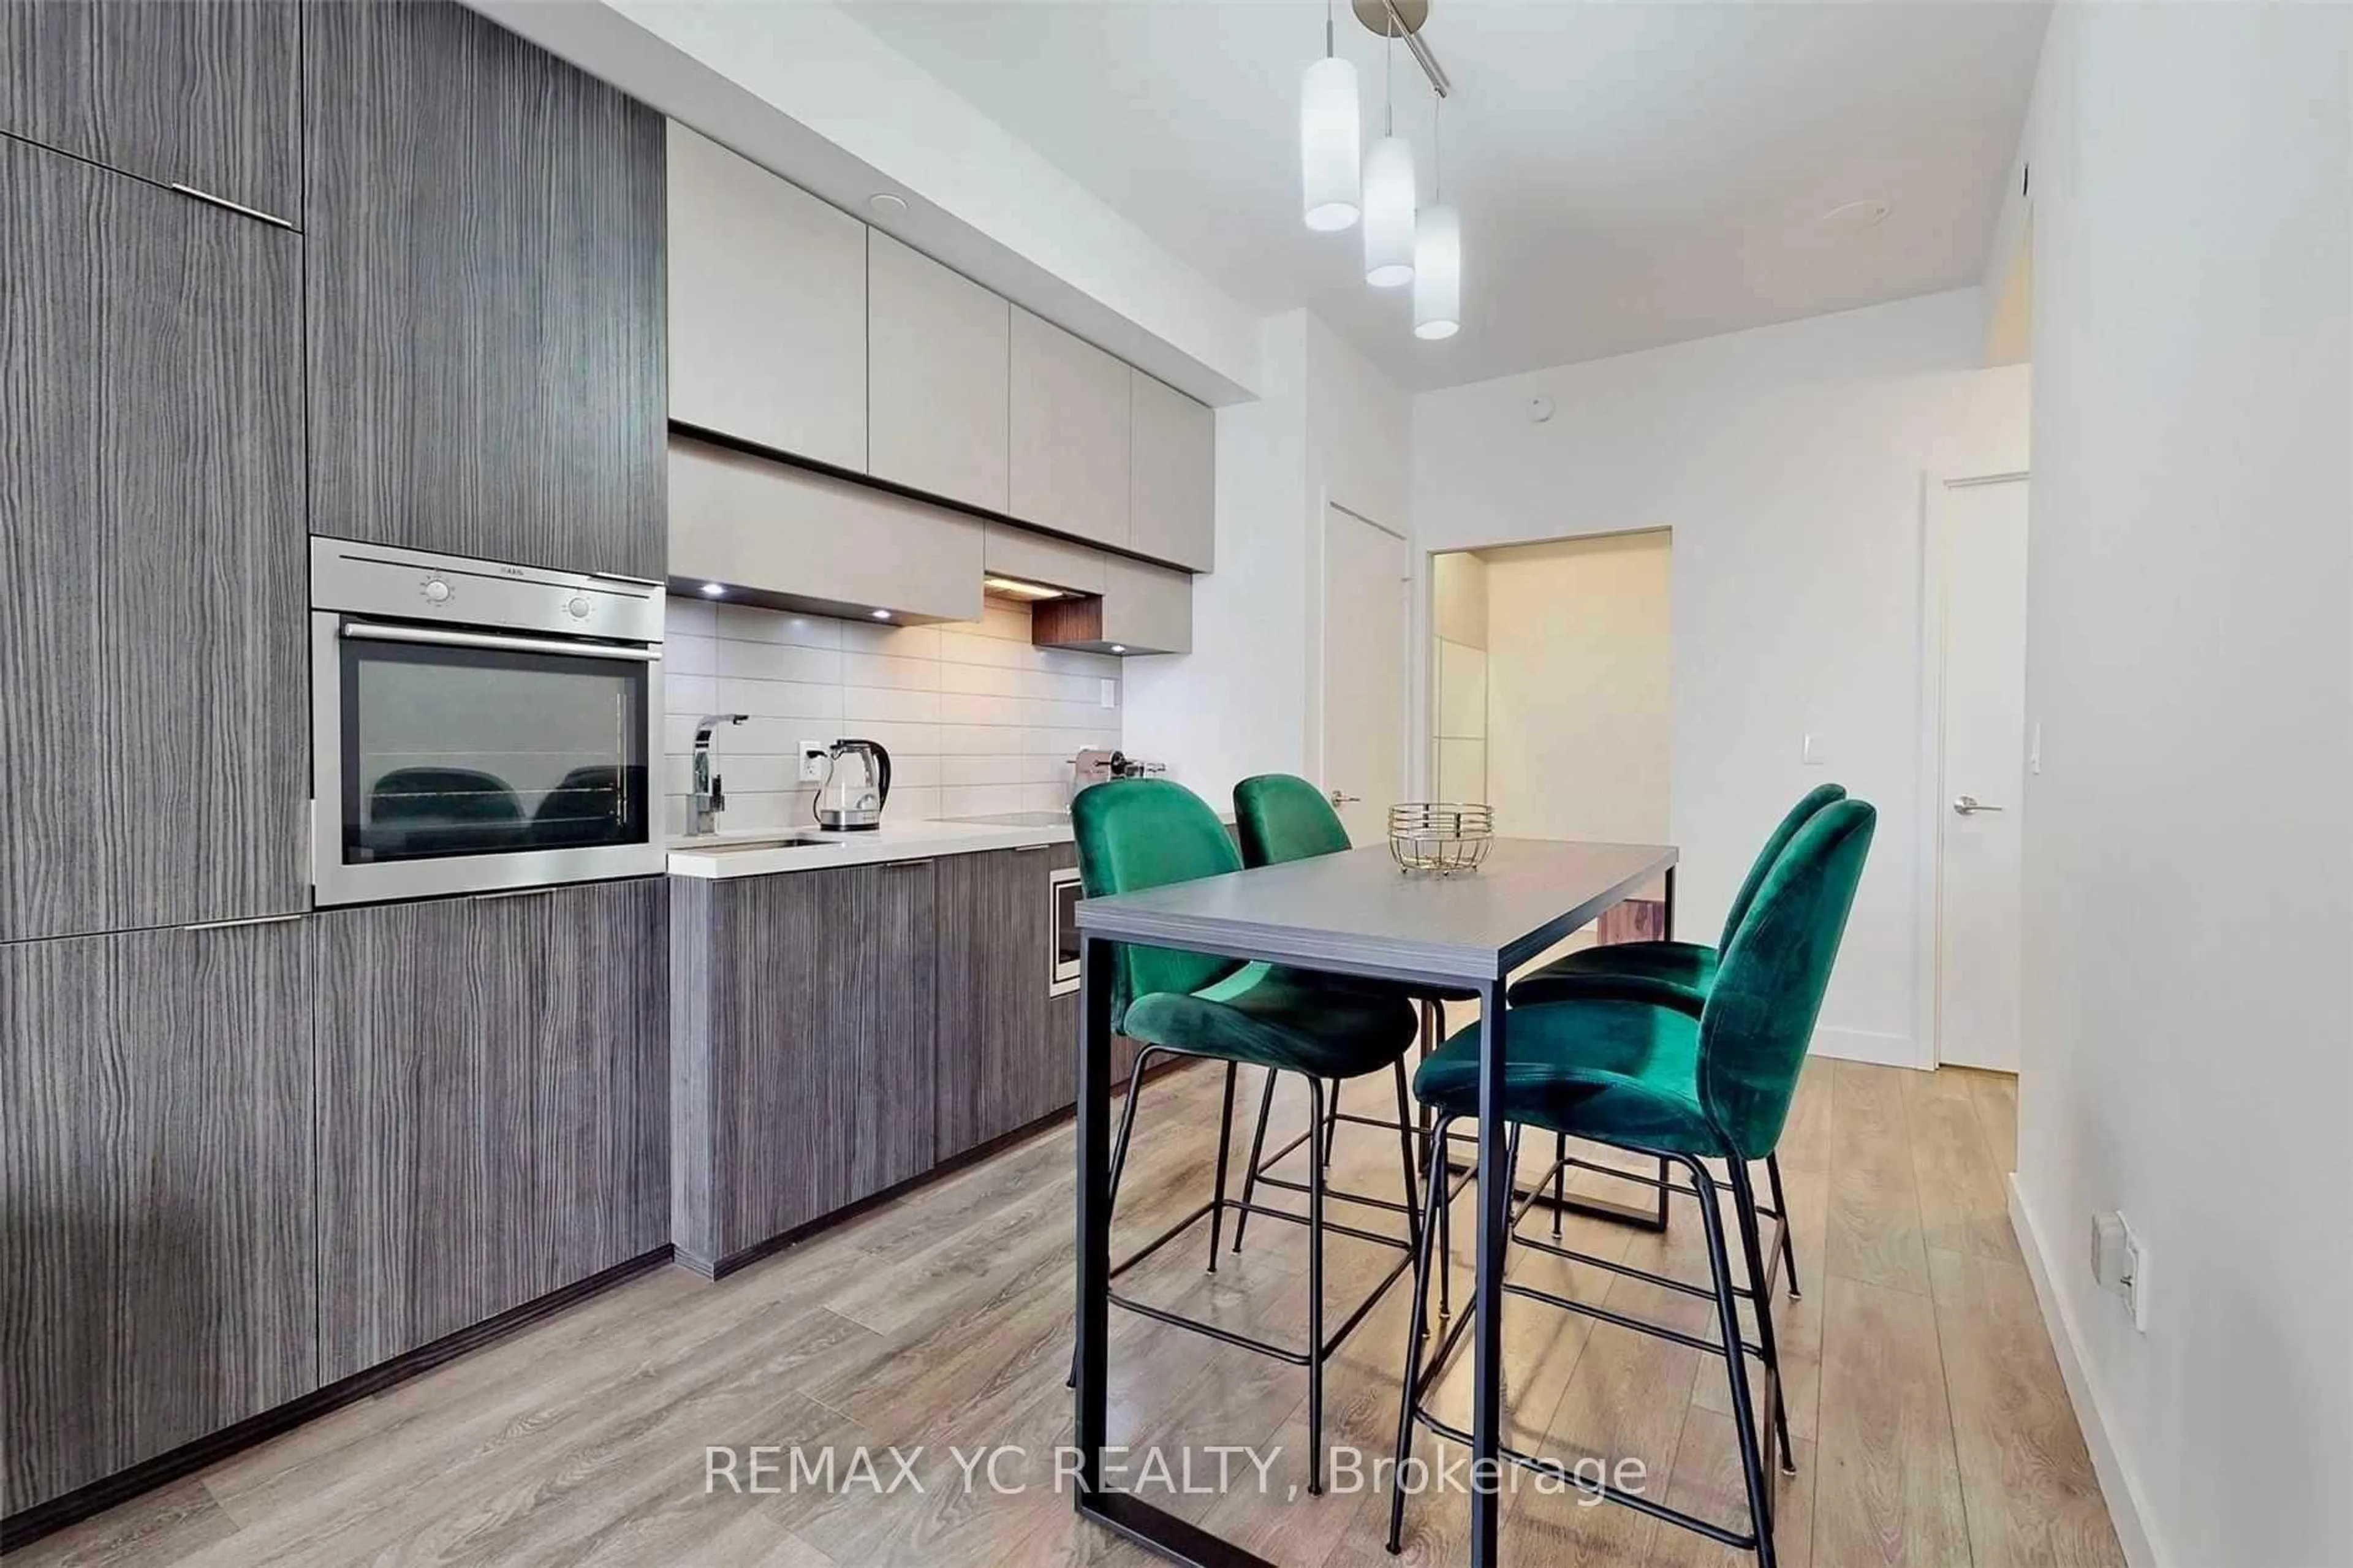
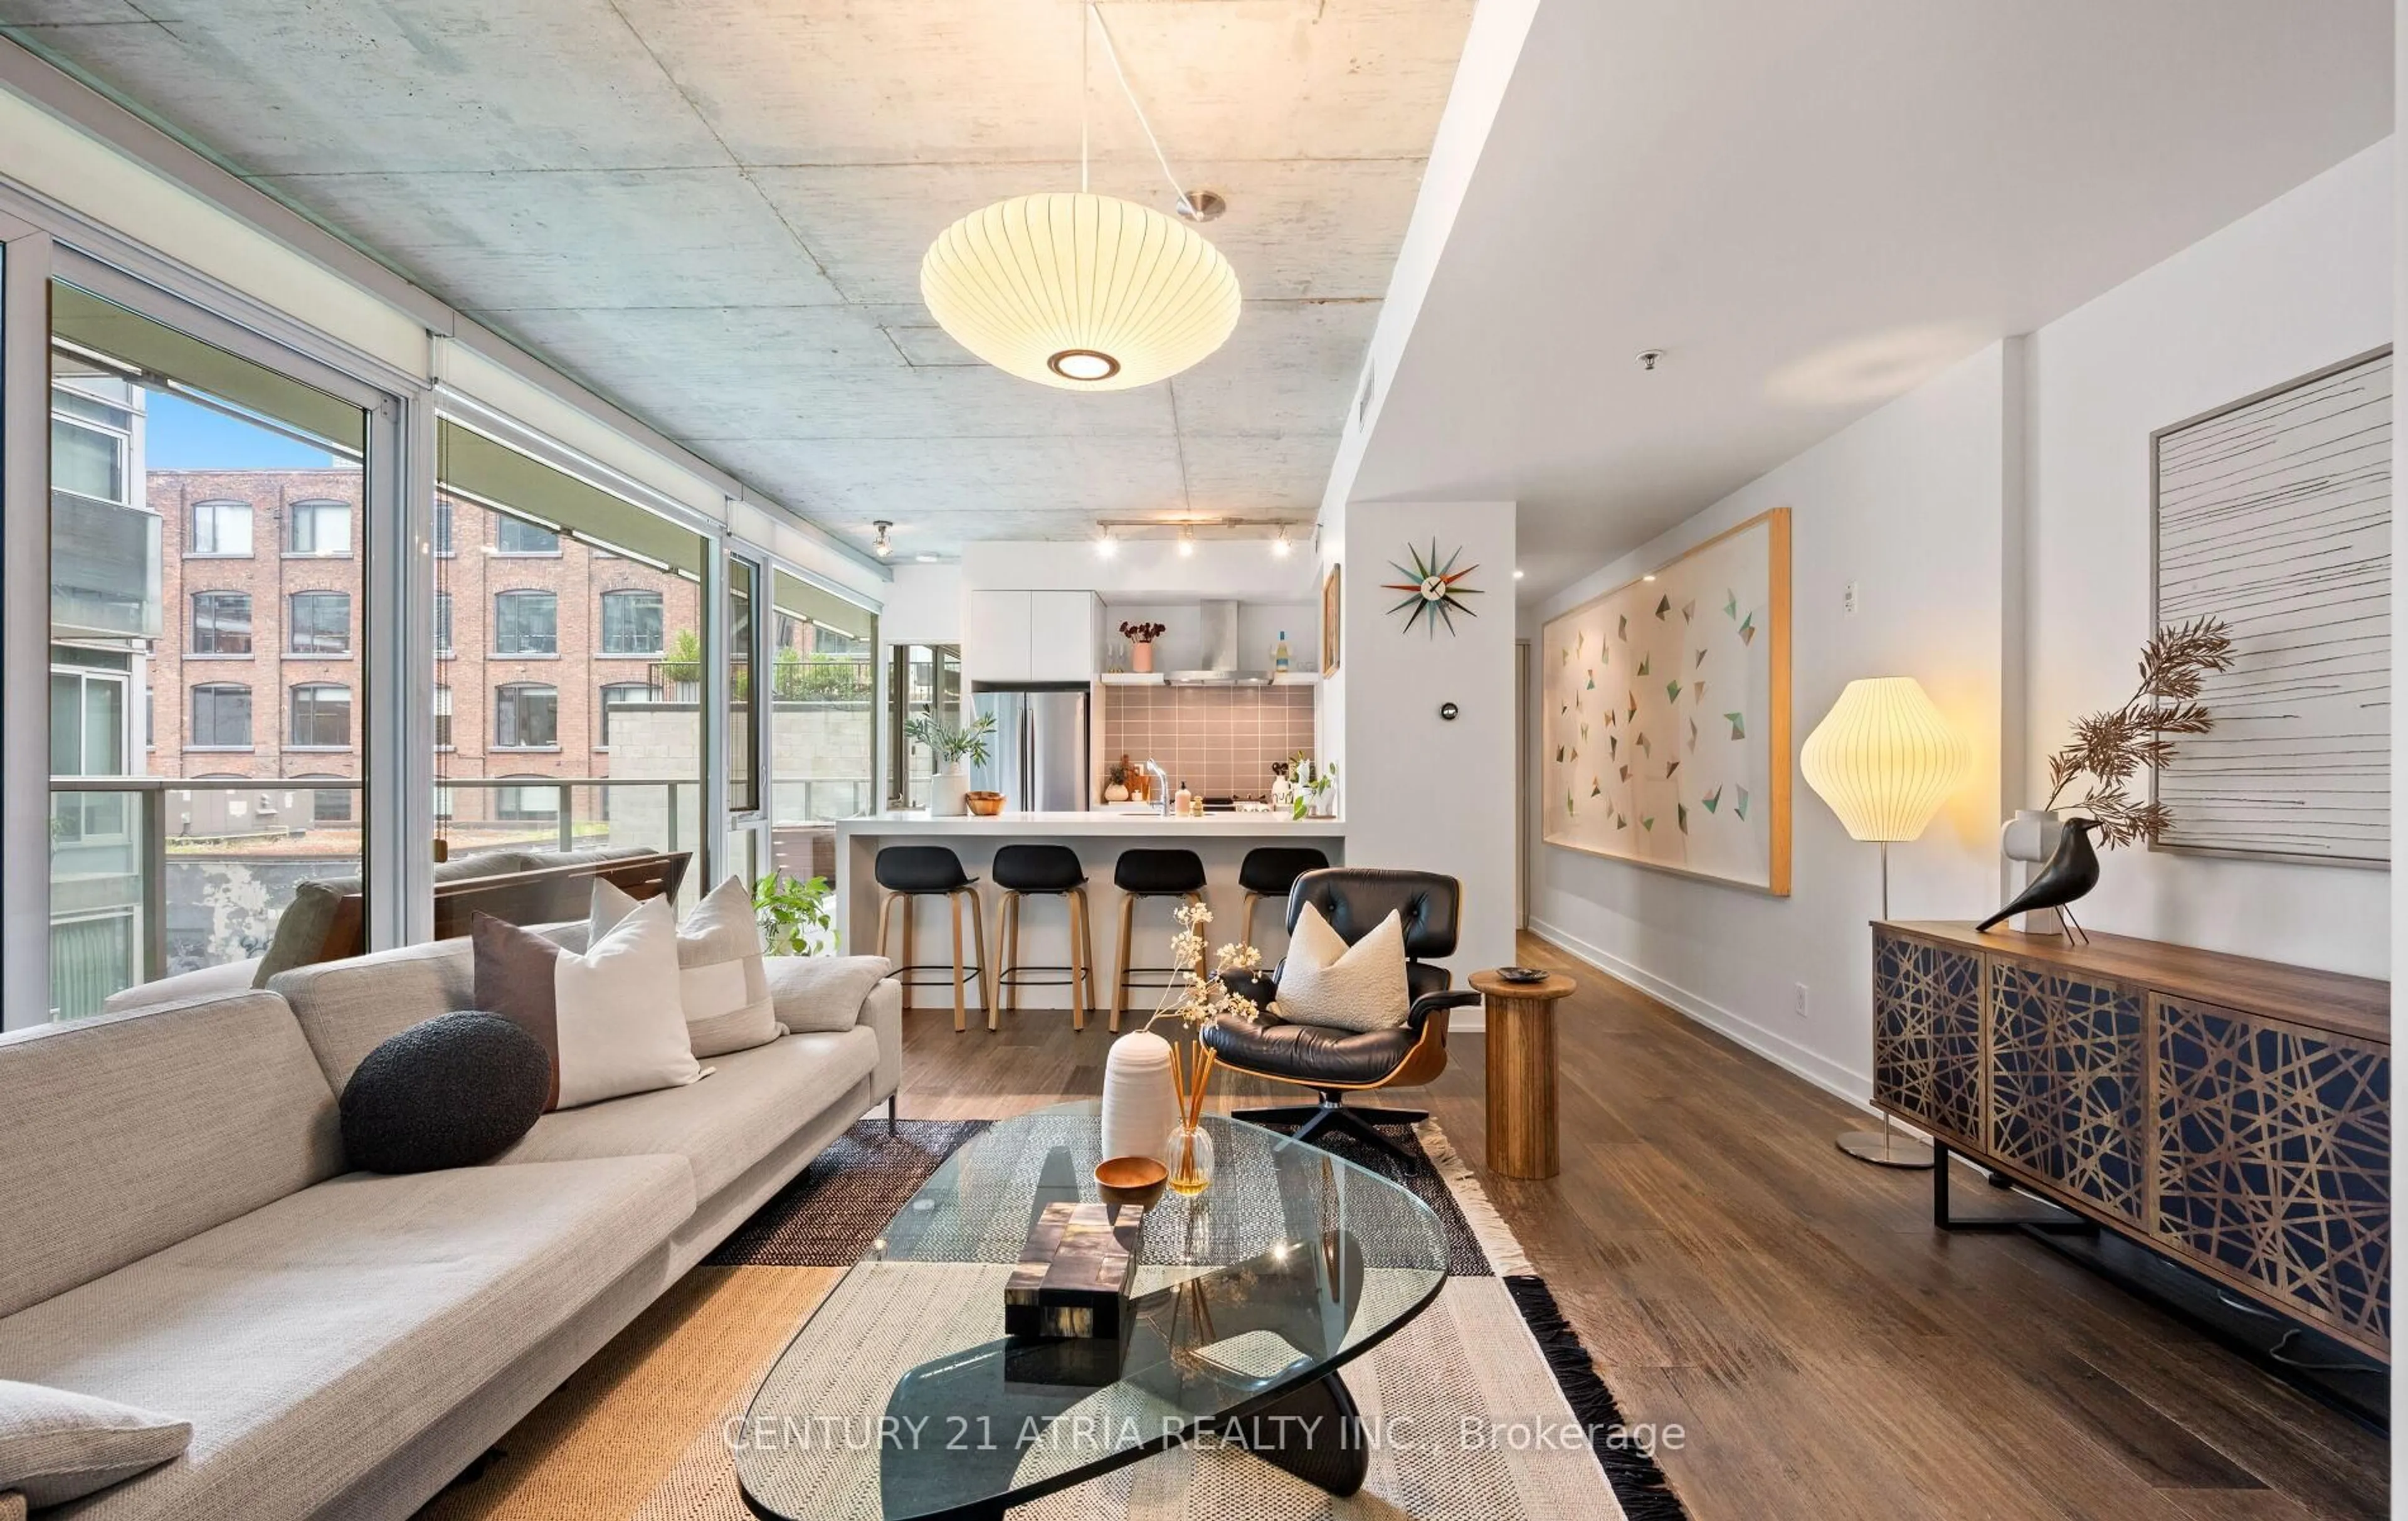
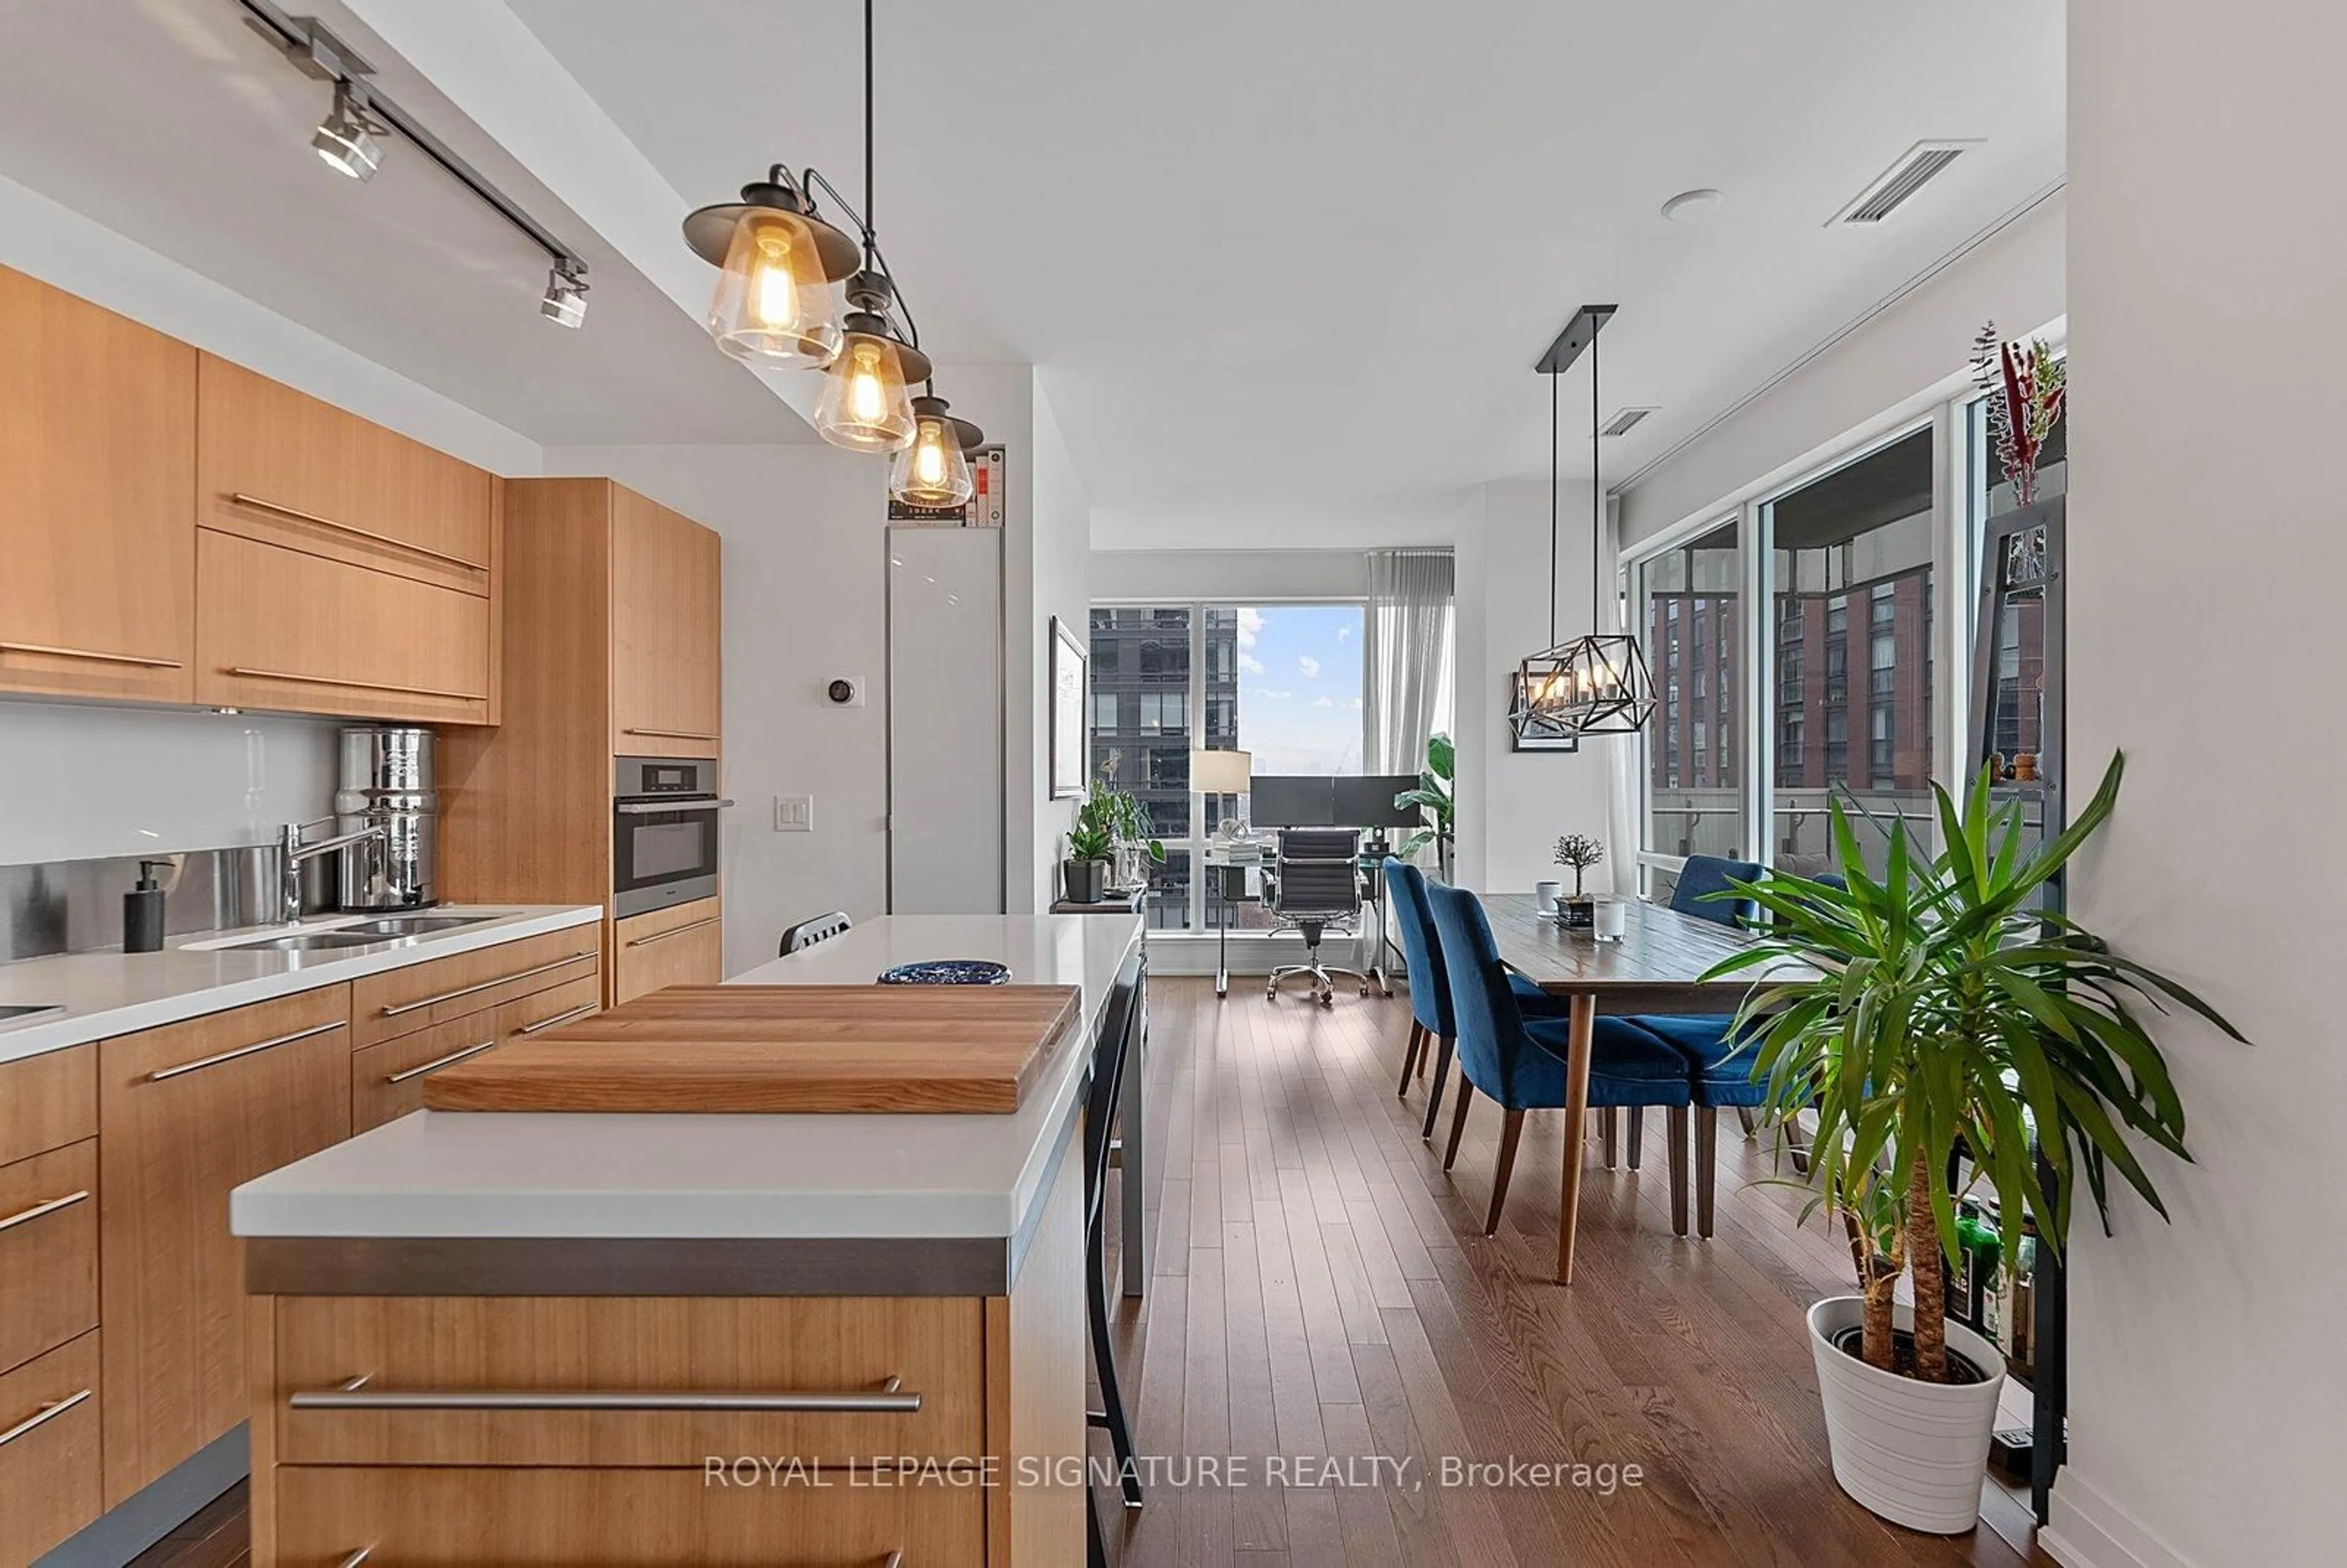
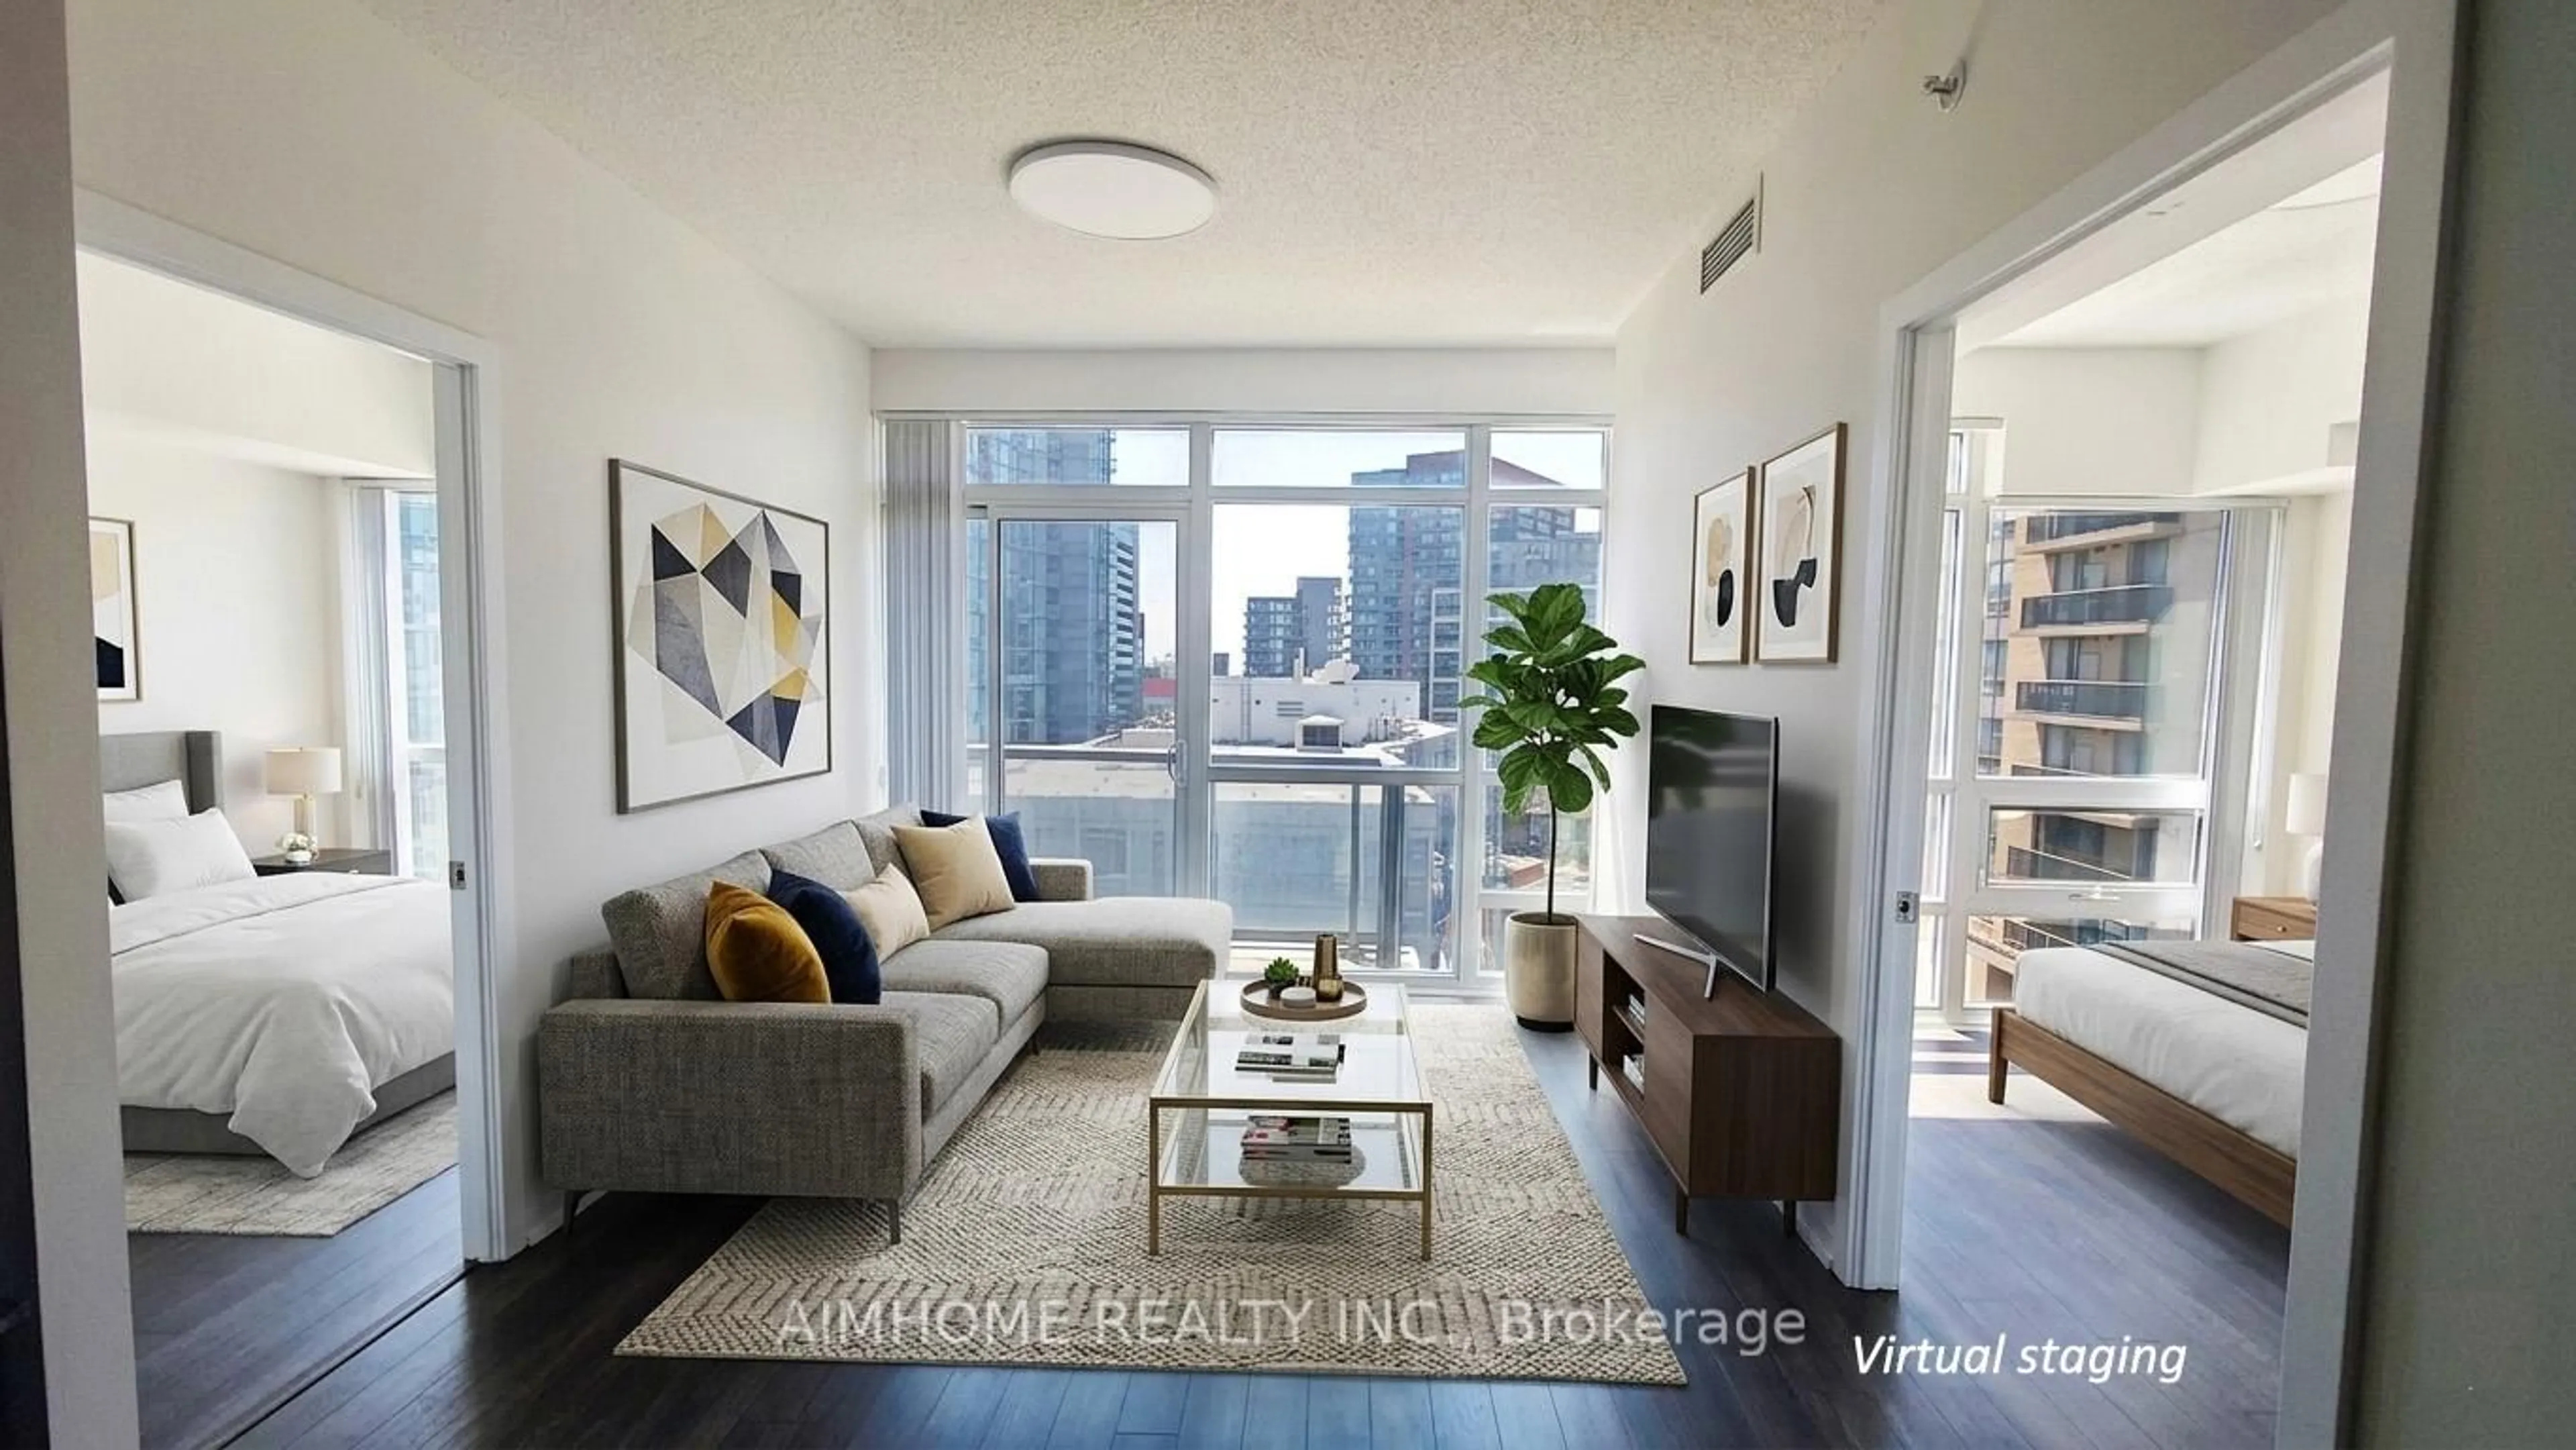
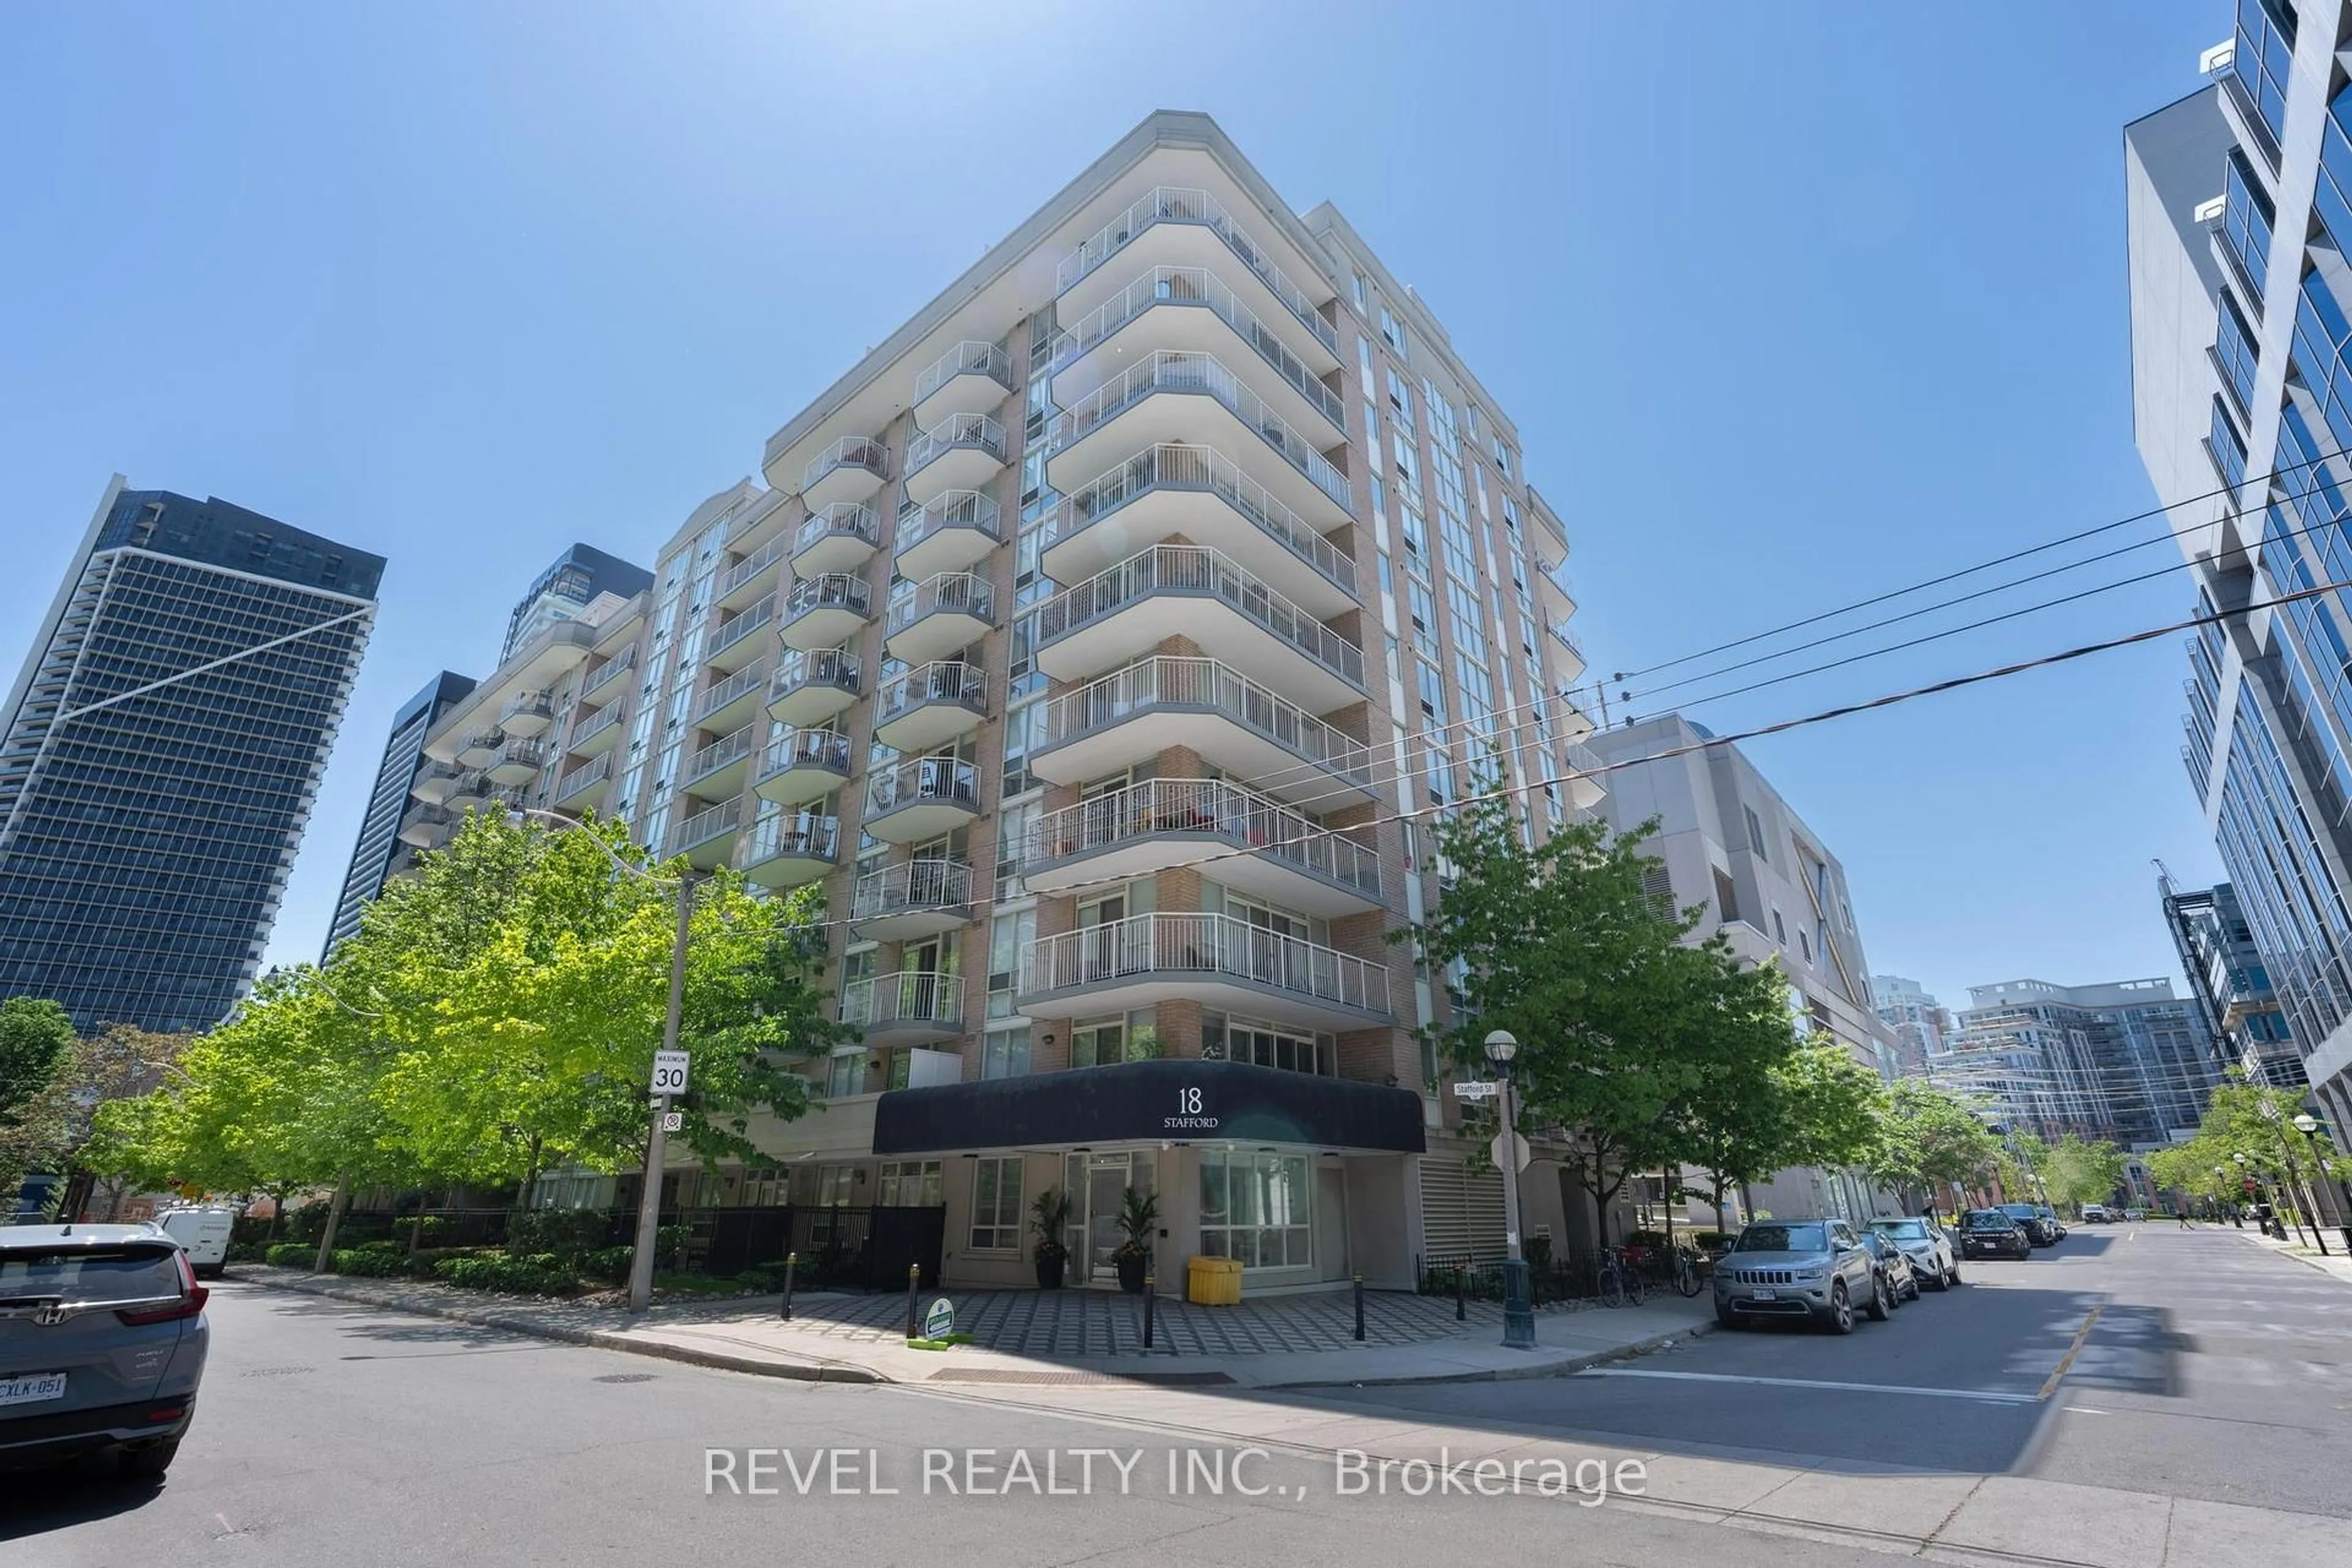
100 WALK SCORE! This is a Greenpark built, 5 star, luxury boutique condominium. 9ft ceilings, custom cabinetry and built-in, energy efficient appliances plus quartz counters, modern fixtures and laminate floors make this unit a pleasure to come home to. 12th floor amenities include party room & lounge, private dining room, games room, private theatre room, fitness studio, private spa treatment room, outdoor terrace with barbecue stations, lounge areas & fire features. The "Sky Lounge" provides the ultimate poolside experience and features a spectacular view of the Toronto Cityscape. Please note that this unit has been virtually staged in the photos to protect the Tenant's privacy.


Property Details

StyleApartment
View-
Age of property0-5
SqFt~600-699 SqFt
Lot Size-
Parking Spaces-
MLS ®NumberC12720942
Community NameEntertainment District
Data SourceTRREB
Listing byRE/MAX REALTRON REALTY INC.

Features

Heating: Forced Air
Cooling: Central Air

Flat Floor

Living

6.71 x 3.96

Laminate / W/O To Balcony / Combined W/Kitchen

Kitchen

0.0 x 0.0

Laminate / B/I Appliances / Quartz Counter

Br

3.05 x 2.84

Laminate / Mirrored Closet / Large Window


Features

Patio: Open
Balcony: Open

3Story
Elevator
Amenities

Concierge, Games Room, Gym, Media Room, Party/Meeting Room, Rooftop Deck/Garden

Inclusions
Hydro
Water
Parking
Cable
Heat

Property History

Jan 22, 2026
ListedActive
$558,000
7 hours on market
history photo preview21
Listing by trreb®
Property listed by RE/MAX REALTRON REALTY INC., Brokerage
Agent Banner Image
Interested in this property?Get in touch to get the inside scoop.

Market Data - Entertainment District

Geo Zone Map ThumbnailEntertainment District

Strong Buyer's Market

View Market Data

Condo - for the past 30 days

Buyer's market Seller's market

Avg. Days on Market

Past 30 days

47 days

Compared to

2025

43 days

2024

41 days

2023

30 days

New Listings

Past 30 days

78 listings

Compared to

2025

95 listings

2024

87 listings

2023

57 listings

Units sold

Past 30 days

35 units

Compared to

2025

38 units

2024

49 units

2023

32 units

Median Sold Price

Past 30 days

$695,000

Compared to

2025

$709,500

2024

$698,000

2023

$700,000


Population and Demographics

Overview

Total population 32132
Average household income $172,021

Age (%)

0 to 19
7%
20 to 34
57%
35 to 49
22%
50 to 64
9%
65 and plus
5%

Household composition (%)

Single person
57%
Single family
32%
Multi person
11%
Multi family
0%

Mother tongue (%)

English
63%
Mandarin
10%
Yue (Cantonese)
4%
Spanish
3%
French
3%
Russian
2%
Arabic
2%
Hindi
2%
Korean
1%
Iranian Persian
1%
Others
1%

House tenancy (%)

Renters
61%
Owners
39%

What’s nearby?Essentials within 5 km

Local Logic

Transportation Scores

Estimated Budget