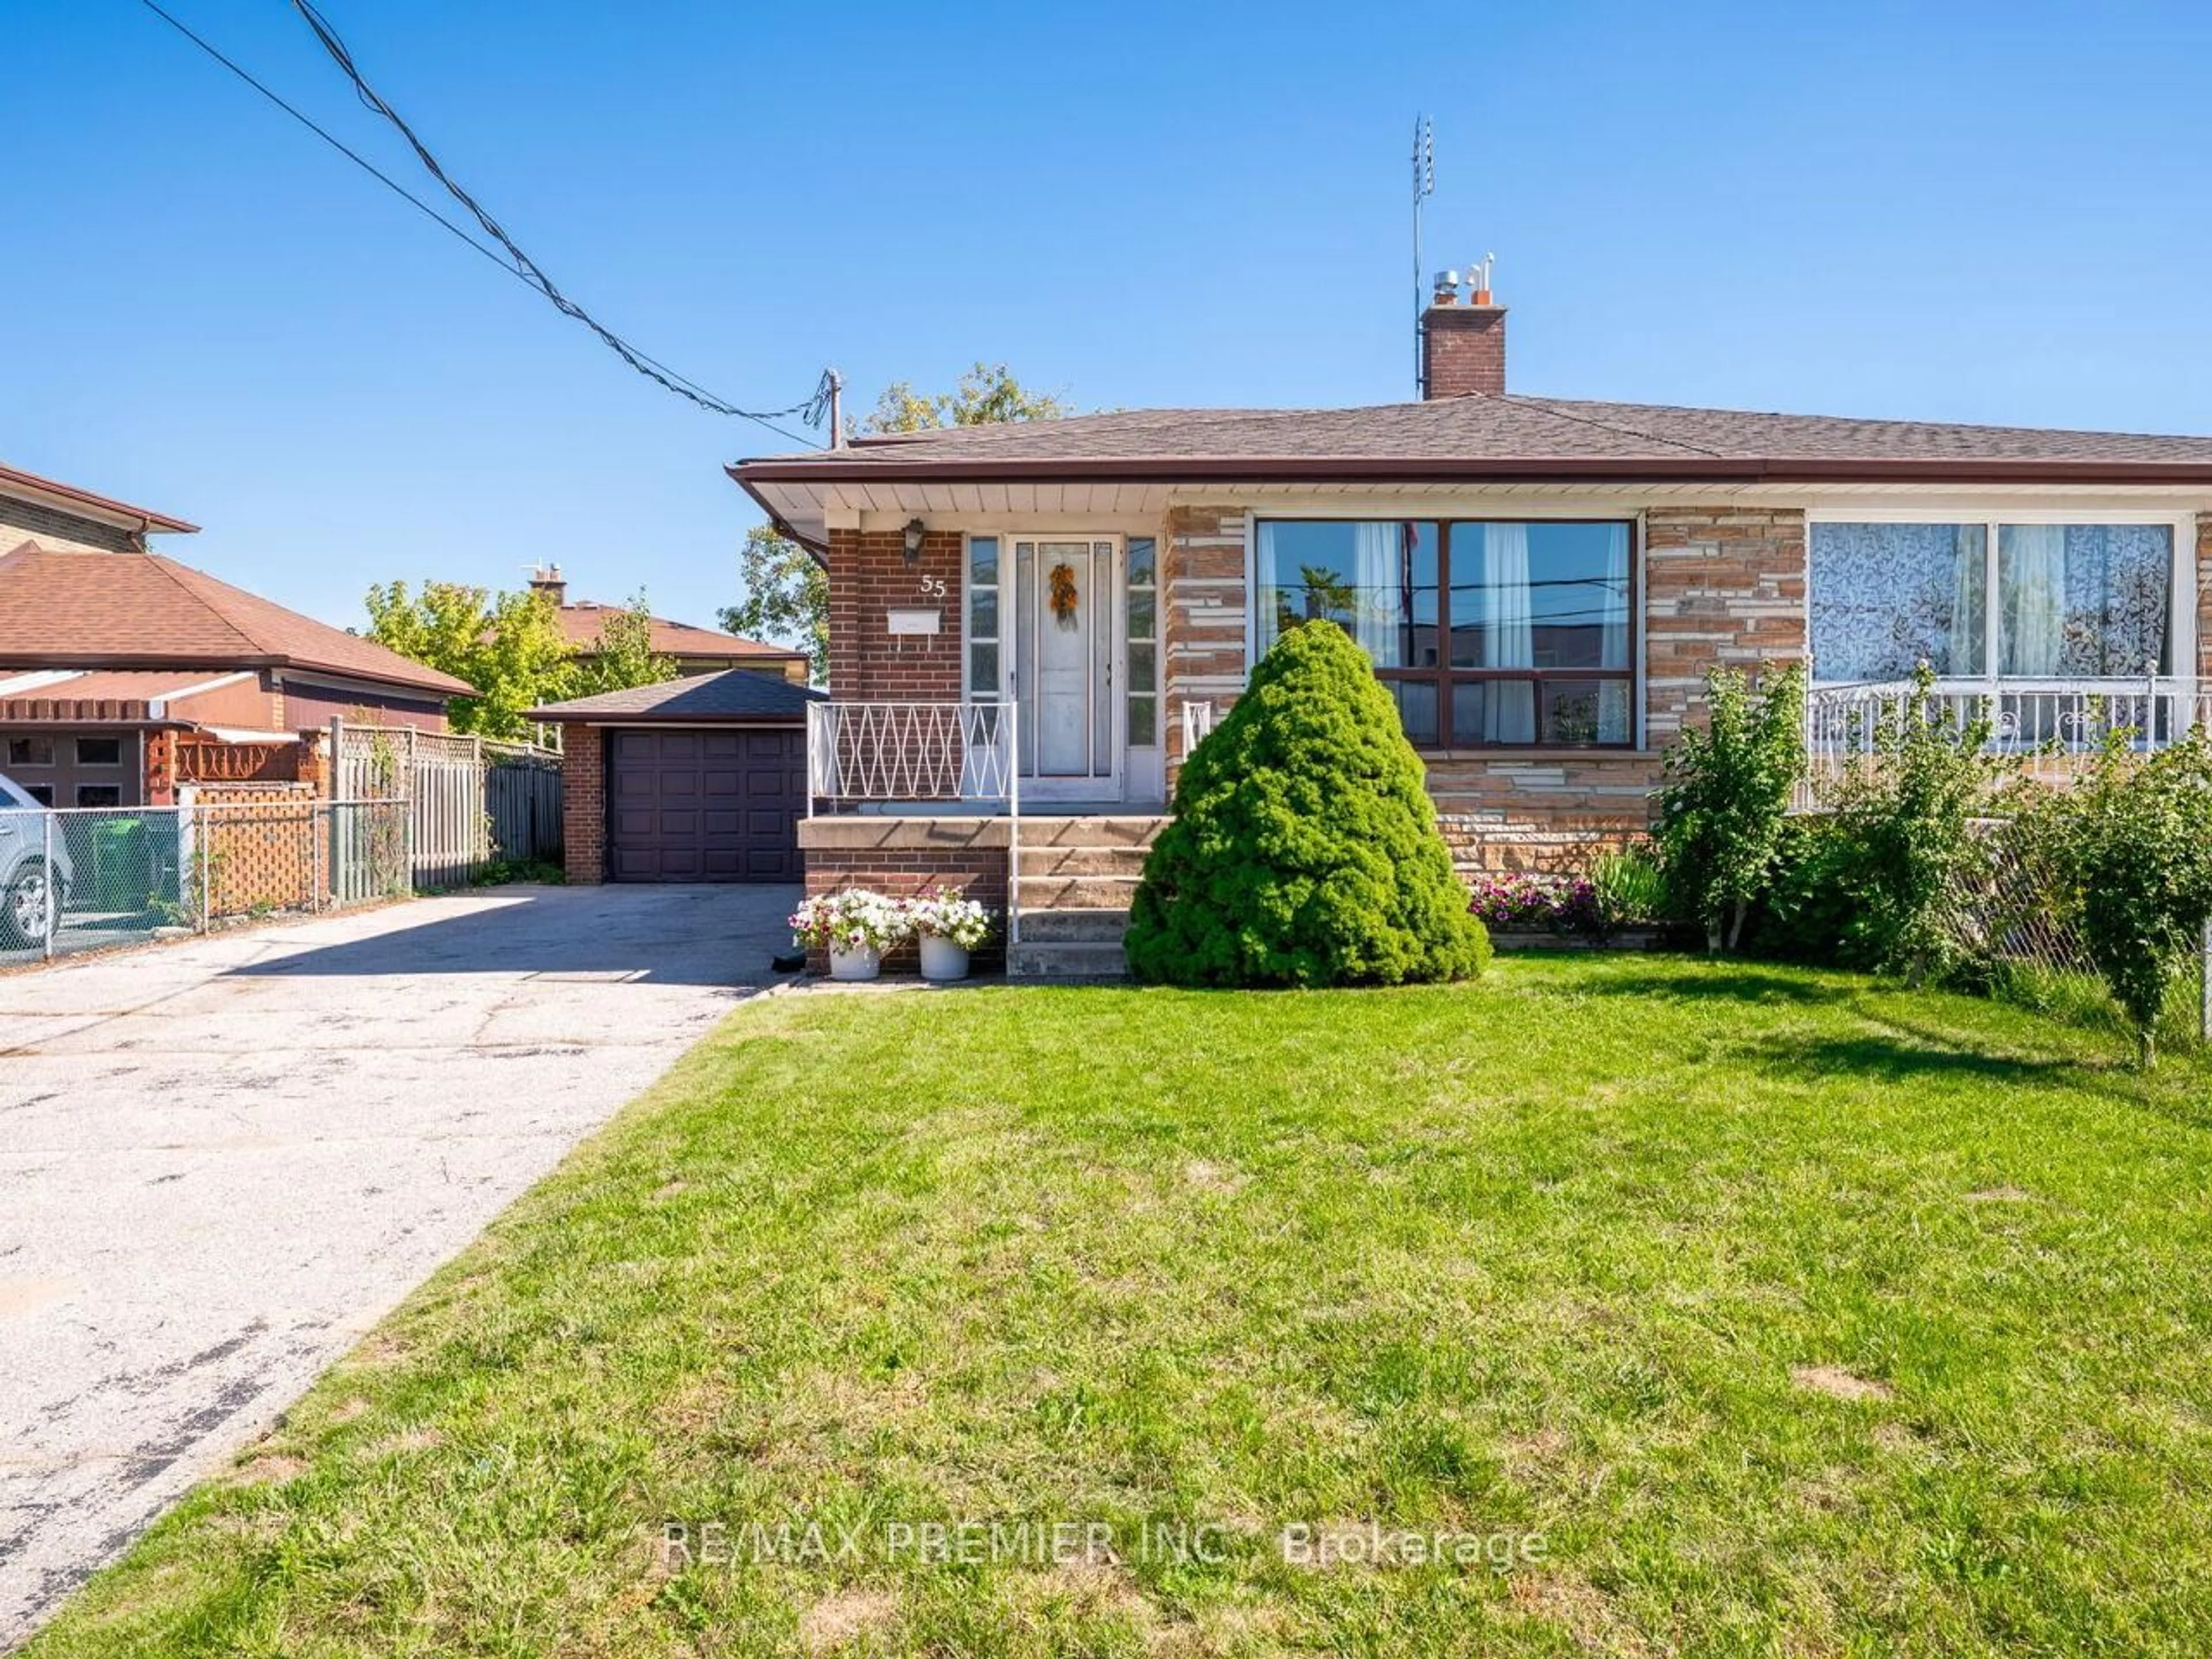
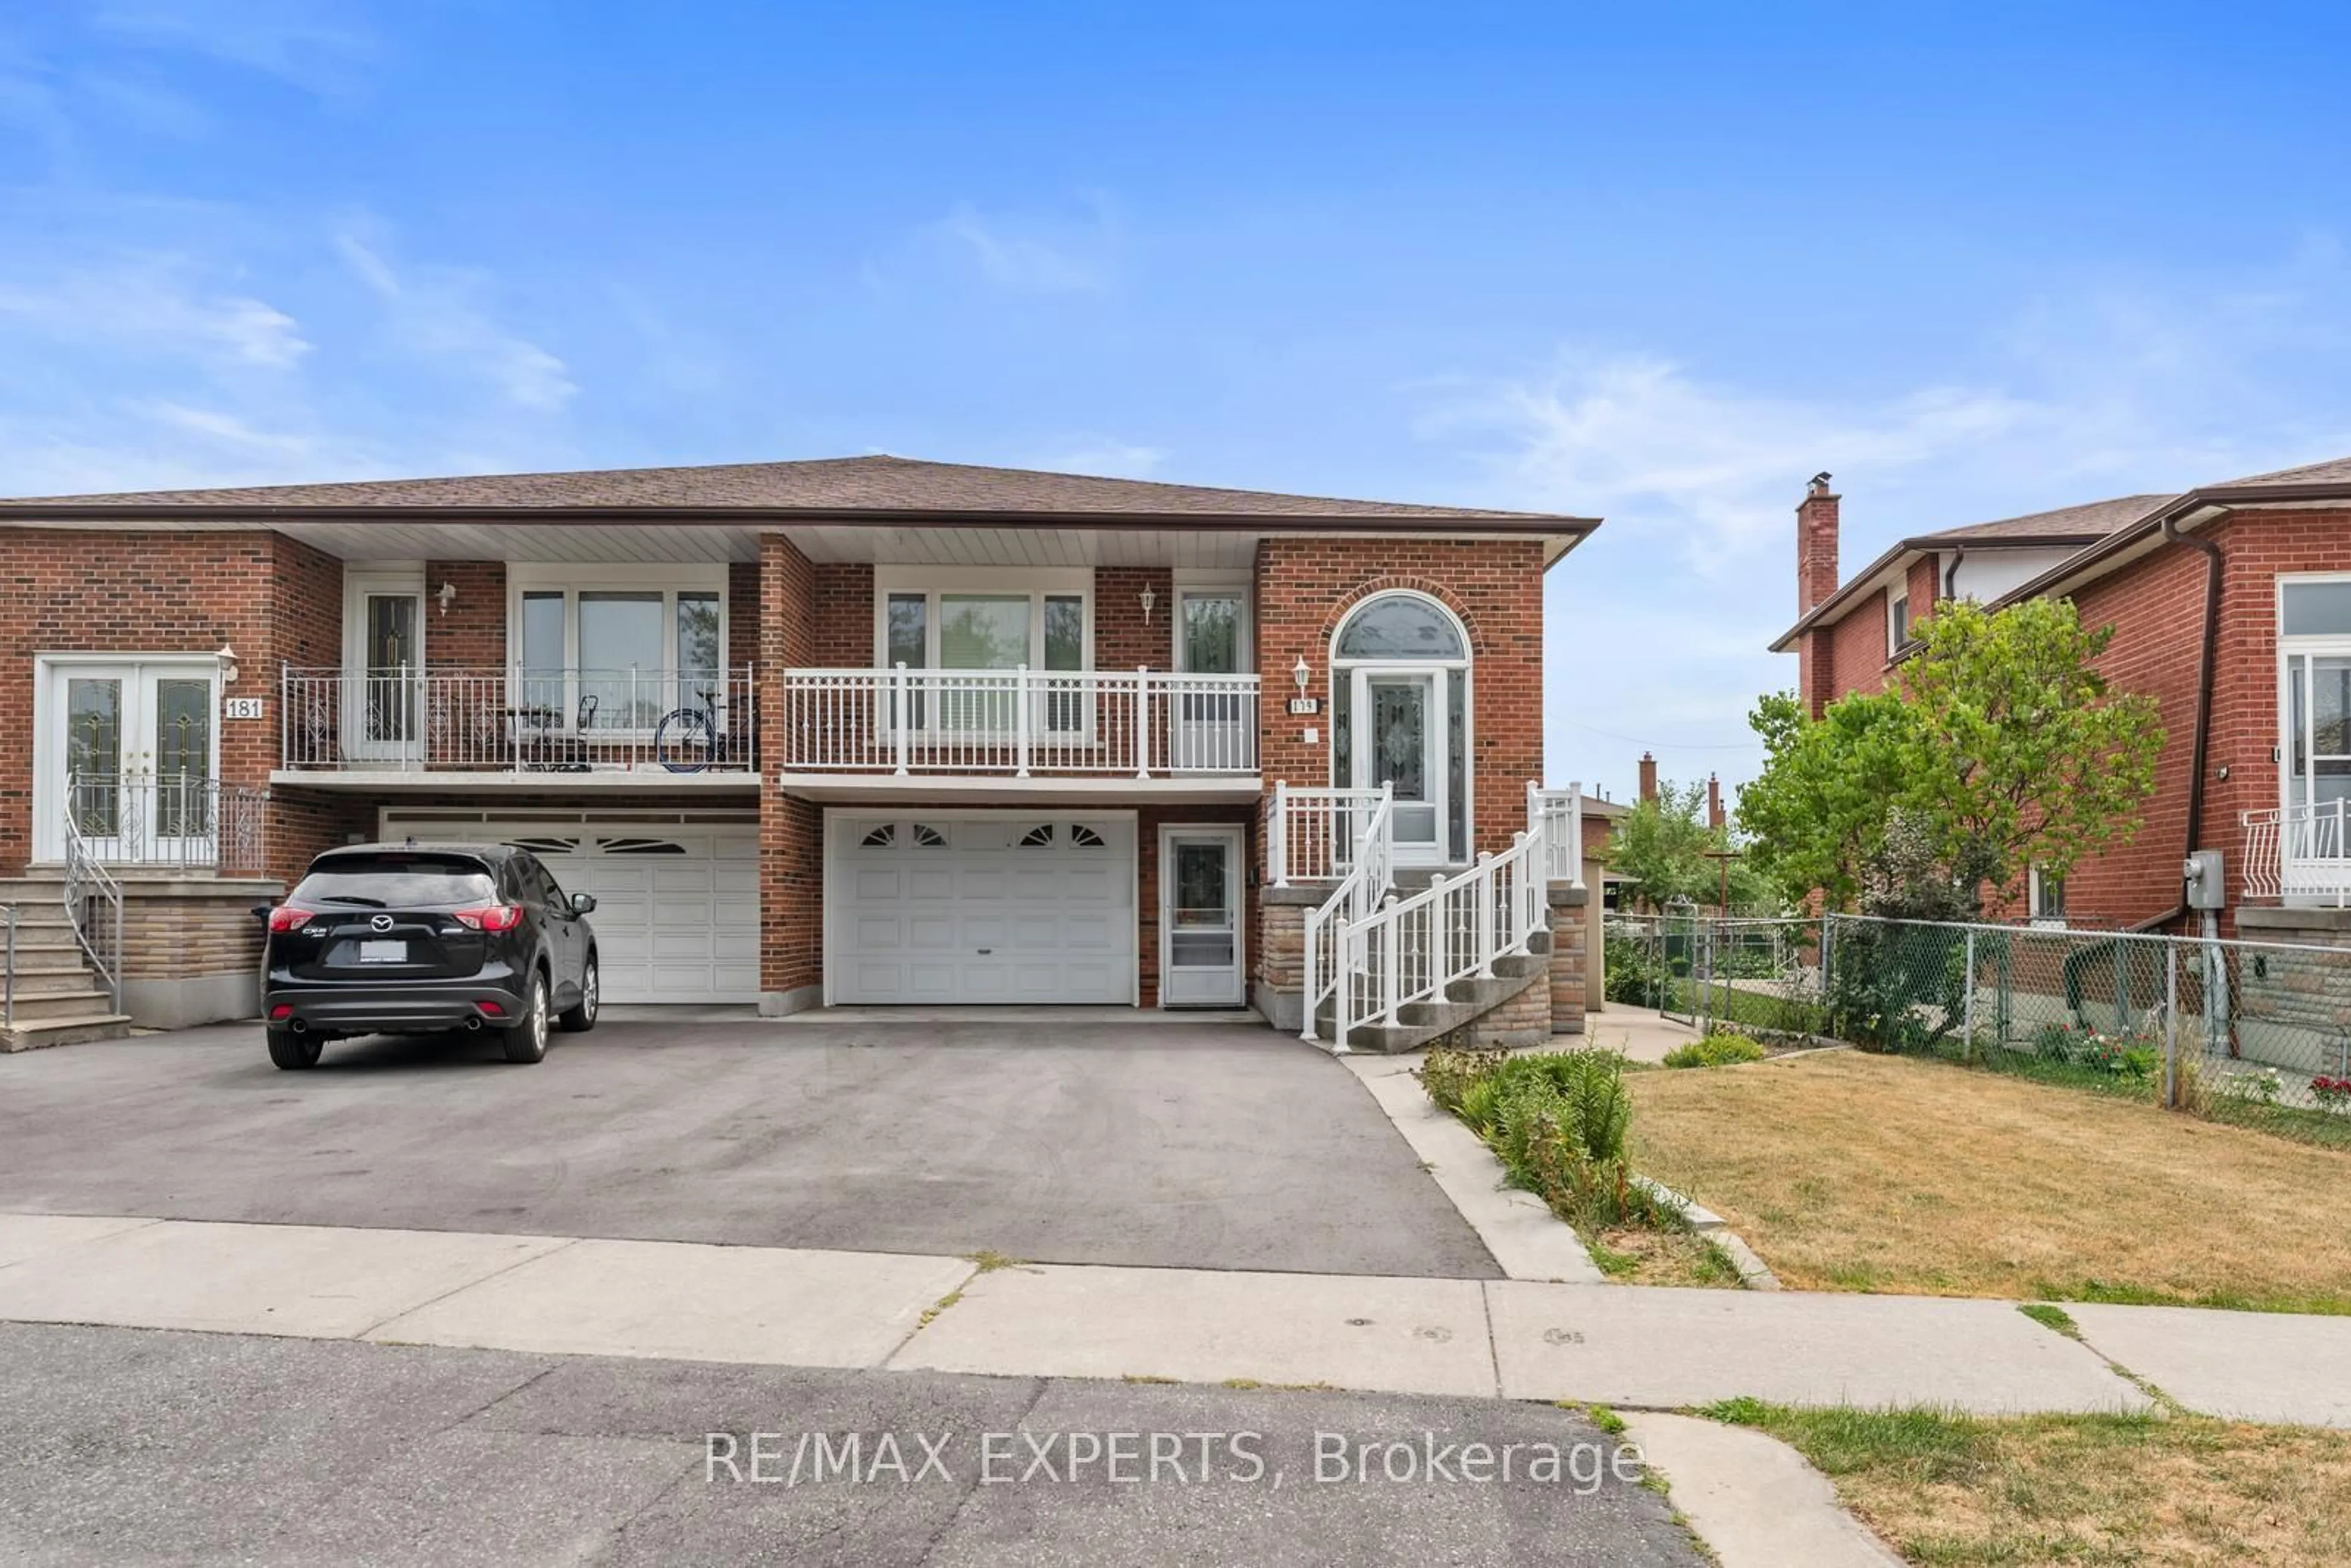
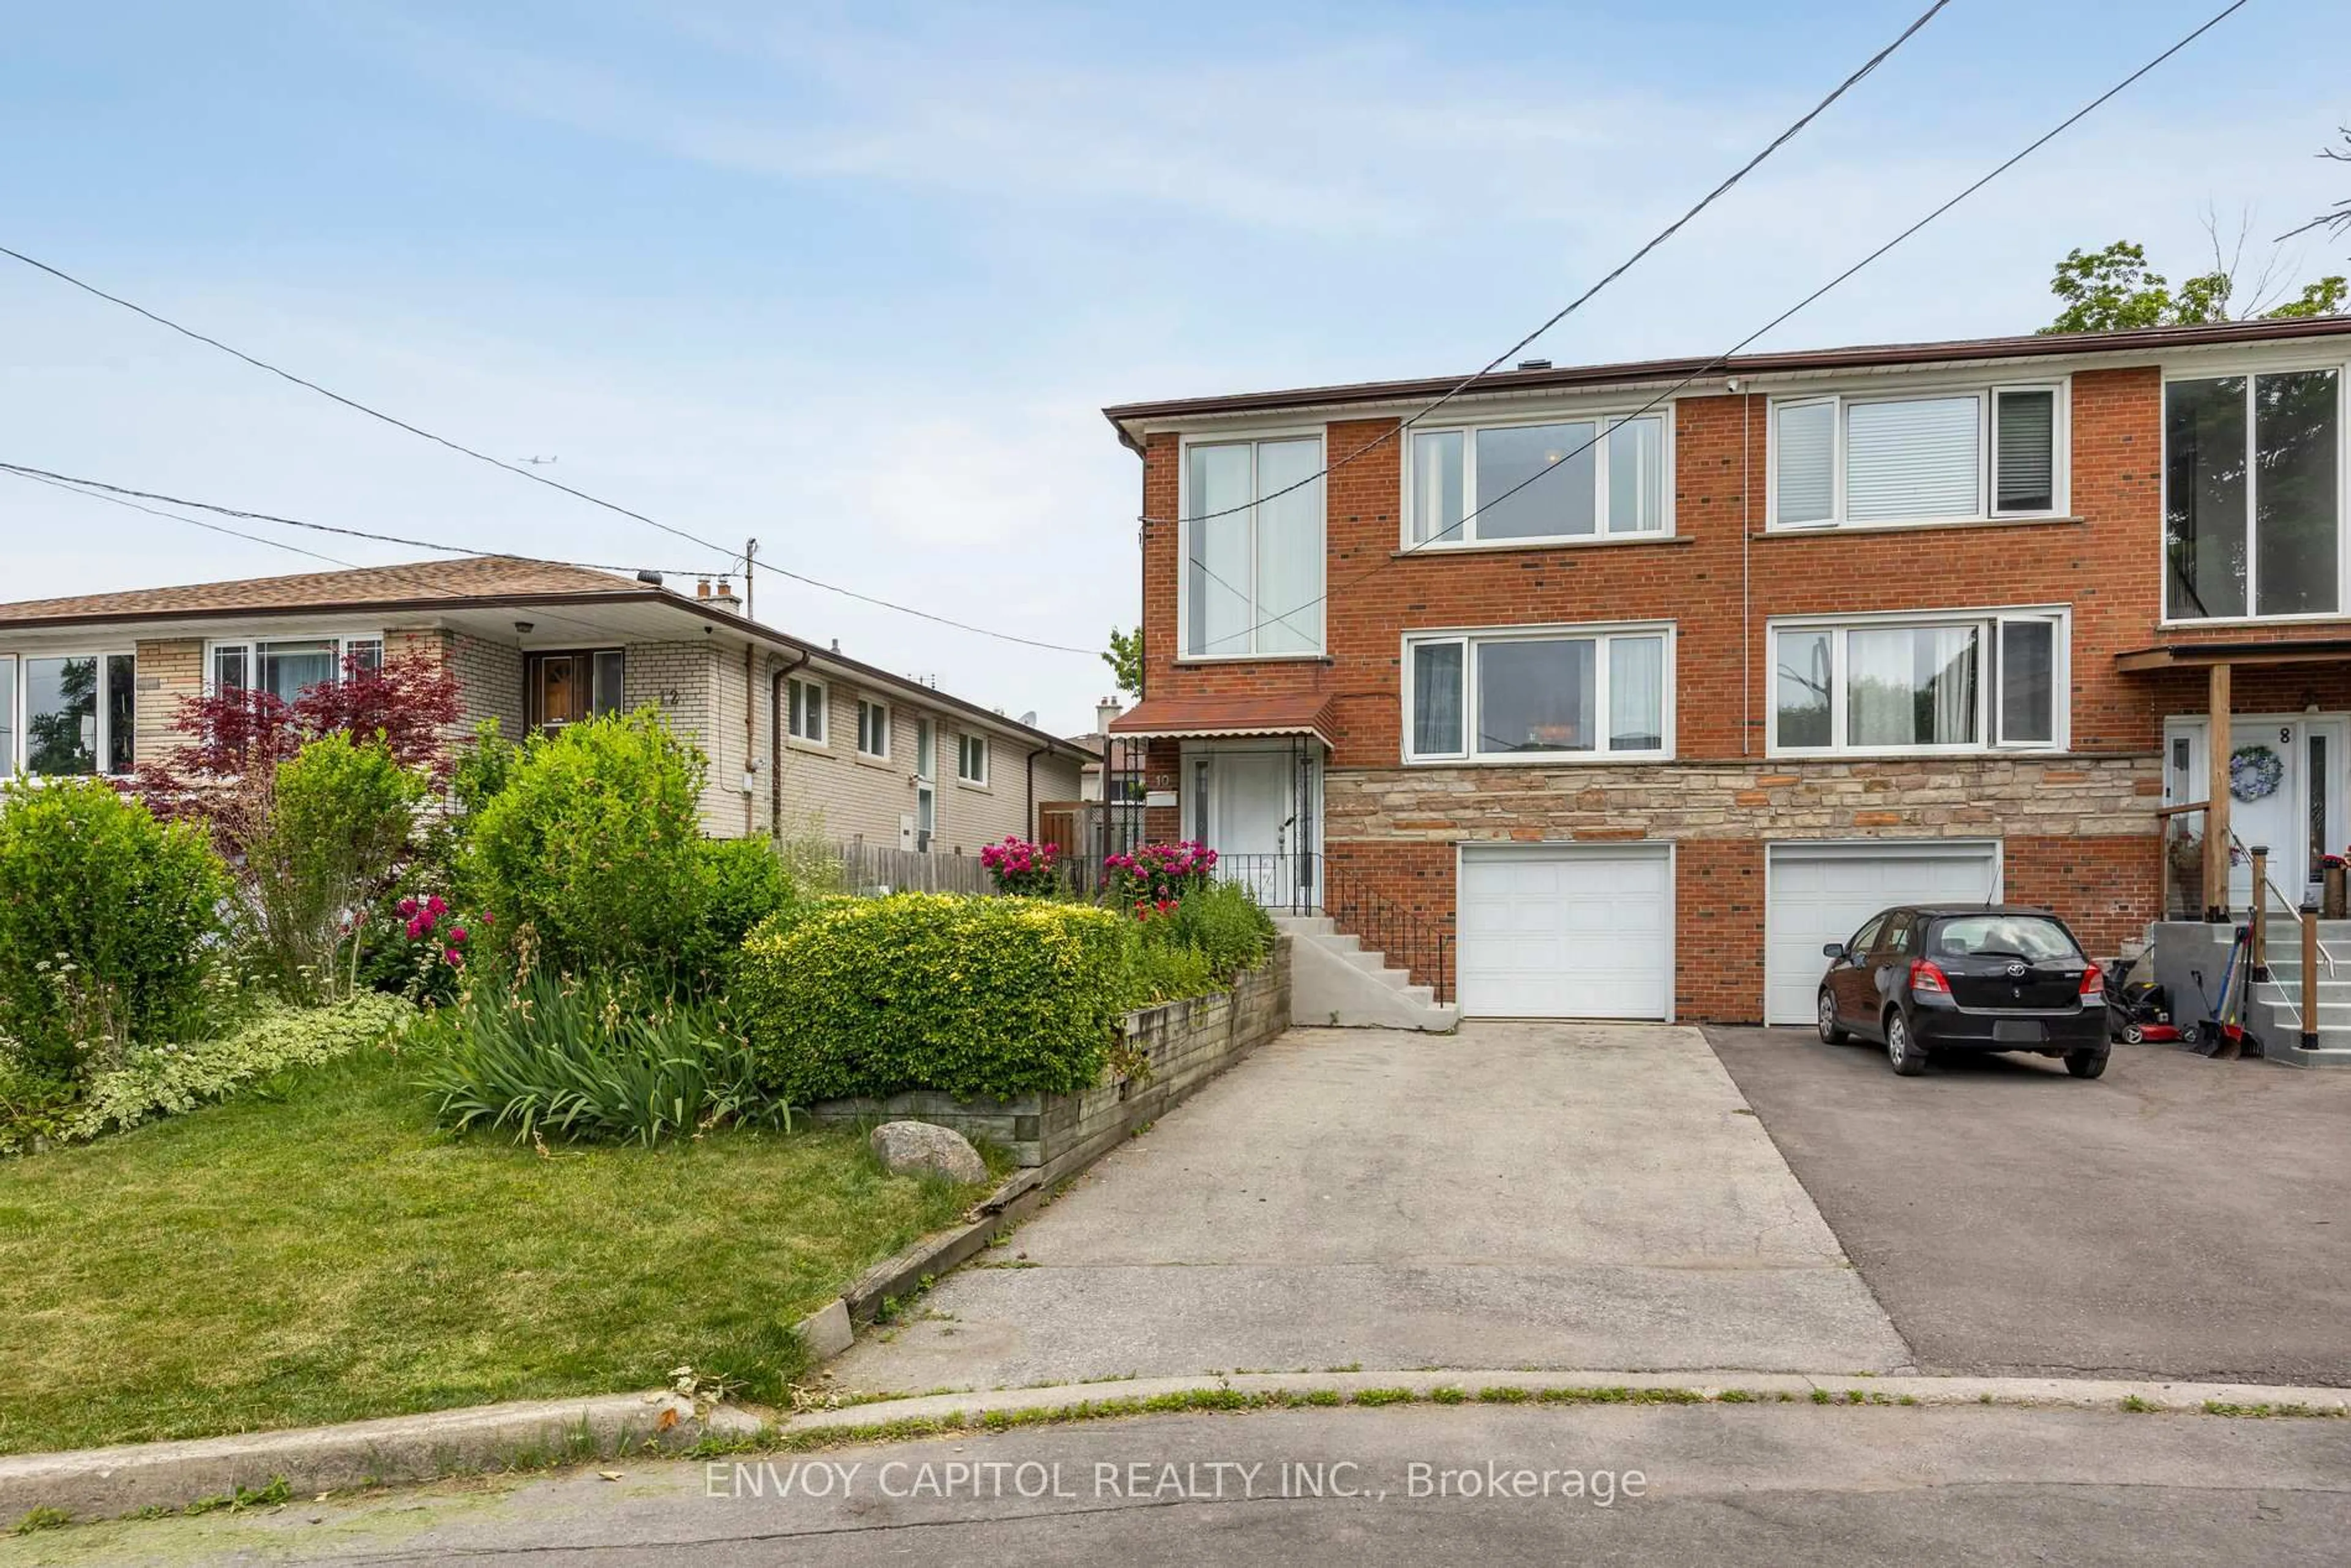
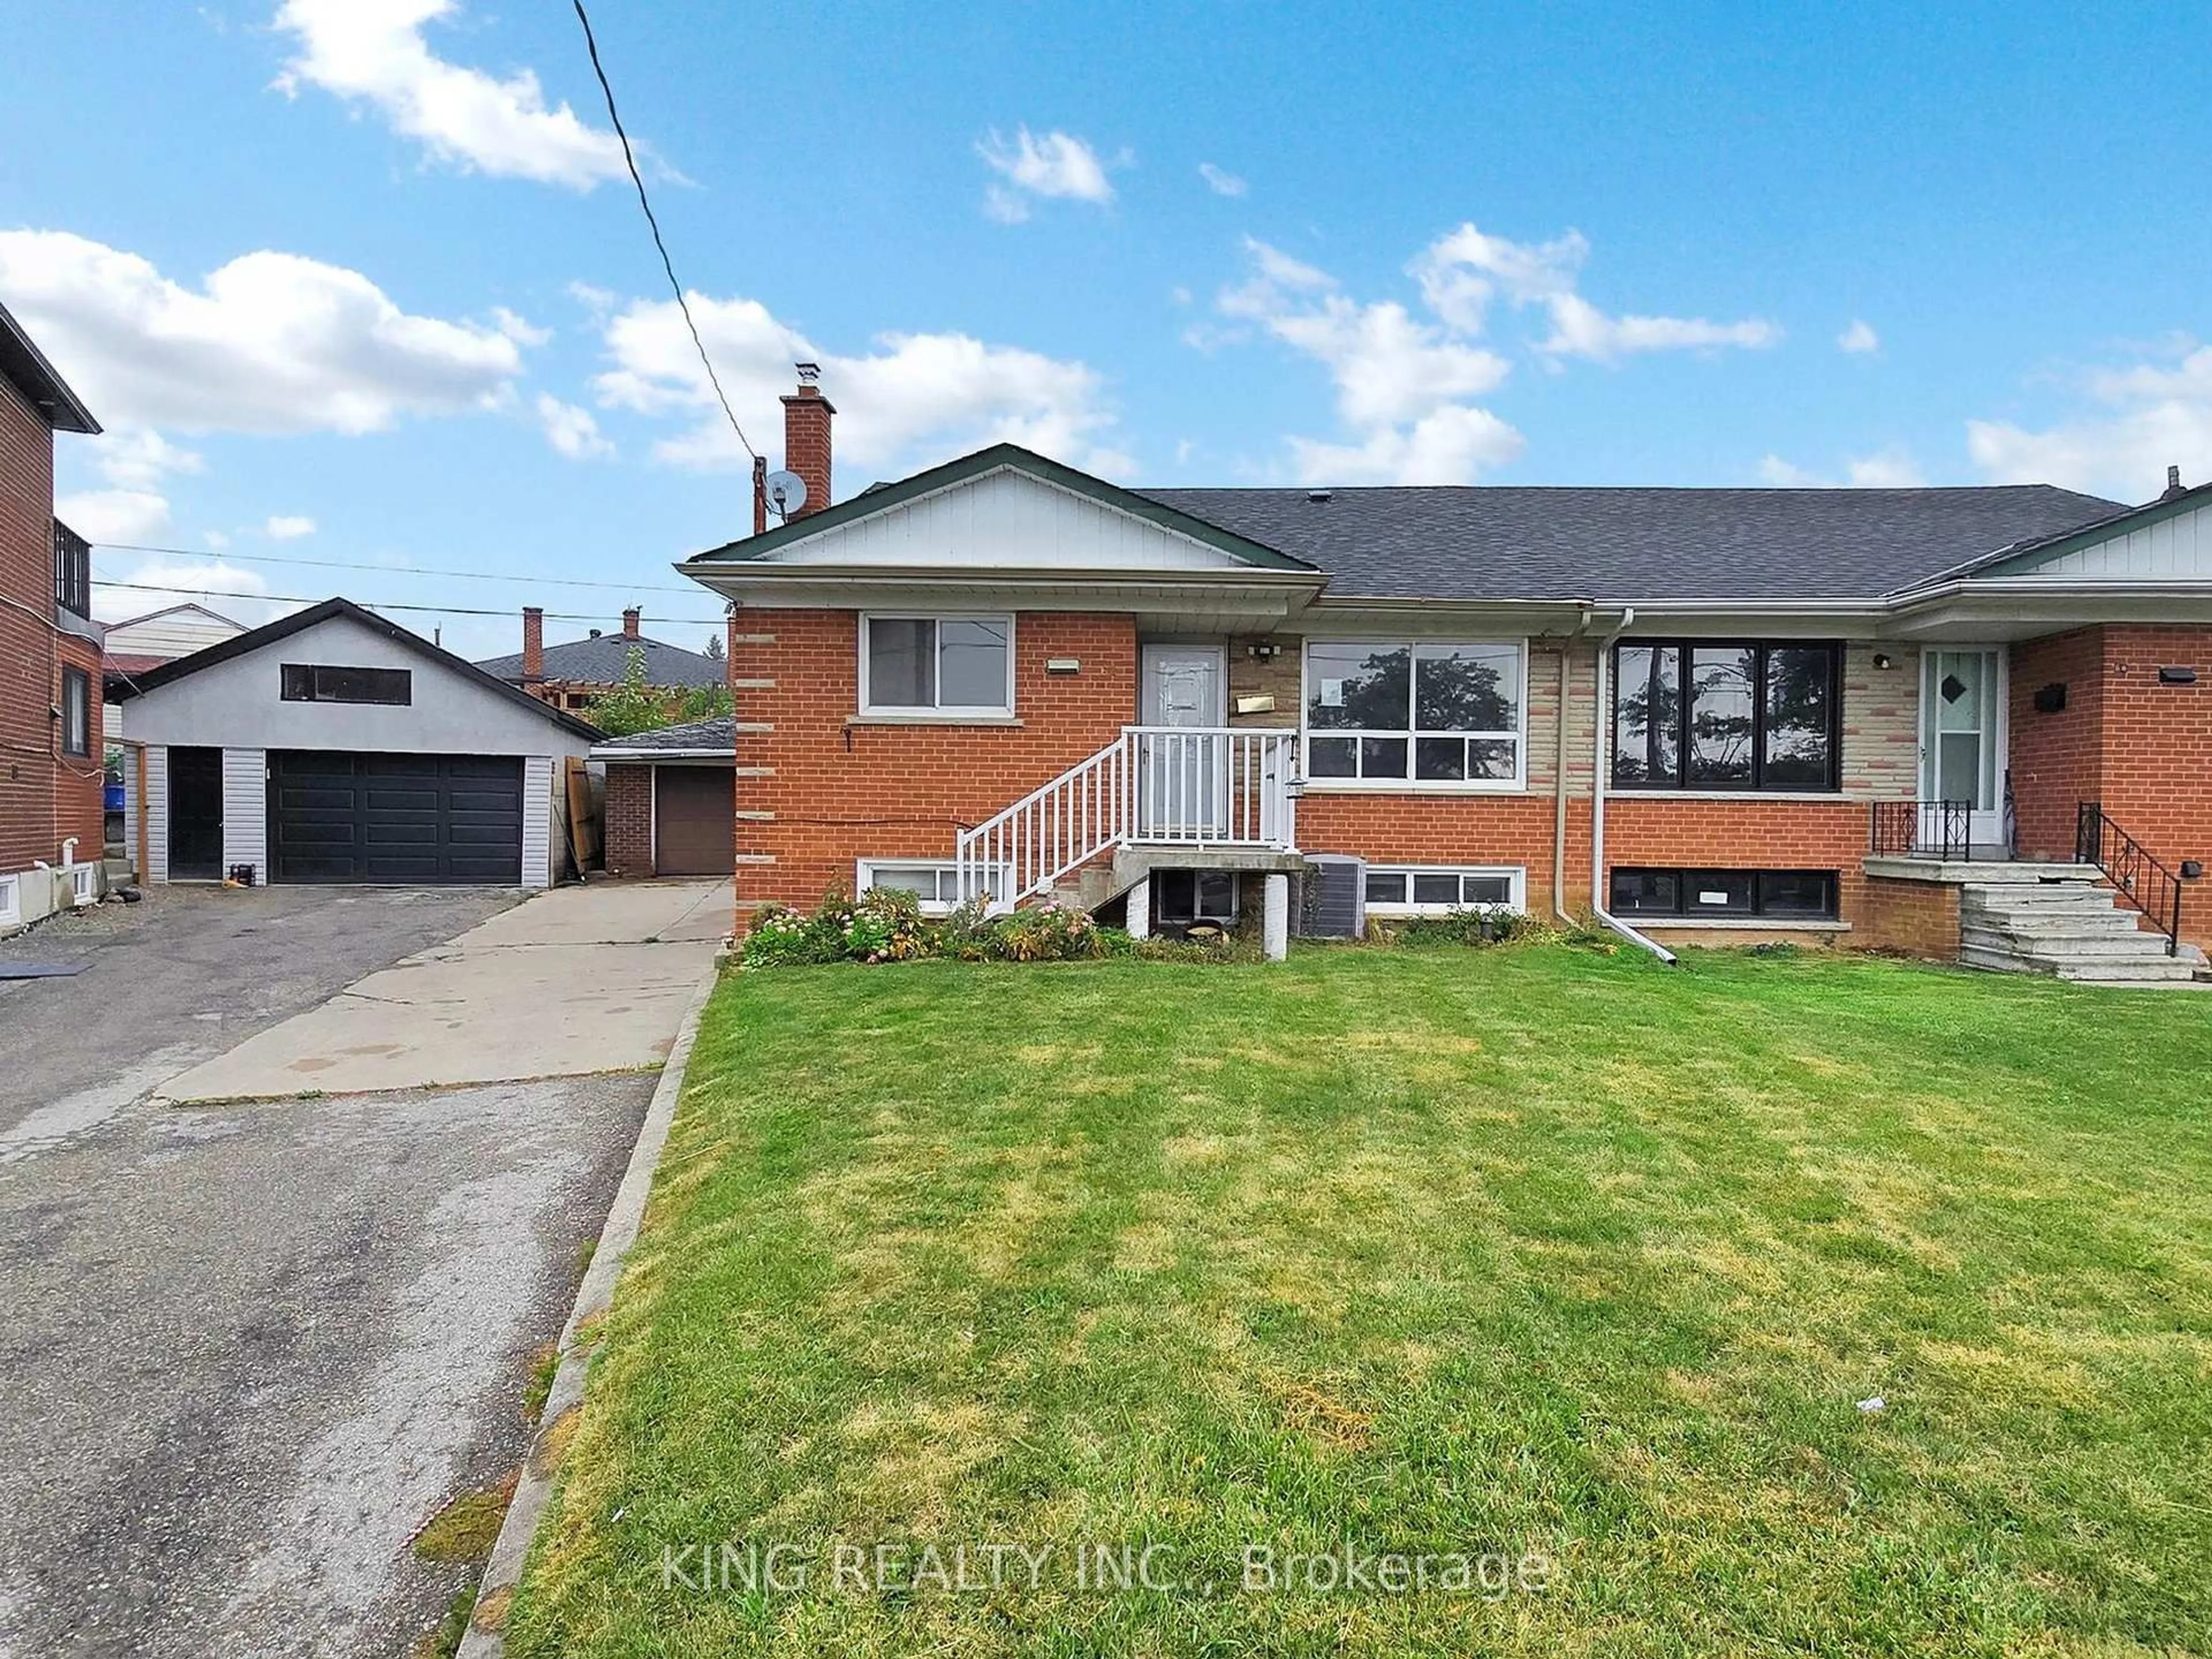
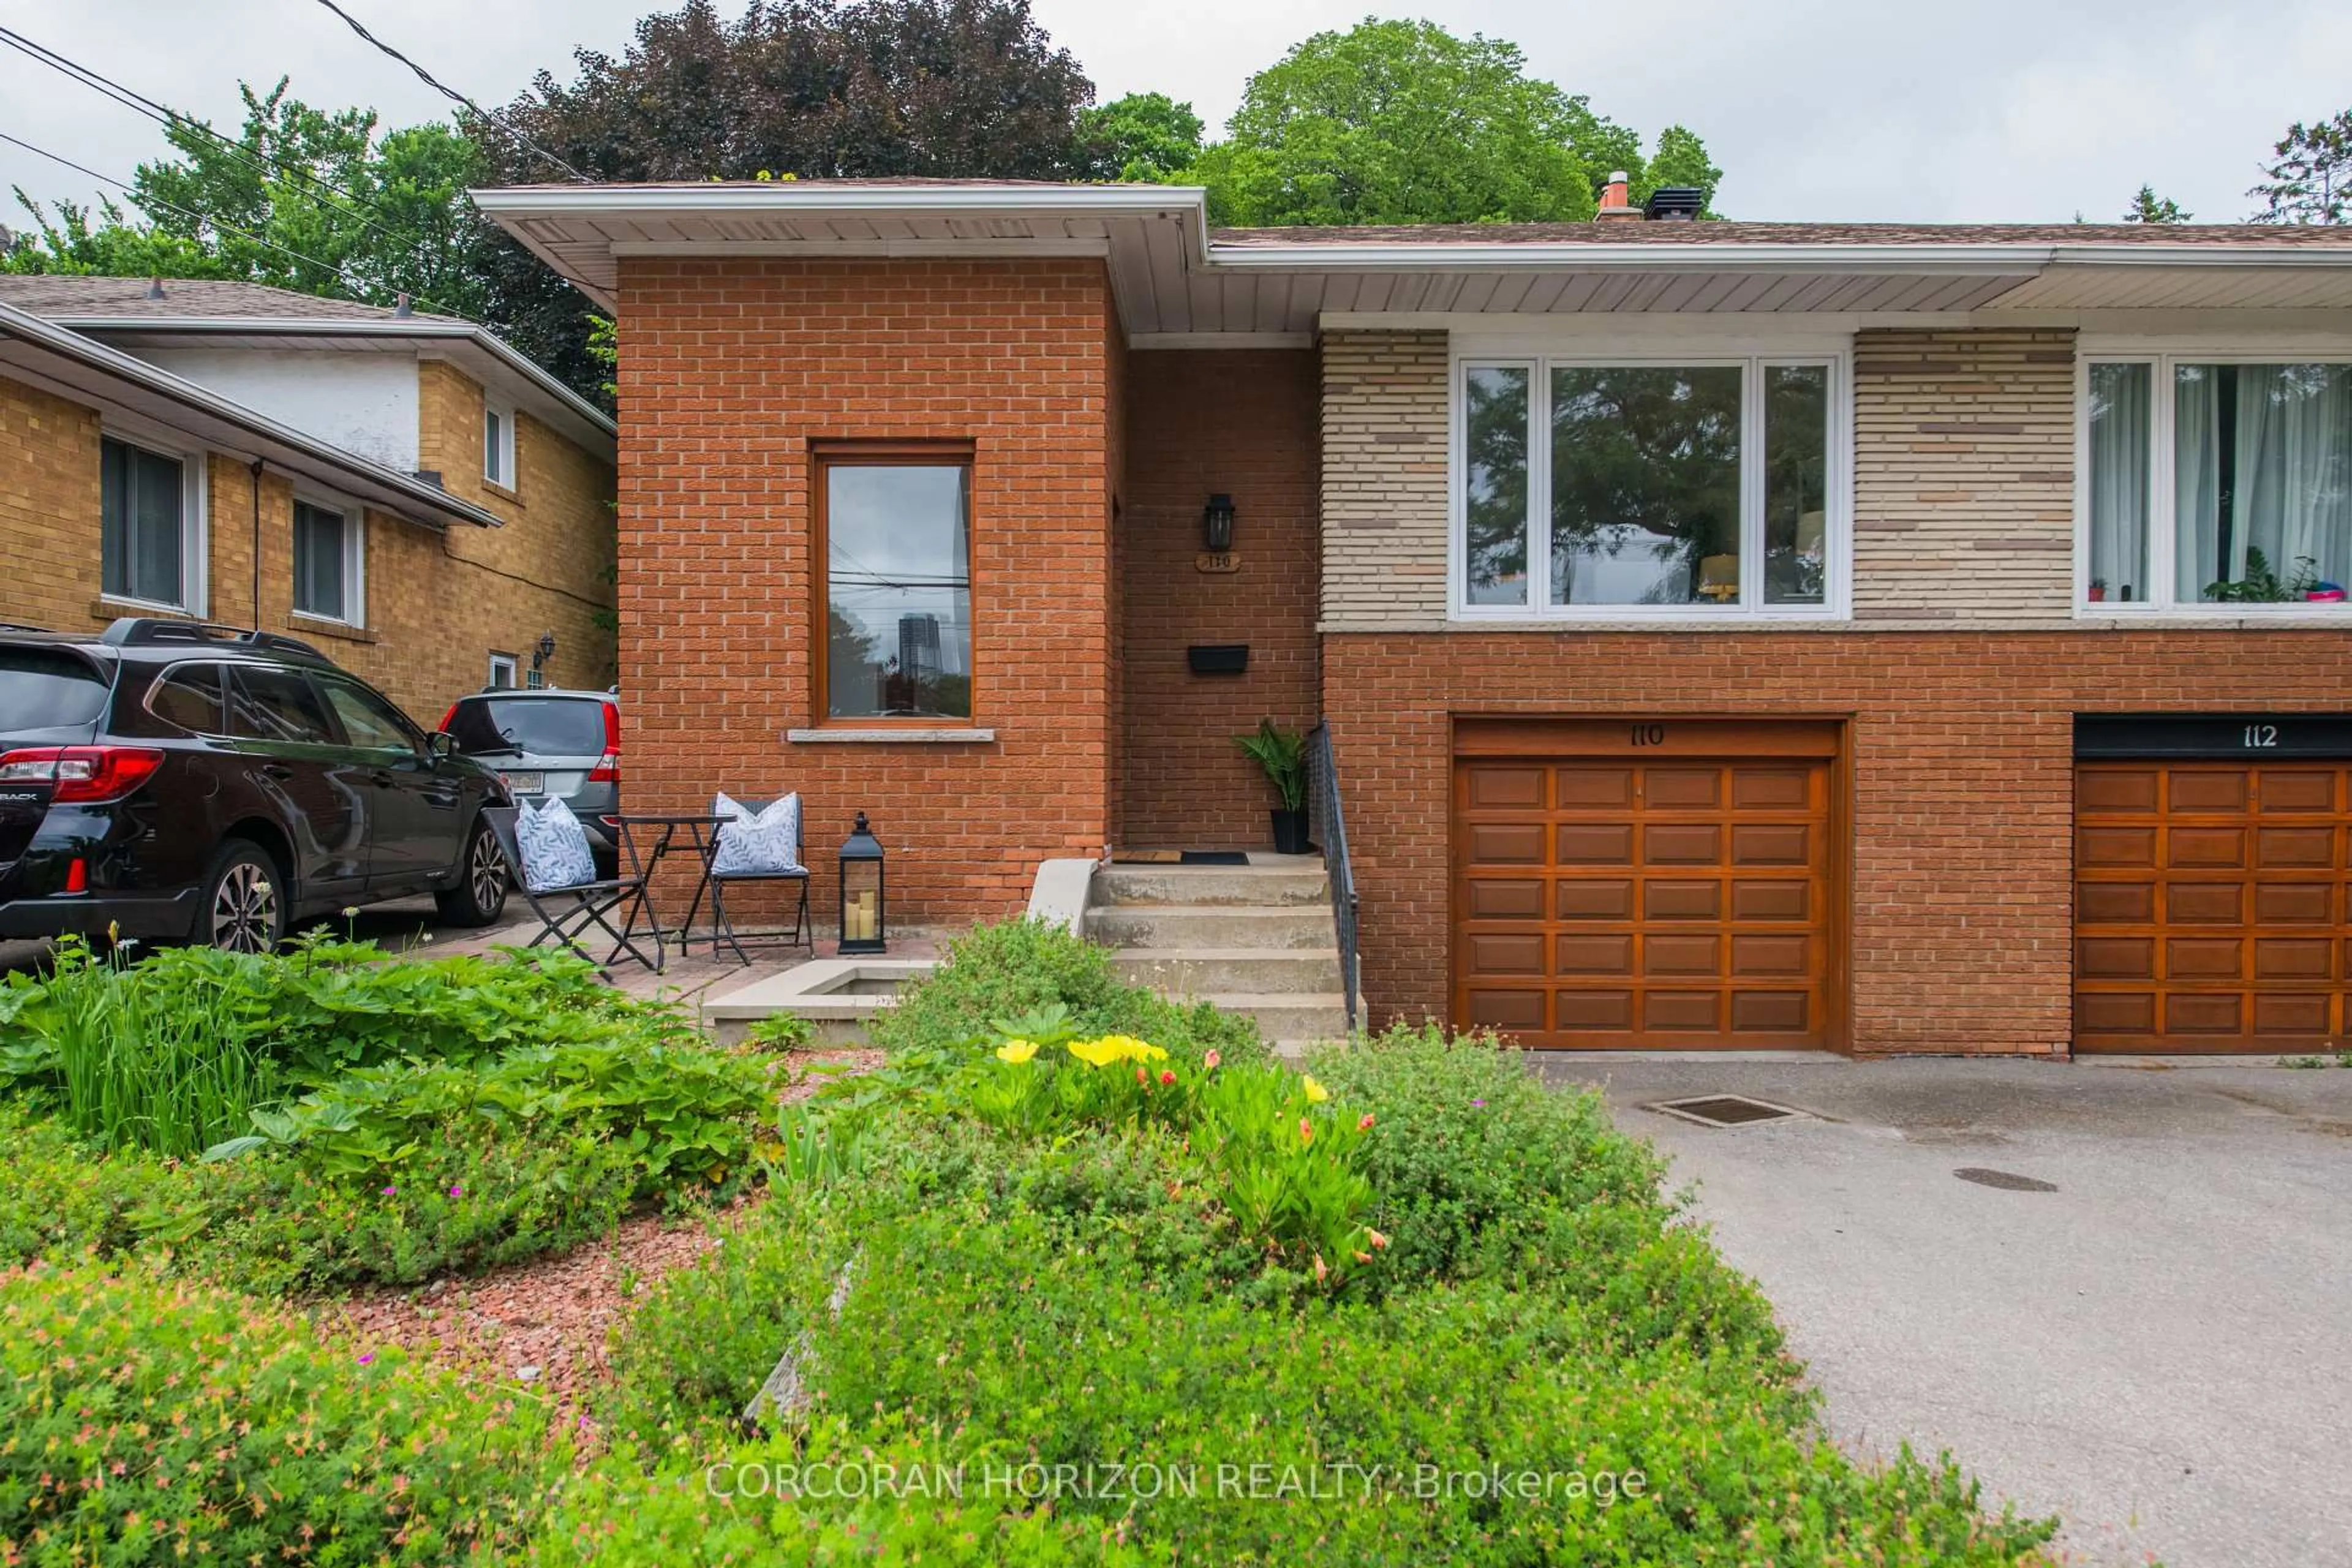
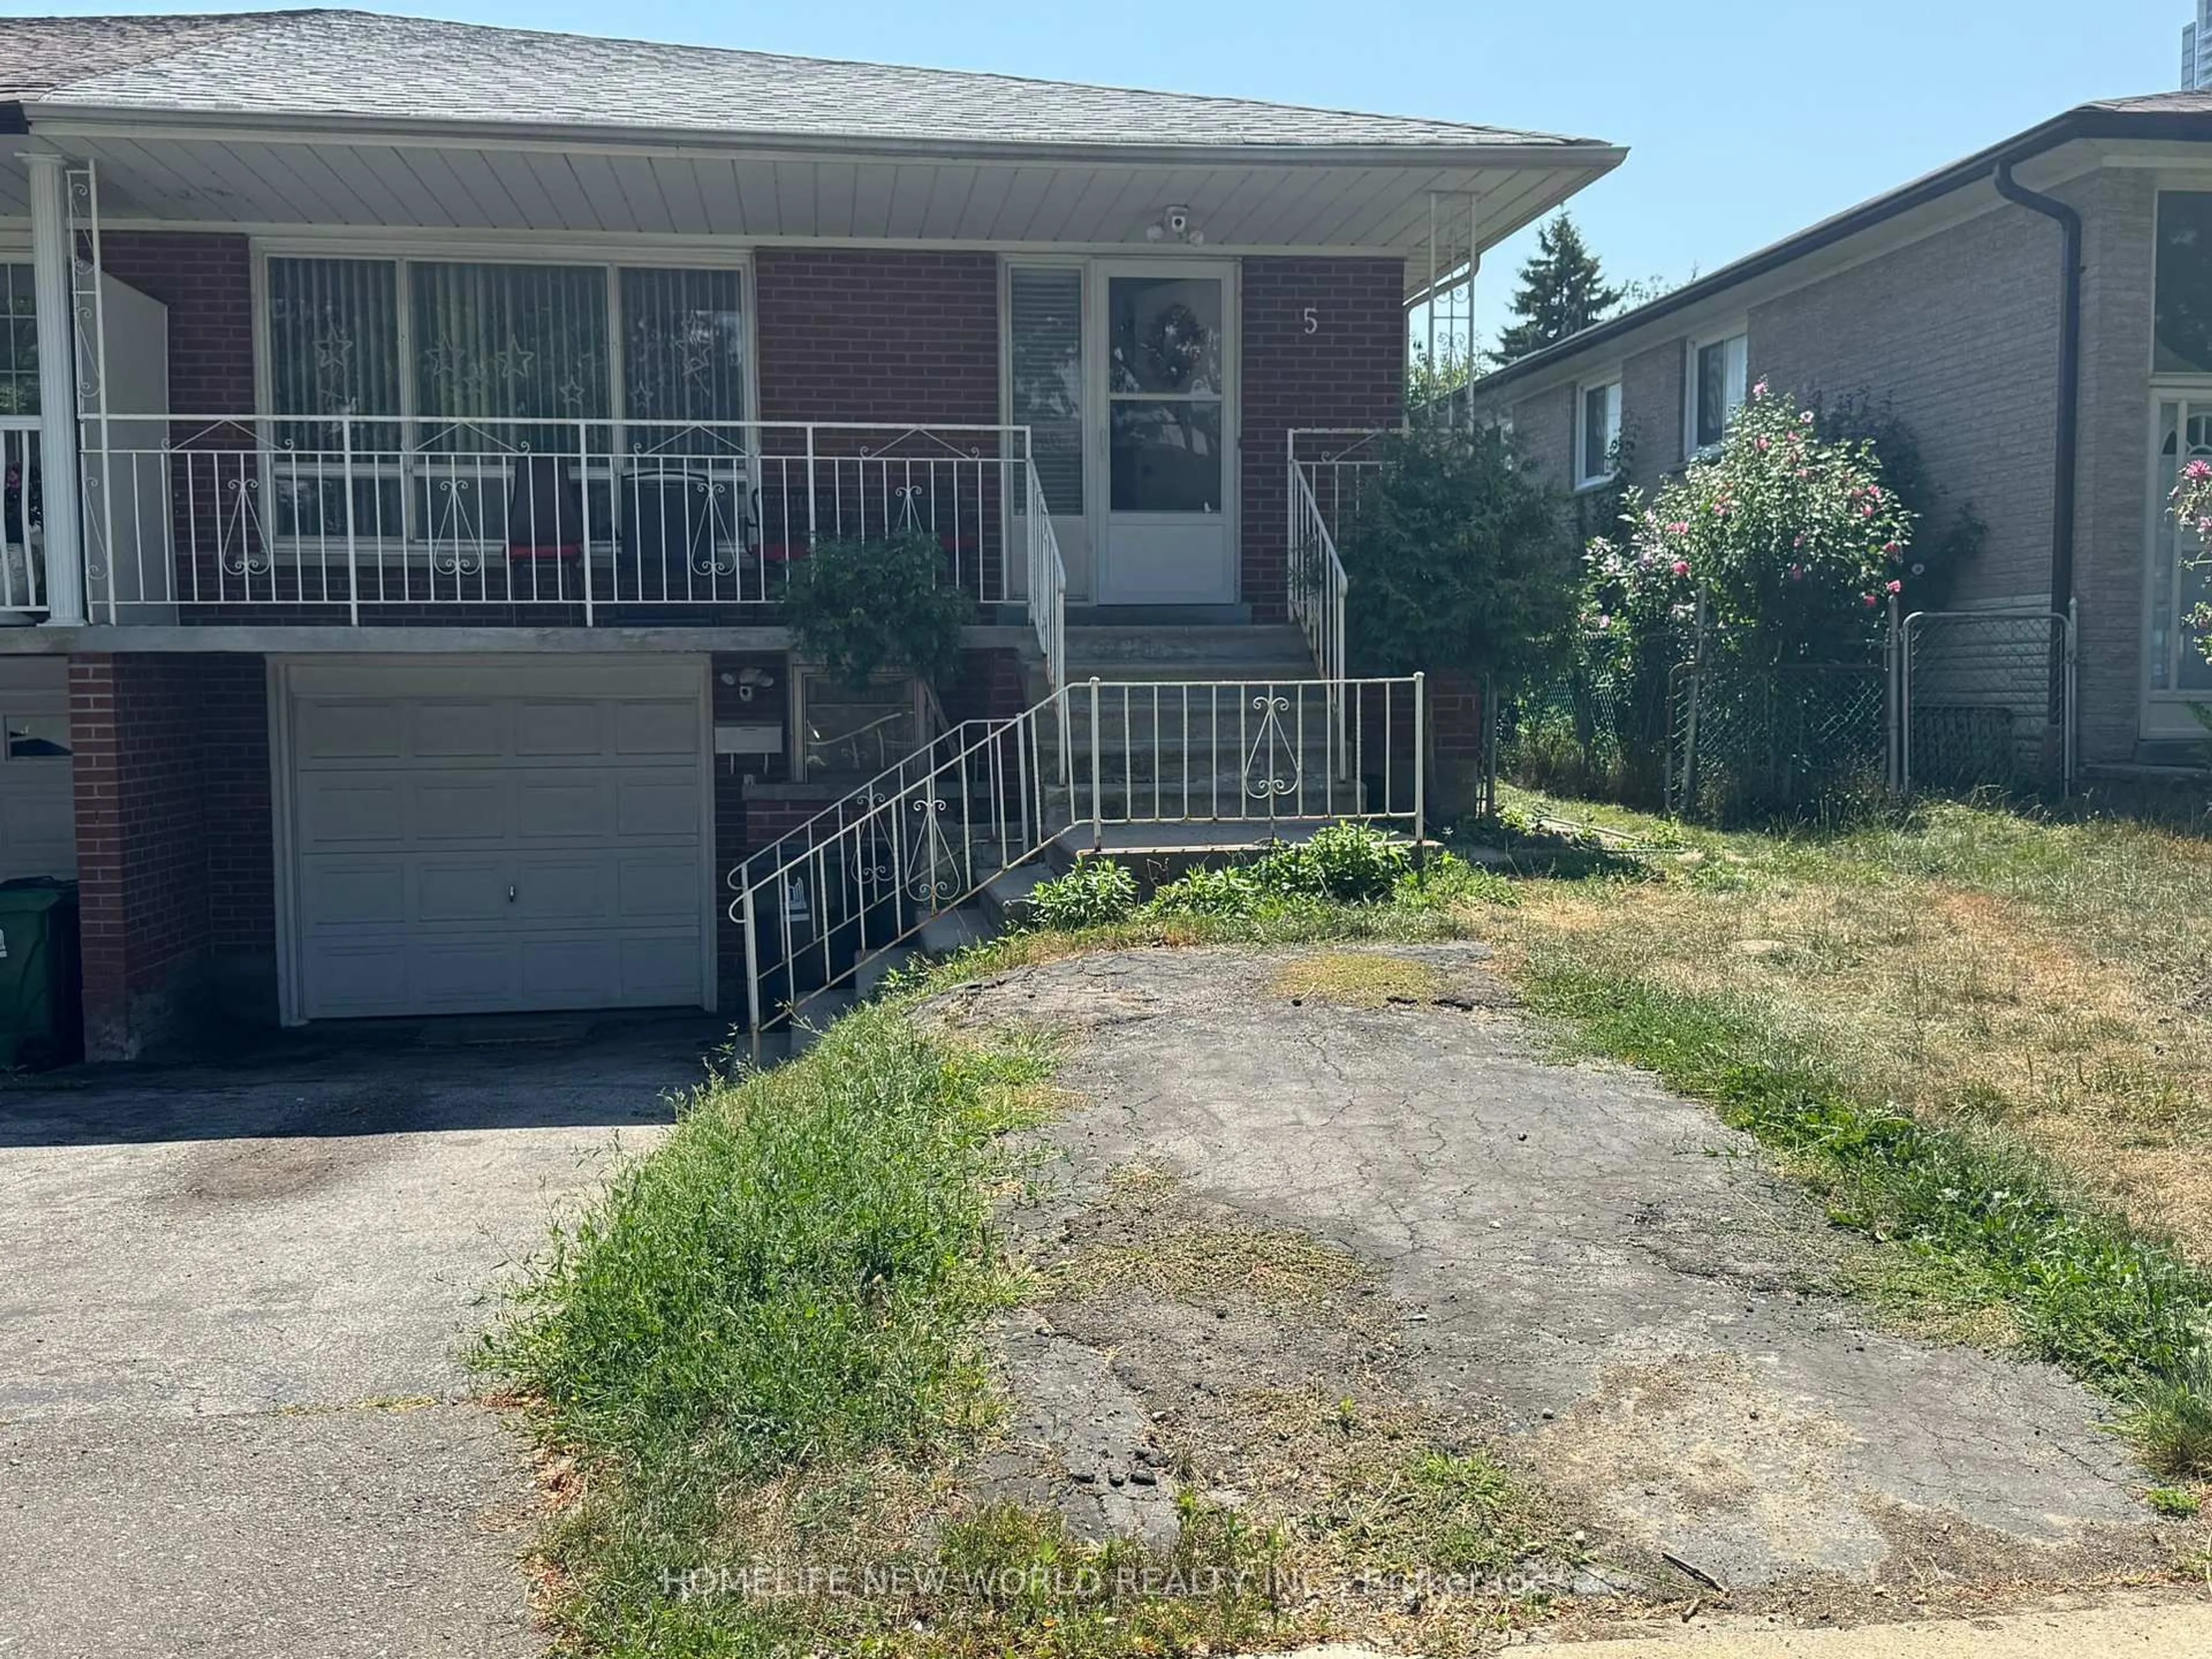
Blurry image for 52 Seacliff Blvd, Toronto Ontario M9L 2G4
14 hours on Market

52 Seacliff Blvd, Toronto, Ontario M9L 2G4

Semi-Detached
4
3
~1100-1500 sqft
$799,000
Get pre-qualifiedPowered by nesto
Buy with Wahi to get
Up to
$7,990Cashback
Semi-Detached
4
3
~1100-1500 sqft

Contact us about this property

Call

Highlights

Property Estimate

Days on market14 hours

Estimated valueNot available

Price/Sqft$629/sqft

Monthly cost

Open Calculator

CMA Subject Property

Curious about what homes are selling for in this area?

Get a report on comparable homes with helpful insights and trends.

+3

Properties sold*

$910K

Median sold price*

*Based on last 30 days

Description

Priced To Sell, Priced For Action Perfect Investment, Great For Handyman Spacious 4 Level Backsplit (1450 sqft mpac) 4 Bedrooms Plus Den (2 Up + 2 Down) Separate Side Entrance - Furnace Replaced - Hot Water Tank Owned - Windows + Patio Door Replaced 2011


Property Details

StyleBacksplit 4
View-
Age of property-
SqFt~1100-1500 SqFt
Lot Size3,600 SqFt(120 x 30)
Parking Spaces4
MLS ®NumberW12263897
Community NameHumber Summit
Data SourceTRREB
Listing byROYAL LEPAGE MAXIMUM REALTY

Features

Heating: Forced Air
Basement: Finished, Sep Entrance

Main Floor

Kitchen

4.4 x 2.6

Dining

3.0 x 3.0

Broadloom / hardwood floor

Living

4.5 x 3.6

Broadloom / hardwood floor


Features

Lot size: 3,600 SqFt

Parking

Garage spaces -

Garage type -

Total parking spaces 4


Property History

Jul 4, 2025
ListedActive
$799,000
14 hours on market
history photo preview32
Listing by trreb®

Market Data - Humber Summit

Geo Zone Map ThumbnailHumber Summit

Balanced Market

View Market Data

Semi-Detached house - for the past 30 days

Buyer's market Seller's market

Avg. Days on Market

Past 30 days

31 days

Compared to

2024

40 days

2023

22 days

2022

14 days

New Listings

Past 30 days

10 listings

Compared to

2024

13 listings

2023

3 listings

2022

9 listings

Units sold

Past 30 days

5 units

Compared to

2024

3 units

2023

4 units

2022

4 units

Median Sold Price

Past 30 days

$850,000

Compared to

2024

$910,000

2023

$991,500

2022

$997,500


Population and Demographics

Overview

Total population 11176
Average household income $97,300

Age (%)

0 to 19
23%
20 to 34
22%
35 to 49
18%
50 to 64
19%
65 and plus
17%

Household composition (%)

Single family
70%
Single person
20%
Multi person
7%
Multi family
3%

Mother tongue (%)

English
45%
Italian
12%
Urdu
8%
Punjabi (Panjabi)
7%
Spanish
6%
Assyrian Neo-Aramaic
3%
Vietnamese
3%
Others
3%
Arabic
2%
Gujarati
2%
Chaldean Neo-Aramaic
1%
Tagalog (Pilipino, Filipino)
1%

House tenancy (%)

Owners
64%
Renters
36%

What’s nearby?Essentials within 5 km

Local Logic

Transportation Scores

Estimated Budget