Sold for $···,···
•
•
•
•
Contact us about this property
Highlights
Sold since
Login to viewEstimated valueThis is the price Wahi expects this property to sell for.
The calculation is powered by our Instant Home Value Estimate, which uses current market and property price trends to estimate your home’s value with a 90% accuracy rate.Login to view
Price/SqftLogin to view
Monthly cost
Open Calculator
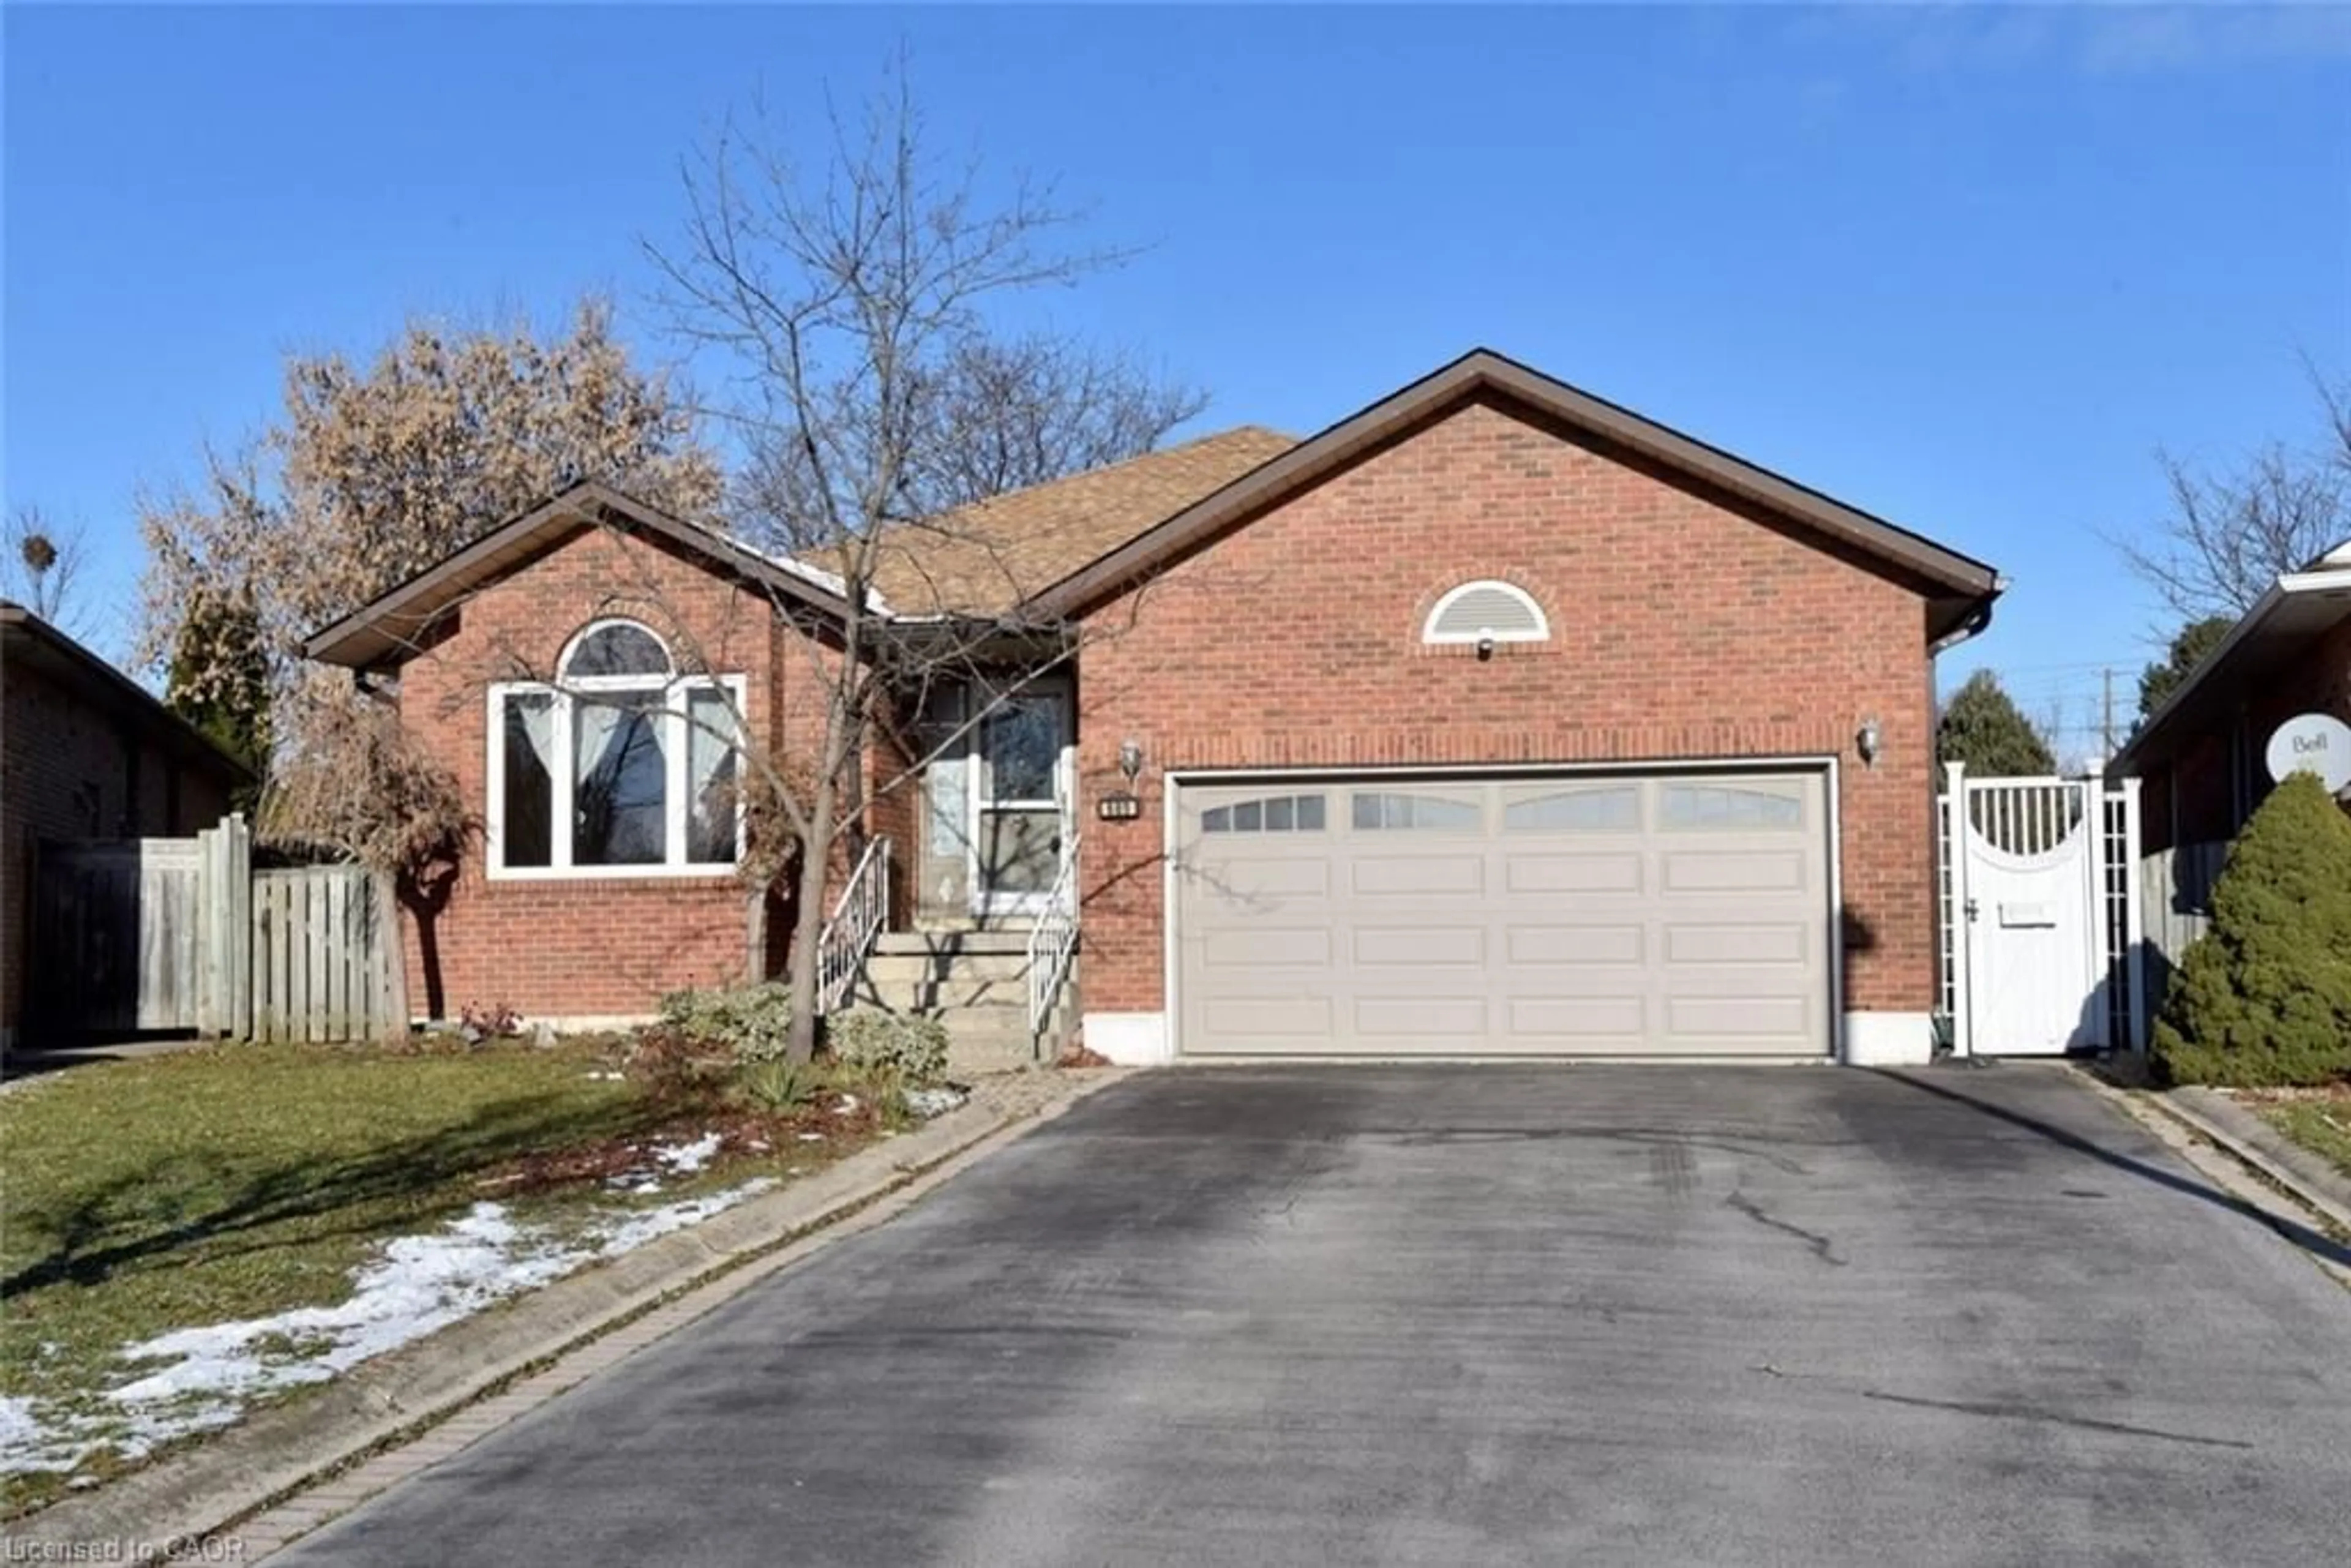
Description
Signup or login to view
Property Details
Signup or login to view
Interior
Signup or login to view
Features
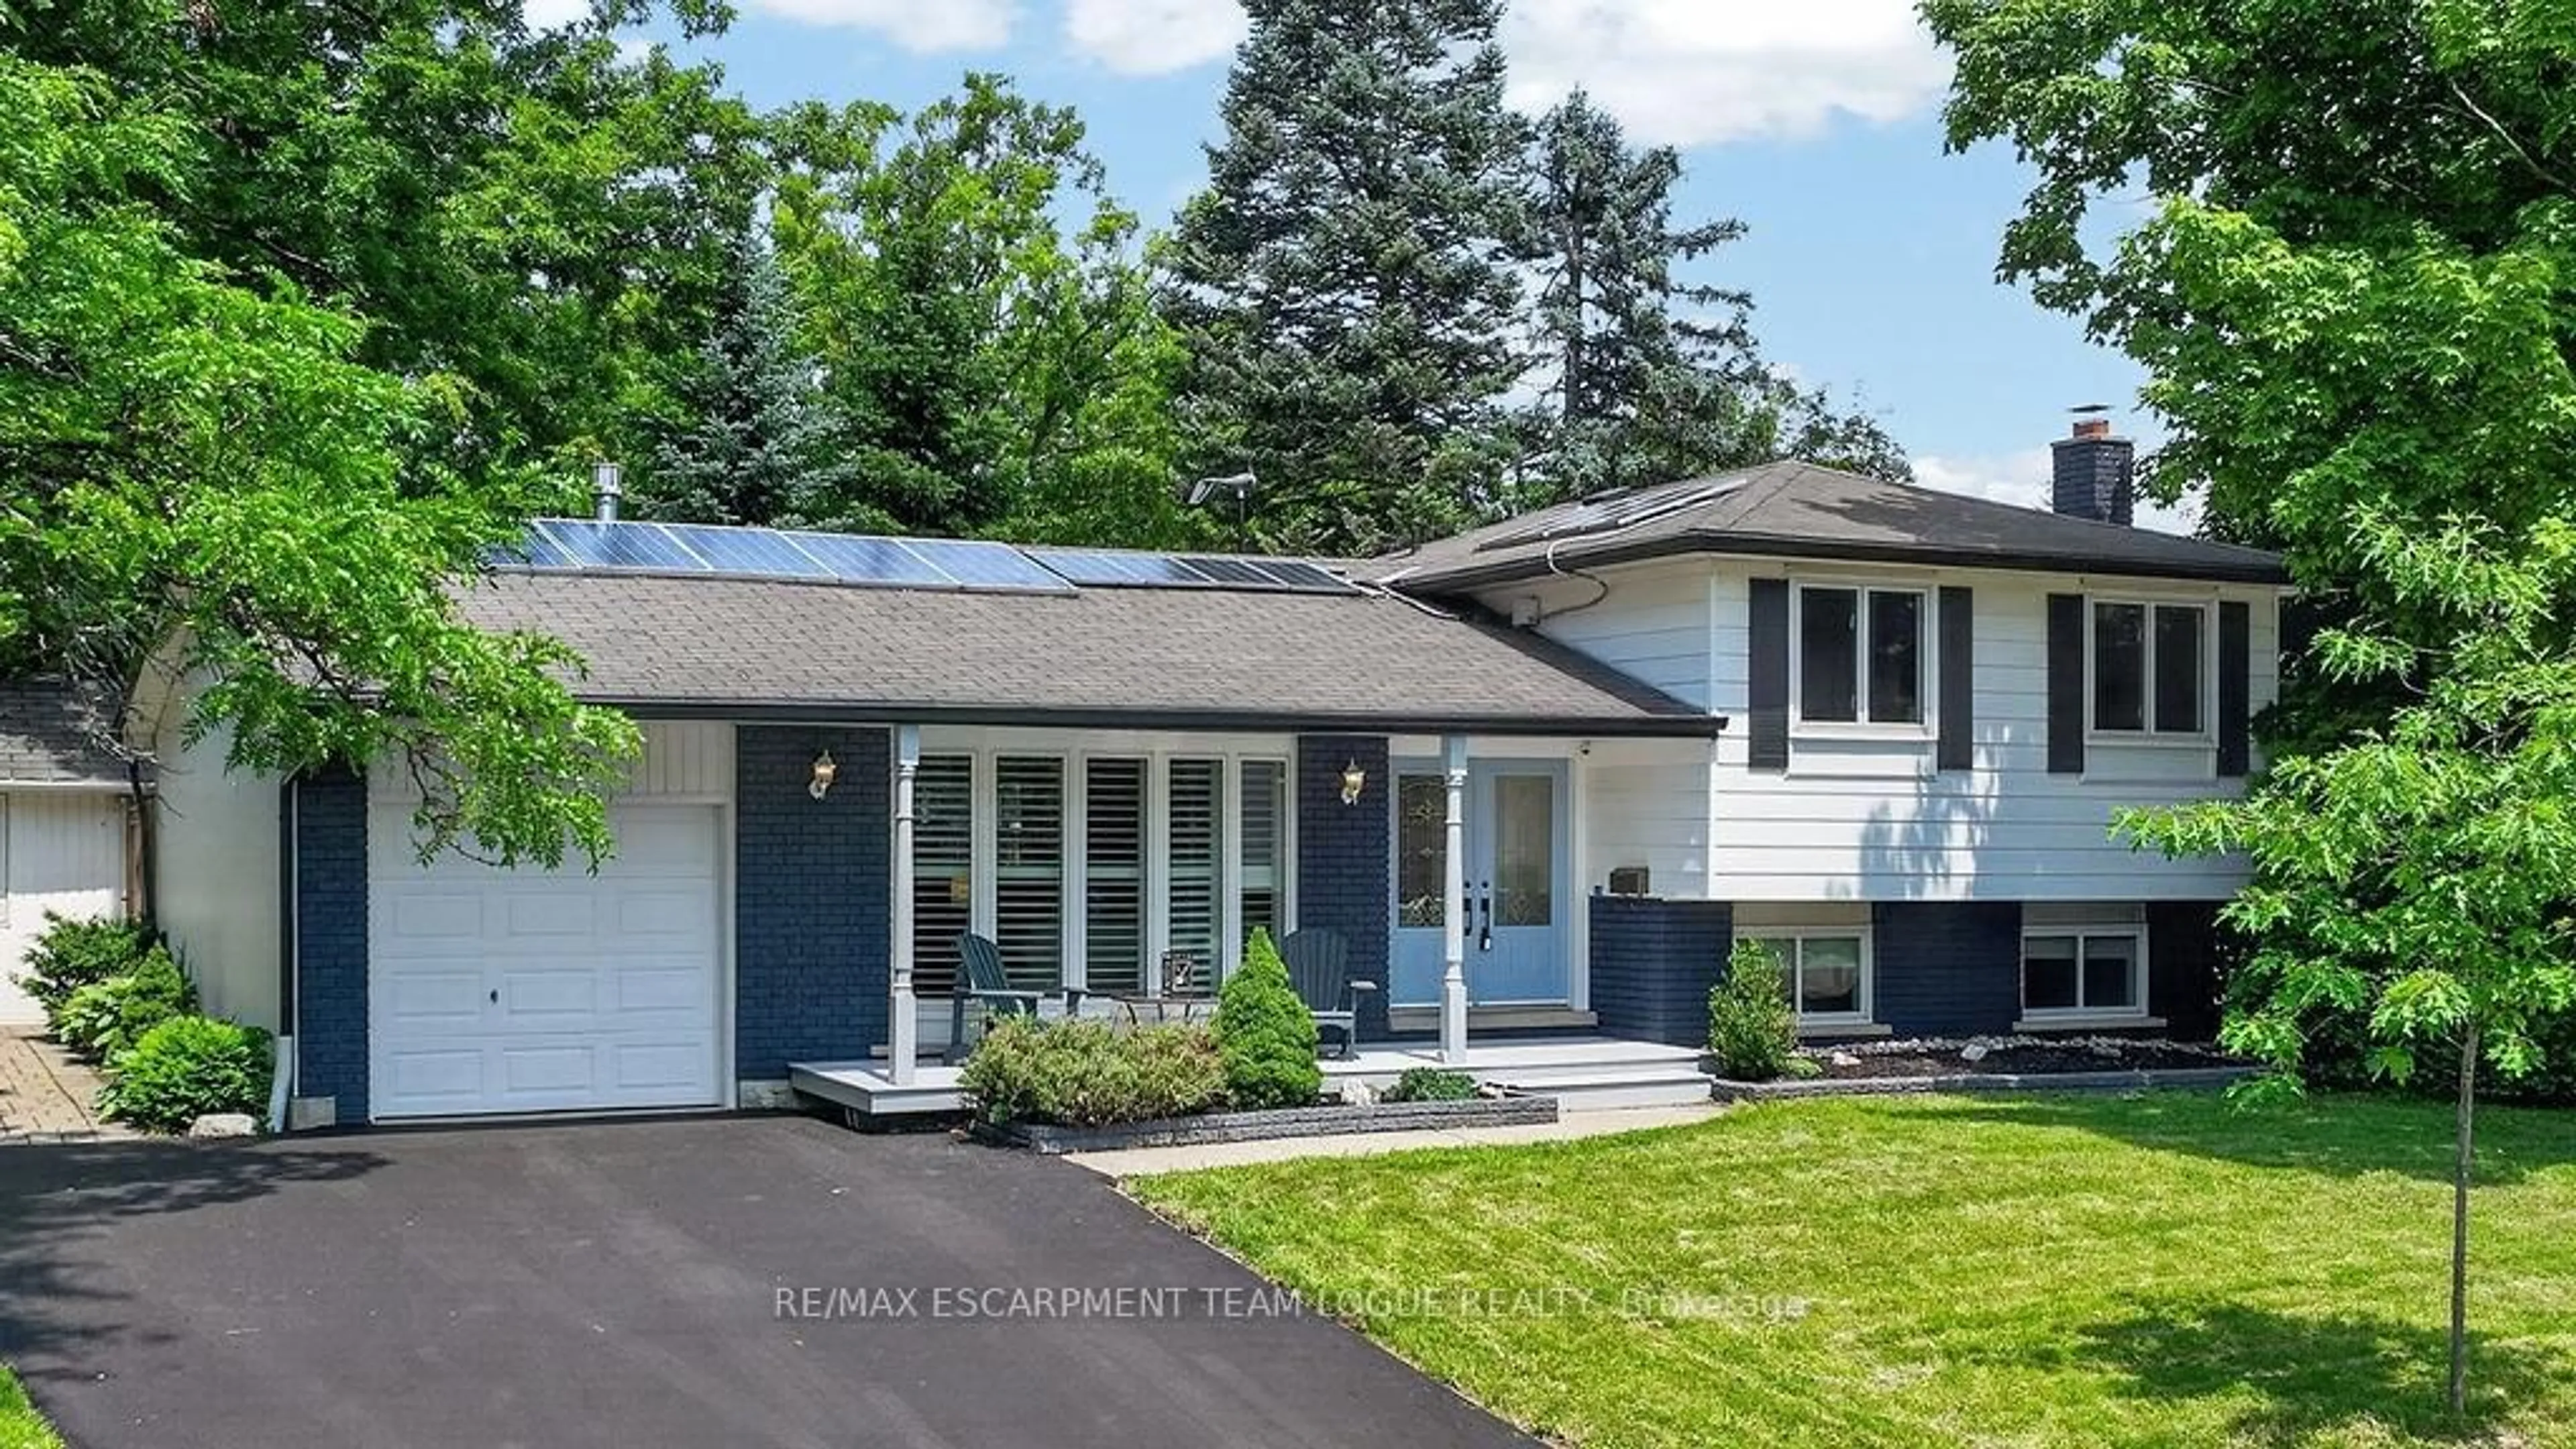
Heating: Forced Air
Fireplace
Basement: Sep Entrance, Full
Exterior
Signup or login to view
Features
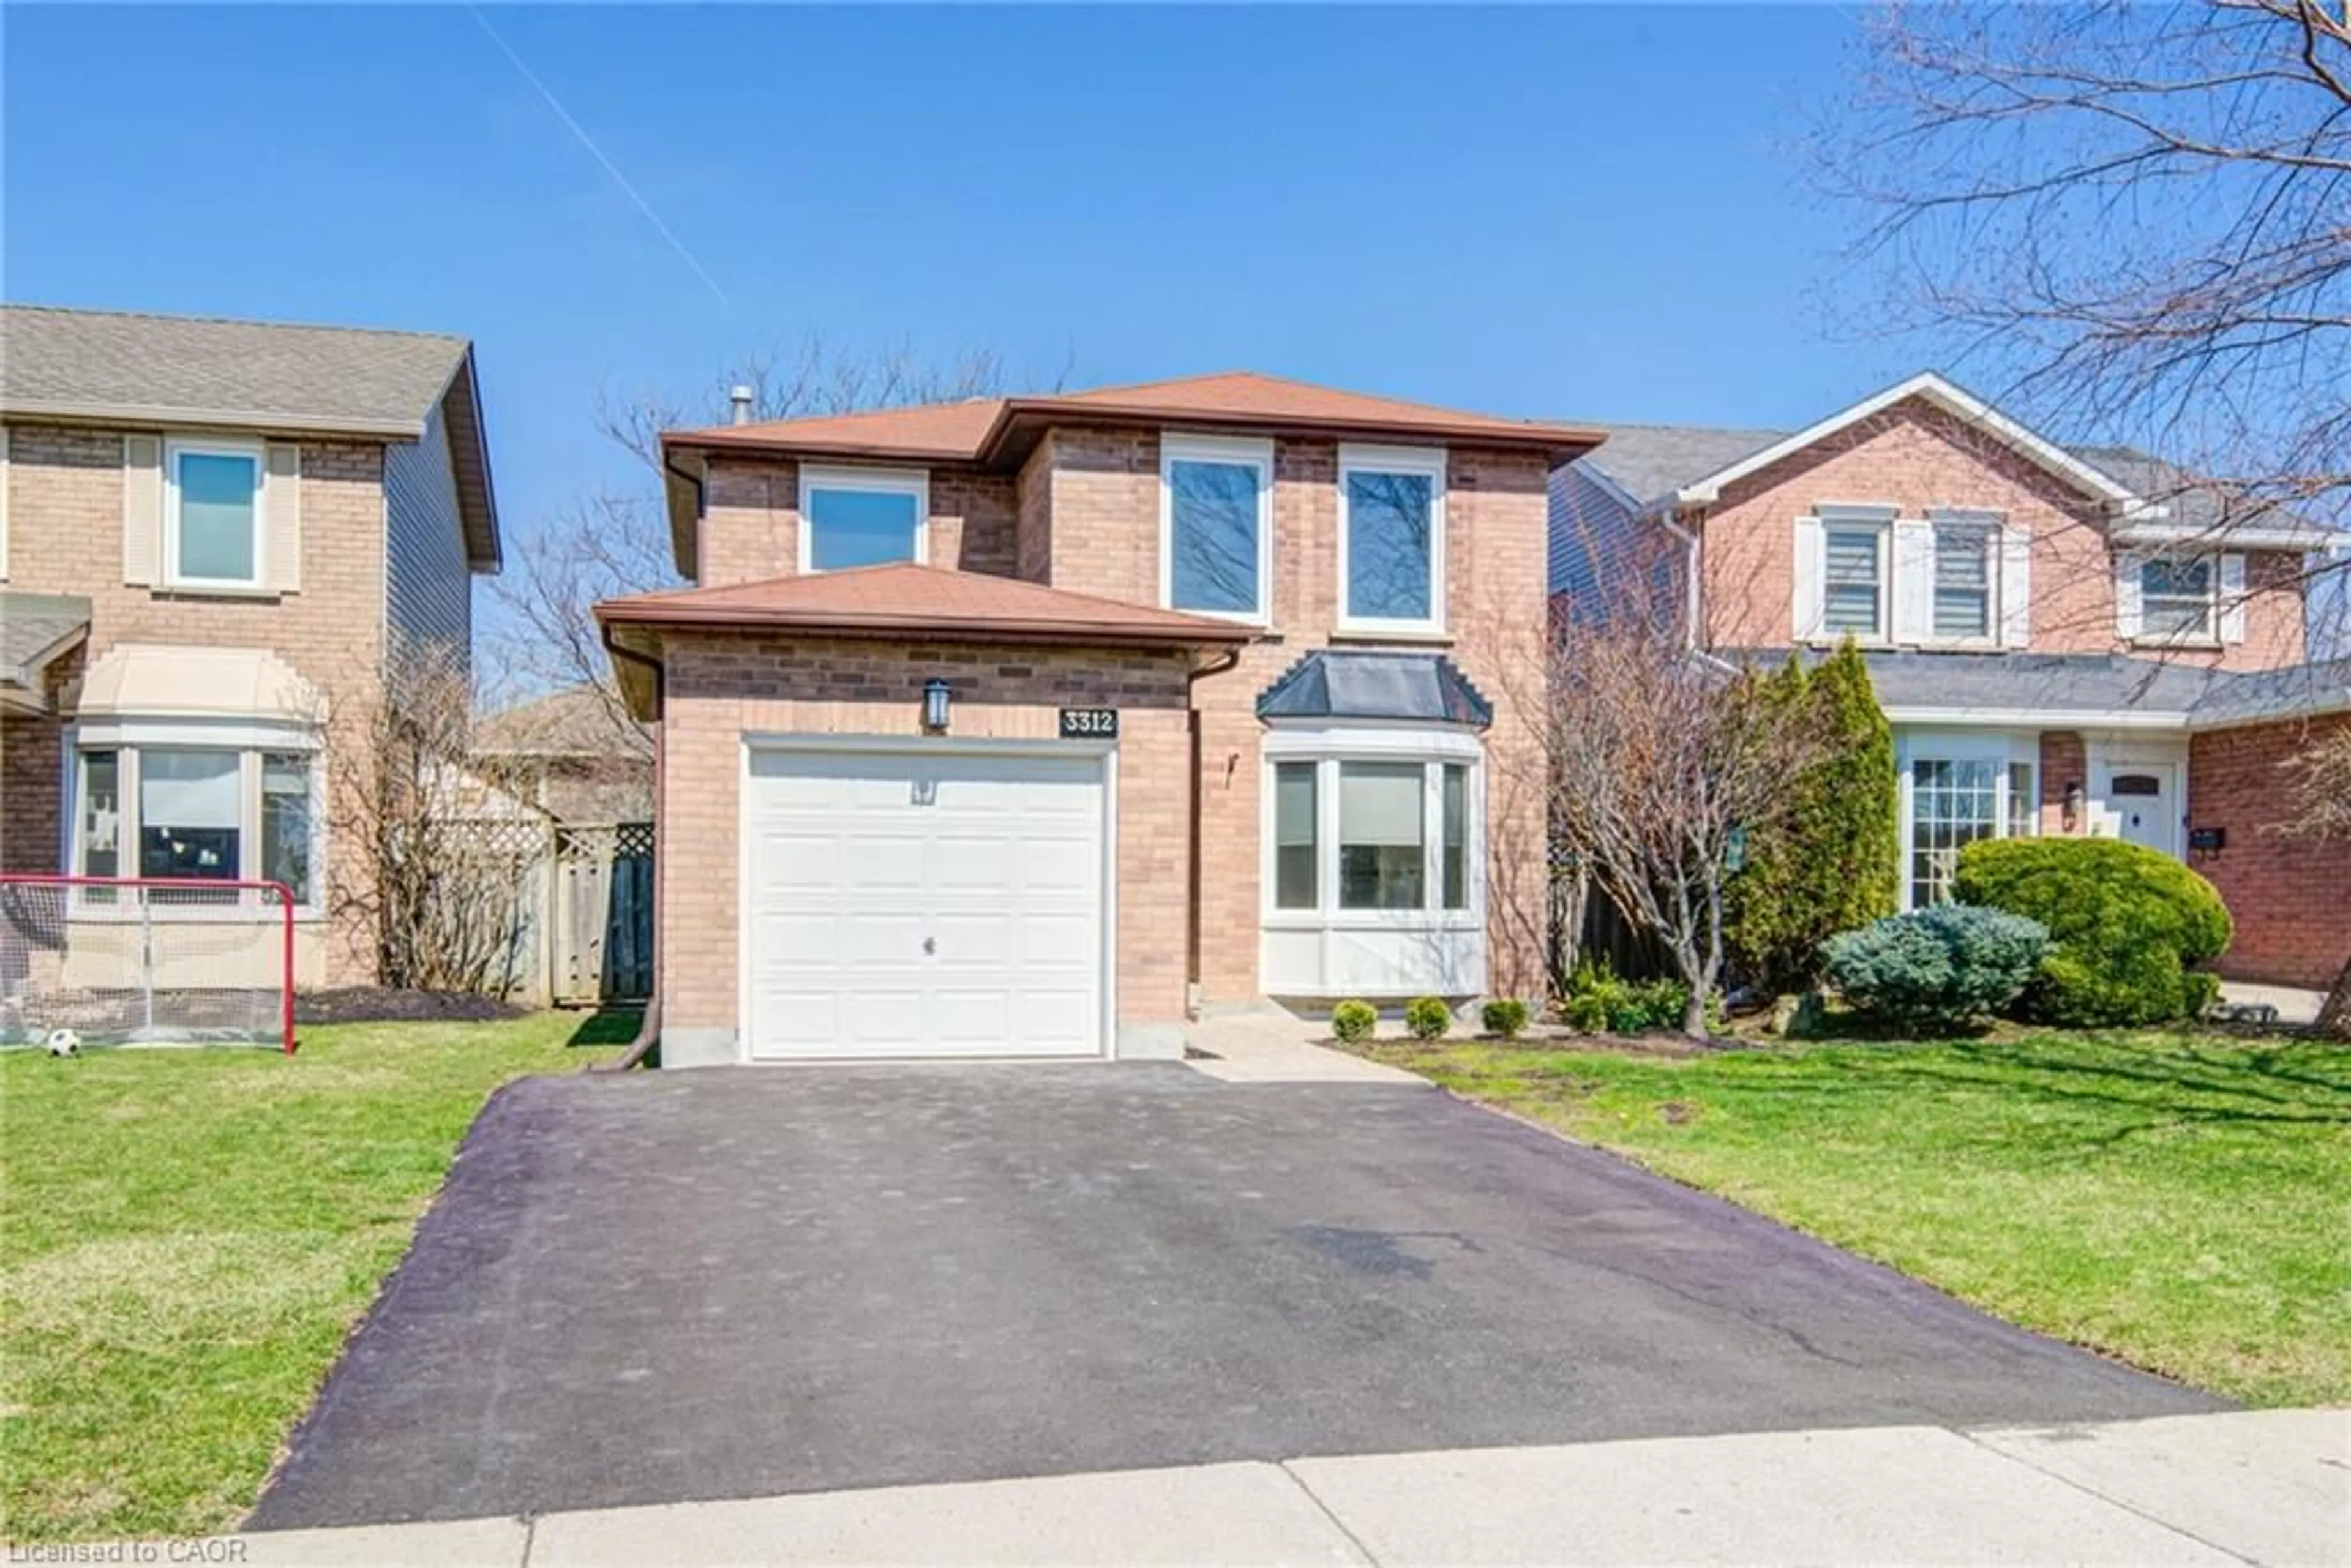
Lot size: 8,055 SqFt
Parking
Garage spaces -
Garage type -
Total parking spaces 6
Property History
Login required
Sold
$•••,•••
Stayed 59 days on market Listing by trreb®
Login required
Sold
$•••,•••
Login required
Price change
$•••,•••
Login required
Listed
$•••,•••
Stayed --60 days on market Listing by itso®

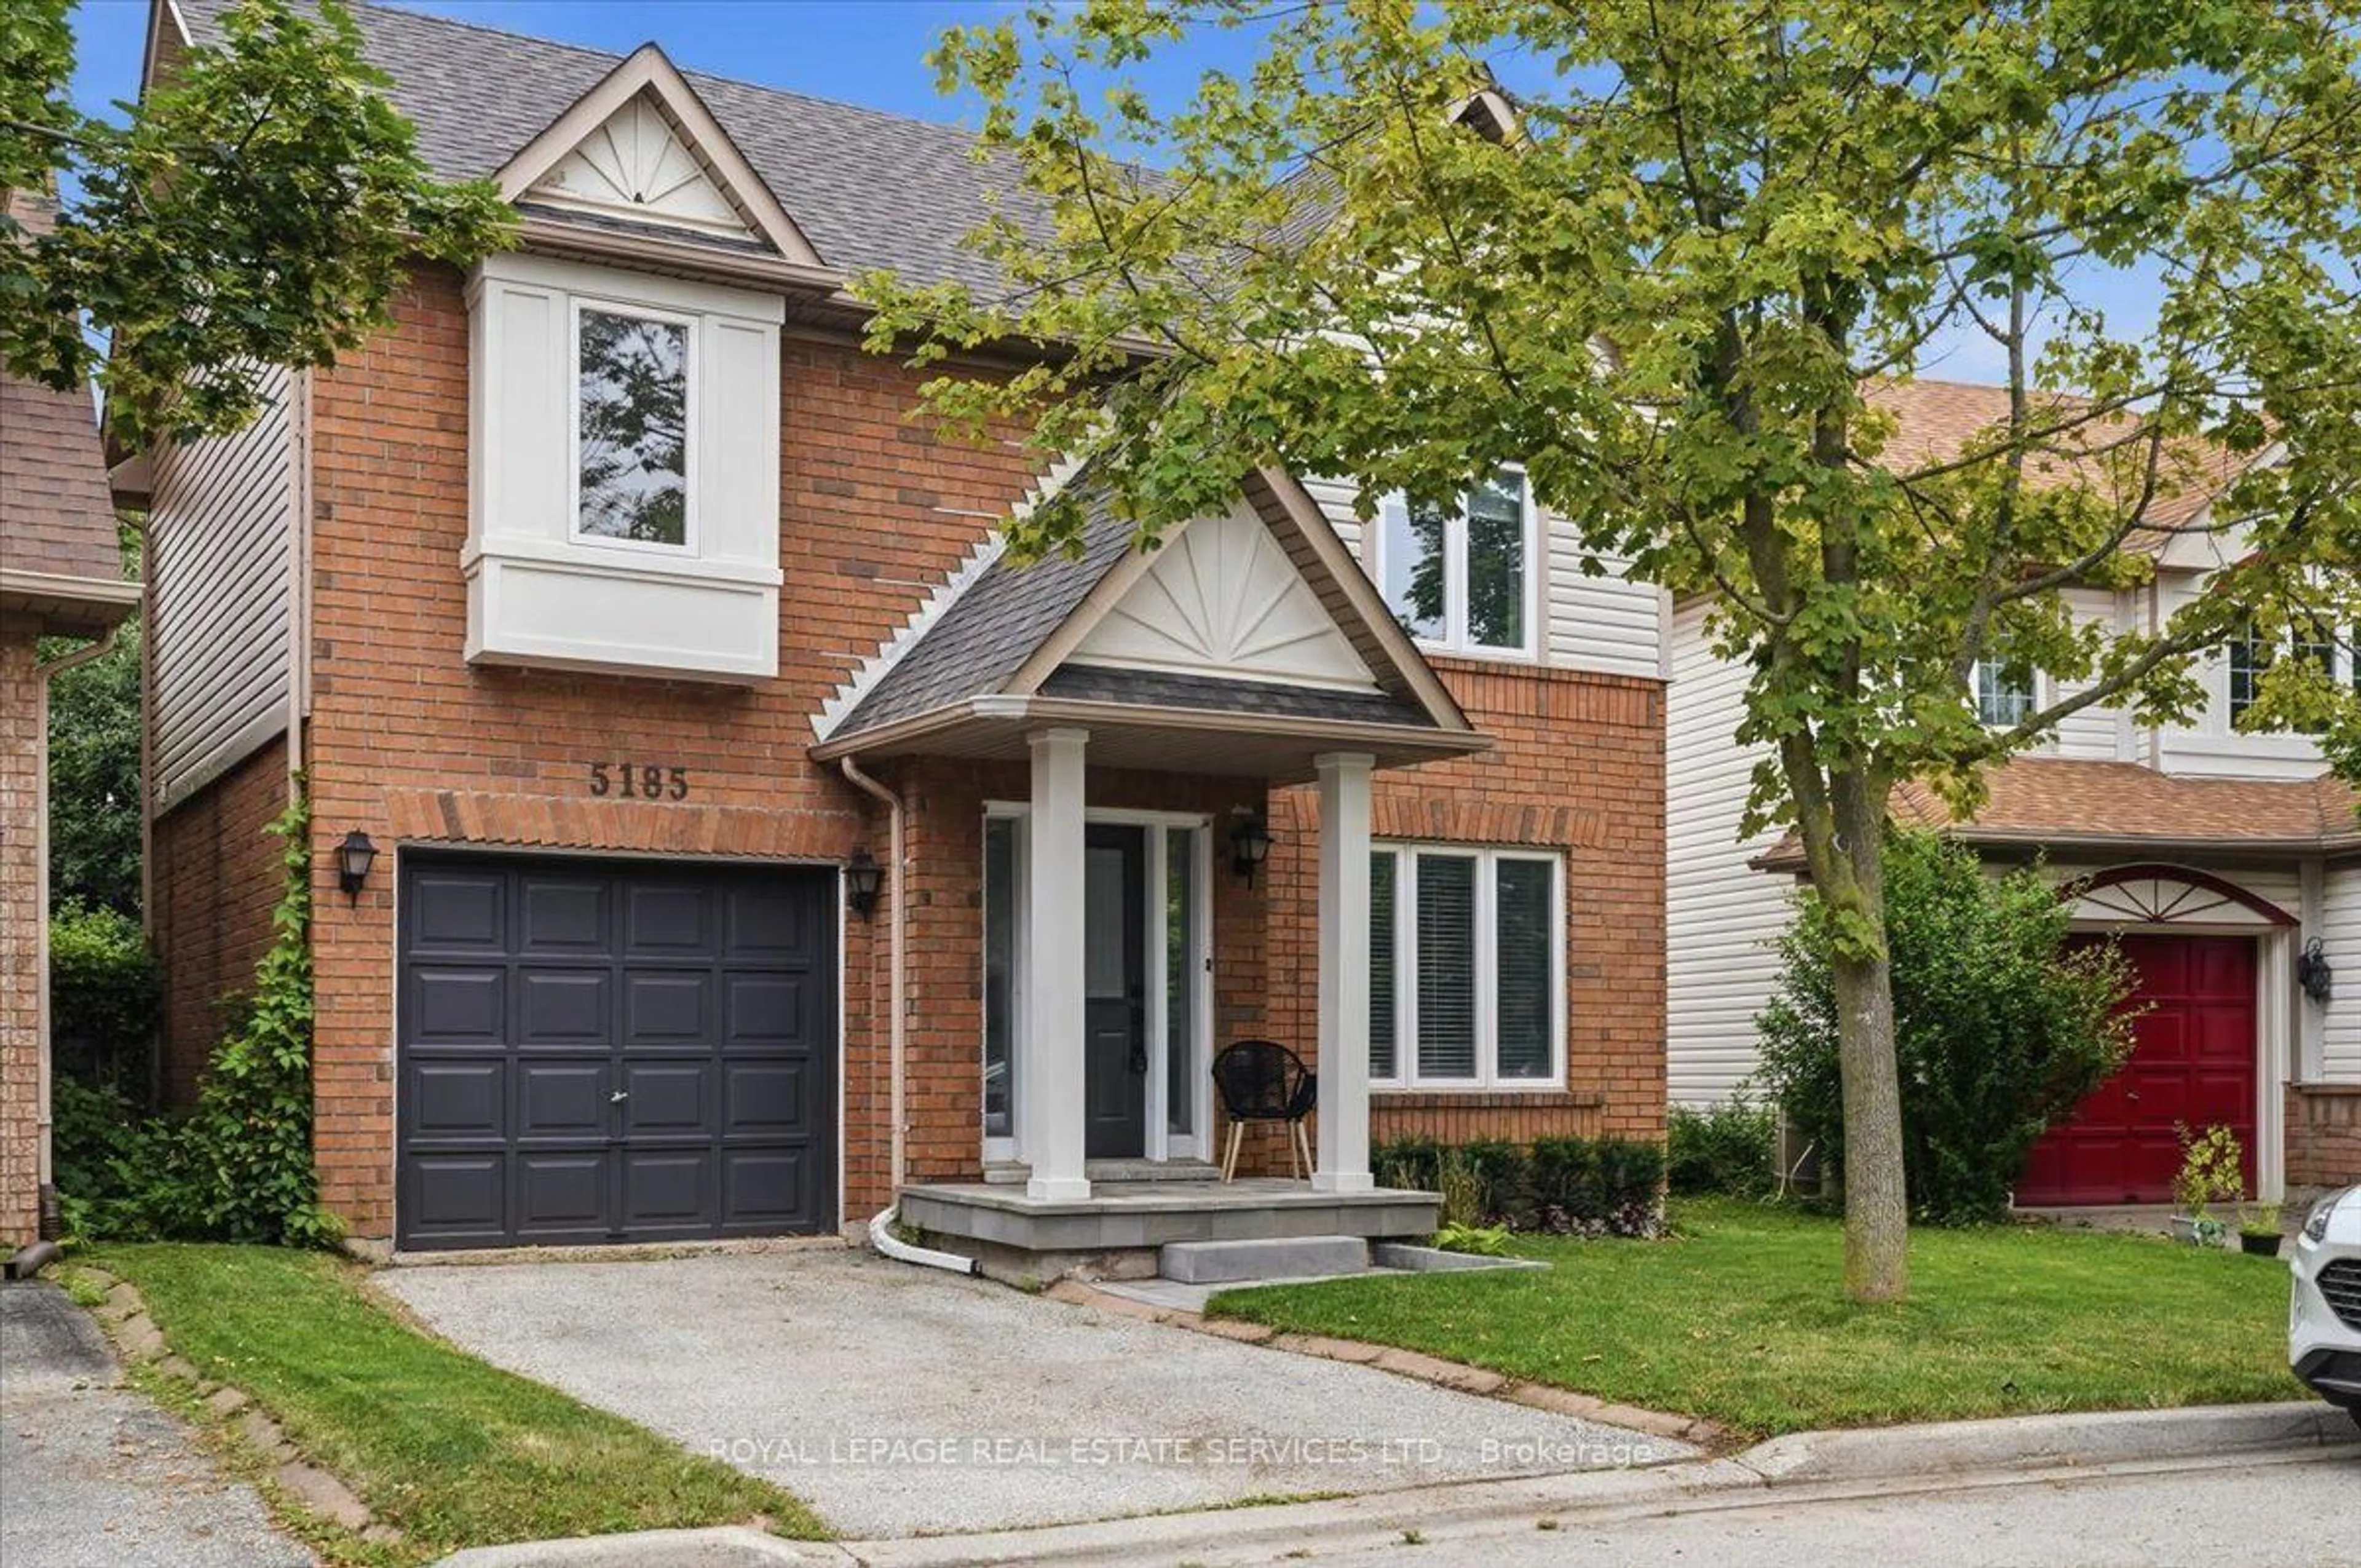
Property listed by ROYAL LEPAGE BURLOAK REAL ESTATE SERVICES, Brokerage

Interested in this property?Get in touch to get the inside scoop.