20 days on Market

2117 MAPLEWOOD Dr, Burlington, Ontario L7R 2C6

Detached
3
1
~700-1100 sqft
$899,900
Get pre-qualifiedPowered by nesto
Detached
3
1
~700-1100 sqft

Contact us about this property

Call

Highlights

Property Estimate

Days on market20 days

Estimated valueNot available

Price/Sqft$1,052/sqft

Monthly cost

Open Calculator

Description

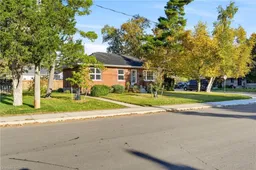
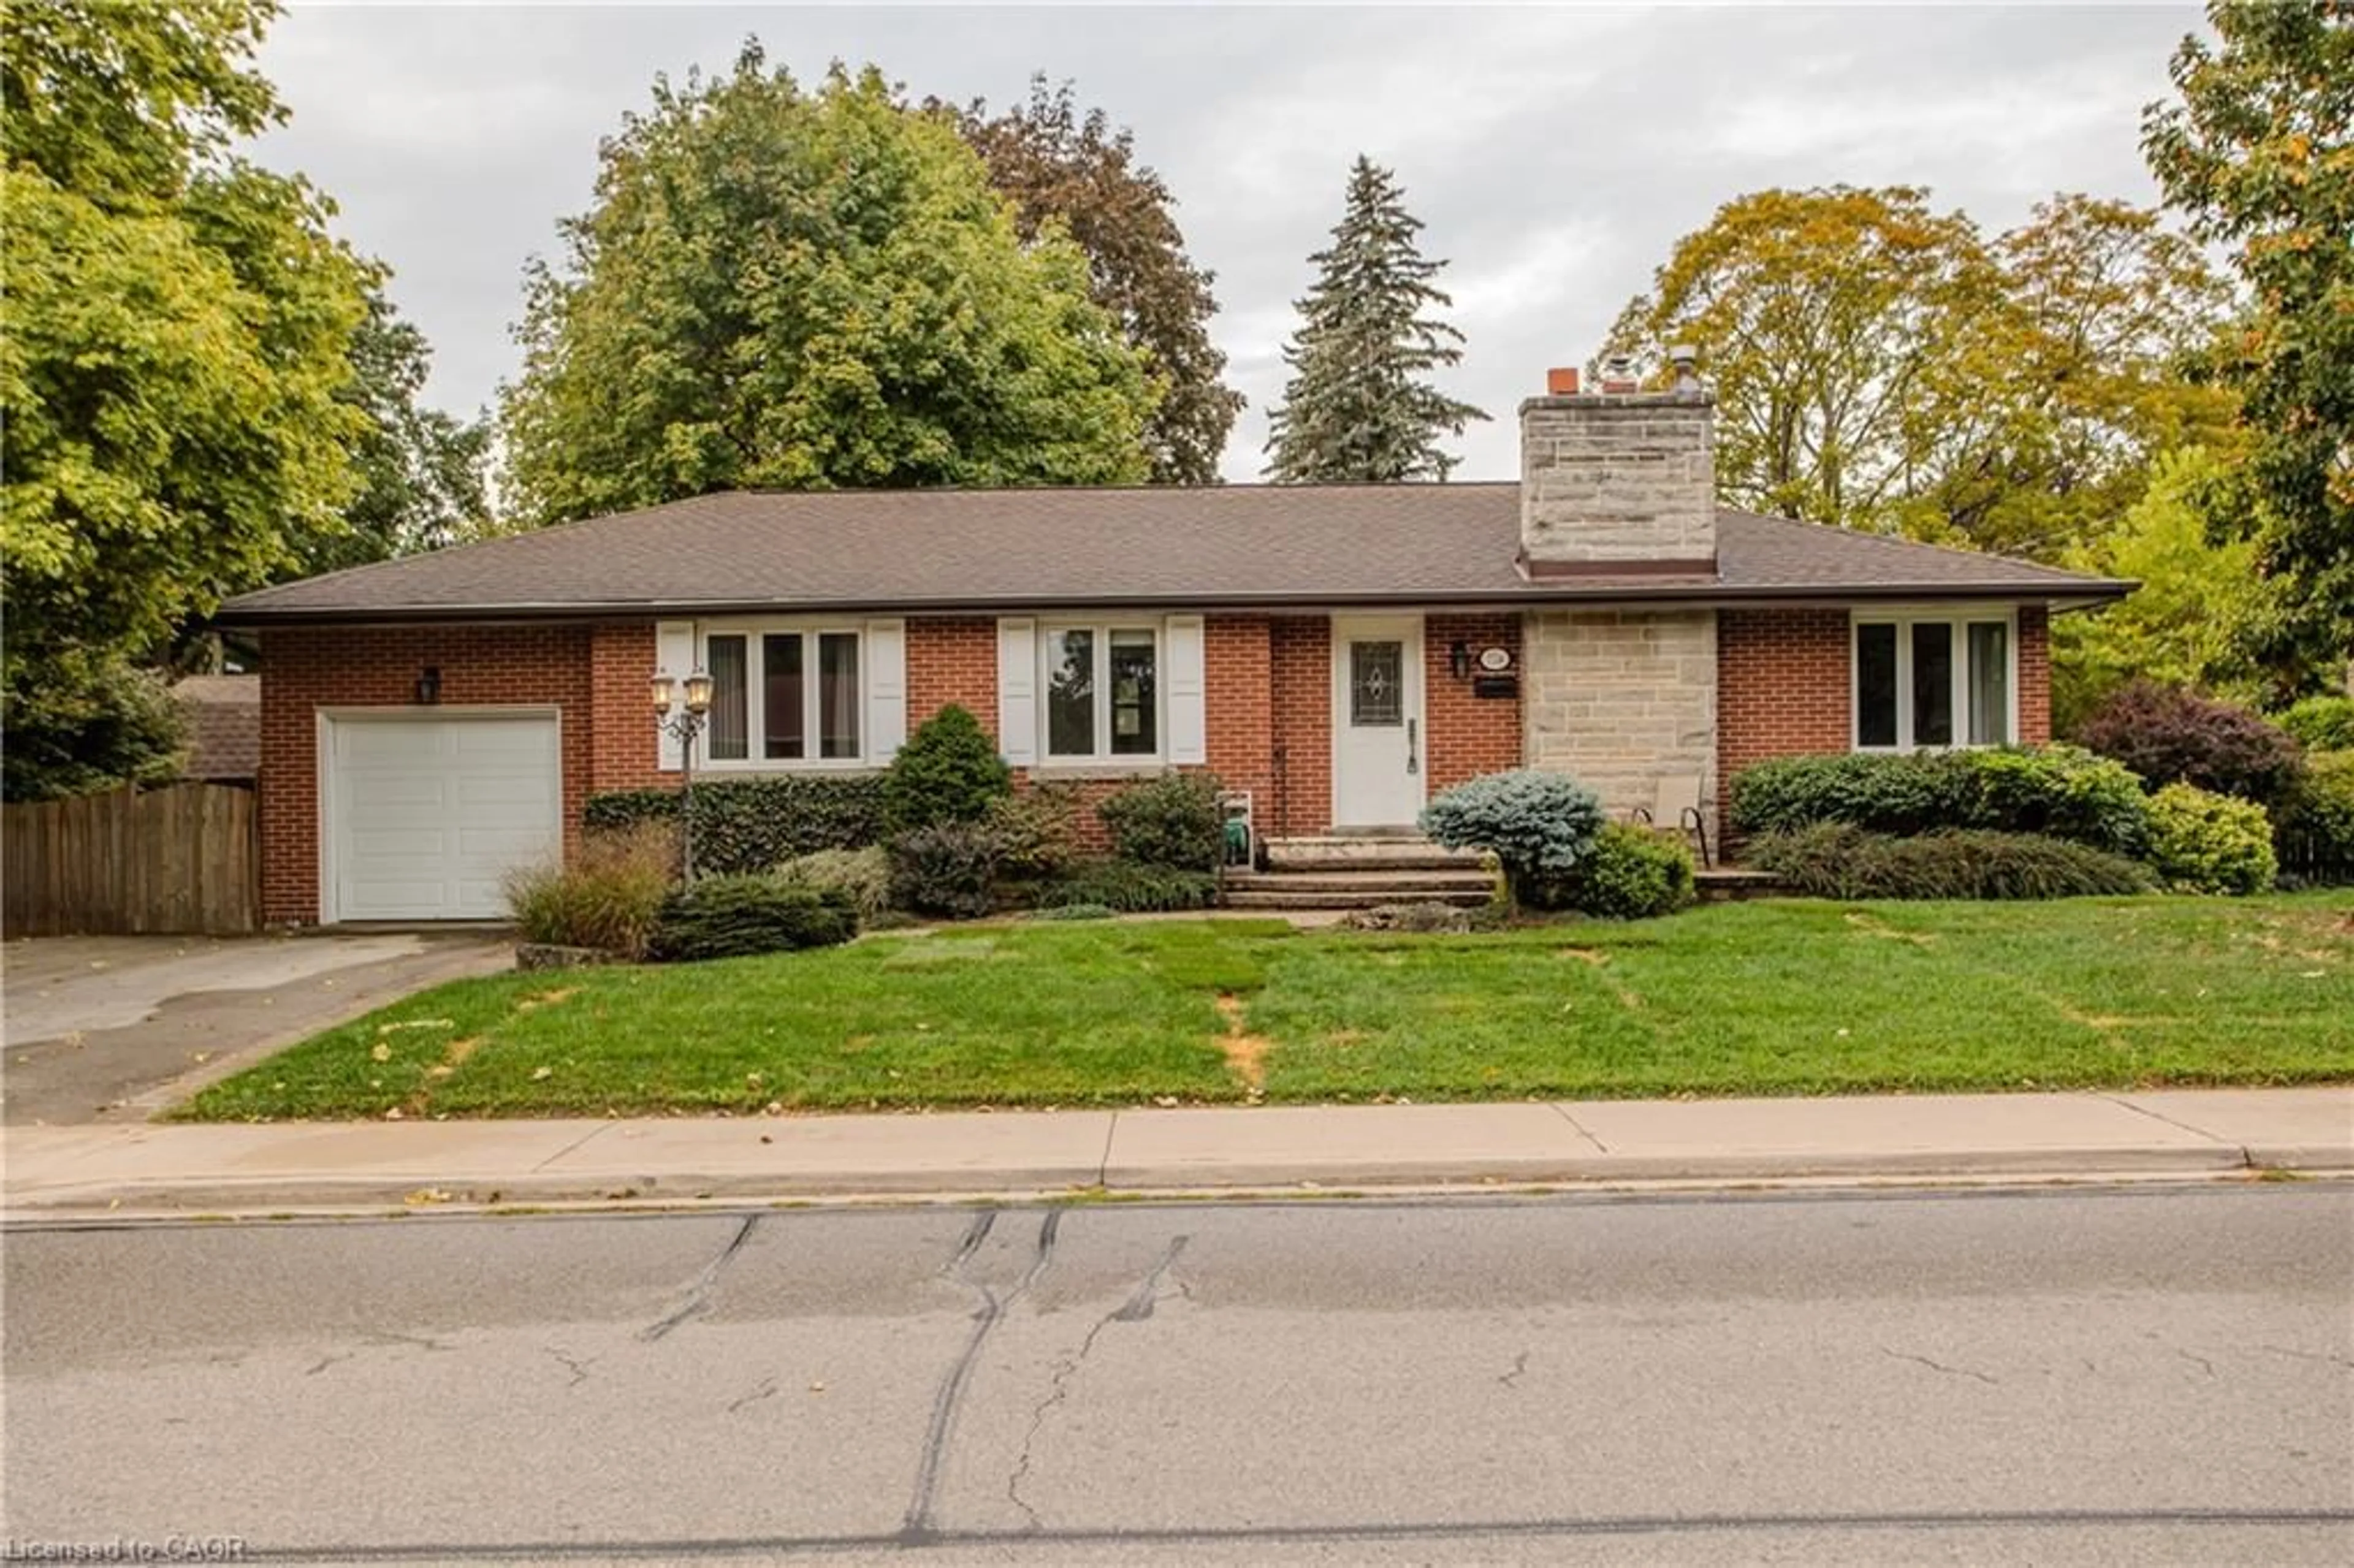
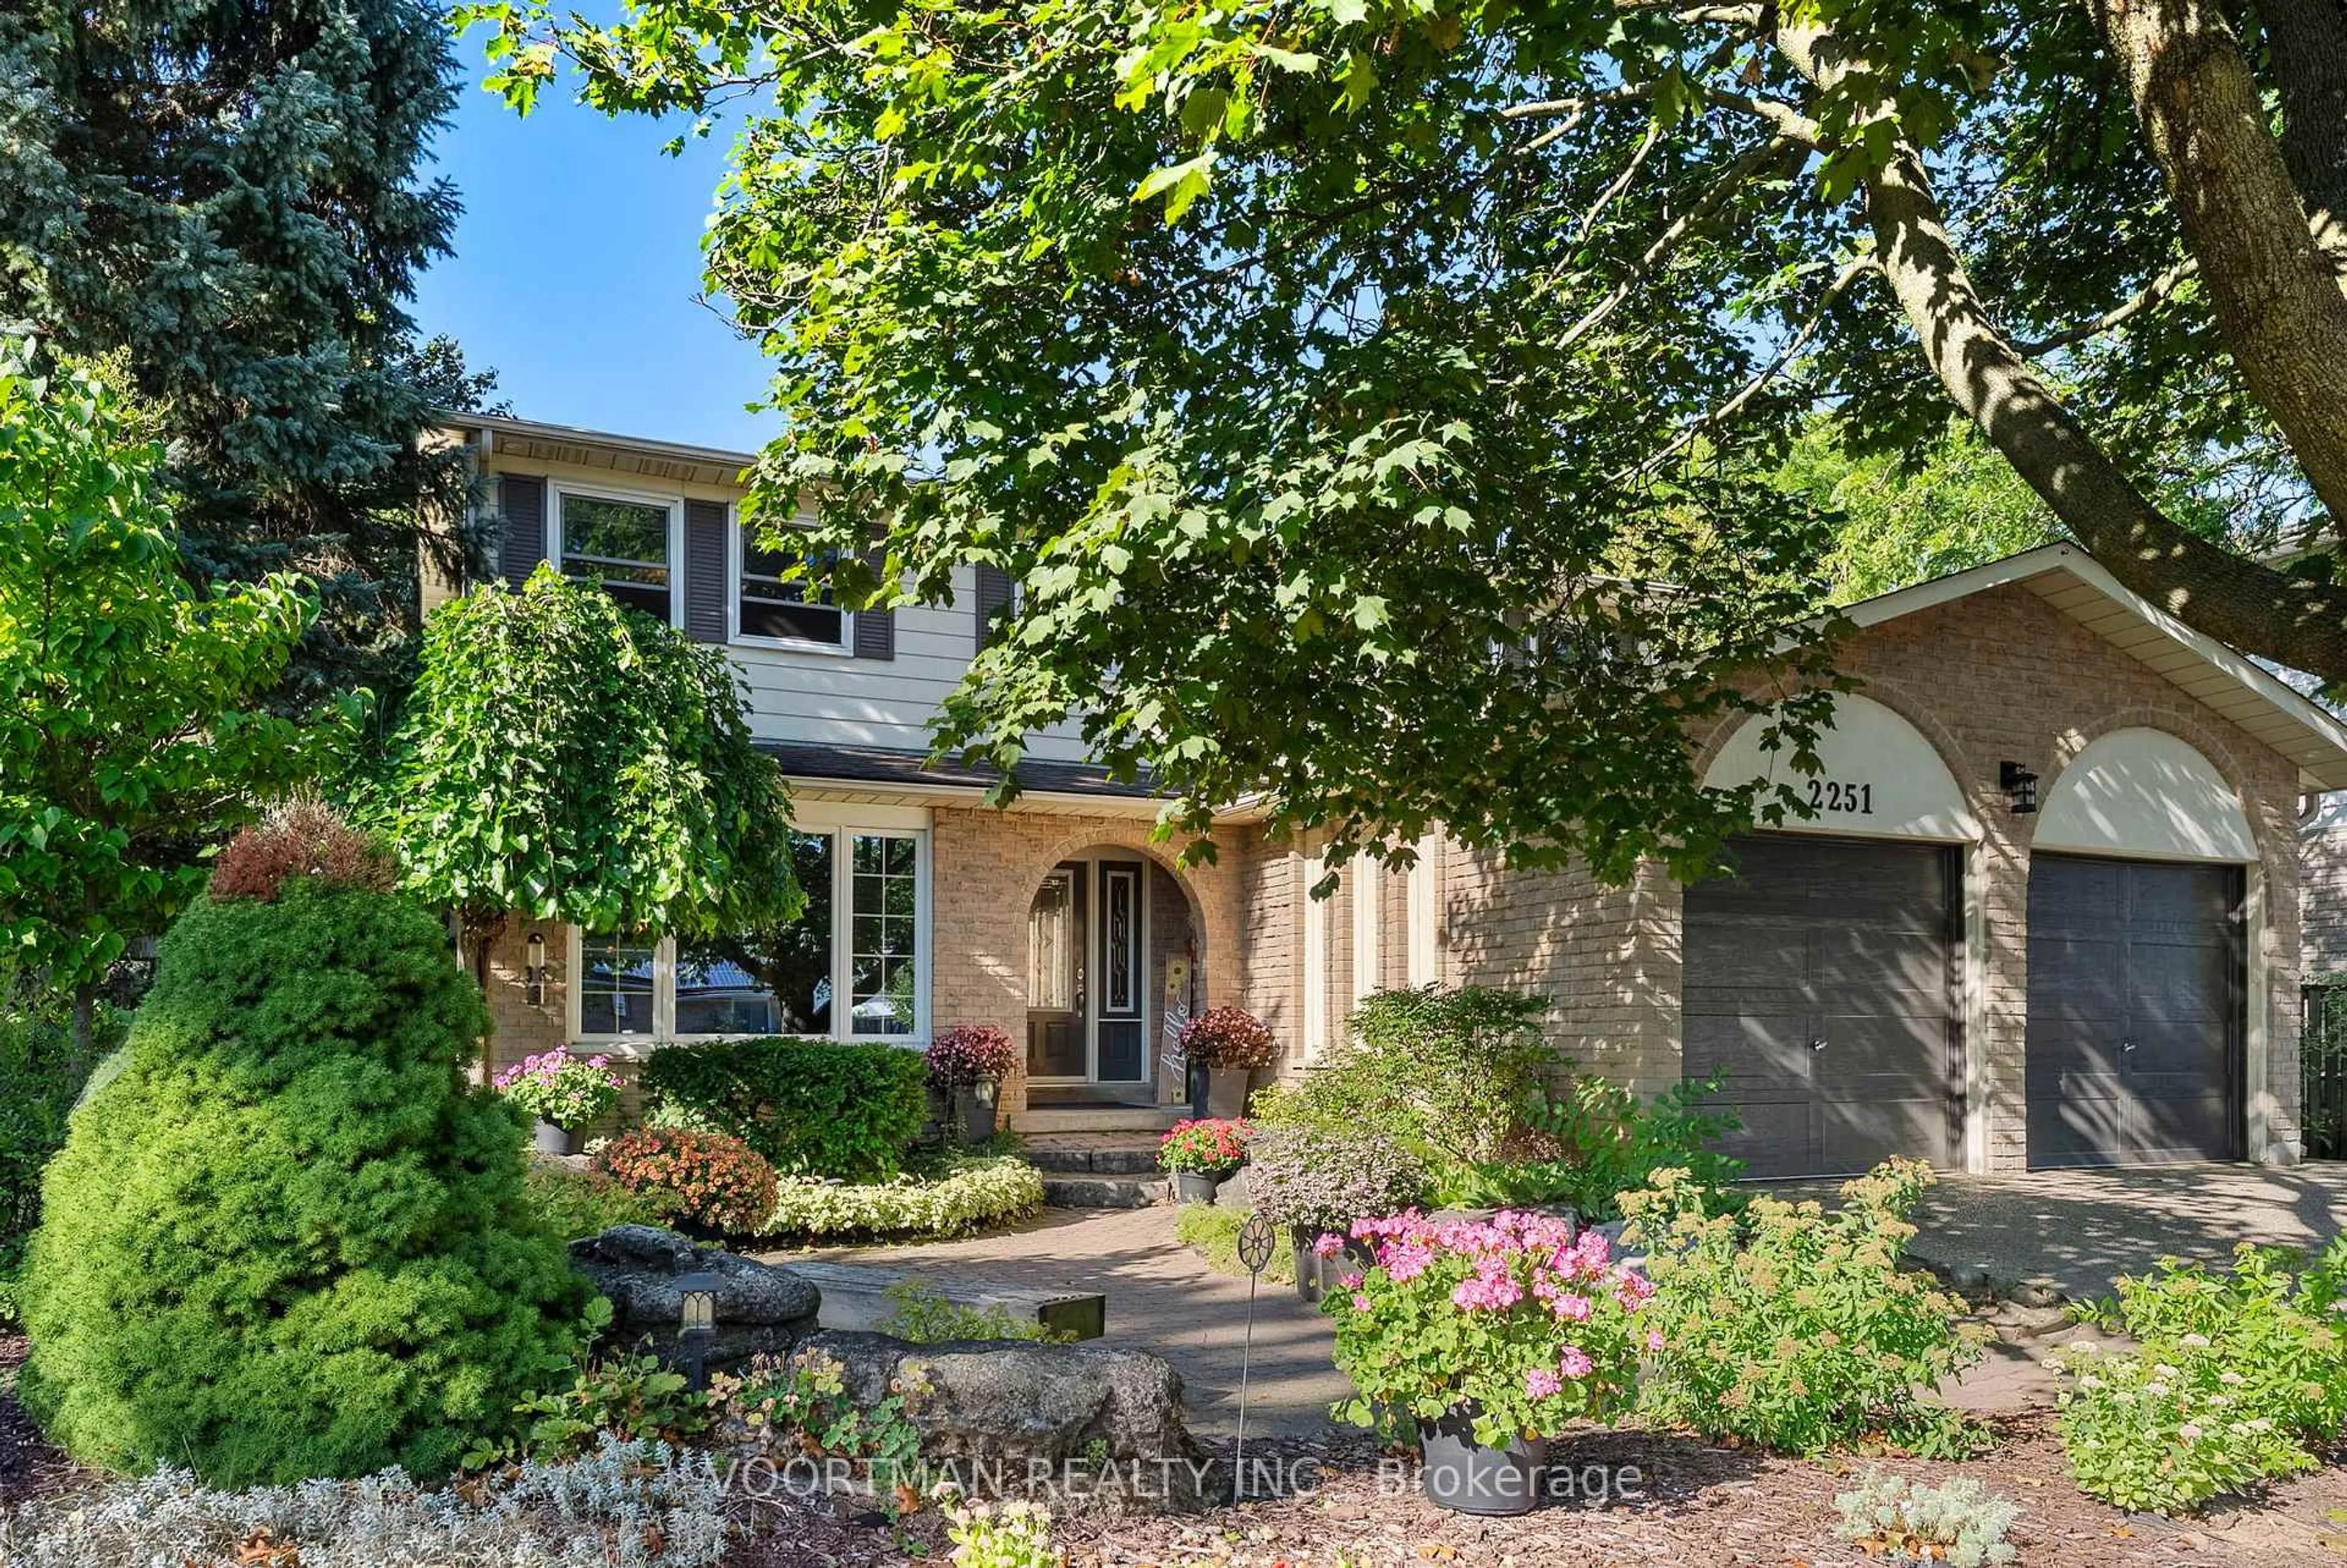
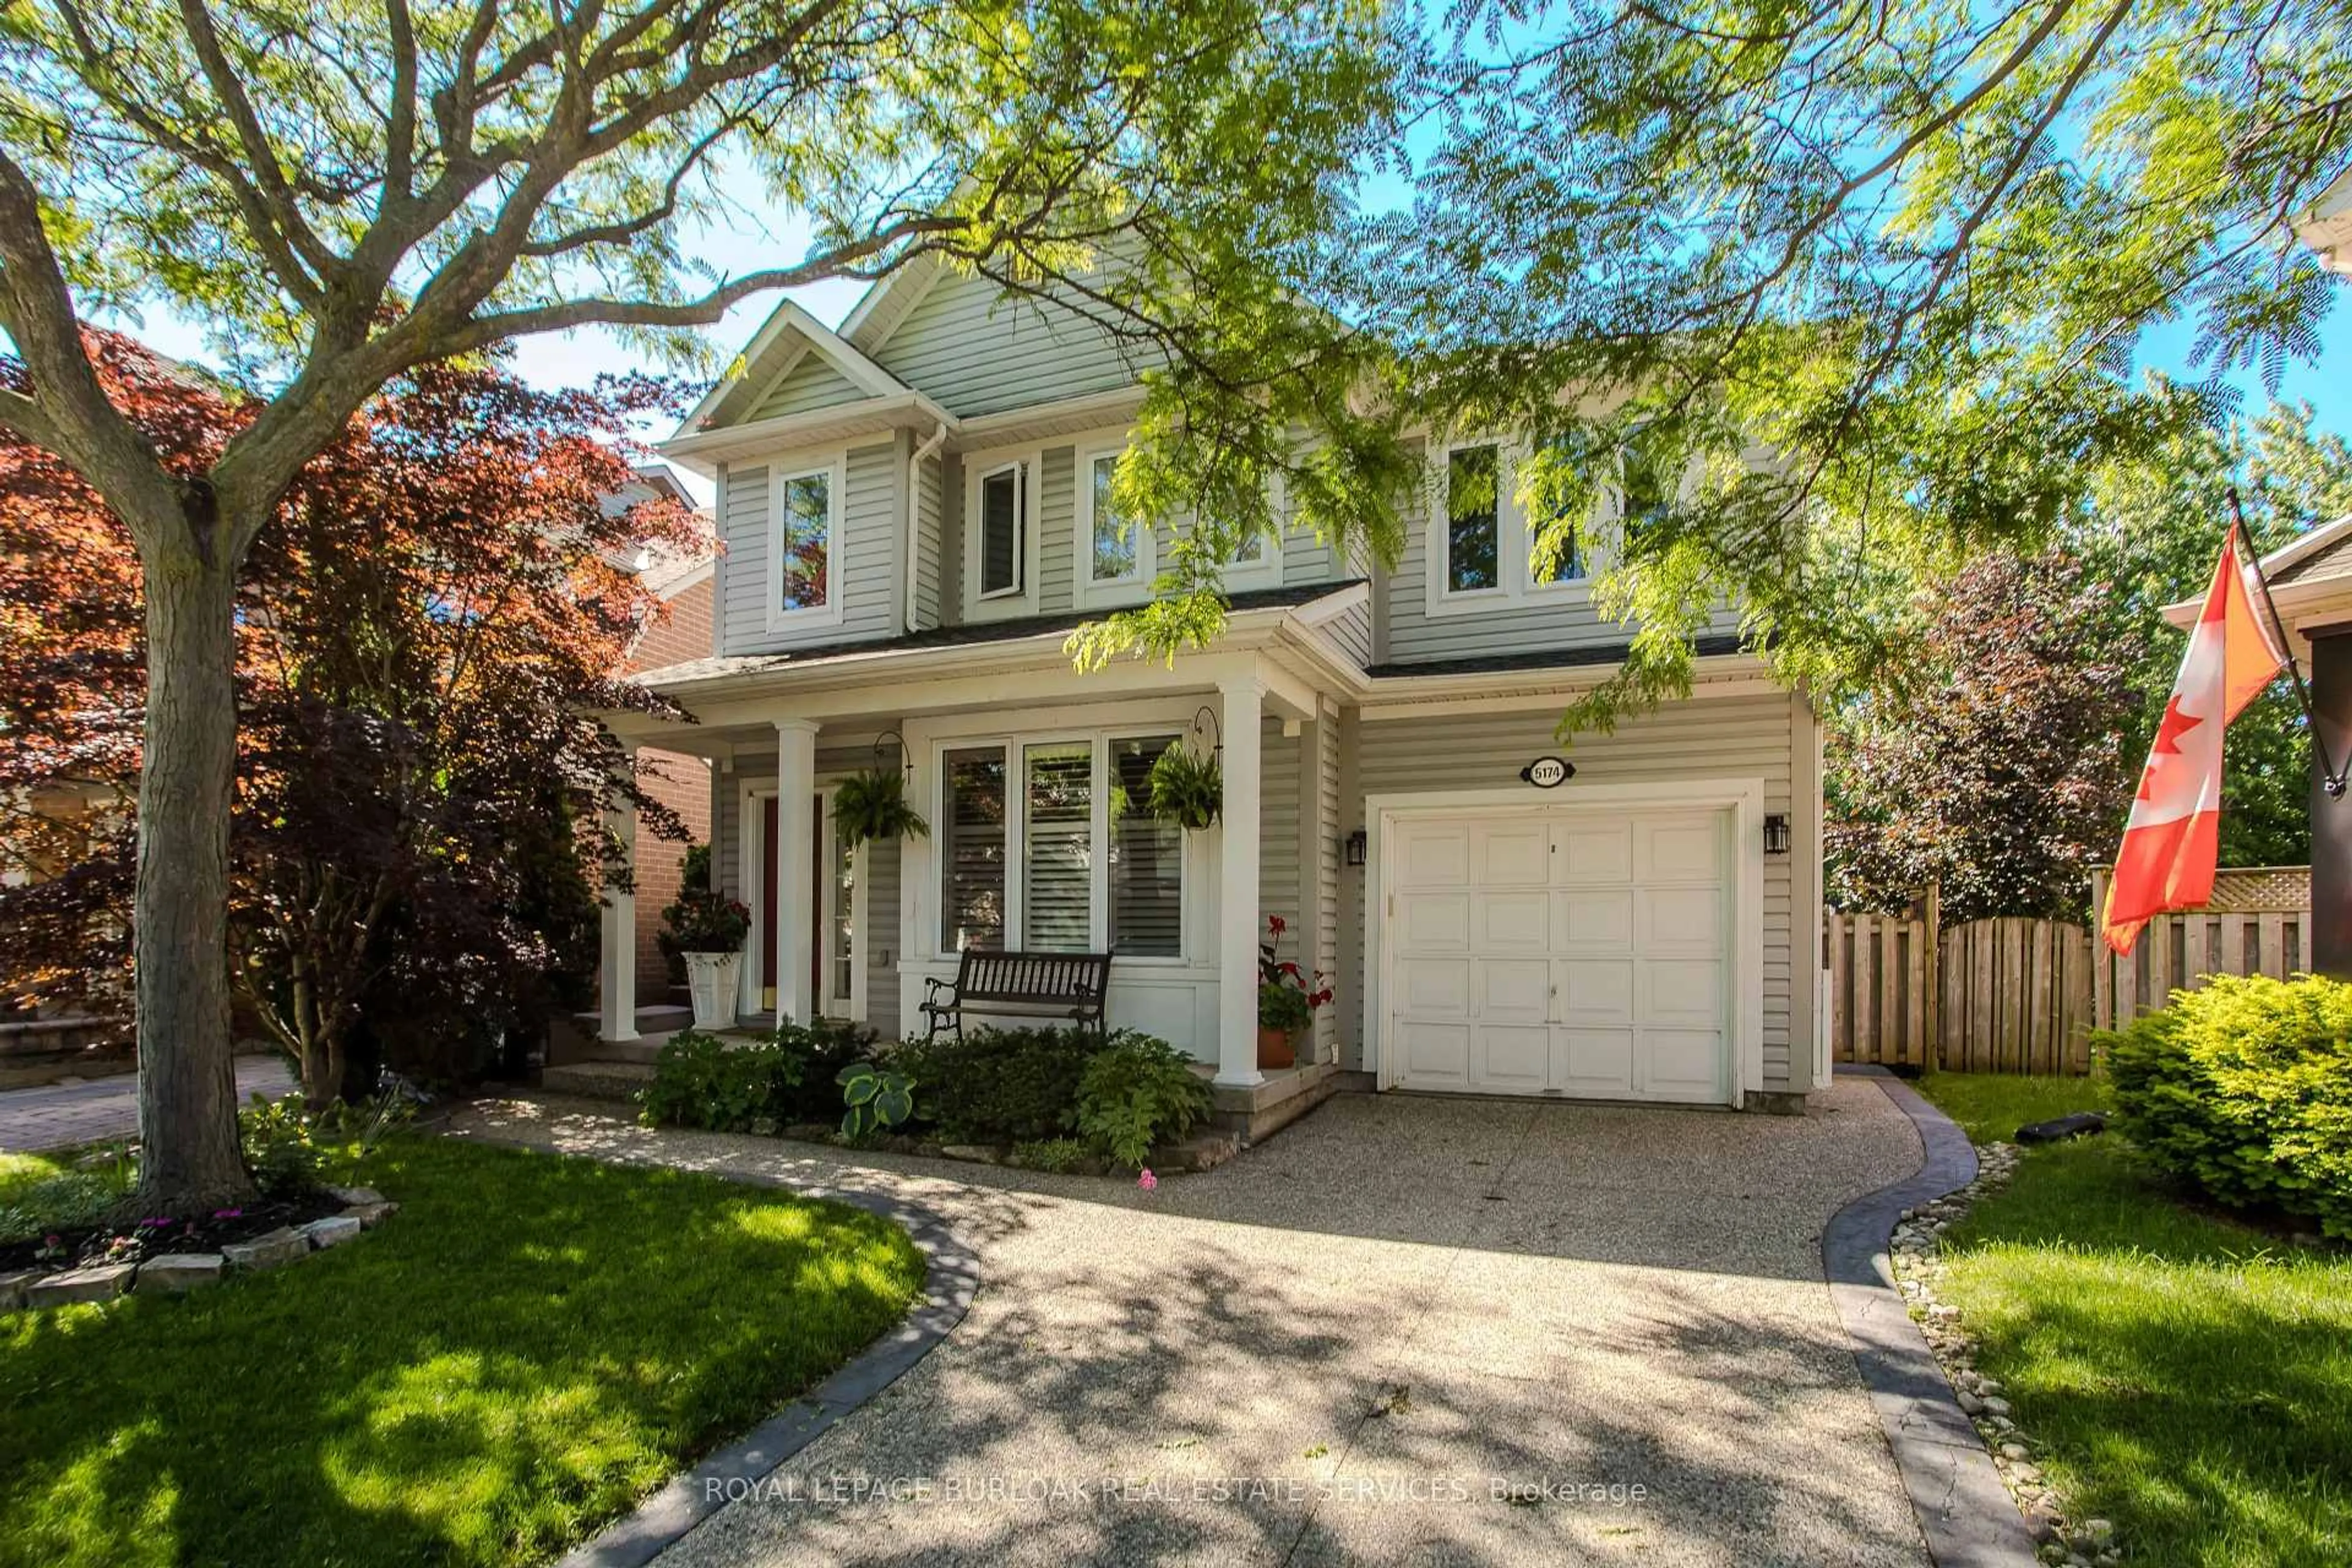
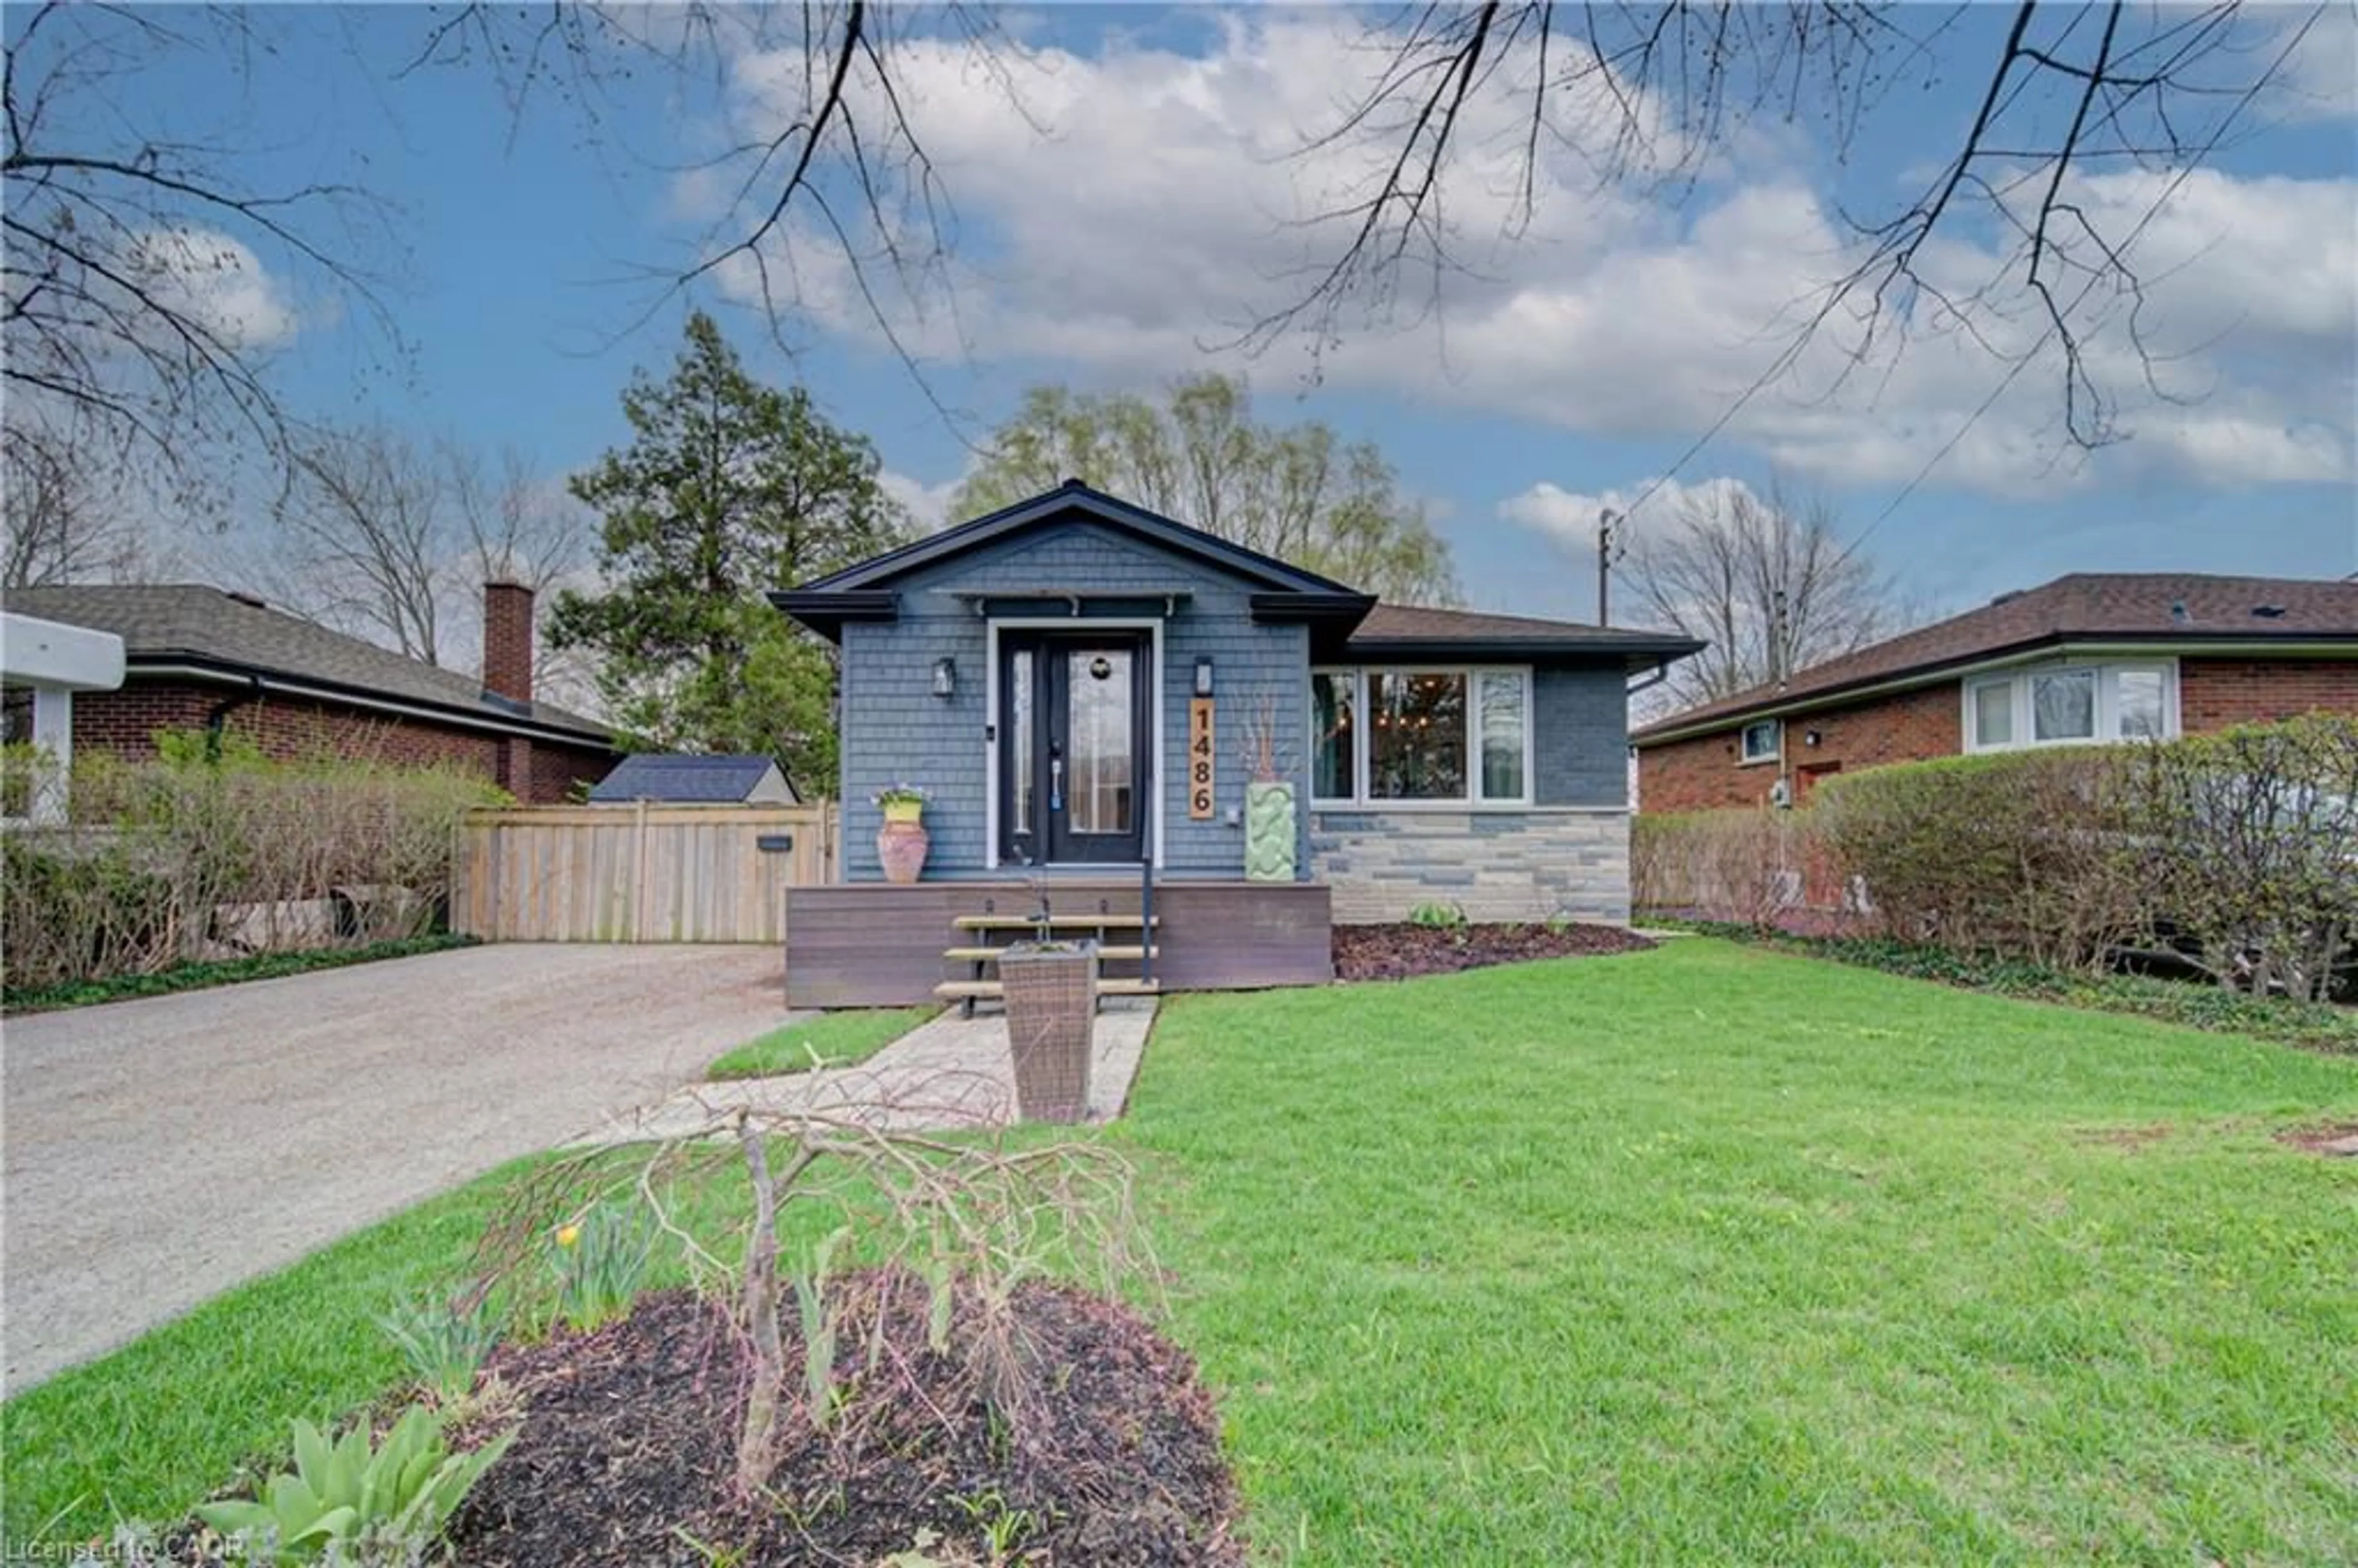
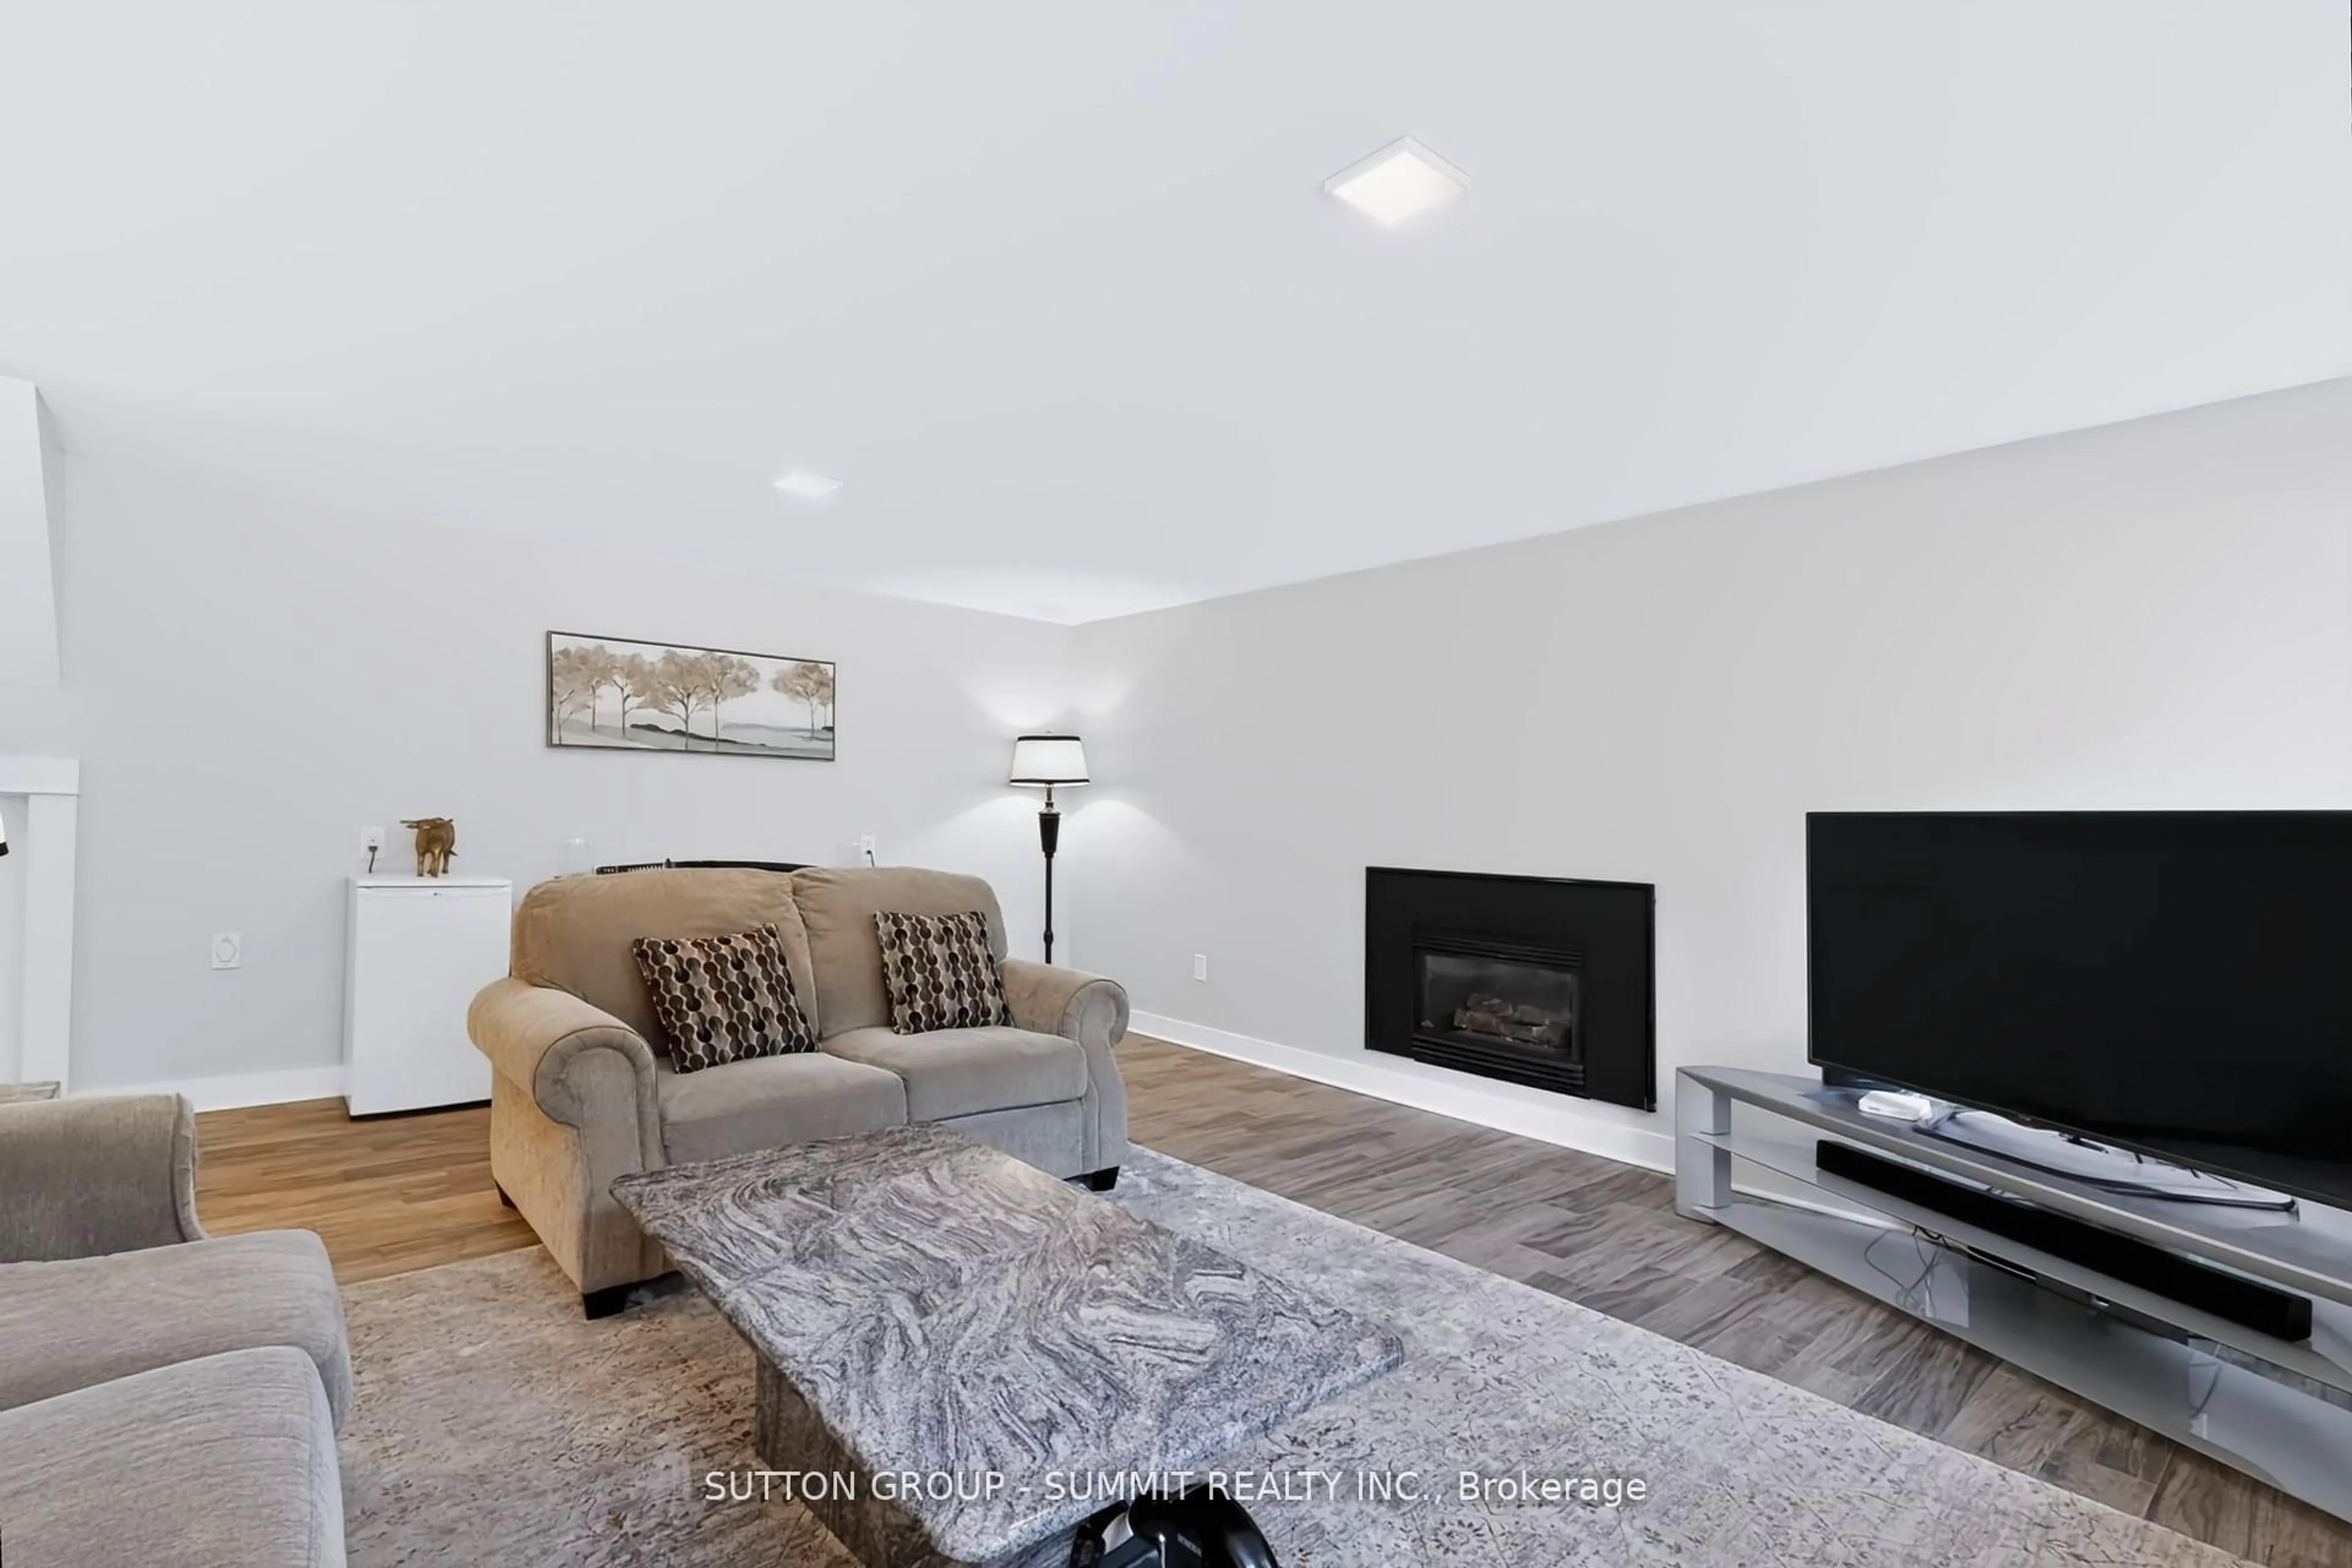
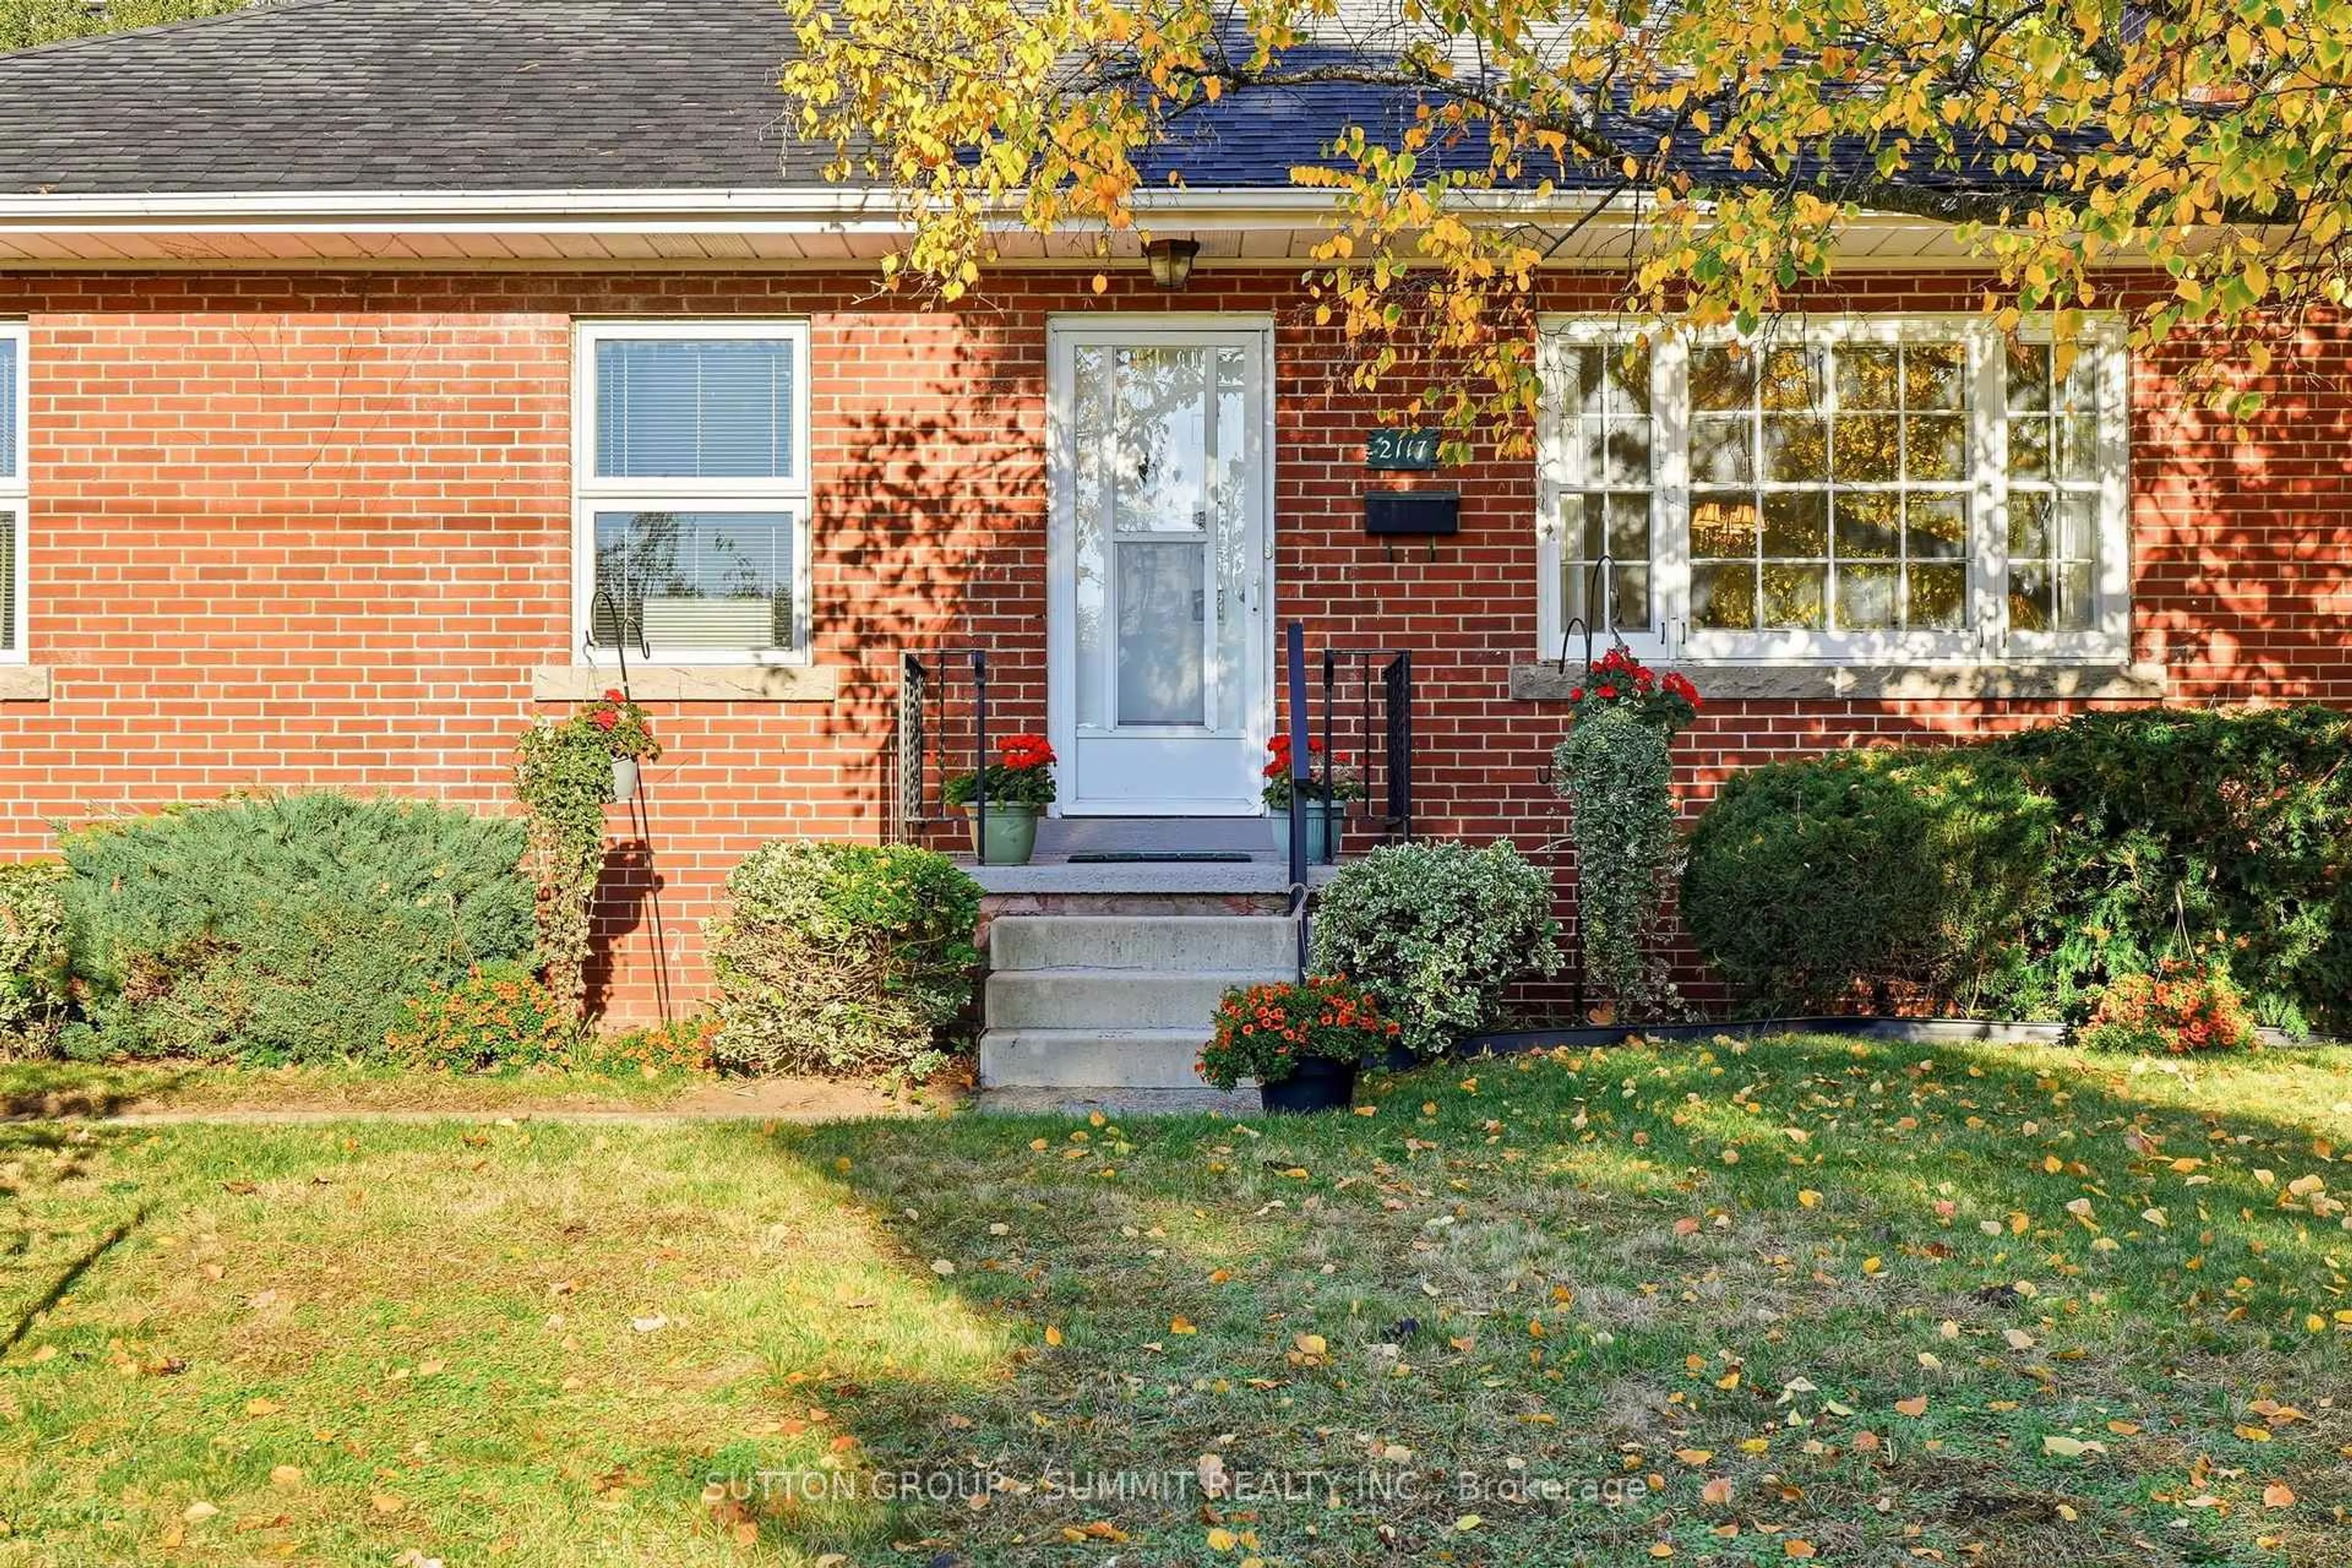
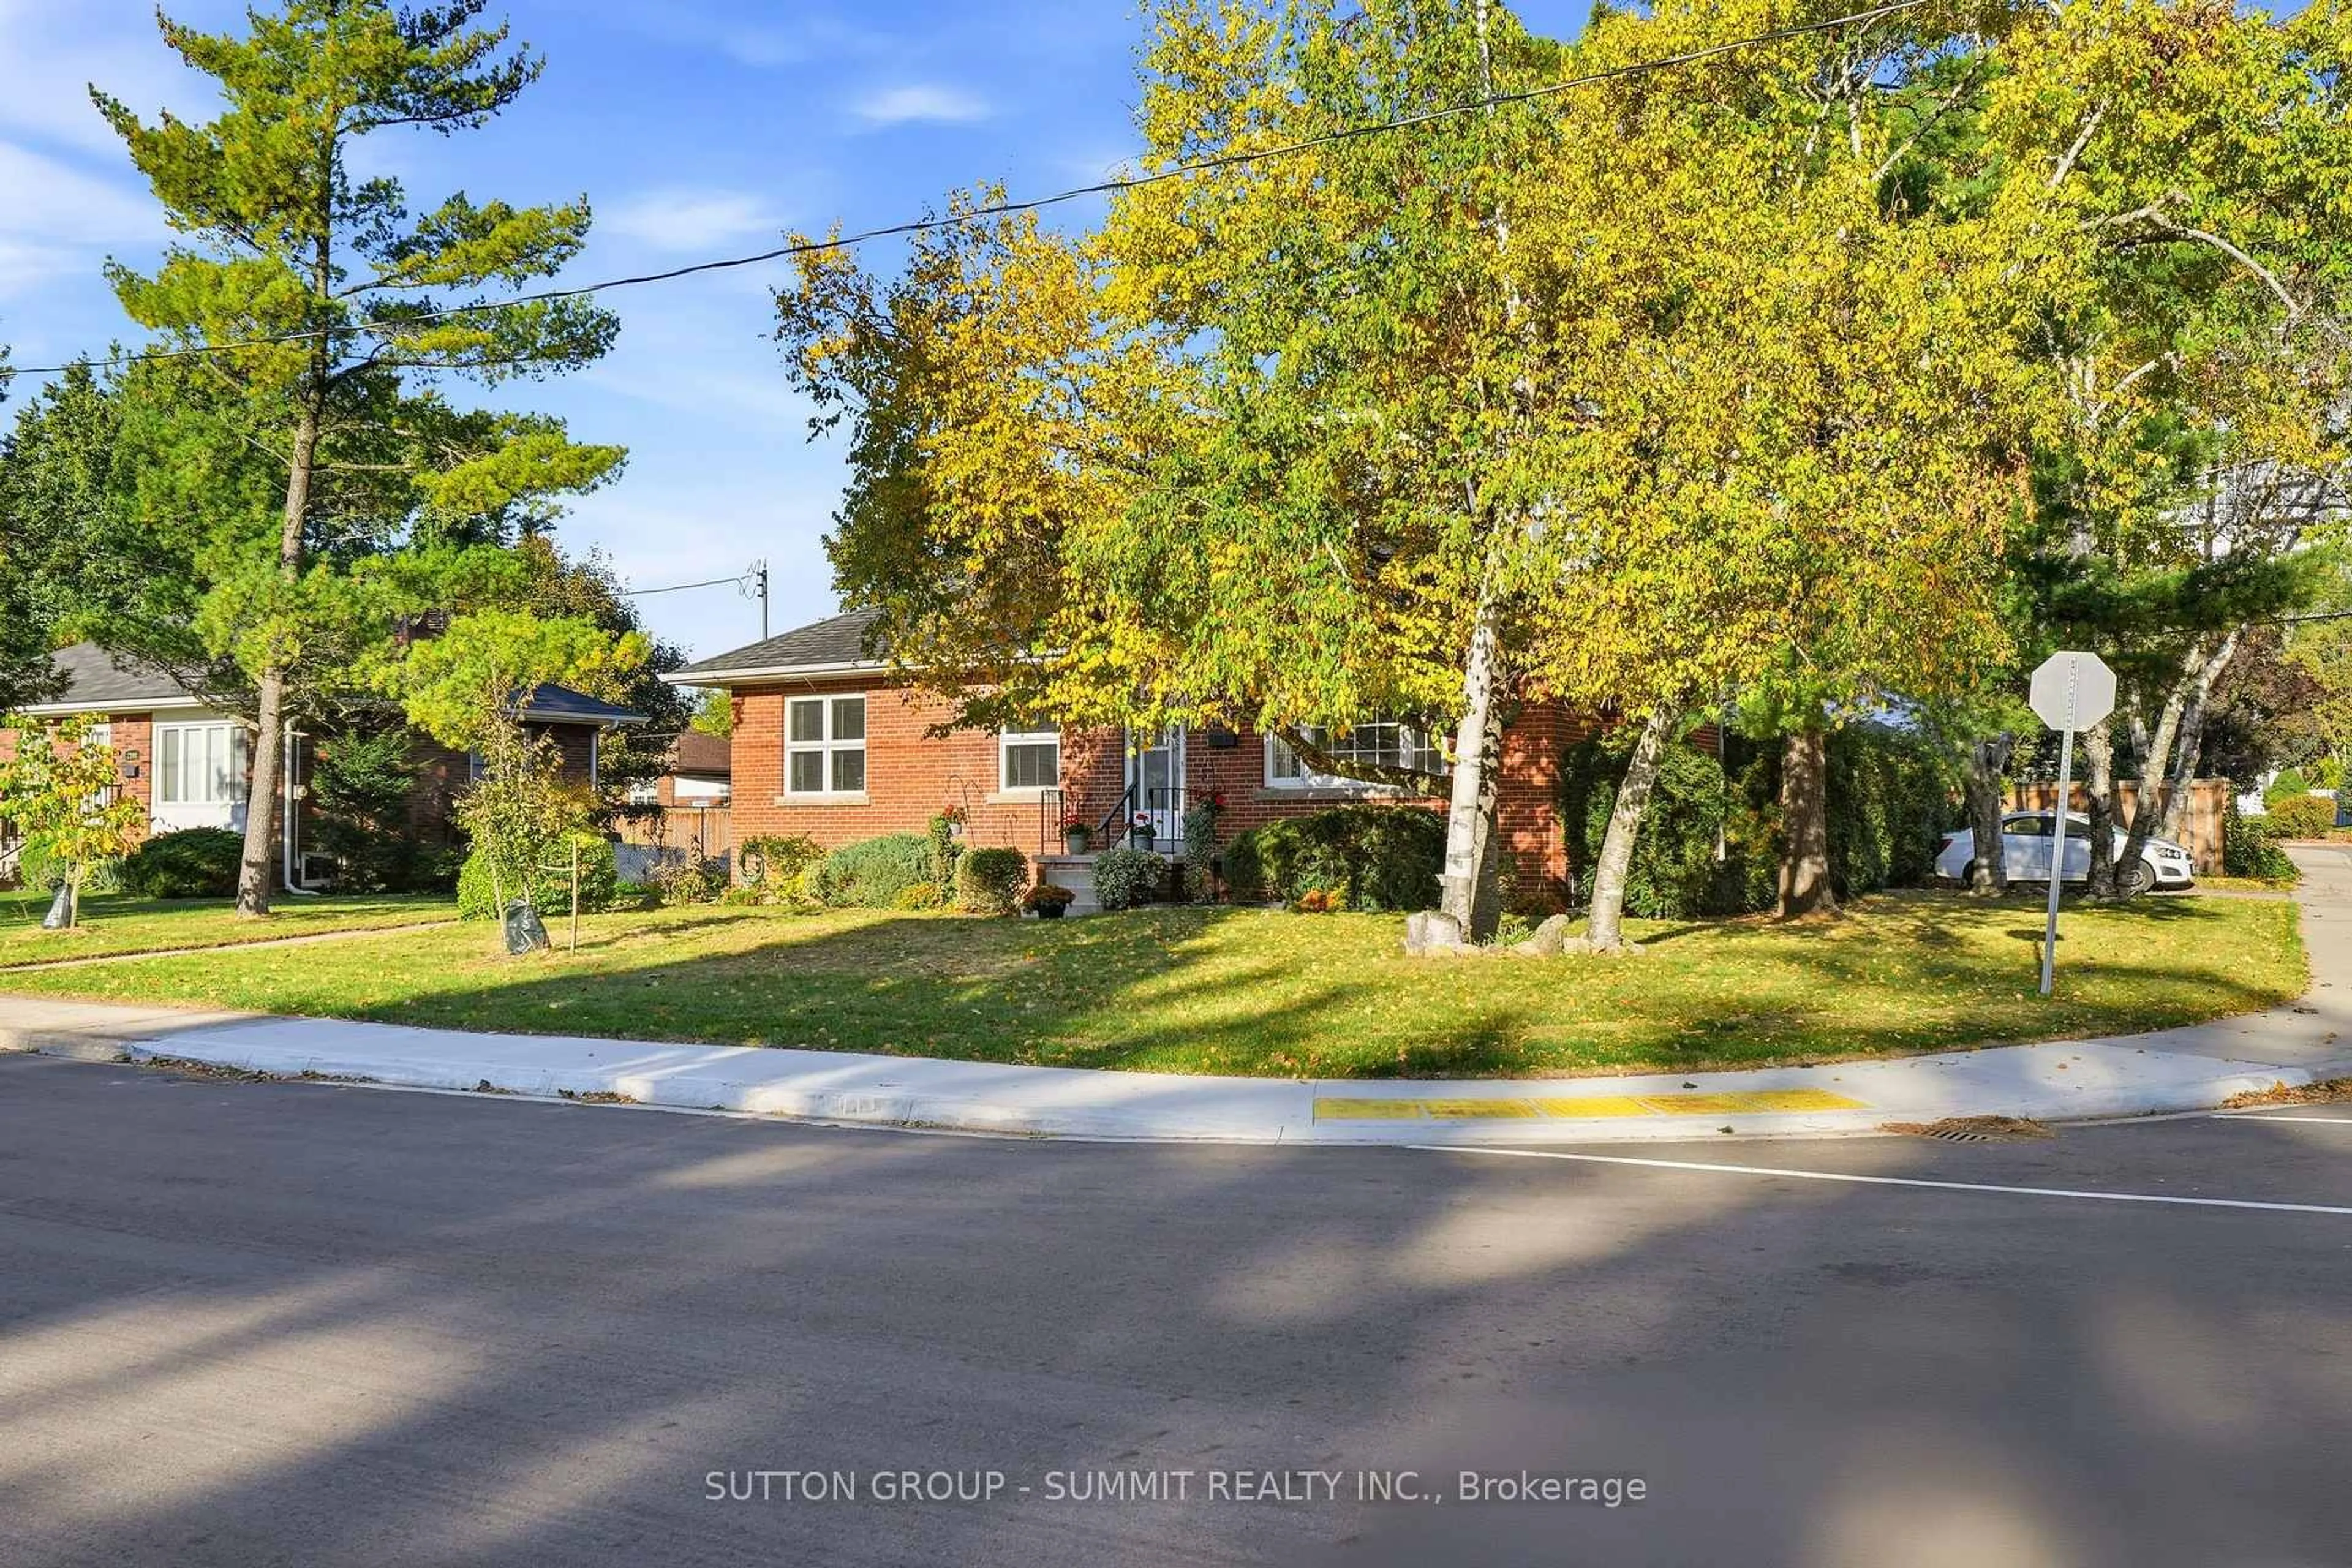
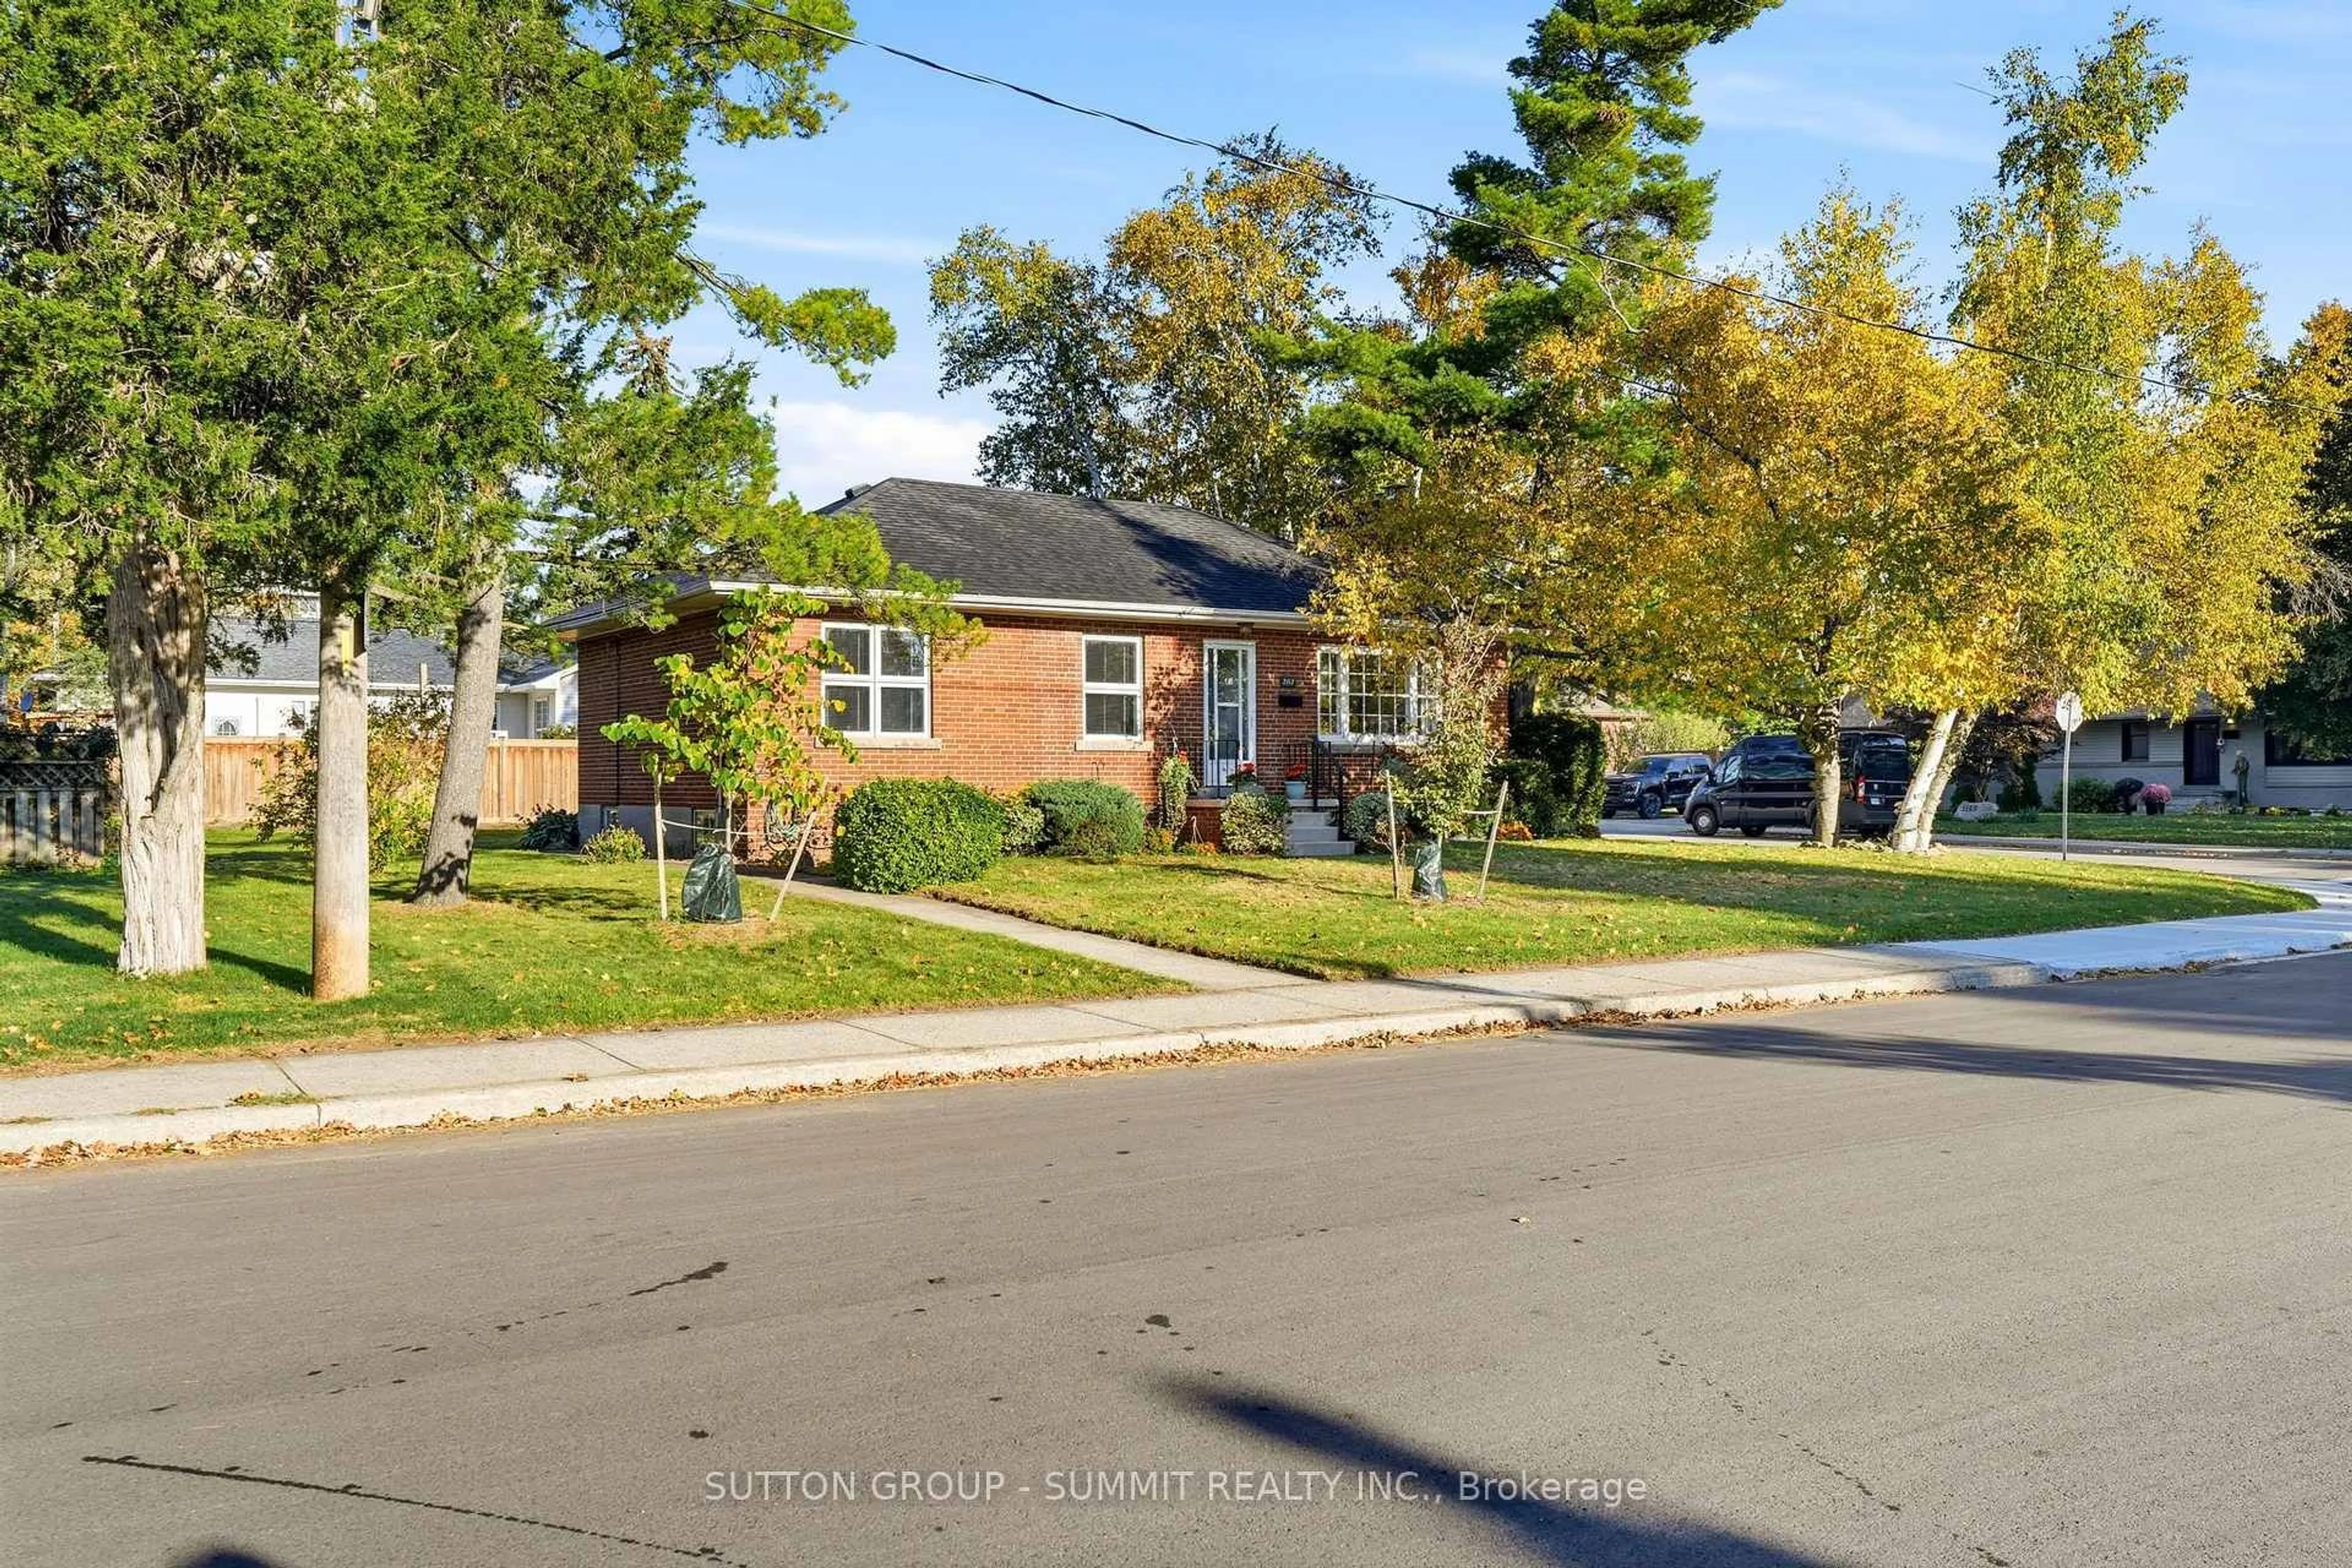
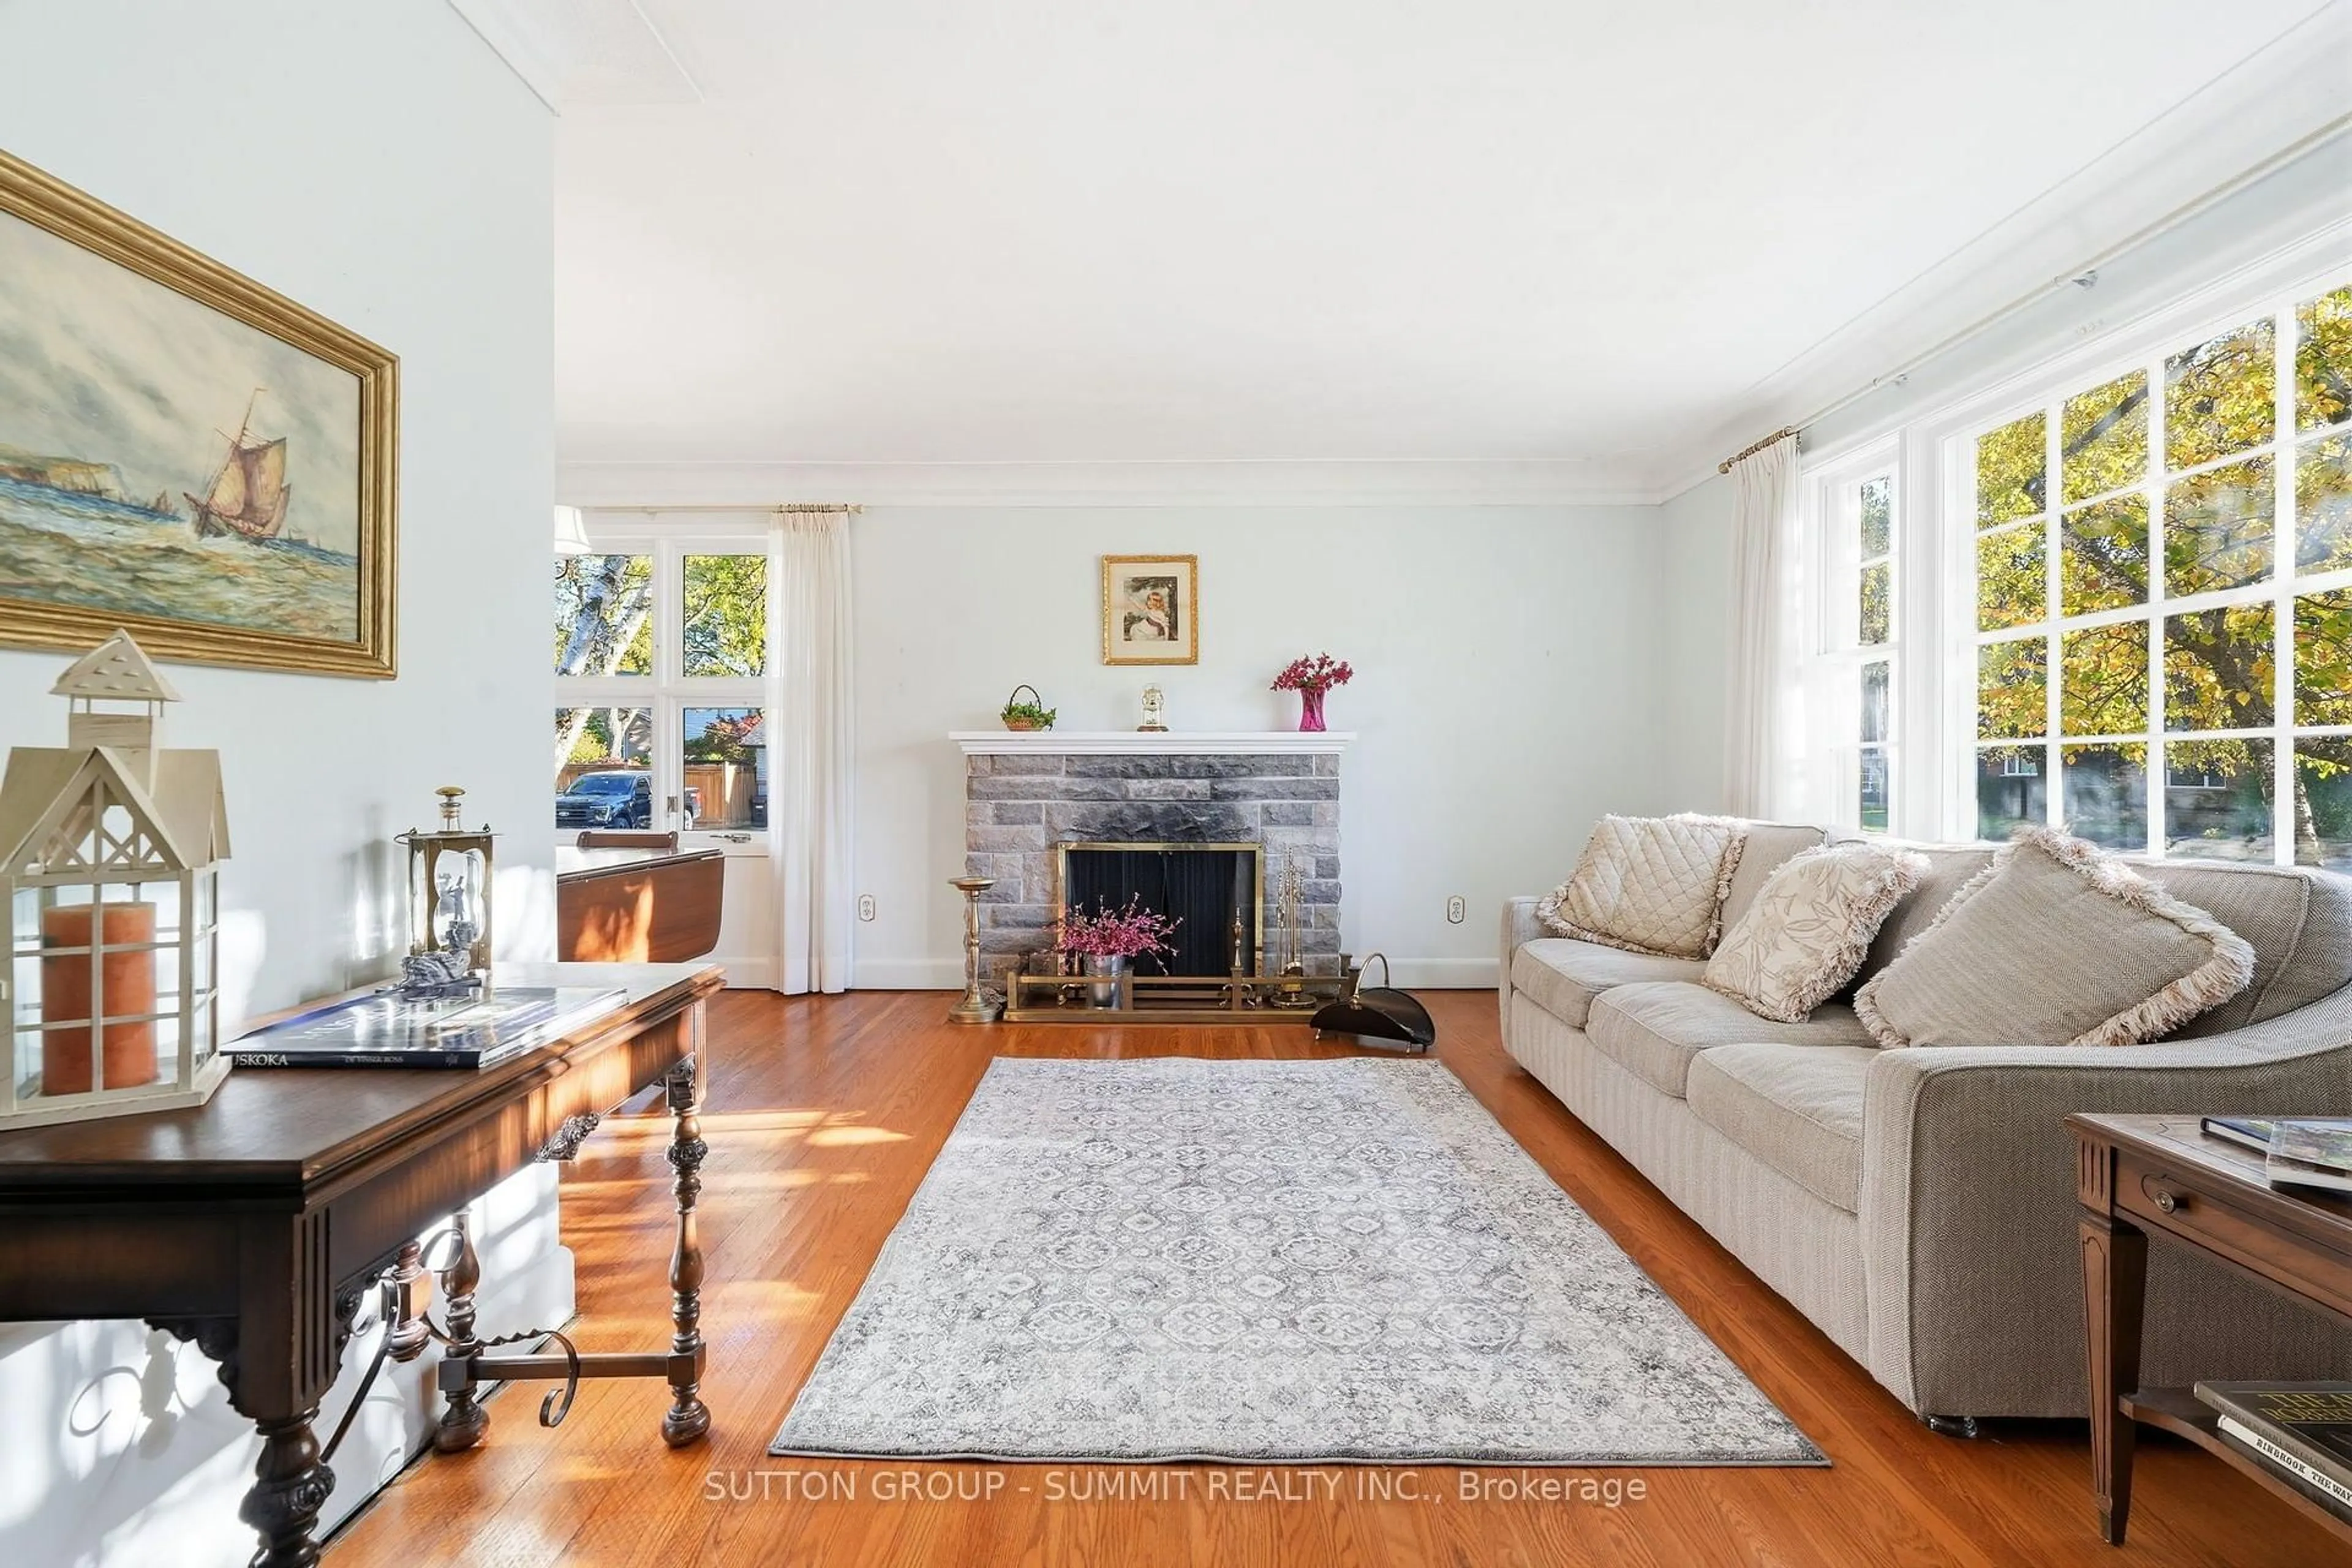
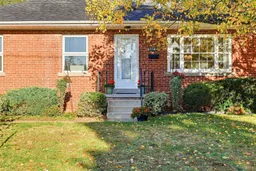
ALL BRICK 3 BEDROOM BUNGALOW LOCATED ON A QUIET TREE LINED STREET IN SOUTH BURLINGTON.WITHIN WALKING DISTANCE OF THE DOWNTOWN AND SCHOOLS. THIS HOME FEATURES A TRADITIONAL FLOOR PLAN WITH DINING ROOM AND LIVING ROOM. FEATURES INCLUDE HARDWOOD FLOORING, STONE FIREPLACE AND LARGE REAR YARD. INCREDIBLE OPPORTUNITY FOR THE BUYER LOOKING TO RENOVATE A SOLID HOME IN A GOOD NEIGHBOURHOOD. THE CORNER LOT PROVIDES FOR A OPPORTUNITY TO REIMAGINE THE EXISTING LAYOUT PRIVATE REAR ENTRANCE TO LOWER LEVEL ALLOWS FOR AN IDEAL IN-LAW SUITE. SHORT WALK TO THE GO STATION.


Property Details

StyleBungalow
ViewDowntown, Trees/Woods
Age of property-
SqFt~700-1100 SqFt
Lot Size7,531 SqFt(100.23 x 75.14)
Parking Spaces2
MLS ®NumberW14106070
Community NameBurlington Waterfront
Data SourceTRREB
Listing bySUTTON GROUP - SUMMIT REALTY INC.

Features

Heating: Forced Air
Cooling: Central Air
Fireplace
Basement: Full, Part Fin

Main Floor

Living

4.5 x 3.42

Dining

2.95 x 2.64

Kitchen

3.76 x 3.38

Primary

3.4 x 3.3


Features

Lot size: 7,531 SqFt

Parking

Garage spaces -

Garage type -

Total parking spaces 2


Property History
Oct 22, 2026
ListedActive
$899,900
20 days on market
history photo preview35
Listing by trreb®
Property listed by SUTTON GROUP - SUMMIT REALTY INC., Brokerage
Agent Banner Image
Interested in this property?Get in touch to get the inside scoop.

Market Data - Burlington Waterfront

Geo Zone Map ThumbnailBurlington Waterfront

Seller's Market

View Market Data

Detached house - for the past 30 days

Buyer's market Seller's market

Avg. Days on Market

Past 30 days

17 days

Compared to

2025

31 days

2024

31 days

2023

33 days

New Listings

Past 30 days

21 listings

Compared to

2025

31 listings

2024

35 listings

2023

26 listings

Units sold

Past 30 days

14 units

Compared to

2025

16 units

2024

19 units

2023

7 units

Median Sold Price

Past 30 days

$1,195,500

Compared to

2025

$1,005,000

2024

$1,295,000

2023

$1,450,000


Population and Demographics

Overview

Total population 22723
Average household income $136,954

Age (%)

0 to 19
15%
20 to 34
17%
35 to 49
17%
50 to 64
23%
65 and plus
28%

Household composition (%)

Single family
55%
Single person
41%
Multi person
3%
Multi family
0%

Mother tongue (%)

English
88%
Others
4%
Spanish
2%
French
2%
Arabic
1%
Polish
1%

House tenancy (%)

Renters
50%
Owners
50%

What’s nearby?Essentials within 5 km

Local Logic

Transportation Scores

Estimated Budget