Applewood Park Housing Market Report
All types - for the month of June
4
23
Total Active Listings*
12 active
New
9(-10.00% YoY)
Relisted
-(- YoY)
Compared to number of active, same period, in 2025: 16, in 2024: 4, in 2023: 5
Total Sold Listings*
3 sold
Median Sold Price
$540,000
Avg Days on Market
23 days
Median Bidding
-$15,000
Compared to number of sold, same period, in 2025: 2, in 2024: 8, in 2023: 13
*Data is for the month of June
Median Sold Price vs Average Days and Average Total Days on Market - Applewood Park - All types
Sold vs Active vs New vs Relisted - Applewood Park - All types
Sold Price Distribution - Applewood Park - All types
Sold price distribution per the last 3 months's sold listings.
Property Type Distribution - Applewood Park - All types
Property type distribution based on data from the last 3 months.
Median Price - Applewood Park - All types
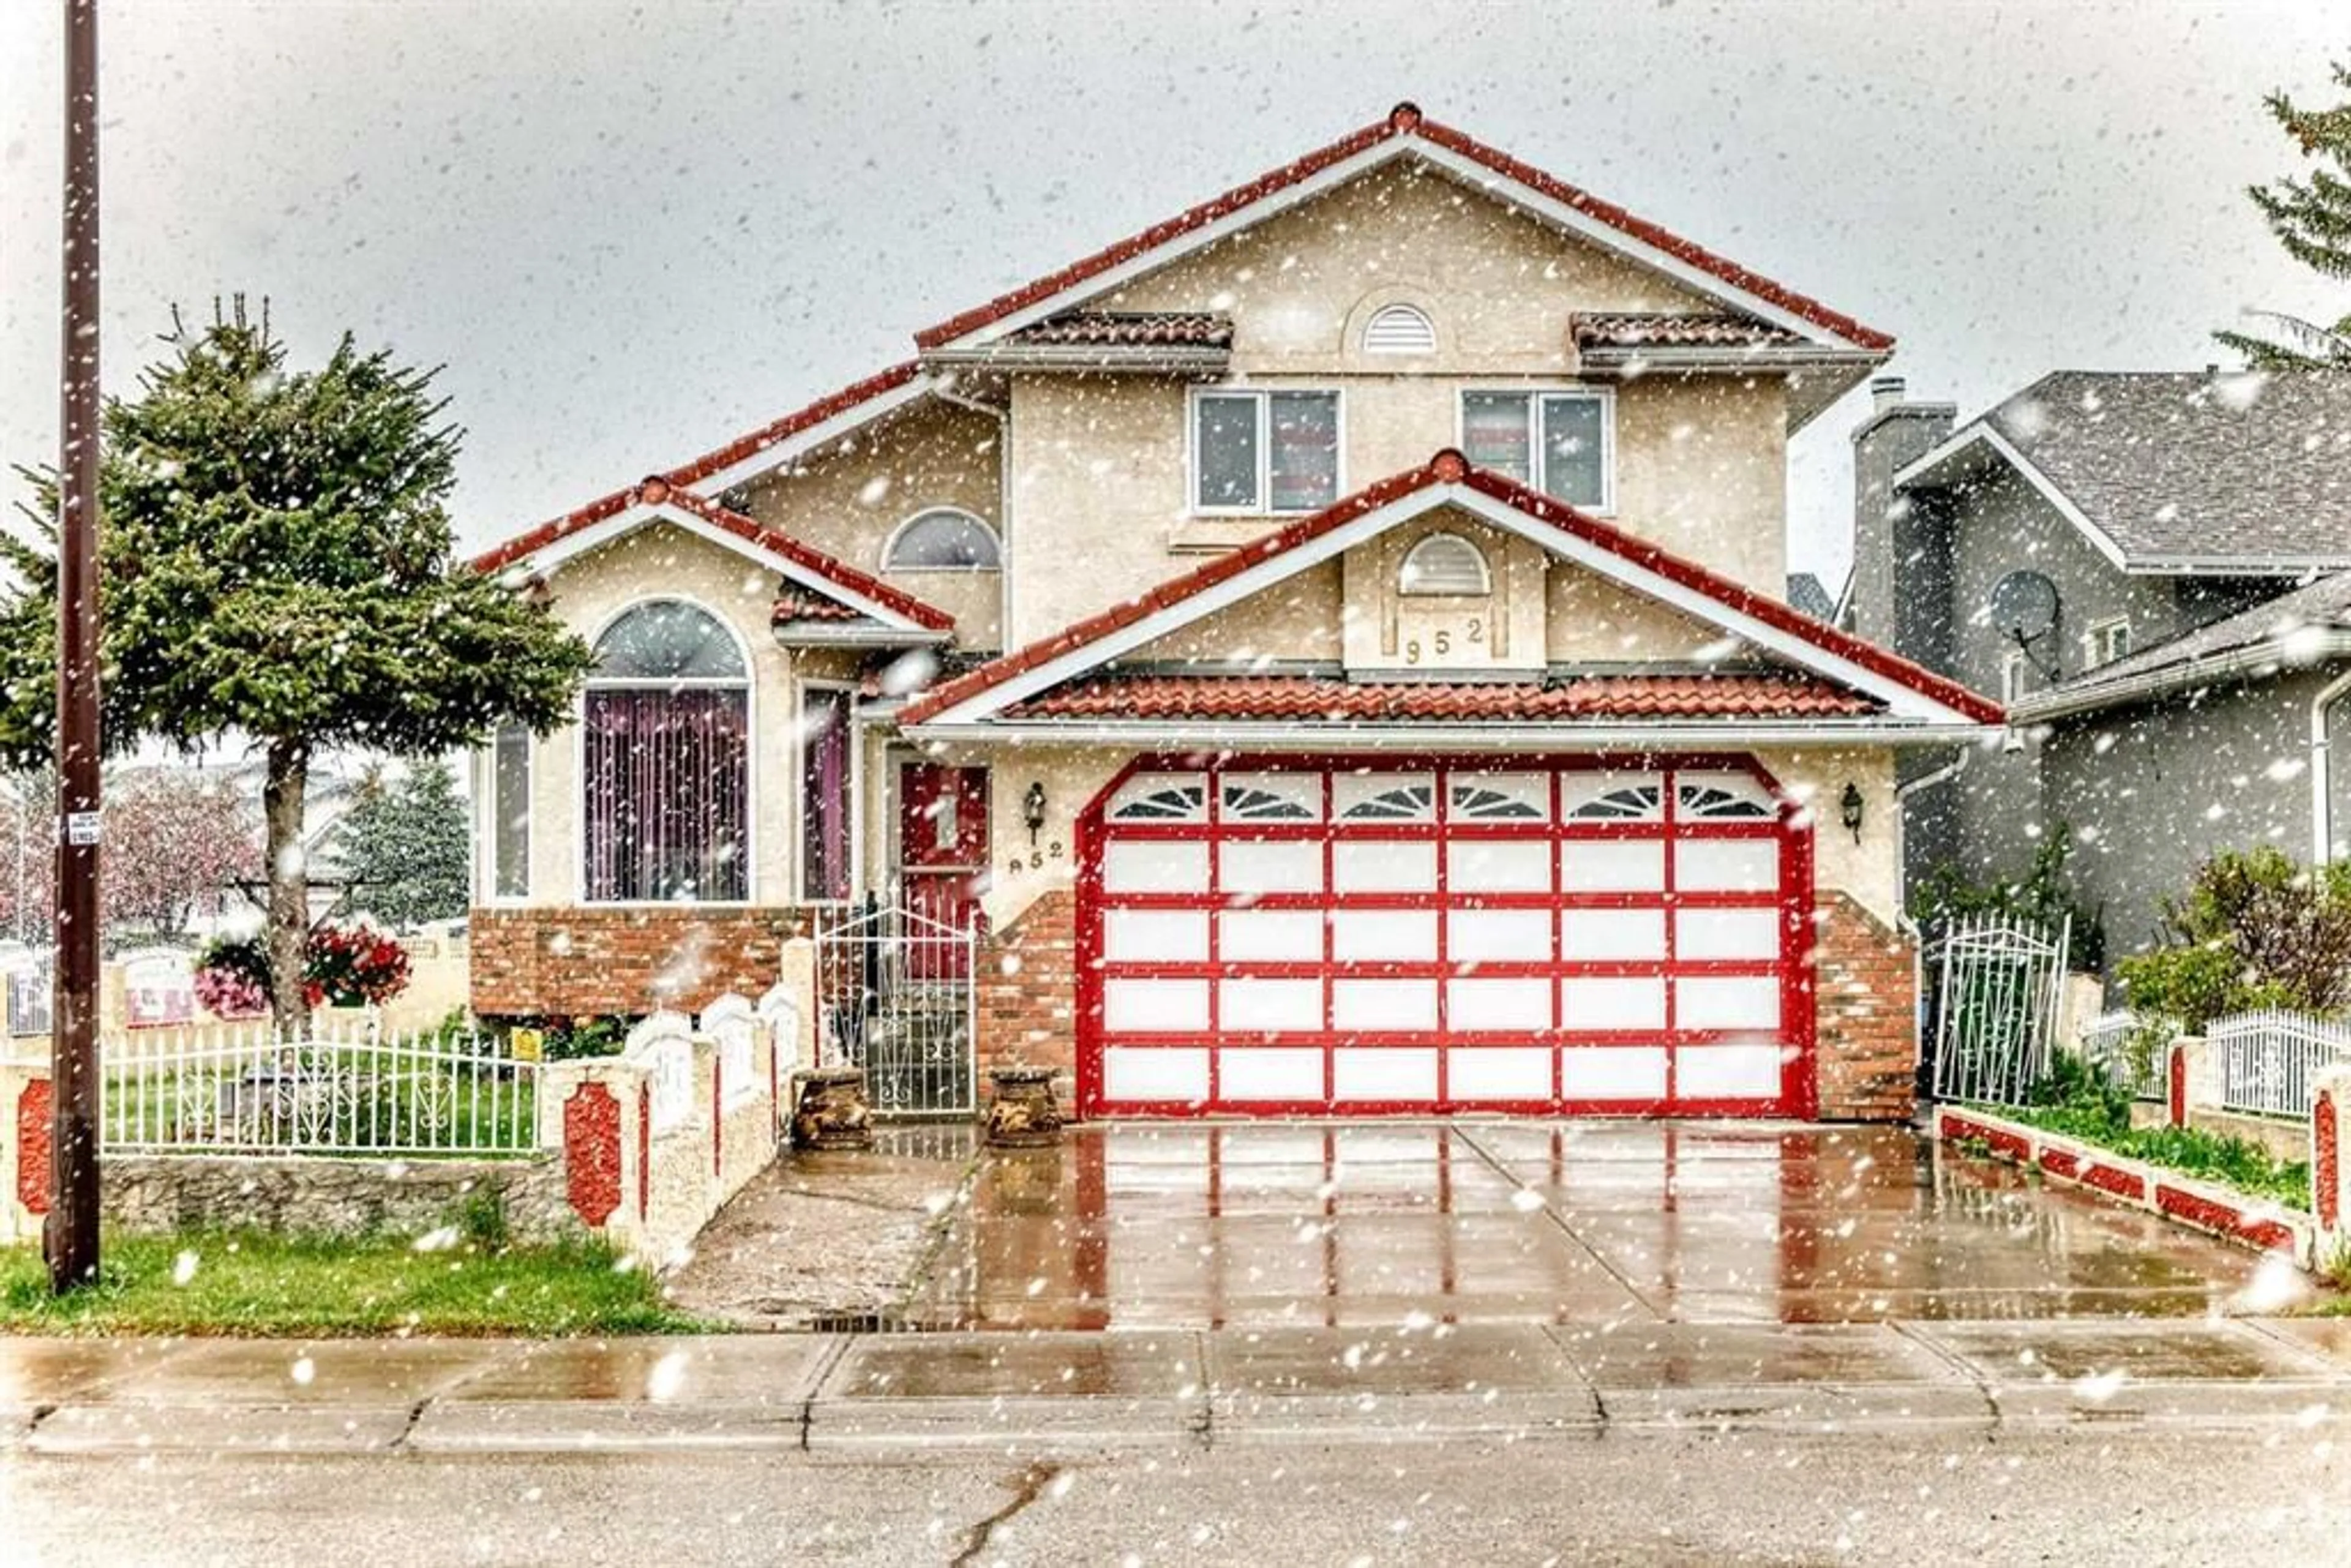
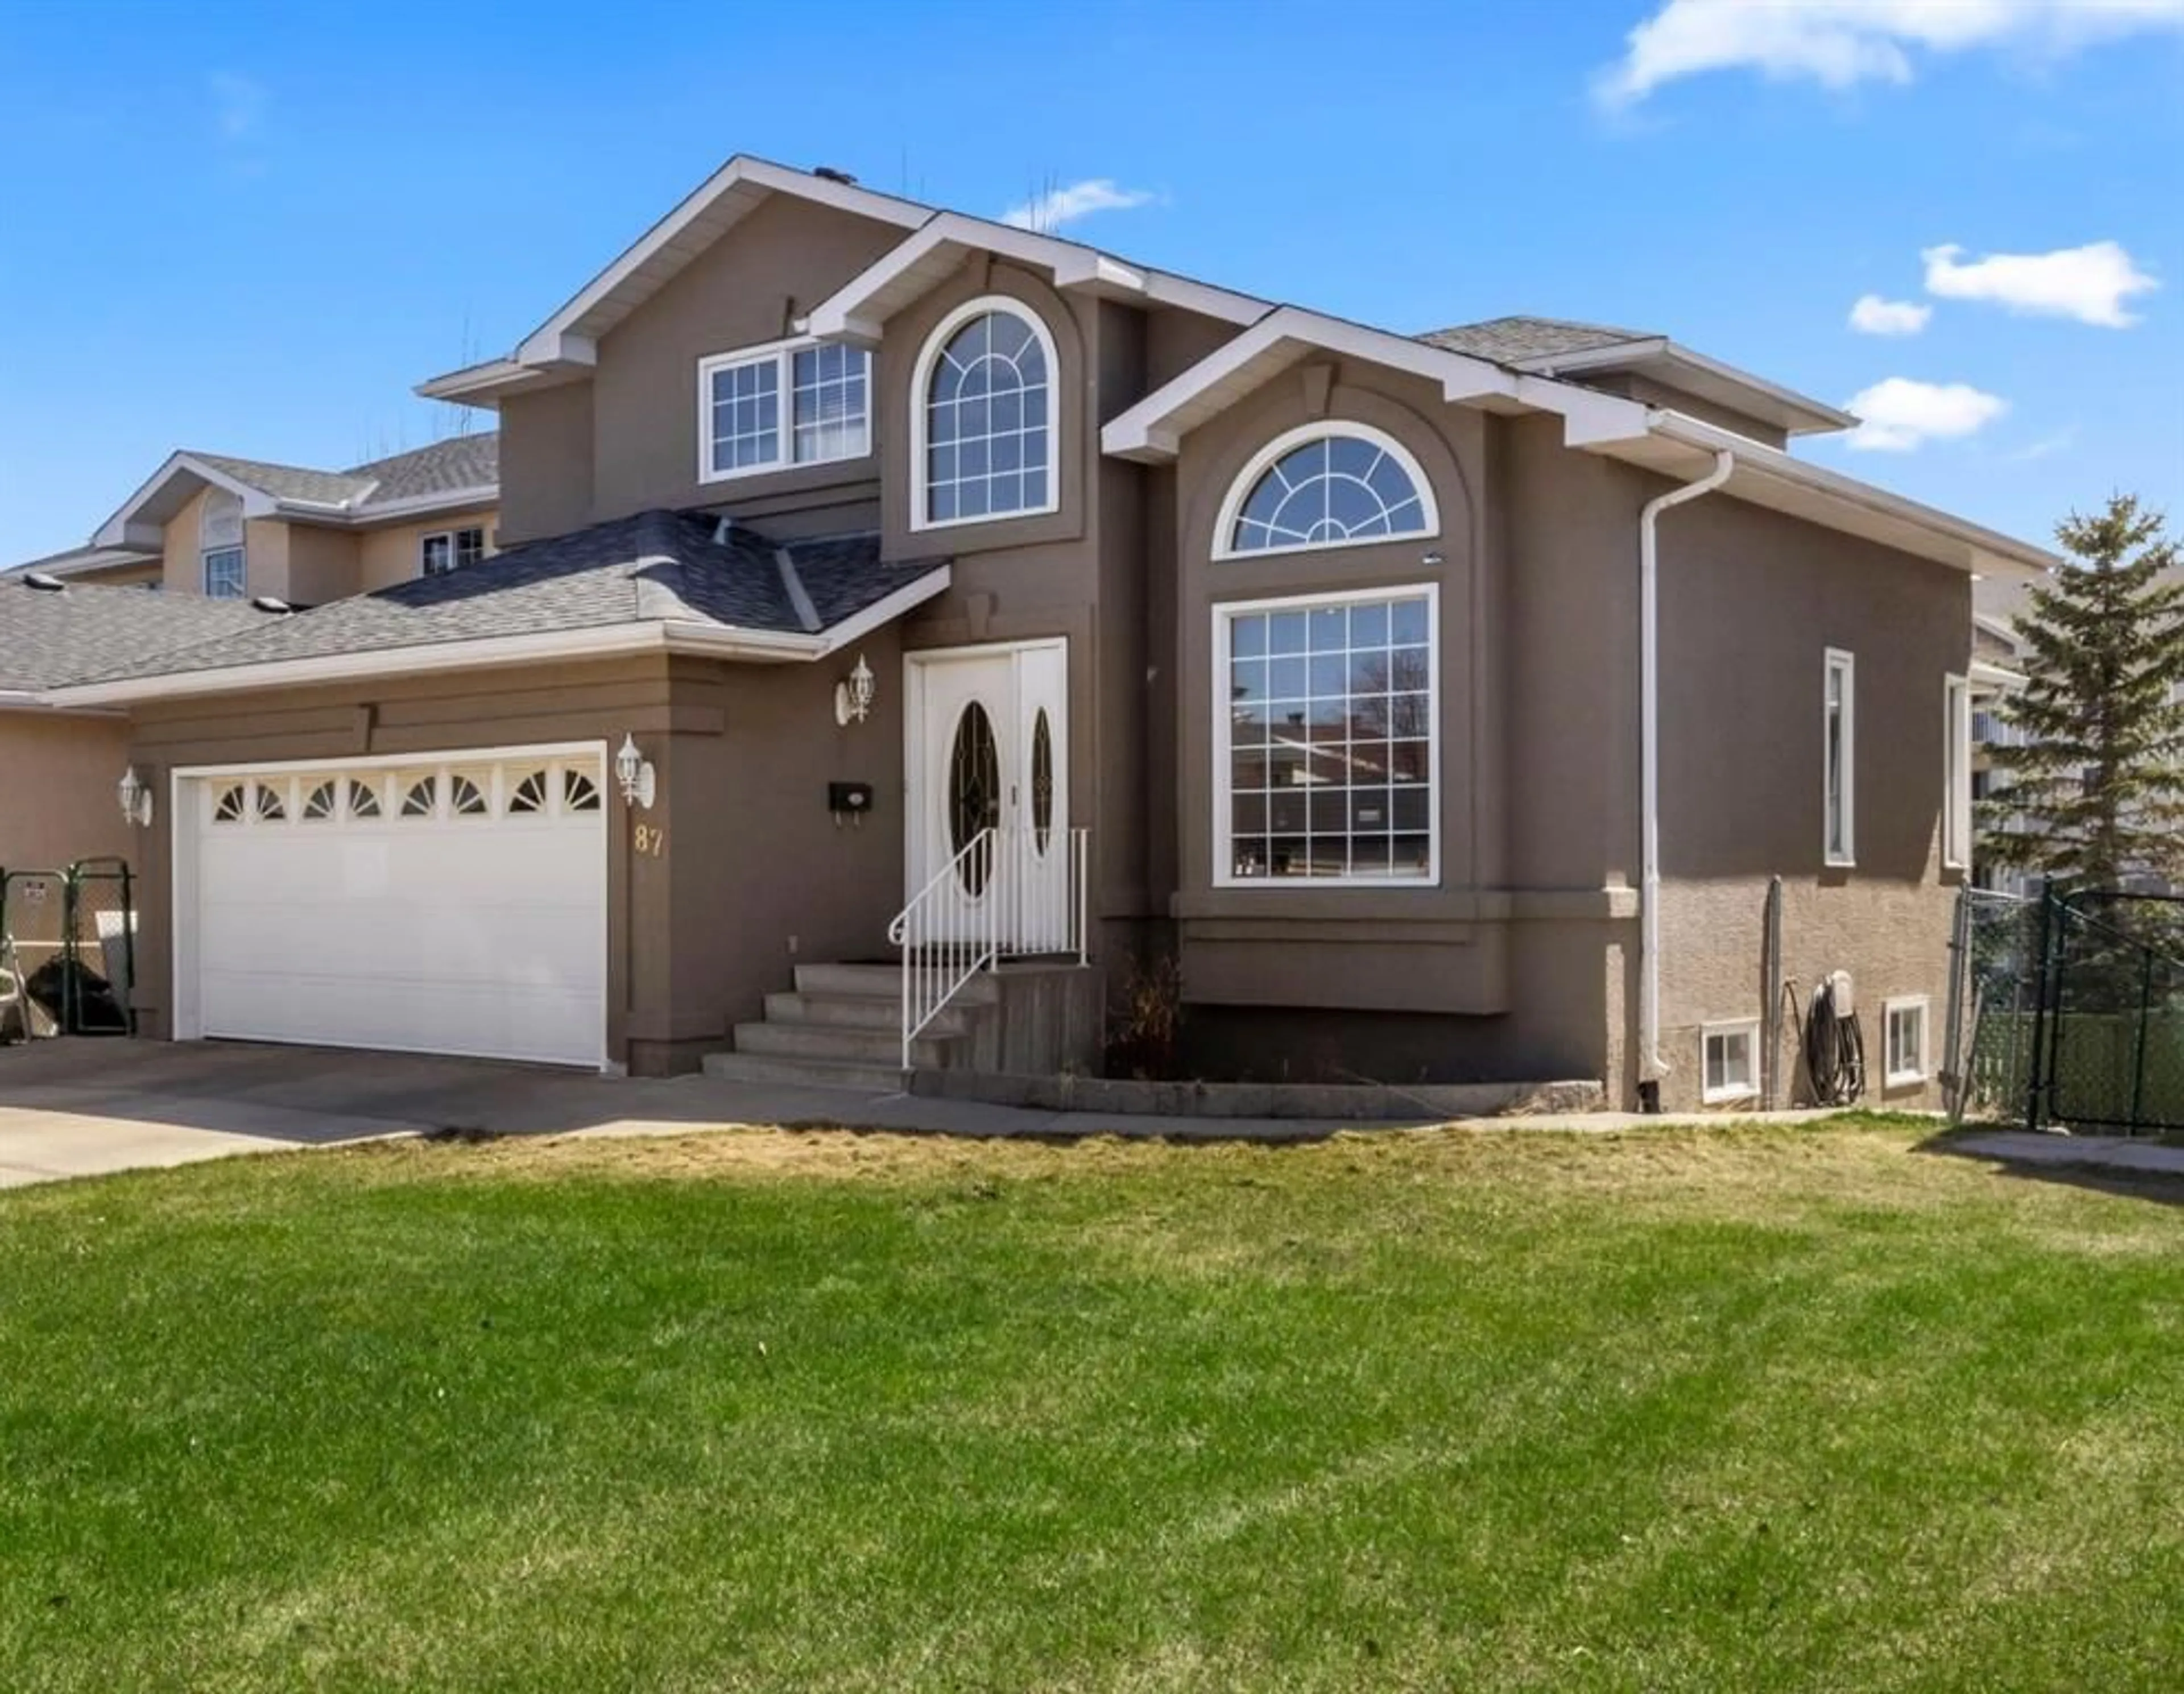
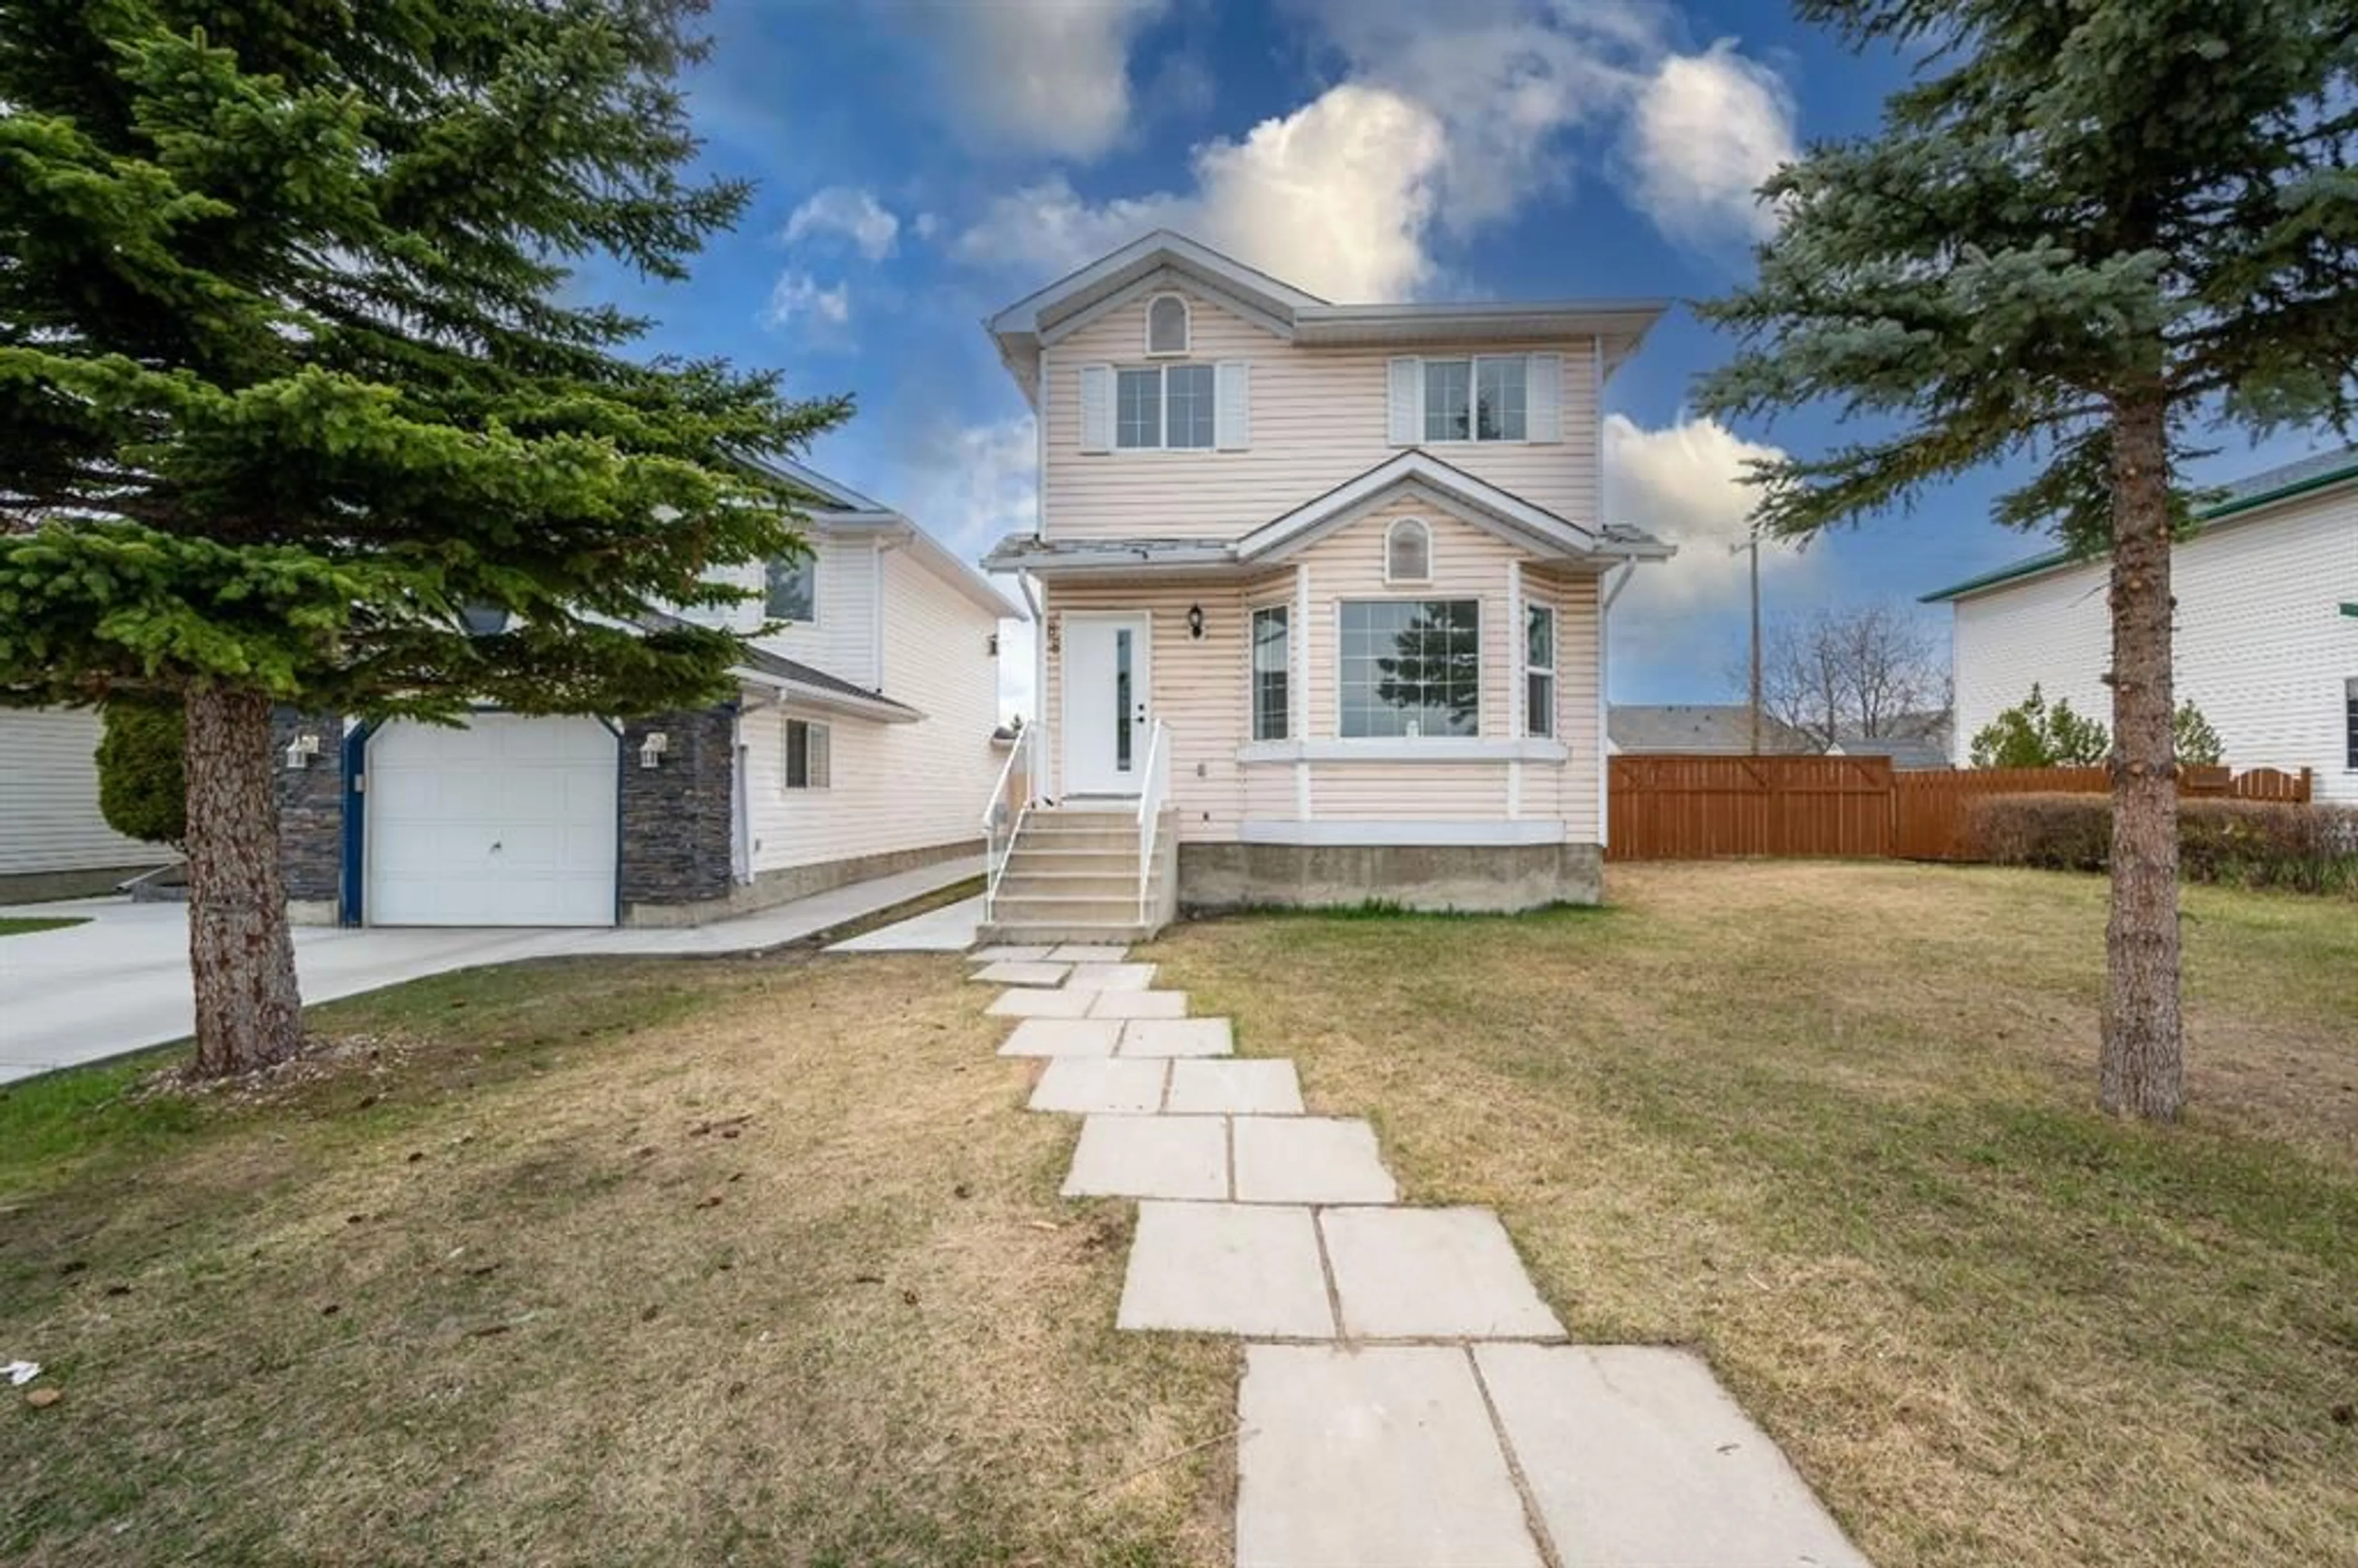
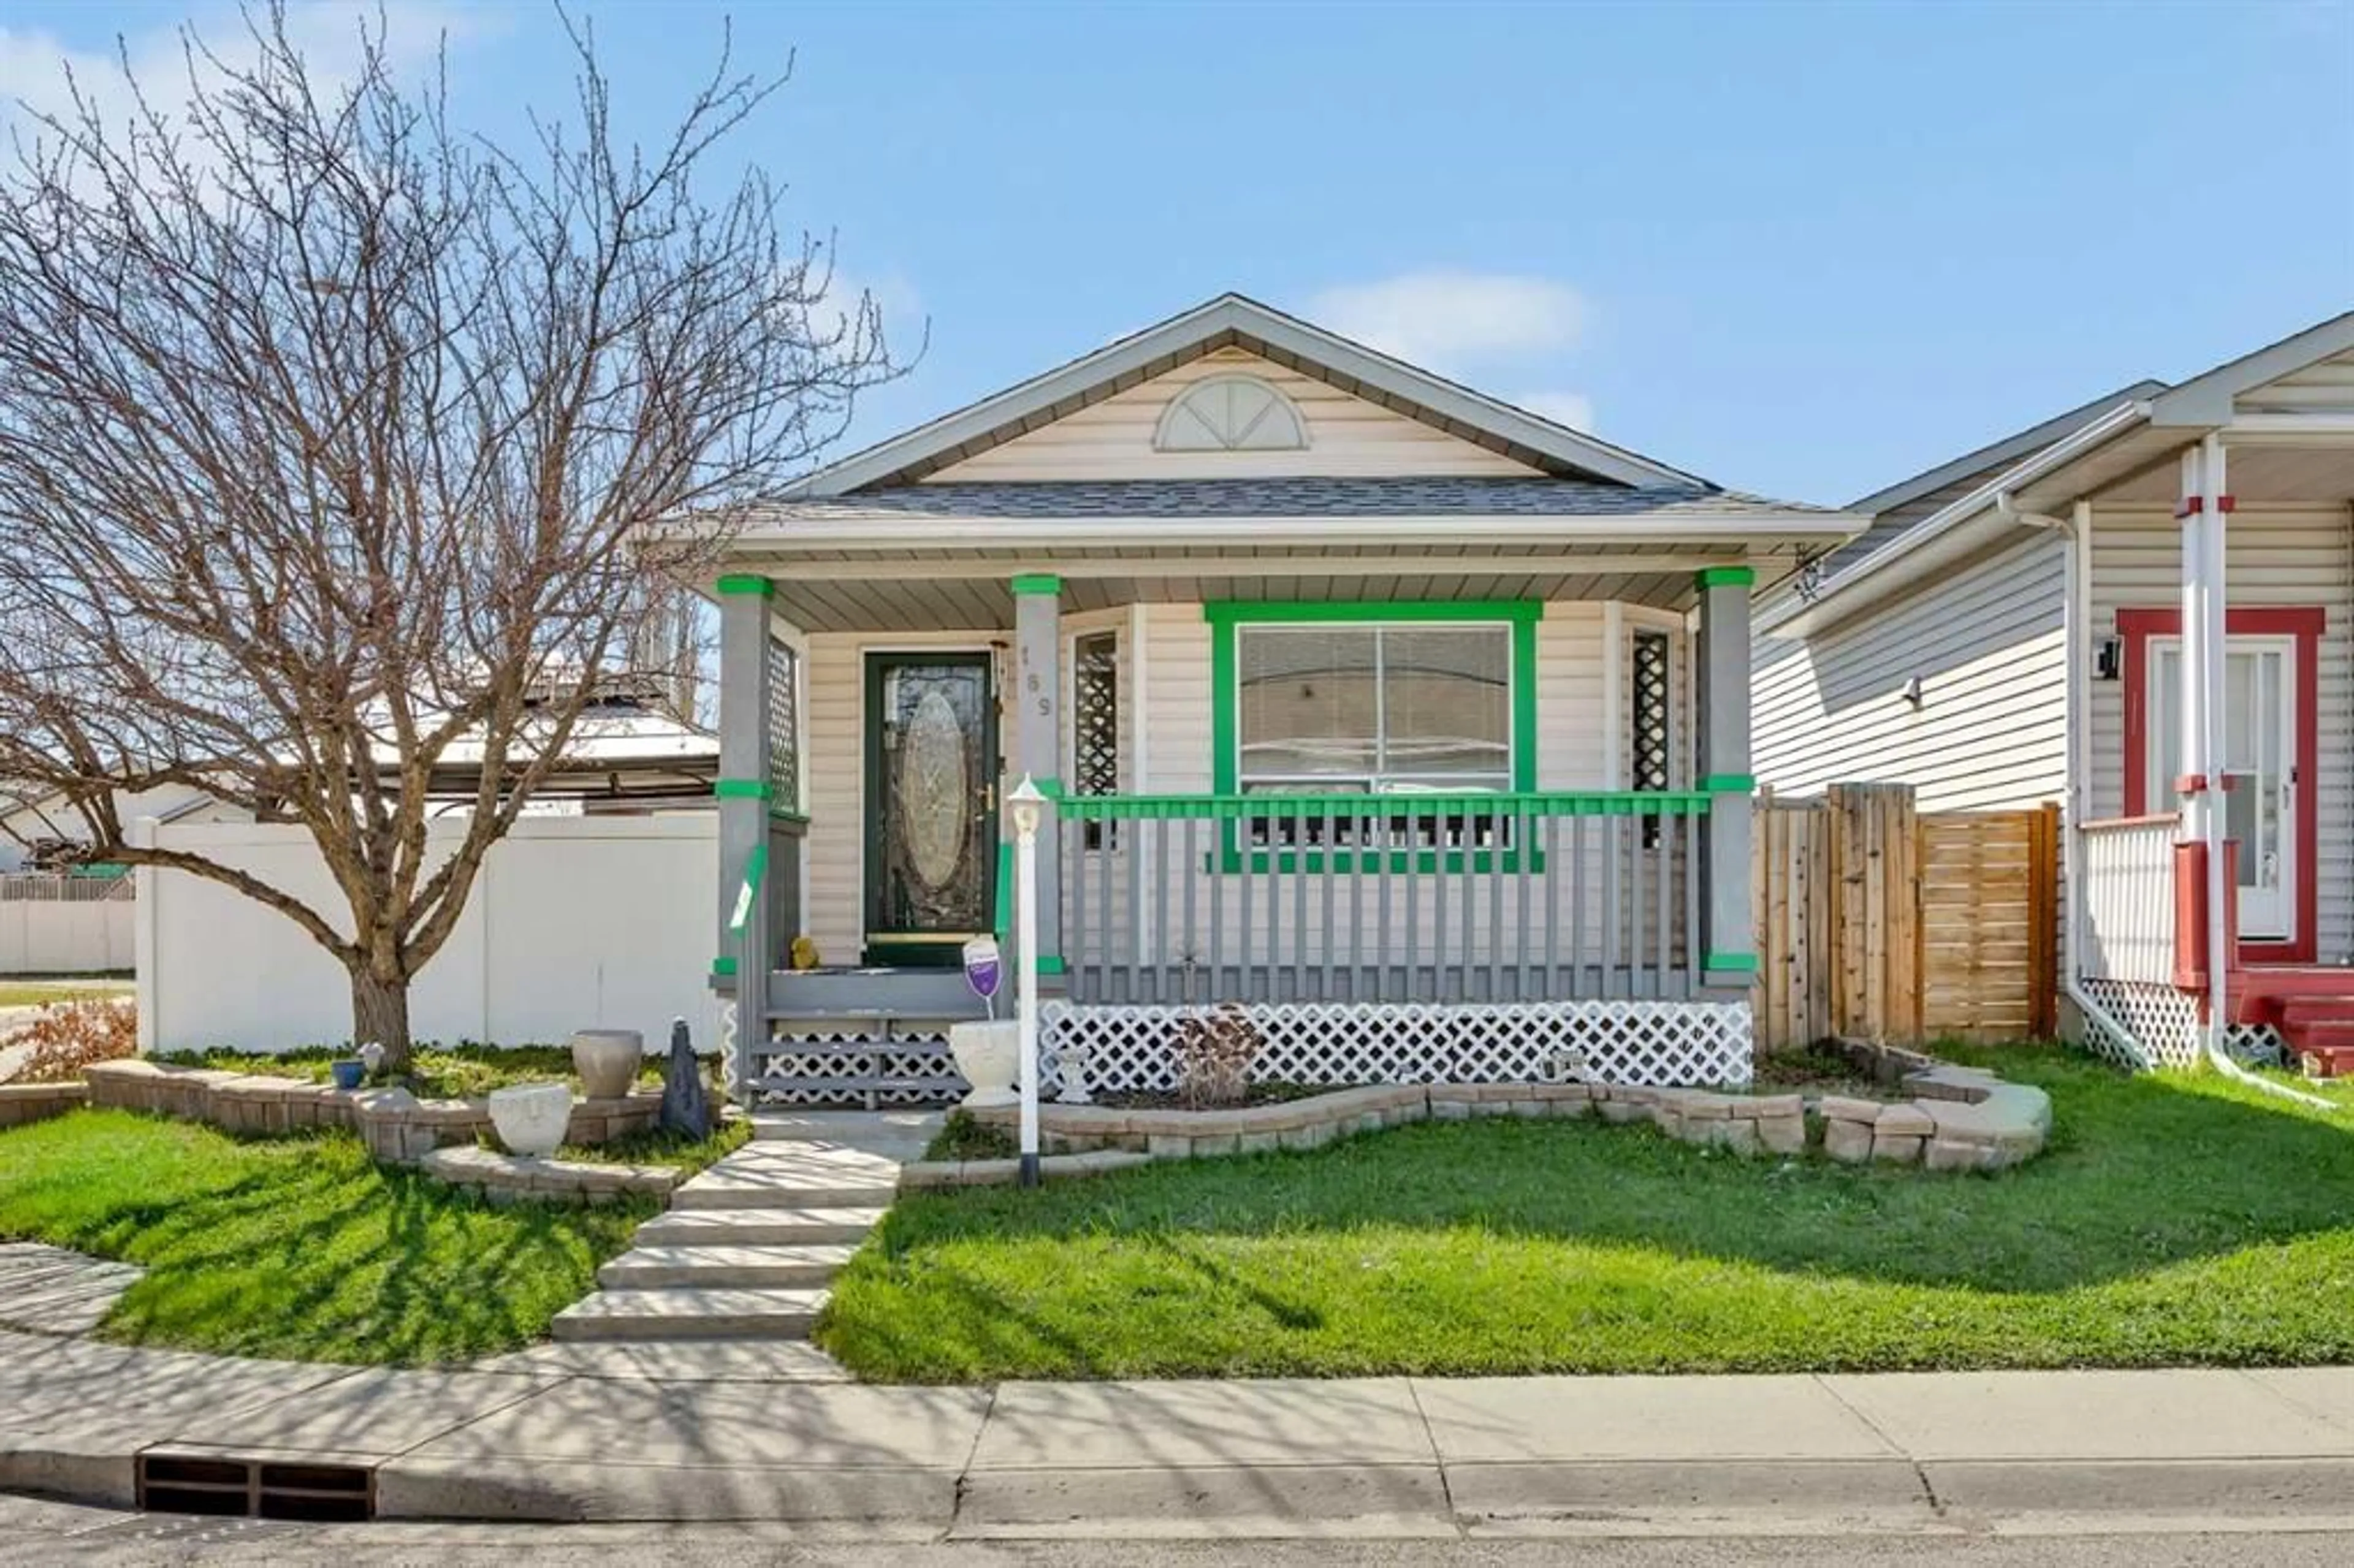
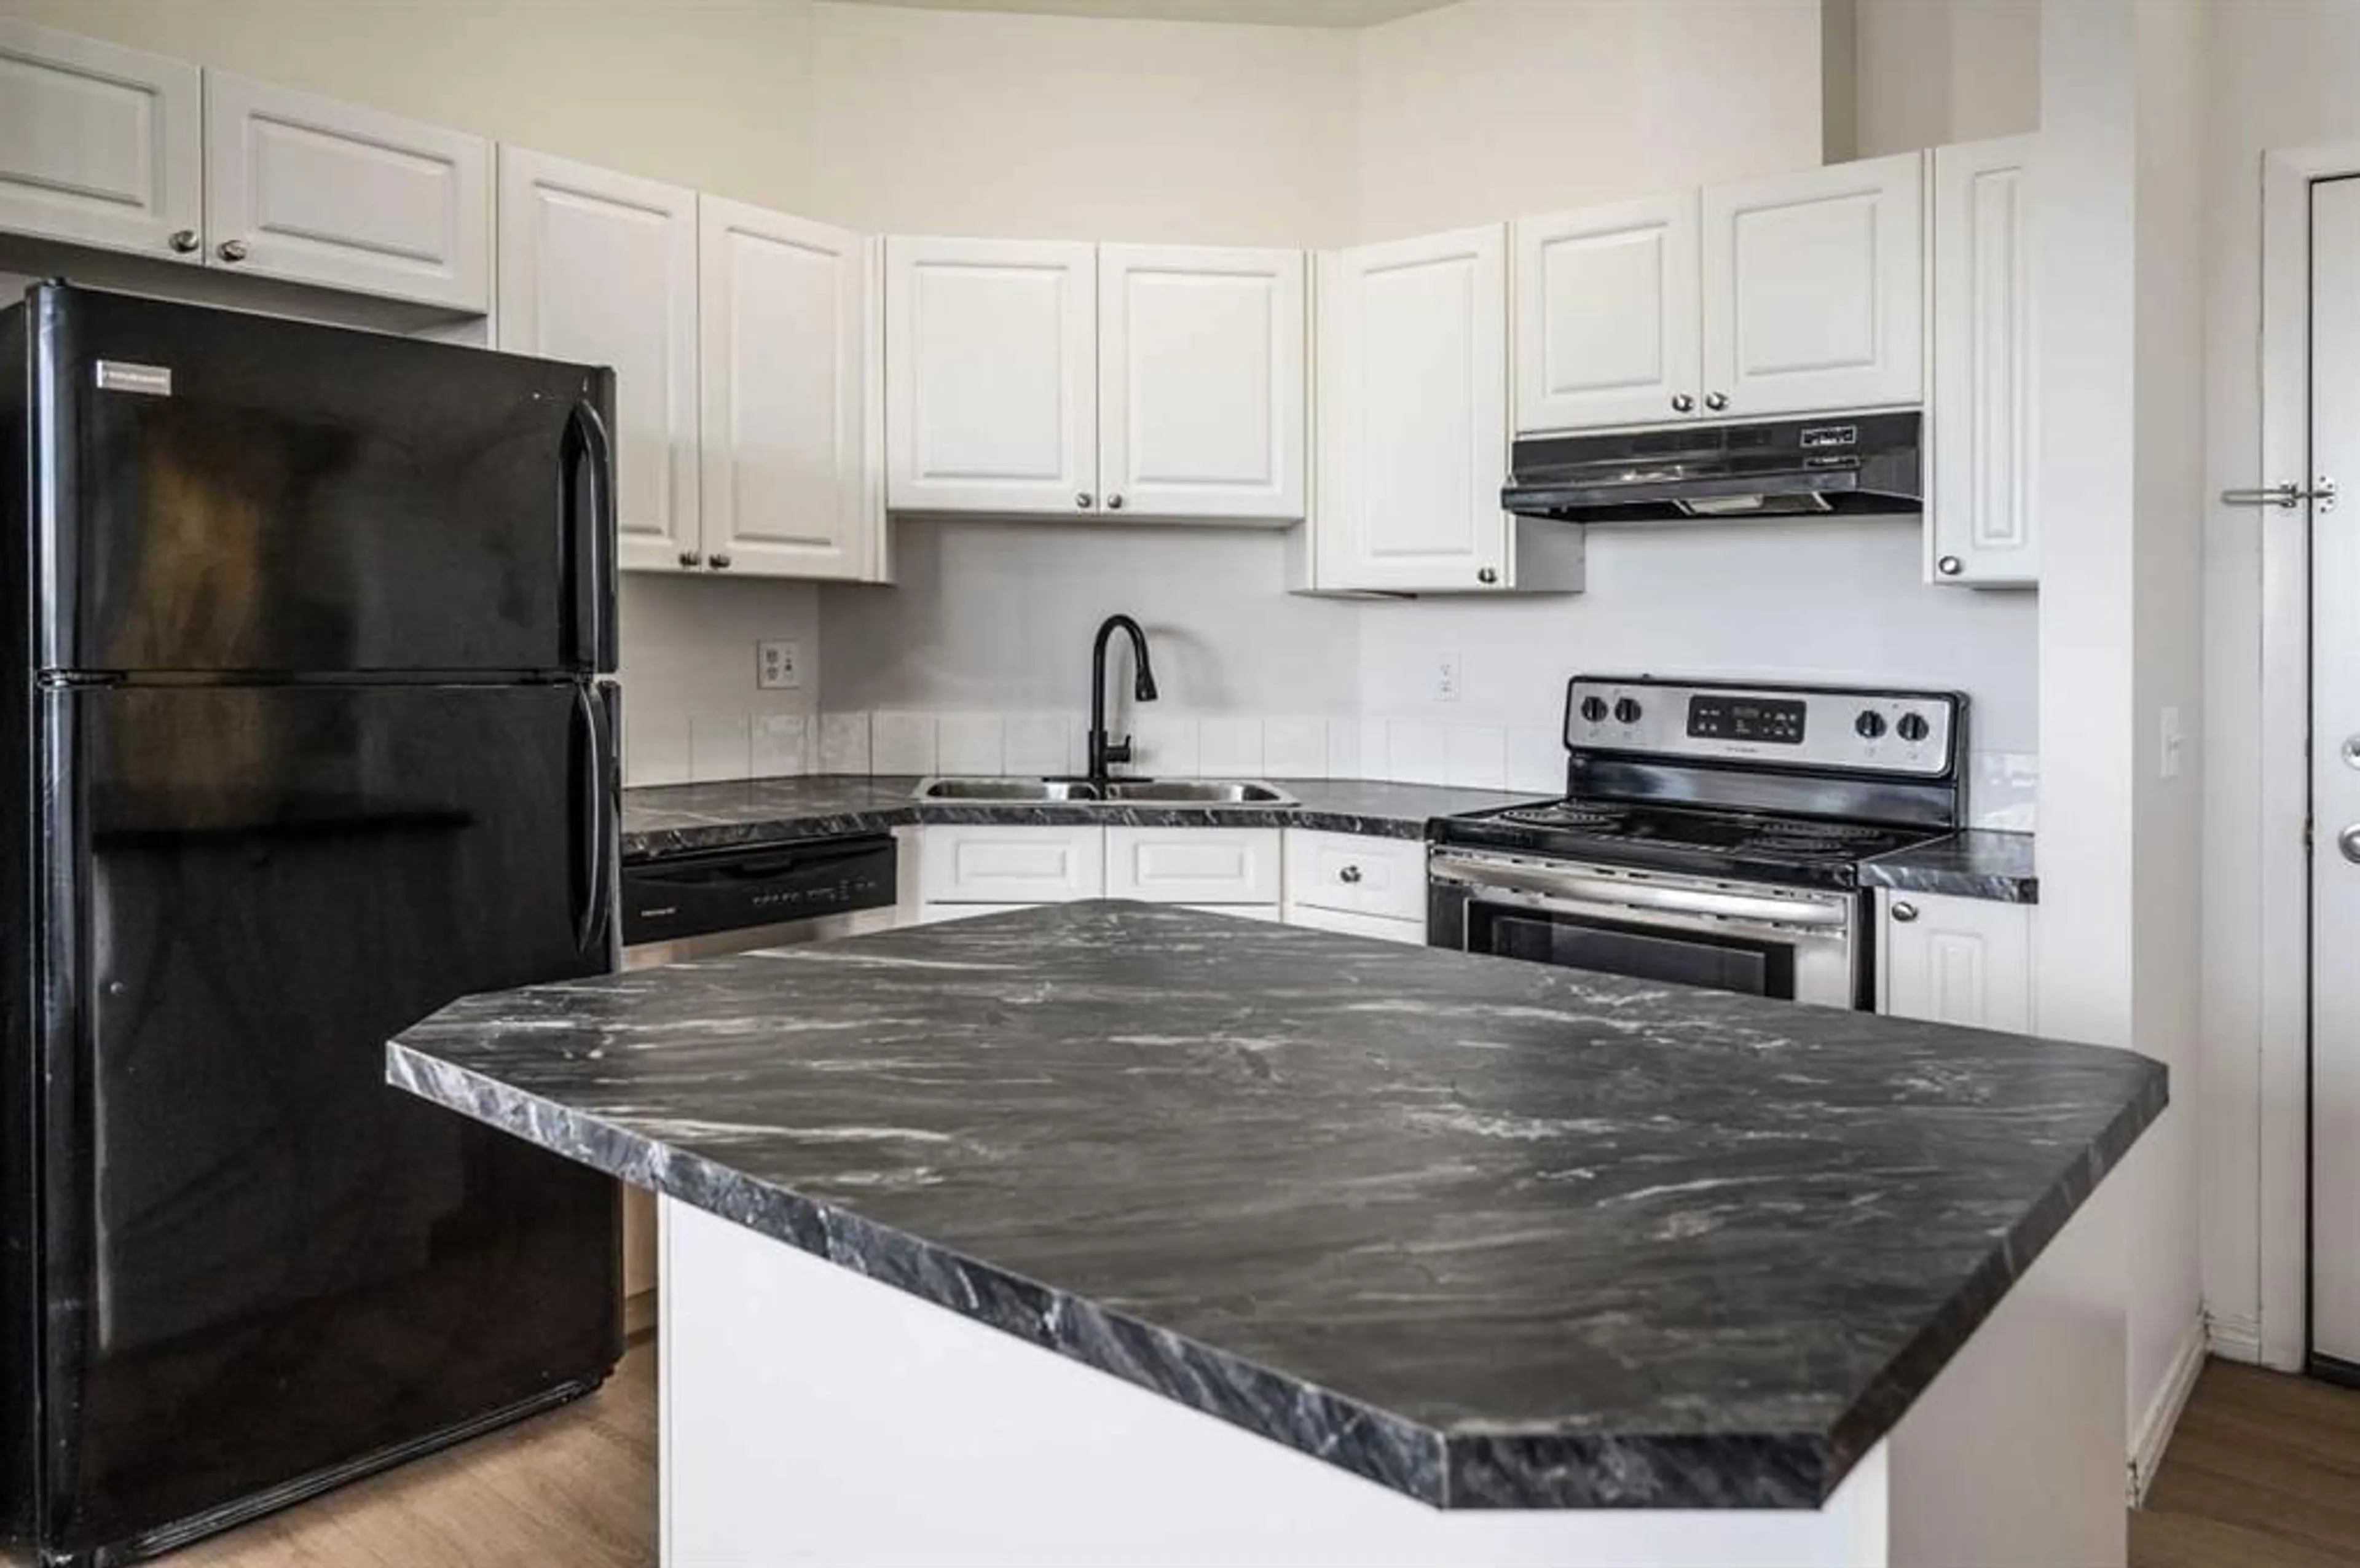
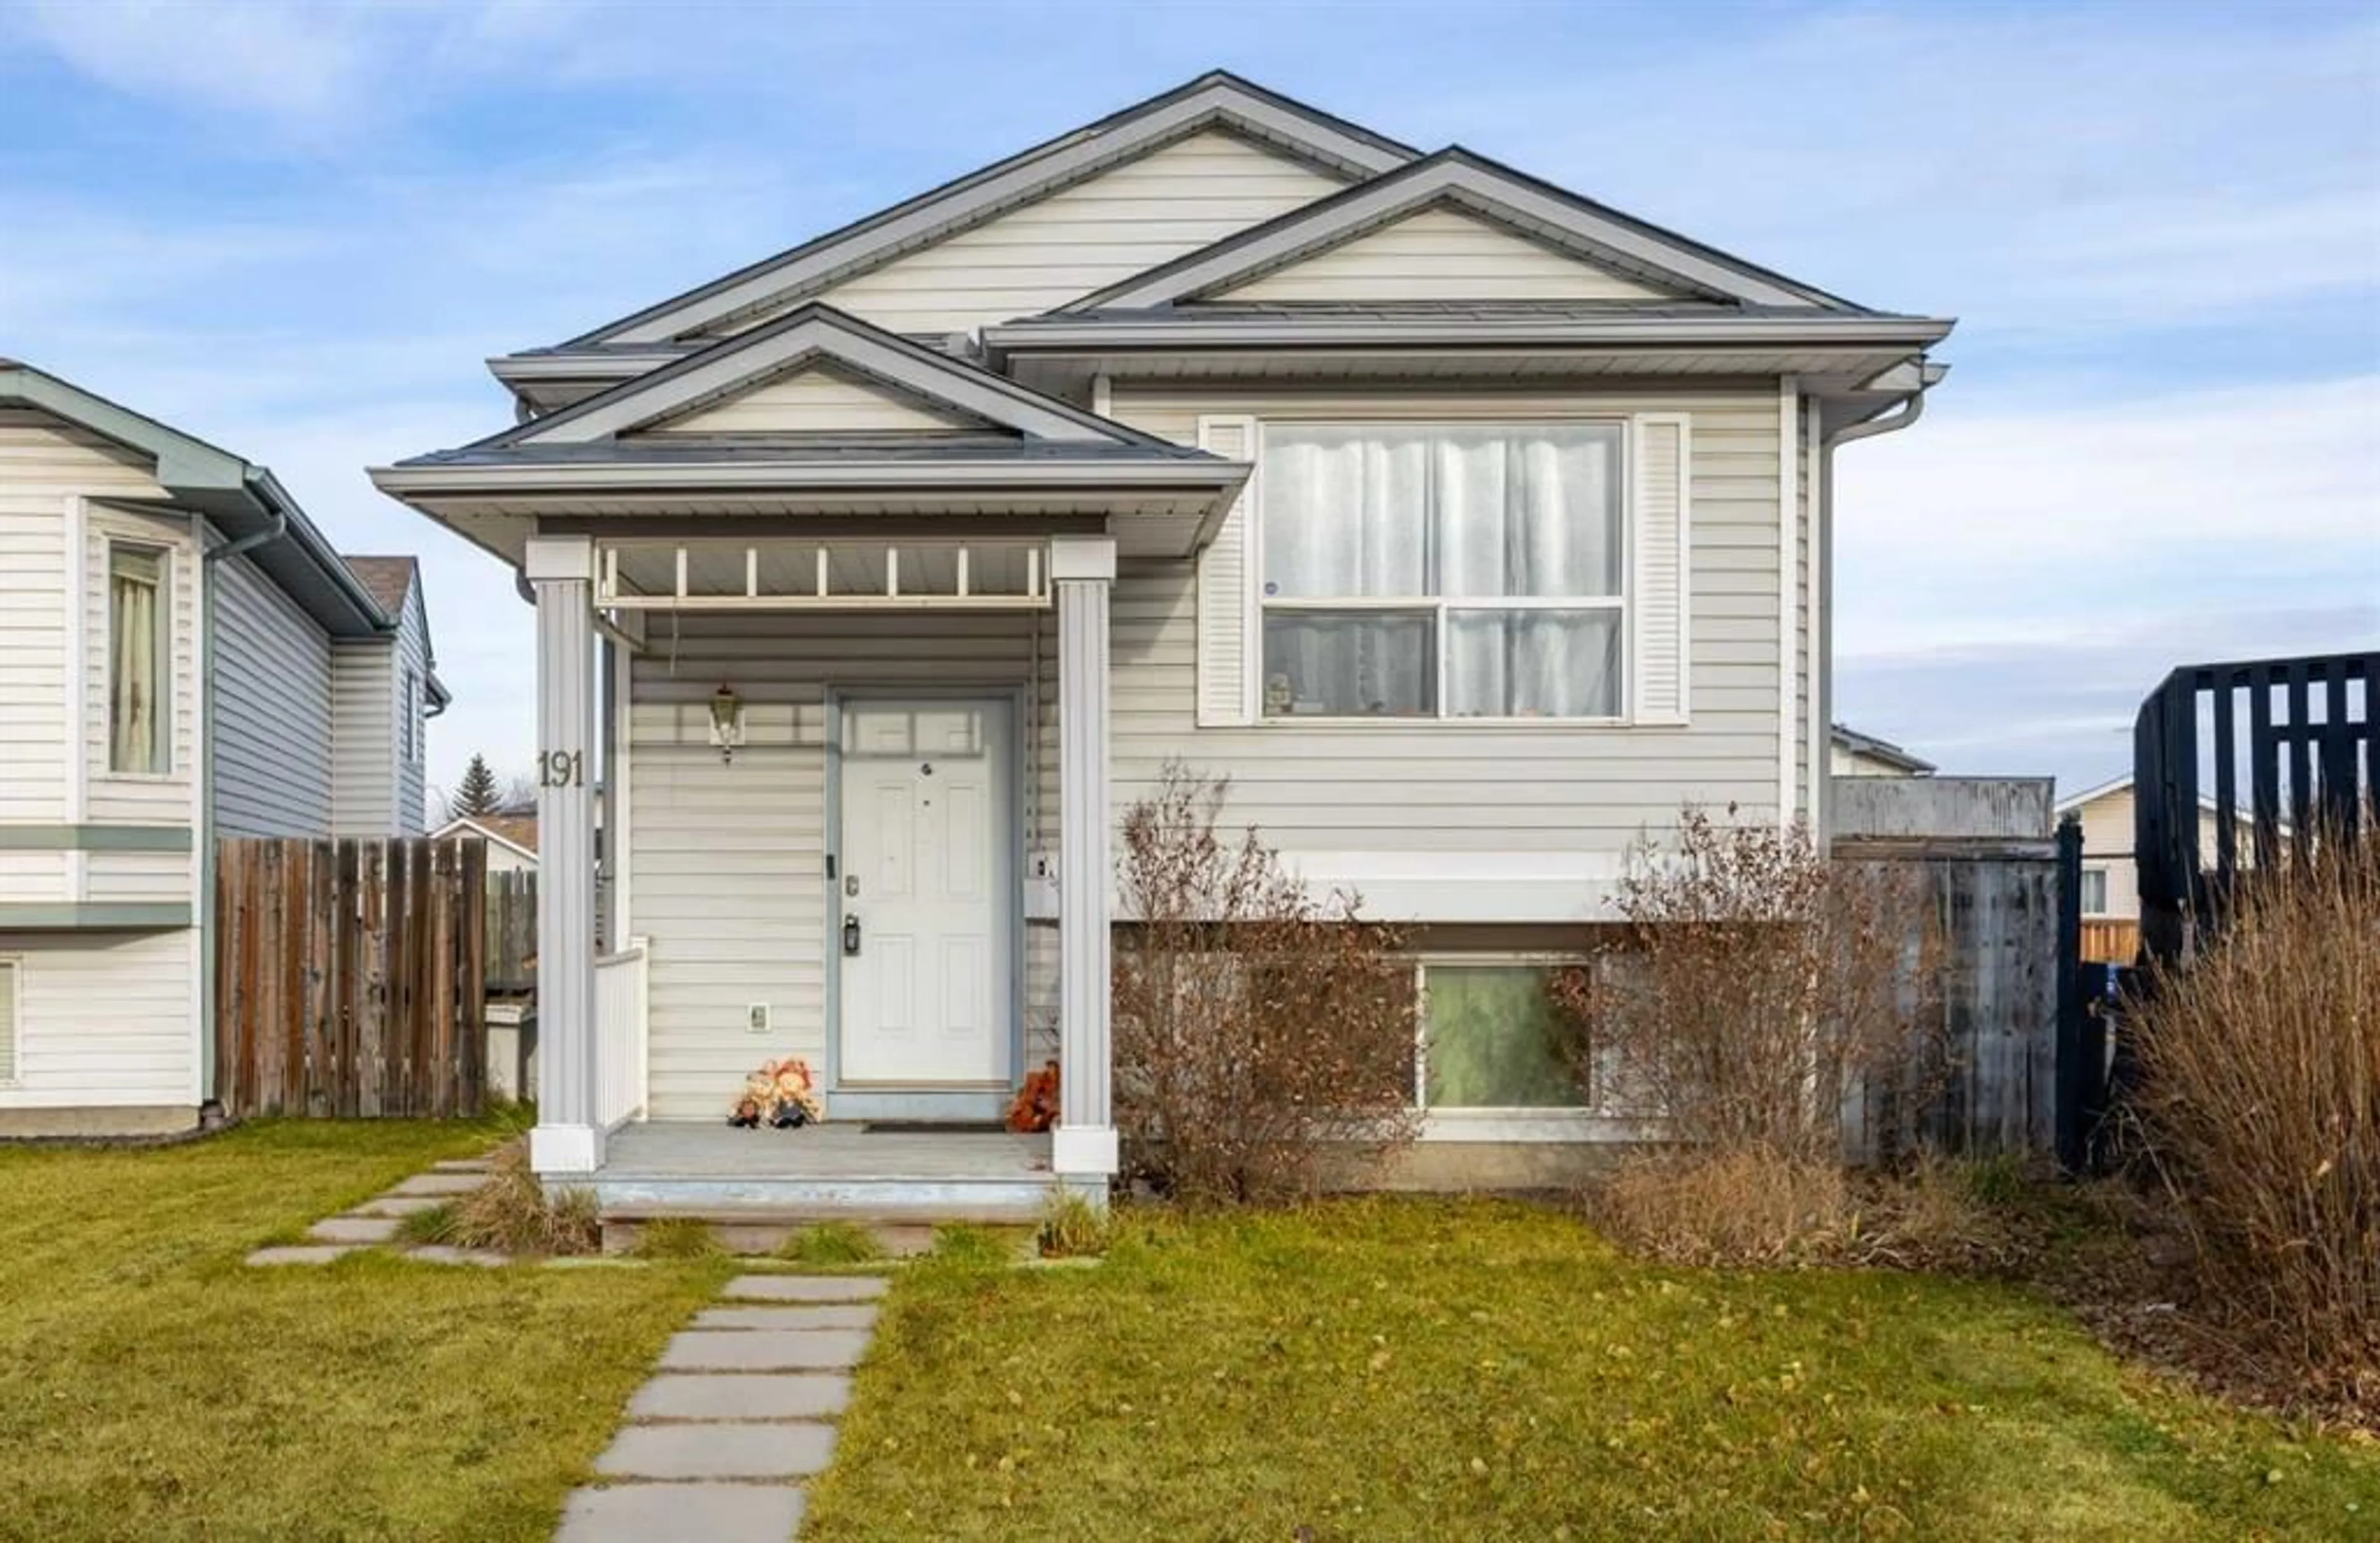
Just listed - Applewood Park
View all

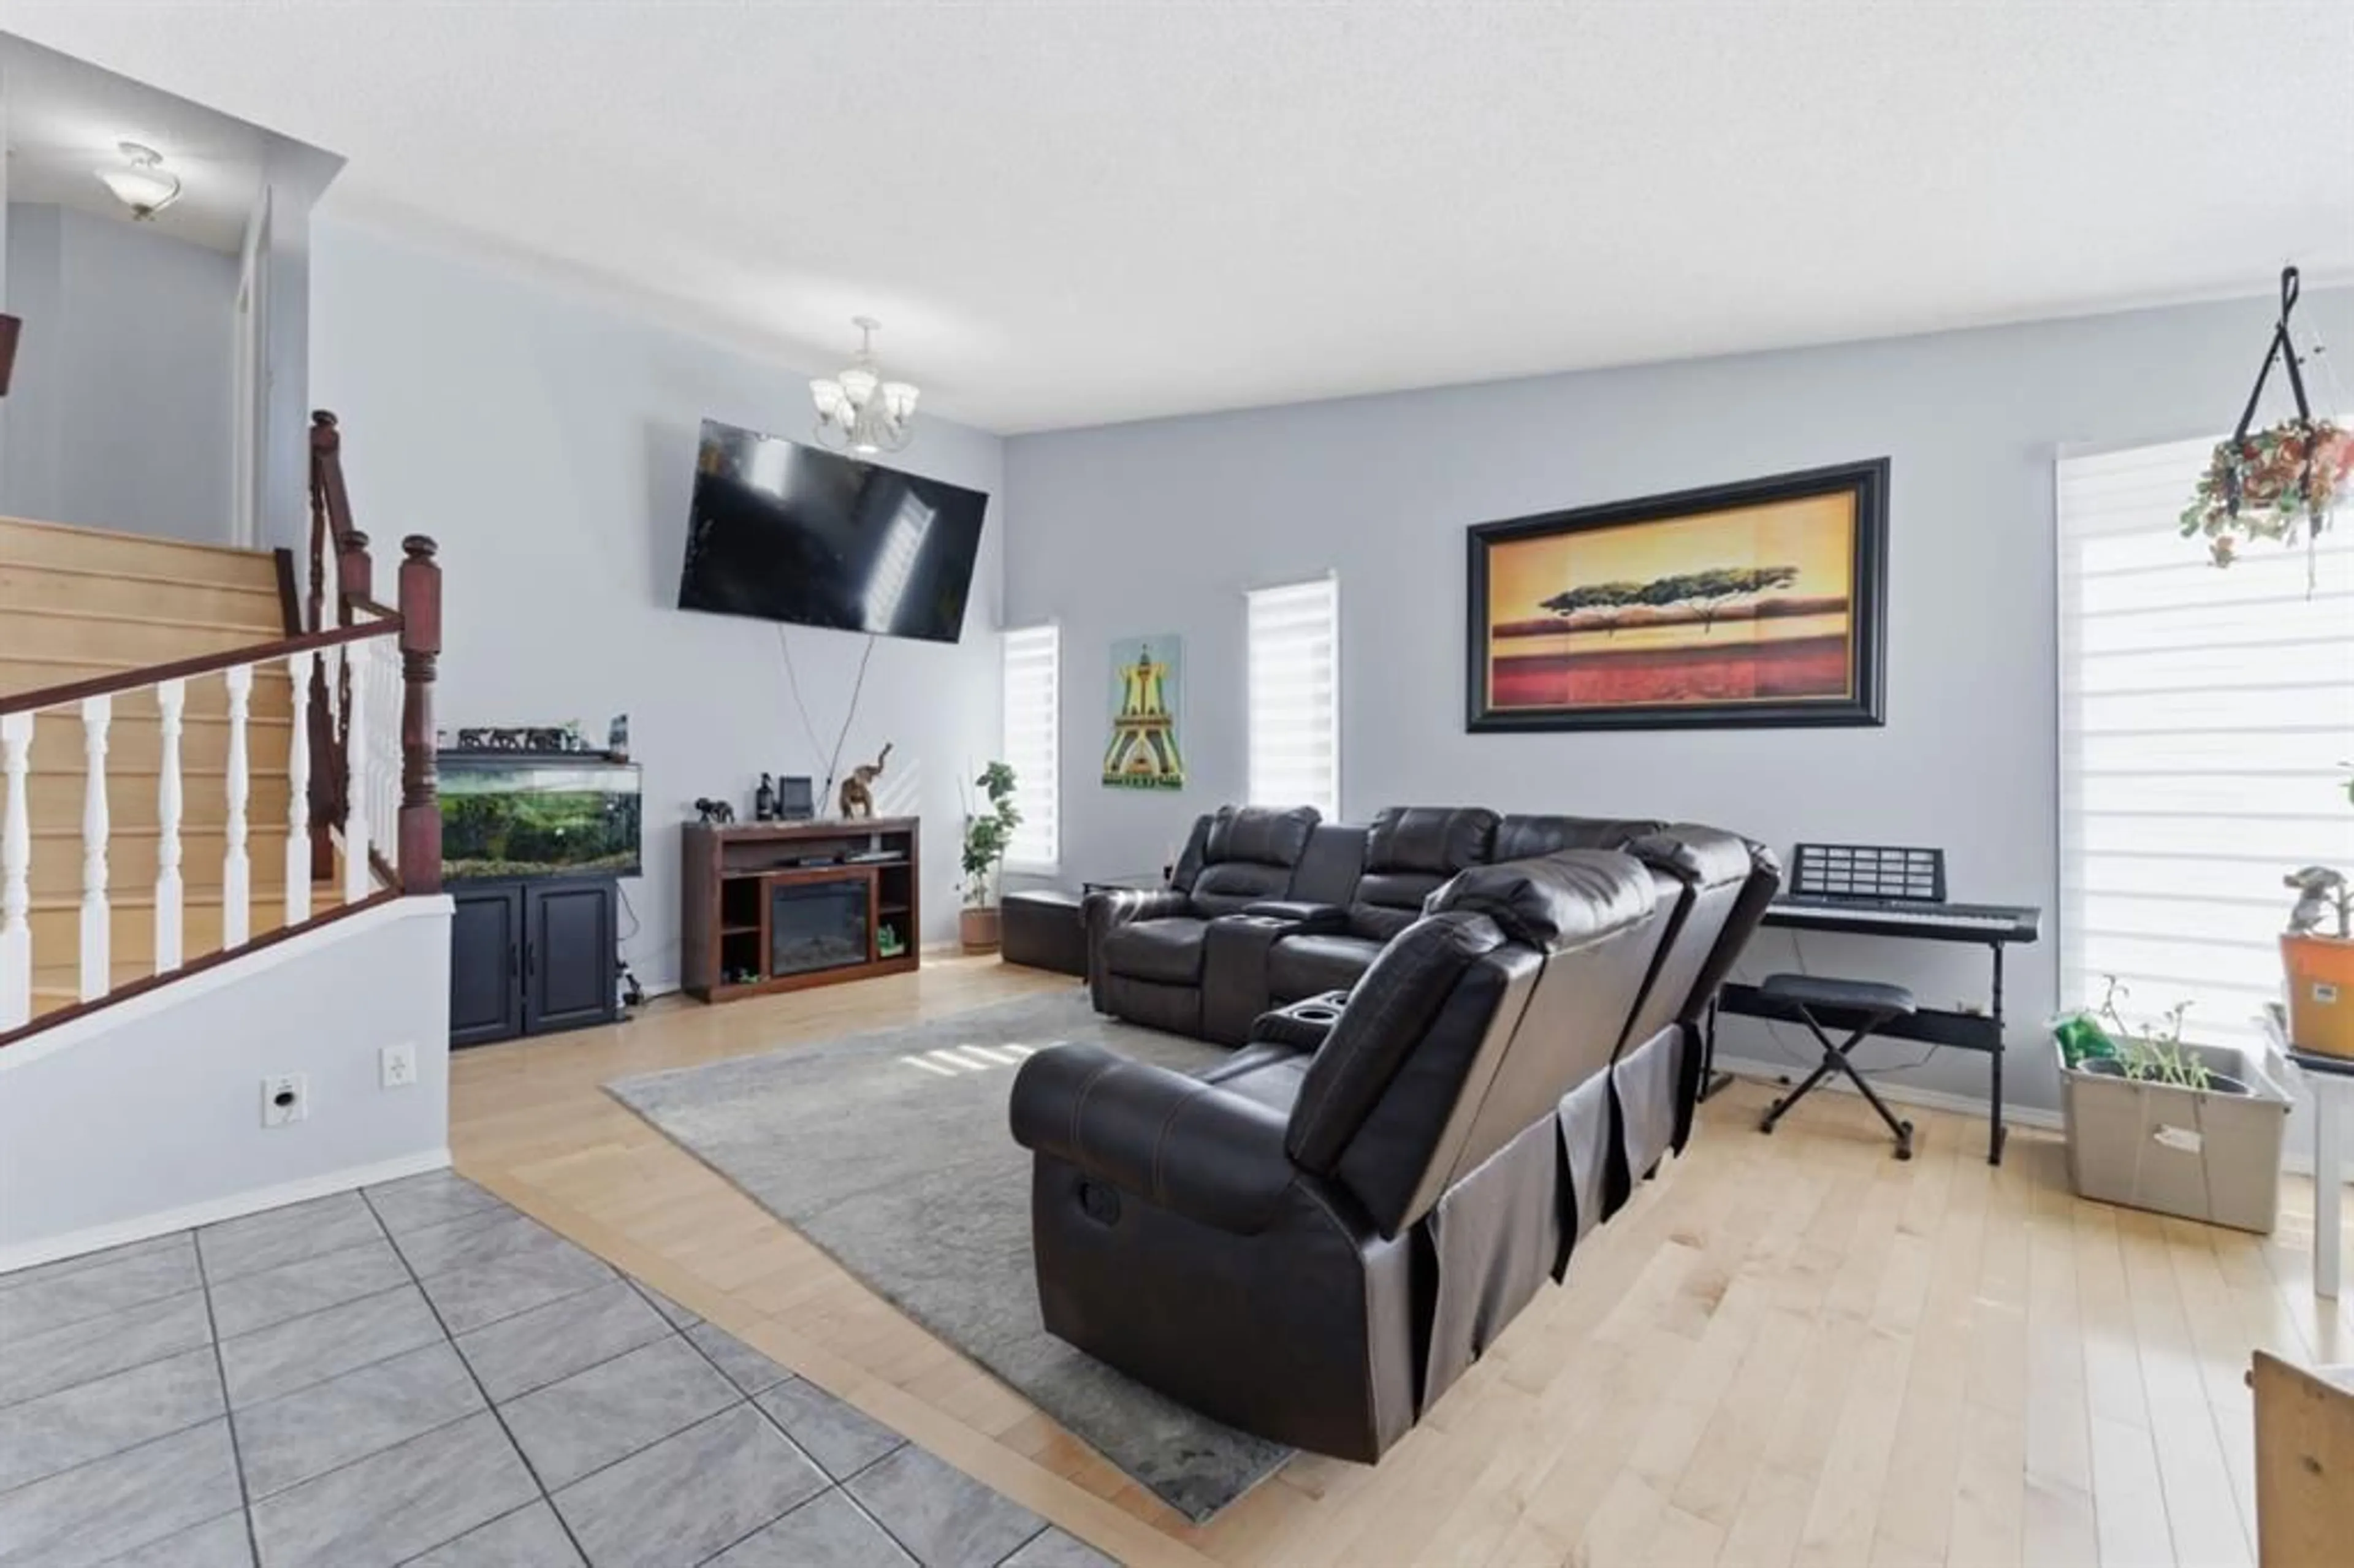
Just sold - Applewood Park
View all

Population and Demographics
Overview
Age (%)
Household composition (%)
Mother tongue (%)
House tenancy (%)
Transportation
Car Friendly
Excellent access to freeways and major arteries, with a vast amount of parking nearby
Pedestrian Friendly
Few day-to-day needs are within walking distance
Transit Friendly
Transit is available for some trips
Shopping, Food and Nightlife
Cafes
Few or no cafés within walking distance
Groceries
No grocery stores within walking distance
Nightlife
Few or no bars within walking distance
Shopping
Some shops within walking distance
Restaurants
Some restaurants within walking distance