City of Ottawa Housing Market Report
All types - for the month of June
3
30
Total Active Listings*
4,225 active
New
2,562(+5.65% YoY)
Relisted
715(-0.83% YoY)
Compared to number of active, same period, in 2025: 4,889, in 2024: 3,211, in 2023: 1,947
Total Sold Listings*
1,272 sold
Median Sold Price
$671,500
Avg Days on Market
30 days
Median Bidding
-$9,900
Compared to number of sold, same period, in 2025: 1,384, in 2024: 1,335, in 2023: 1,253
*Data is for the month of June
Median Sold Price vs Average Days and Average Total Days on Market - City of Ottawa - All types
Sold vs Active vs New vs Relisted - City of Ottawa - All types
Sold Price Distribution - City of Ottawa - All types
Sold price distribution per the last 3 months's sold listings.
Property Type Distribution - City of Ottawa - All types
Property type distribution based on data from the last 3 months.
Median Price - City of Ottawa - All types
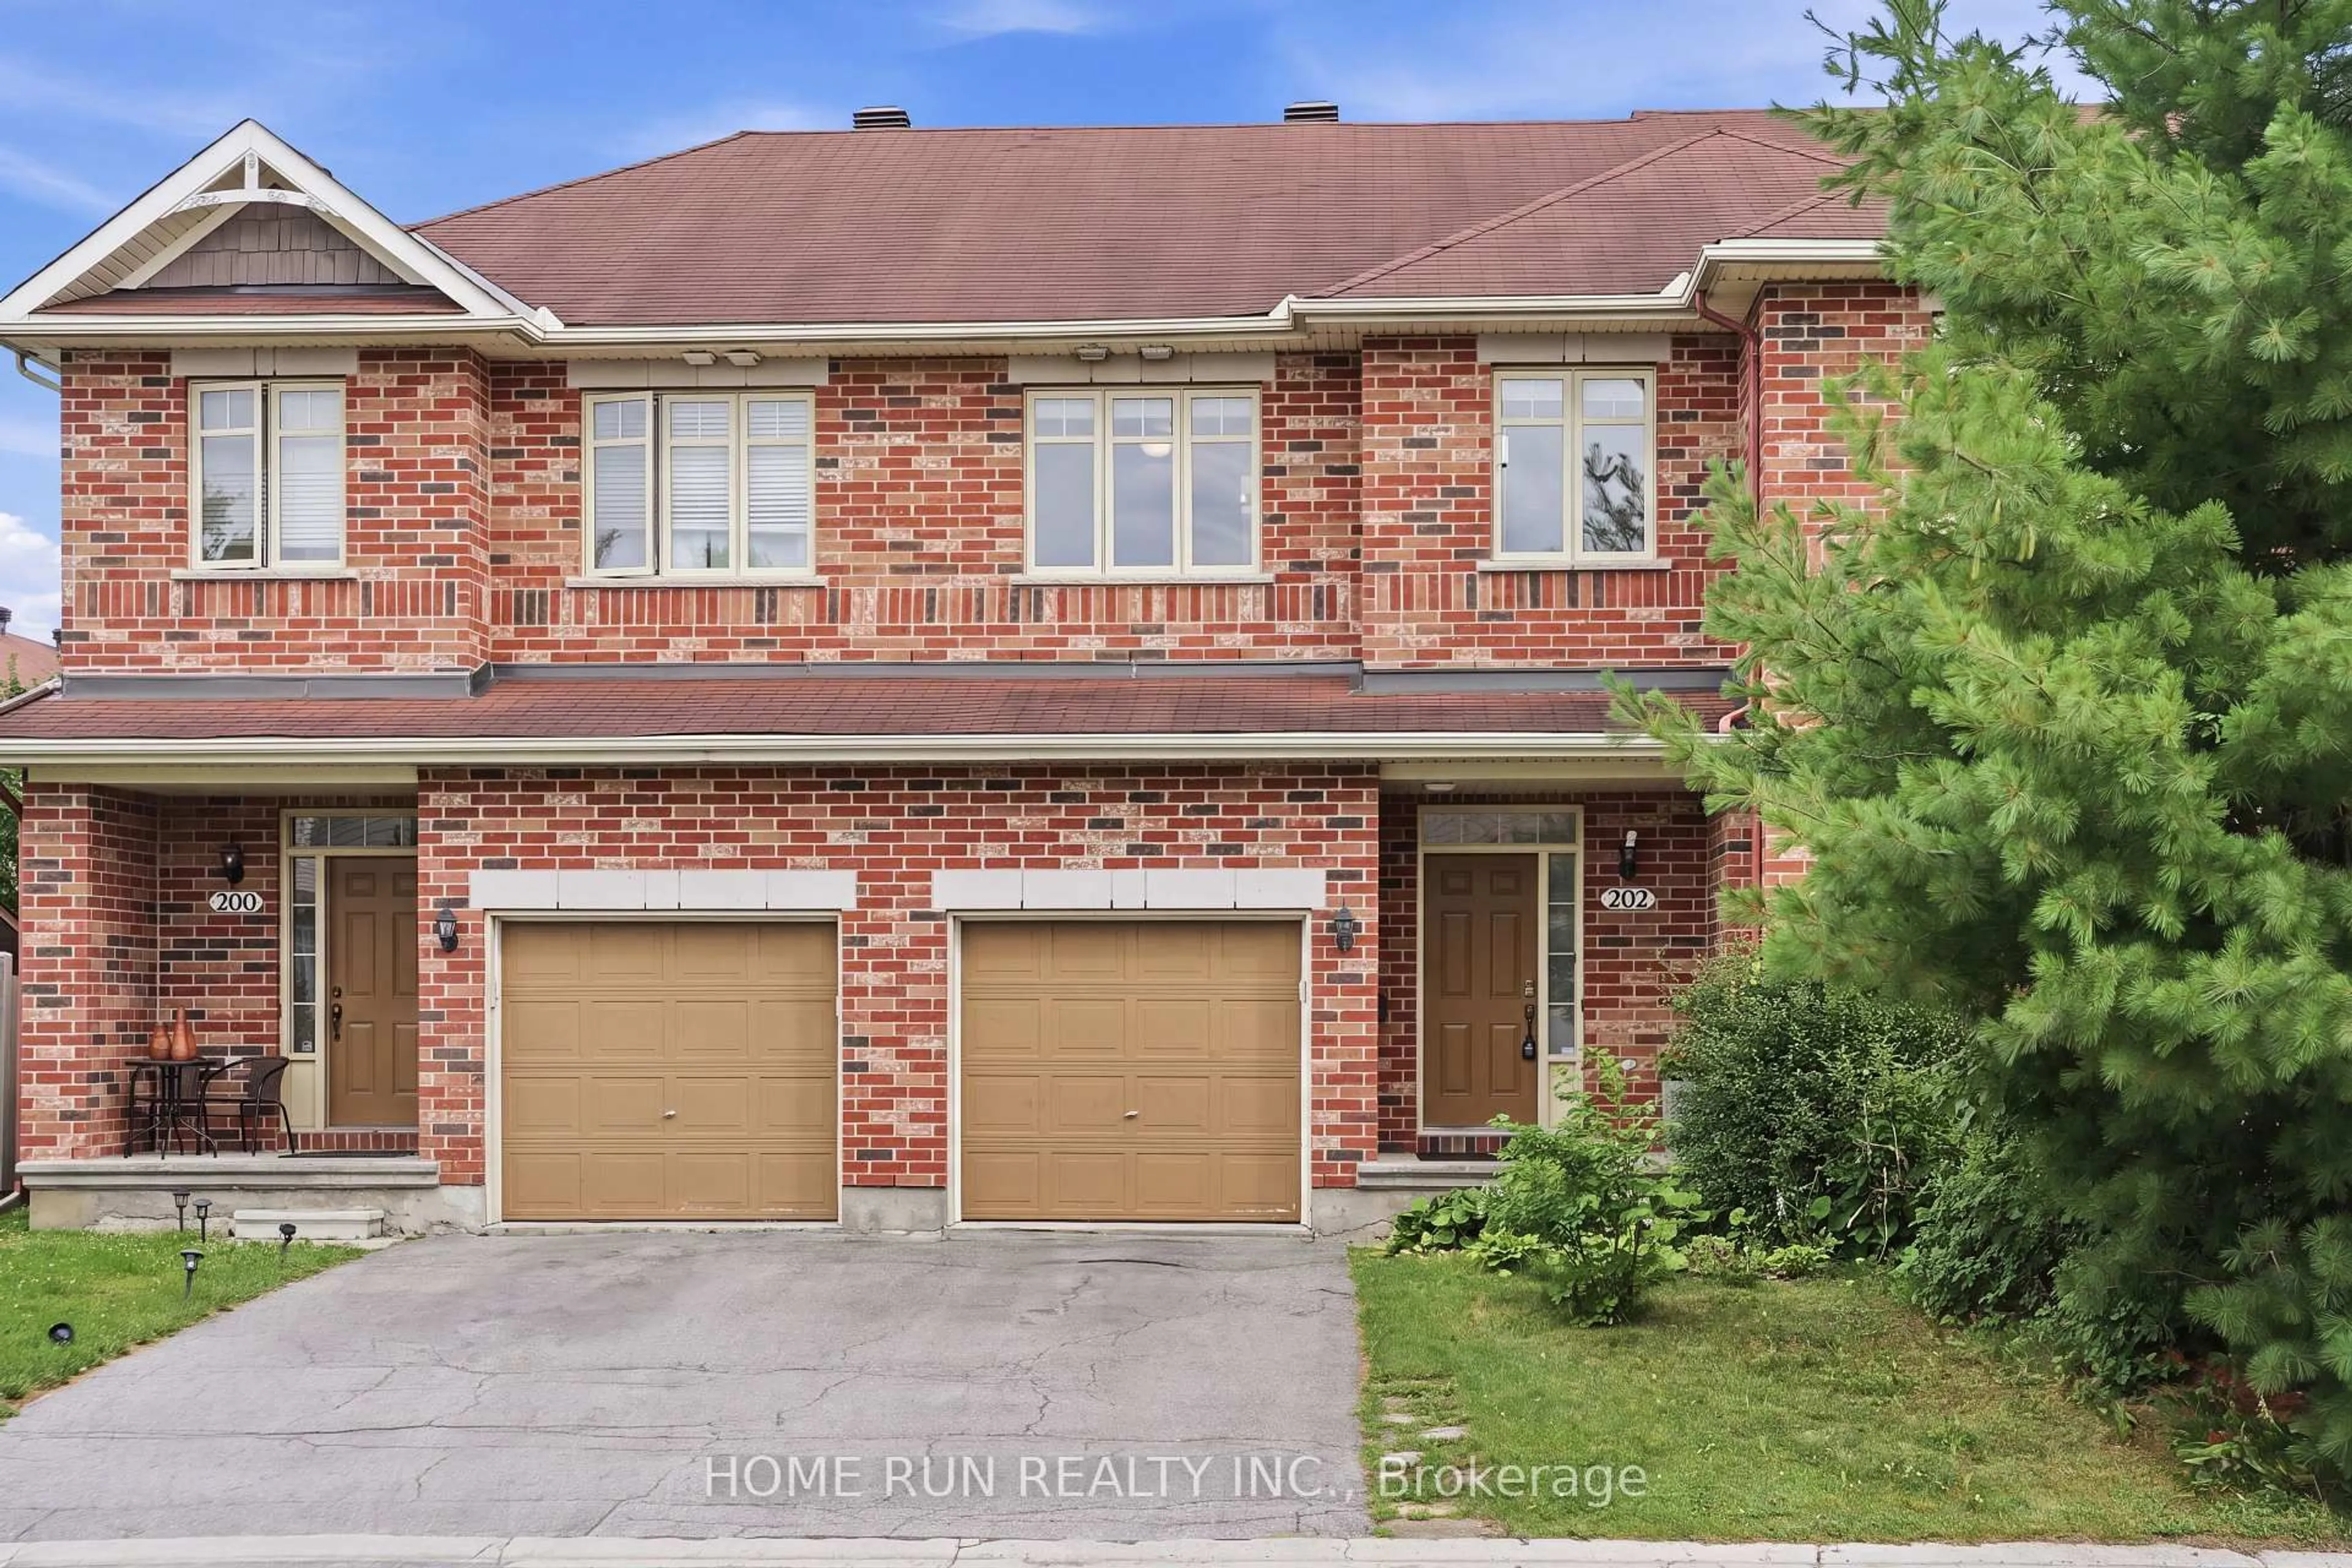
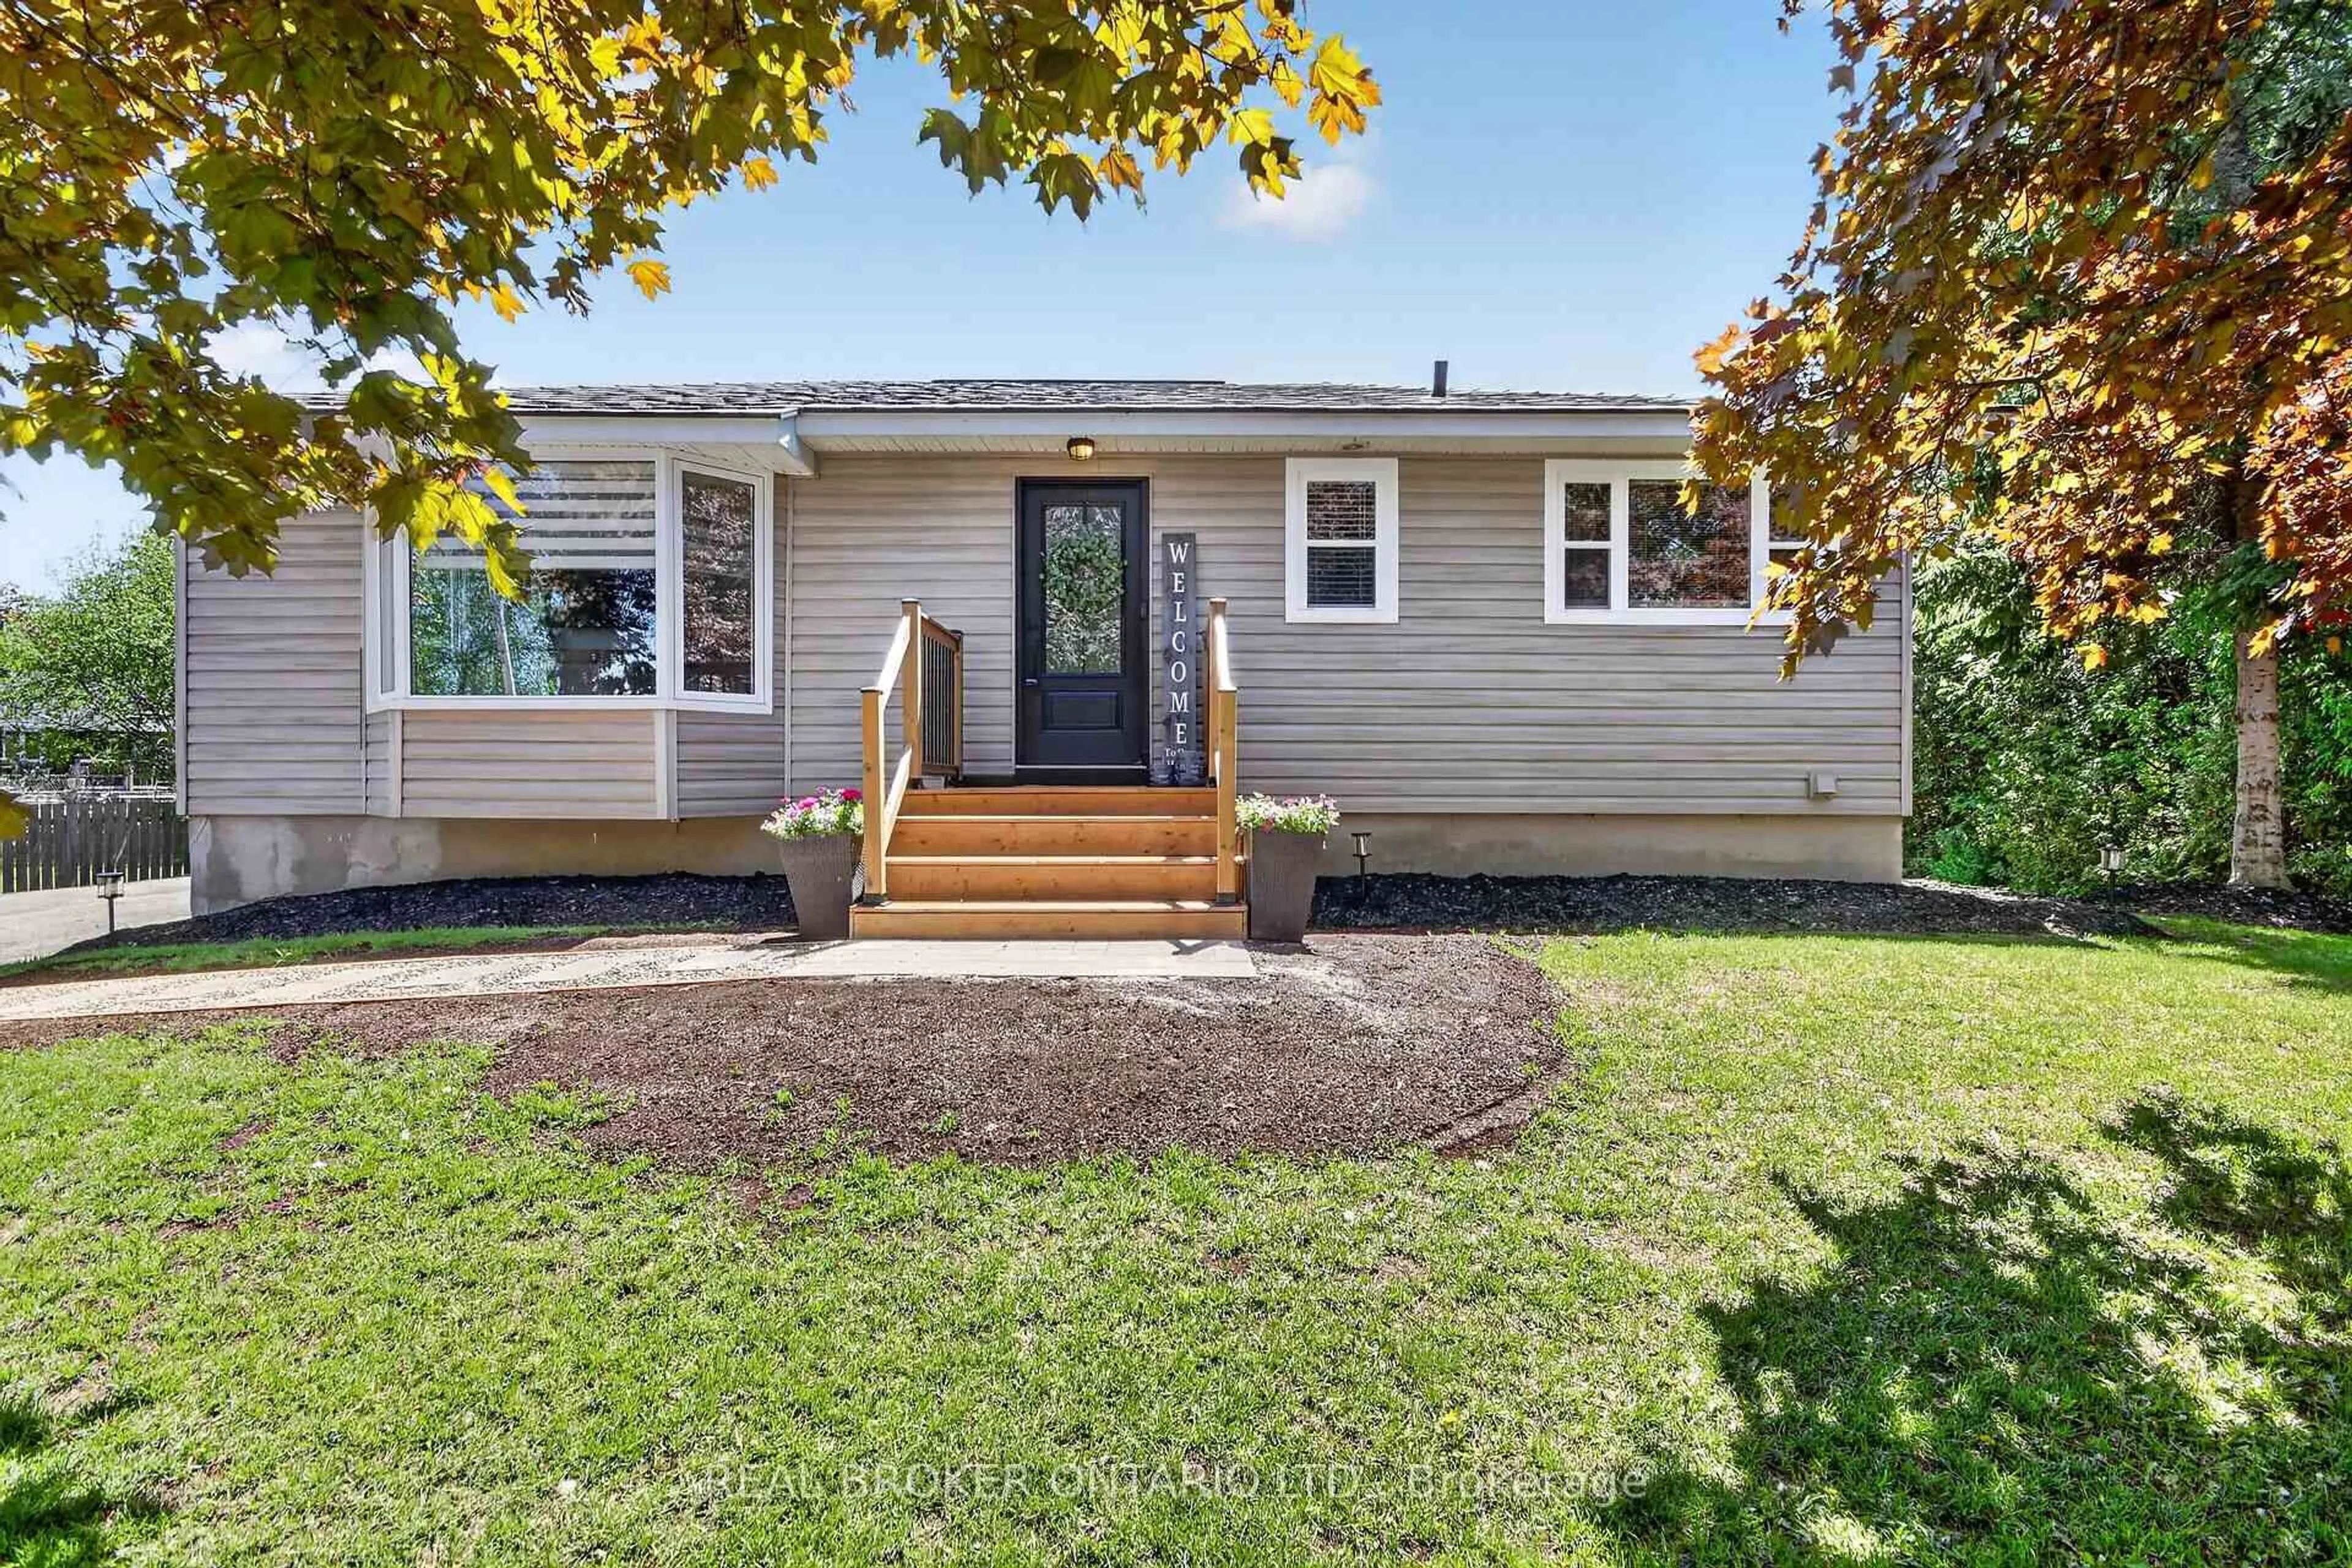
Just listed - City of Ottawa
View all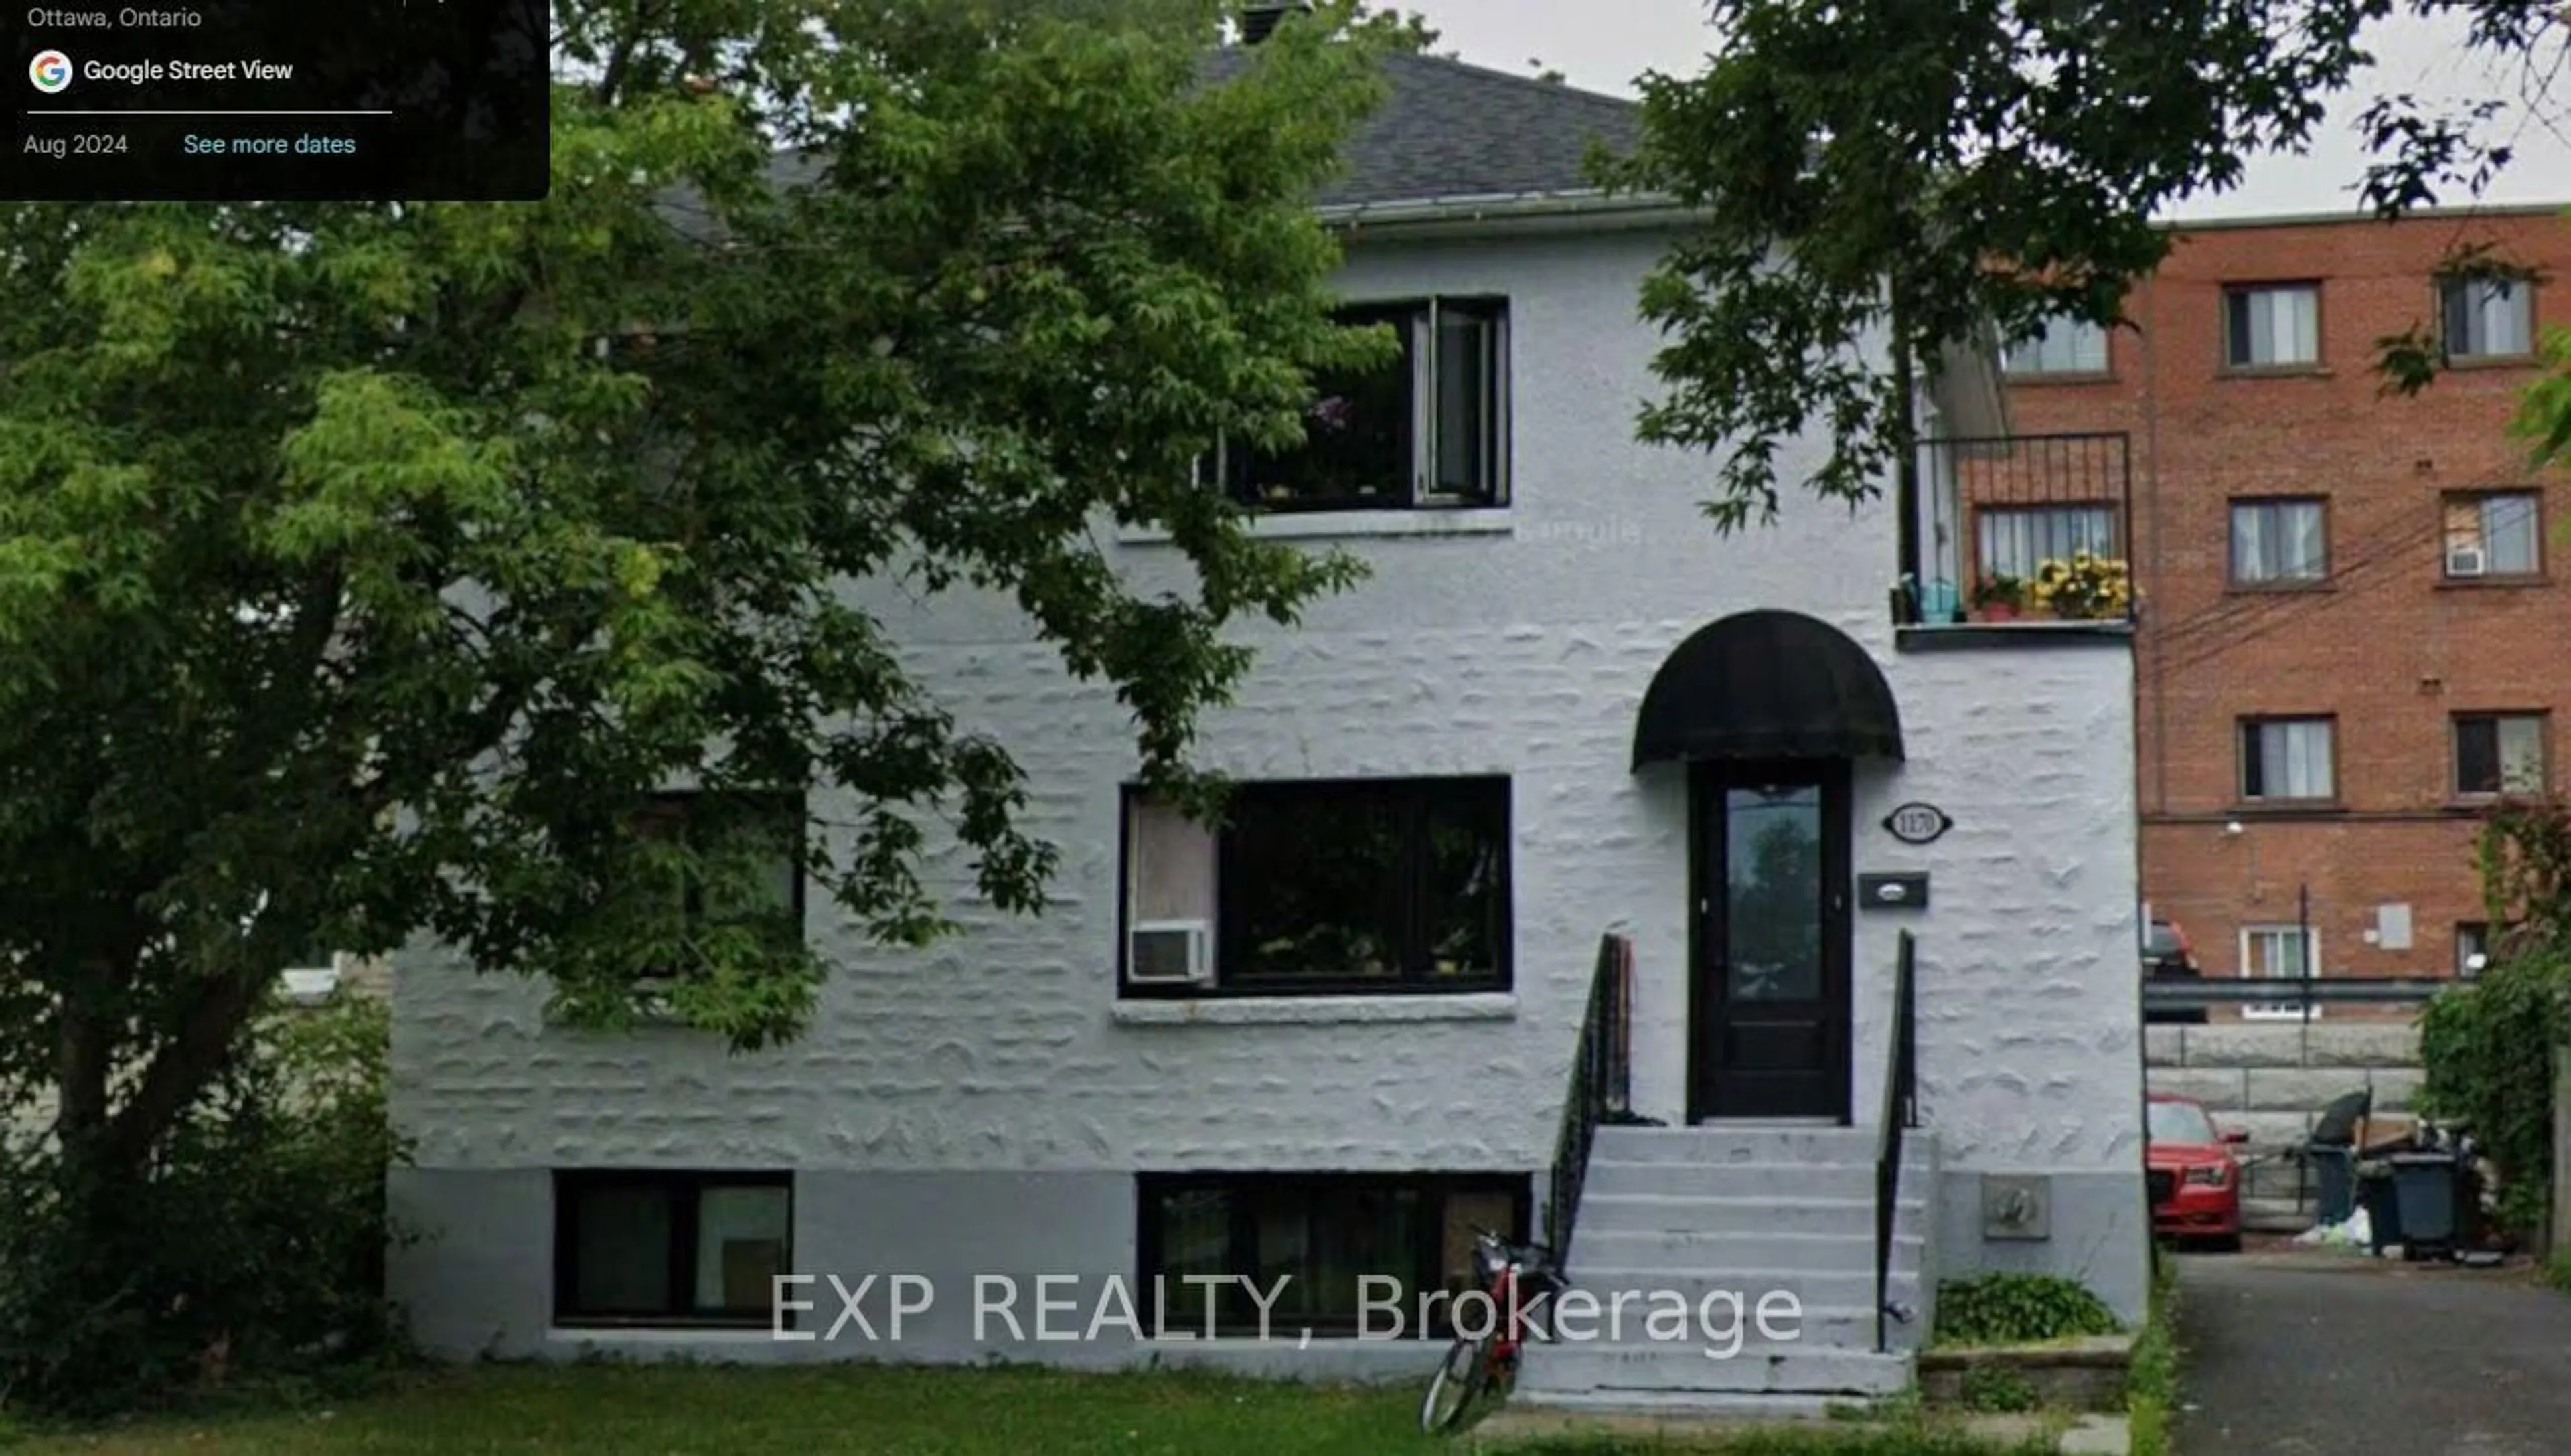
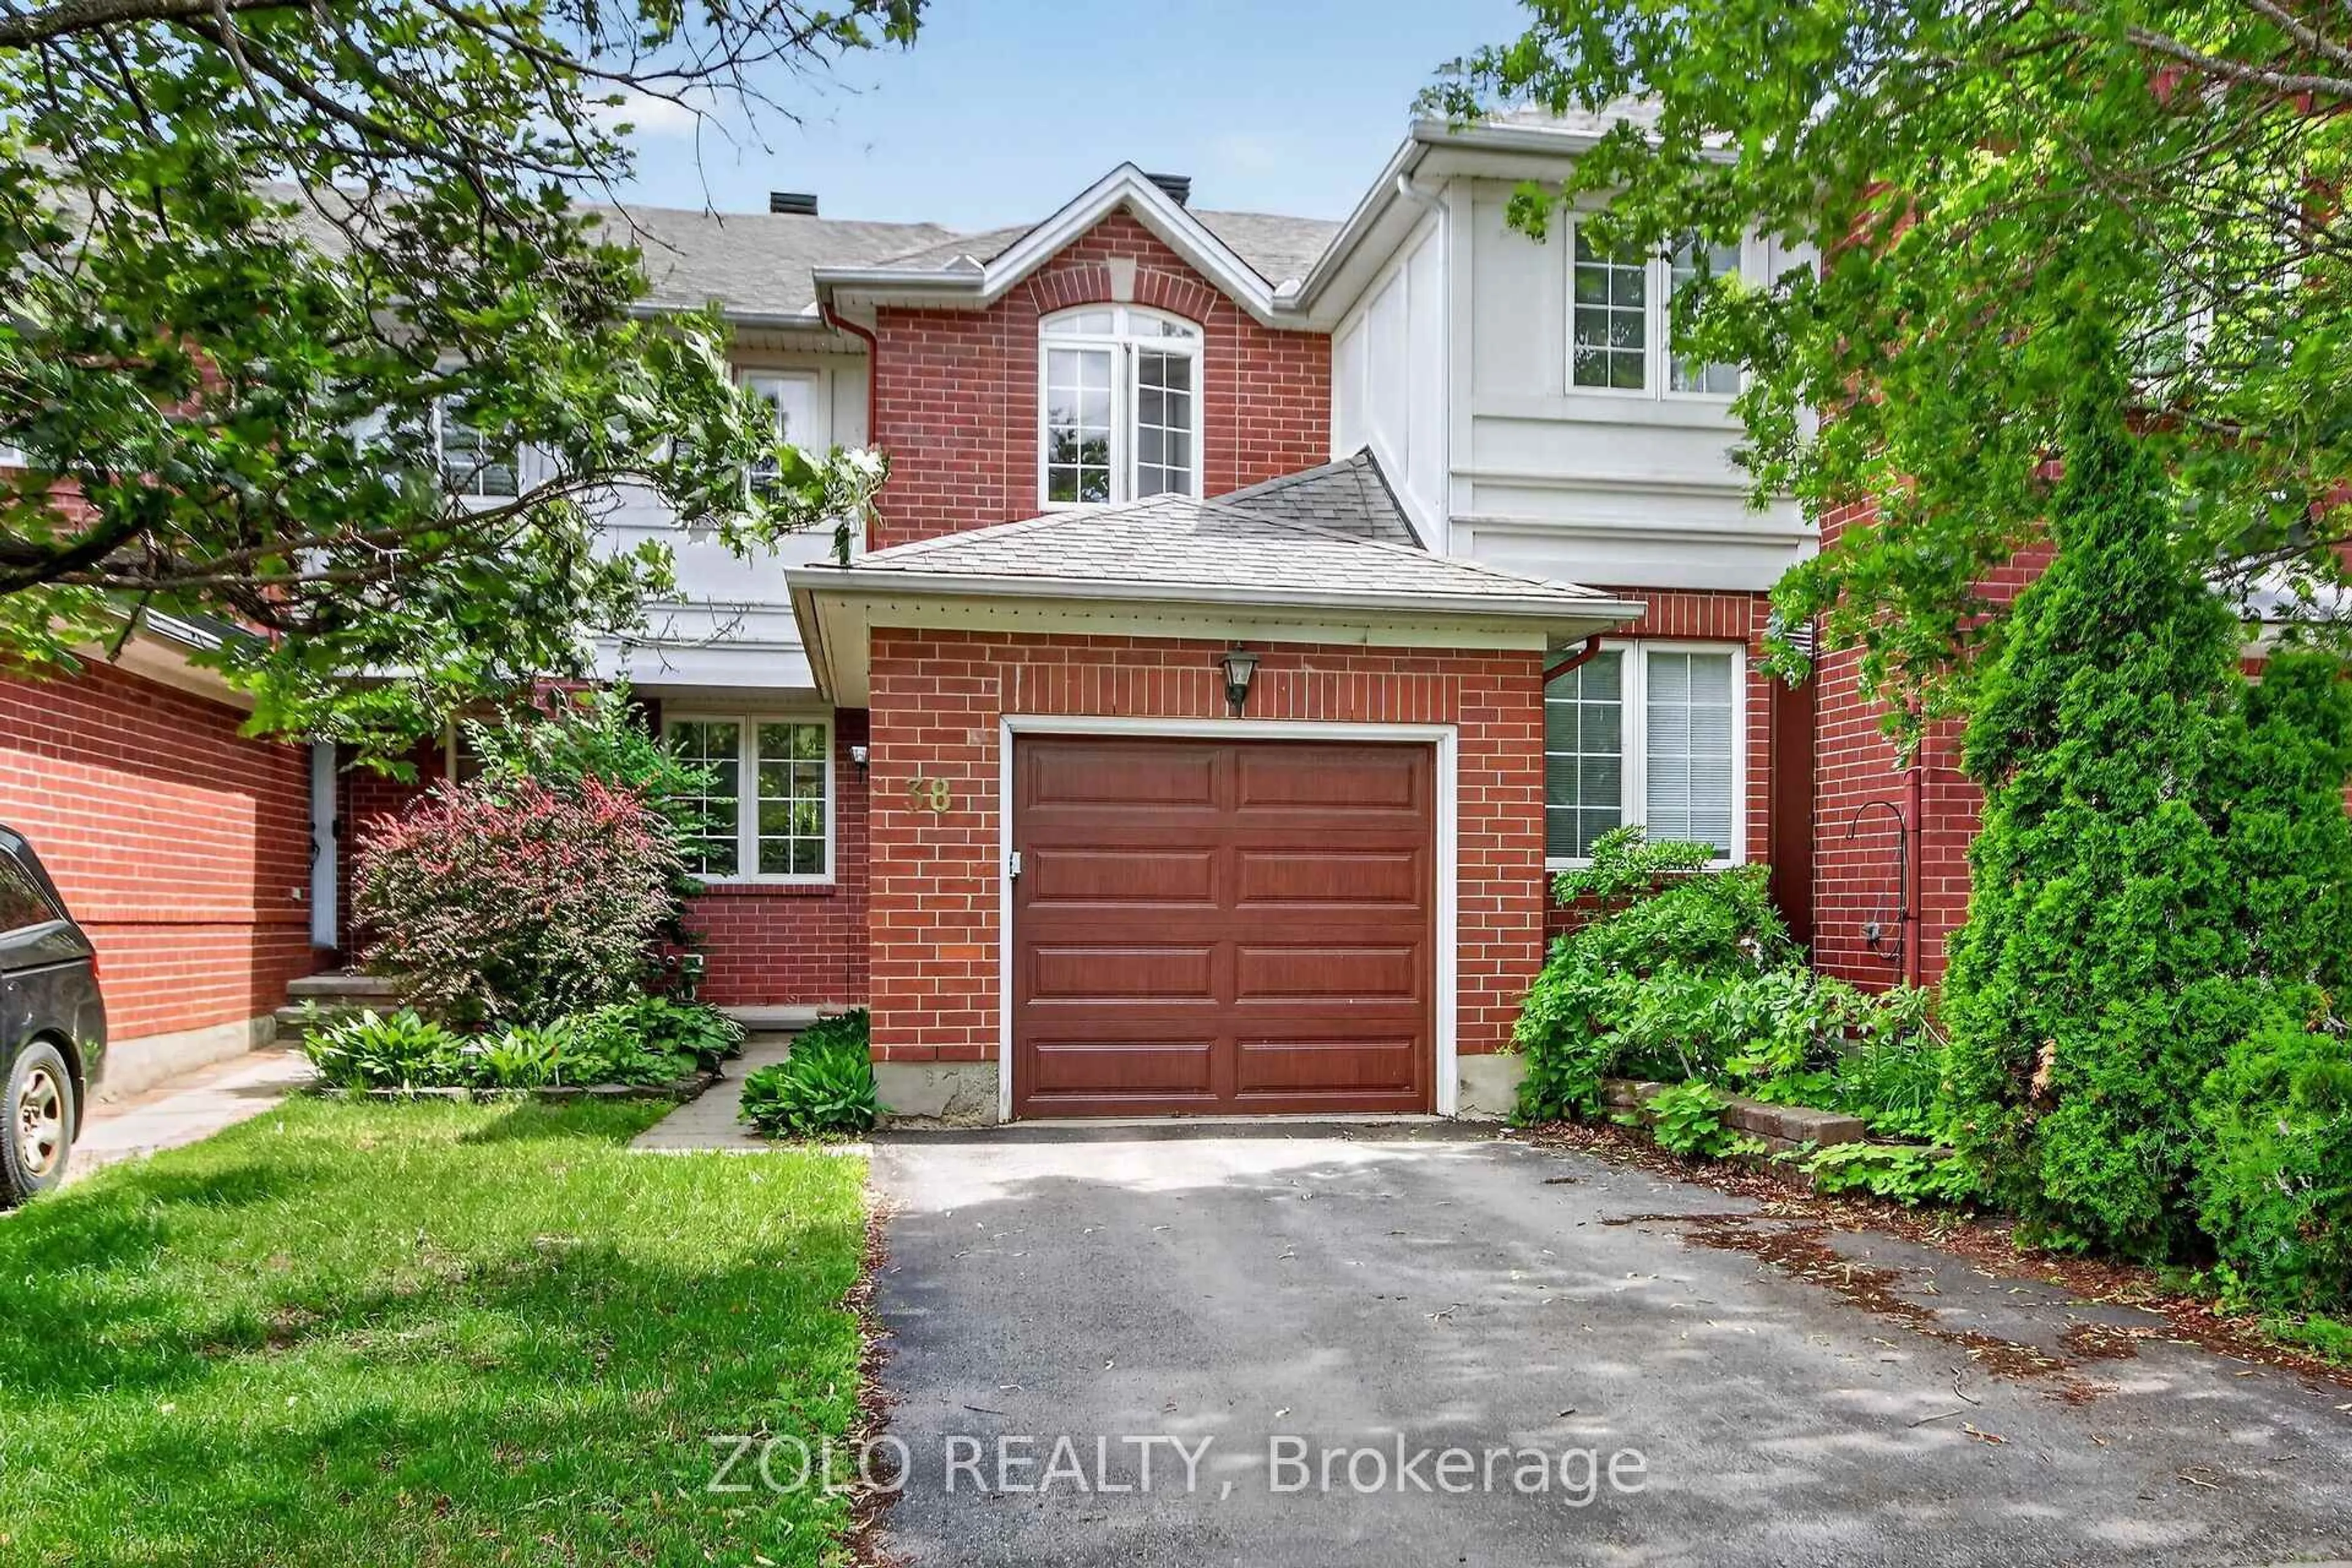
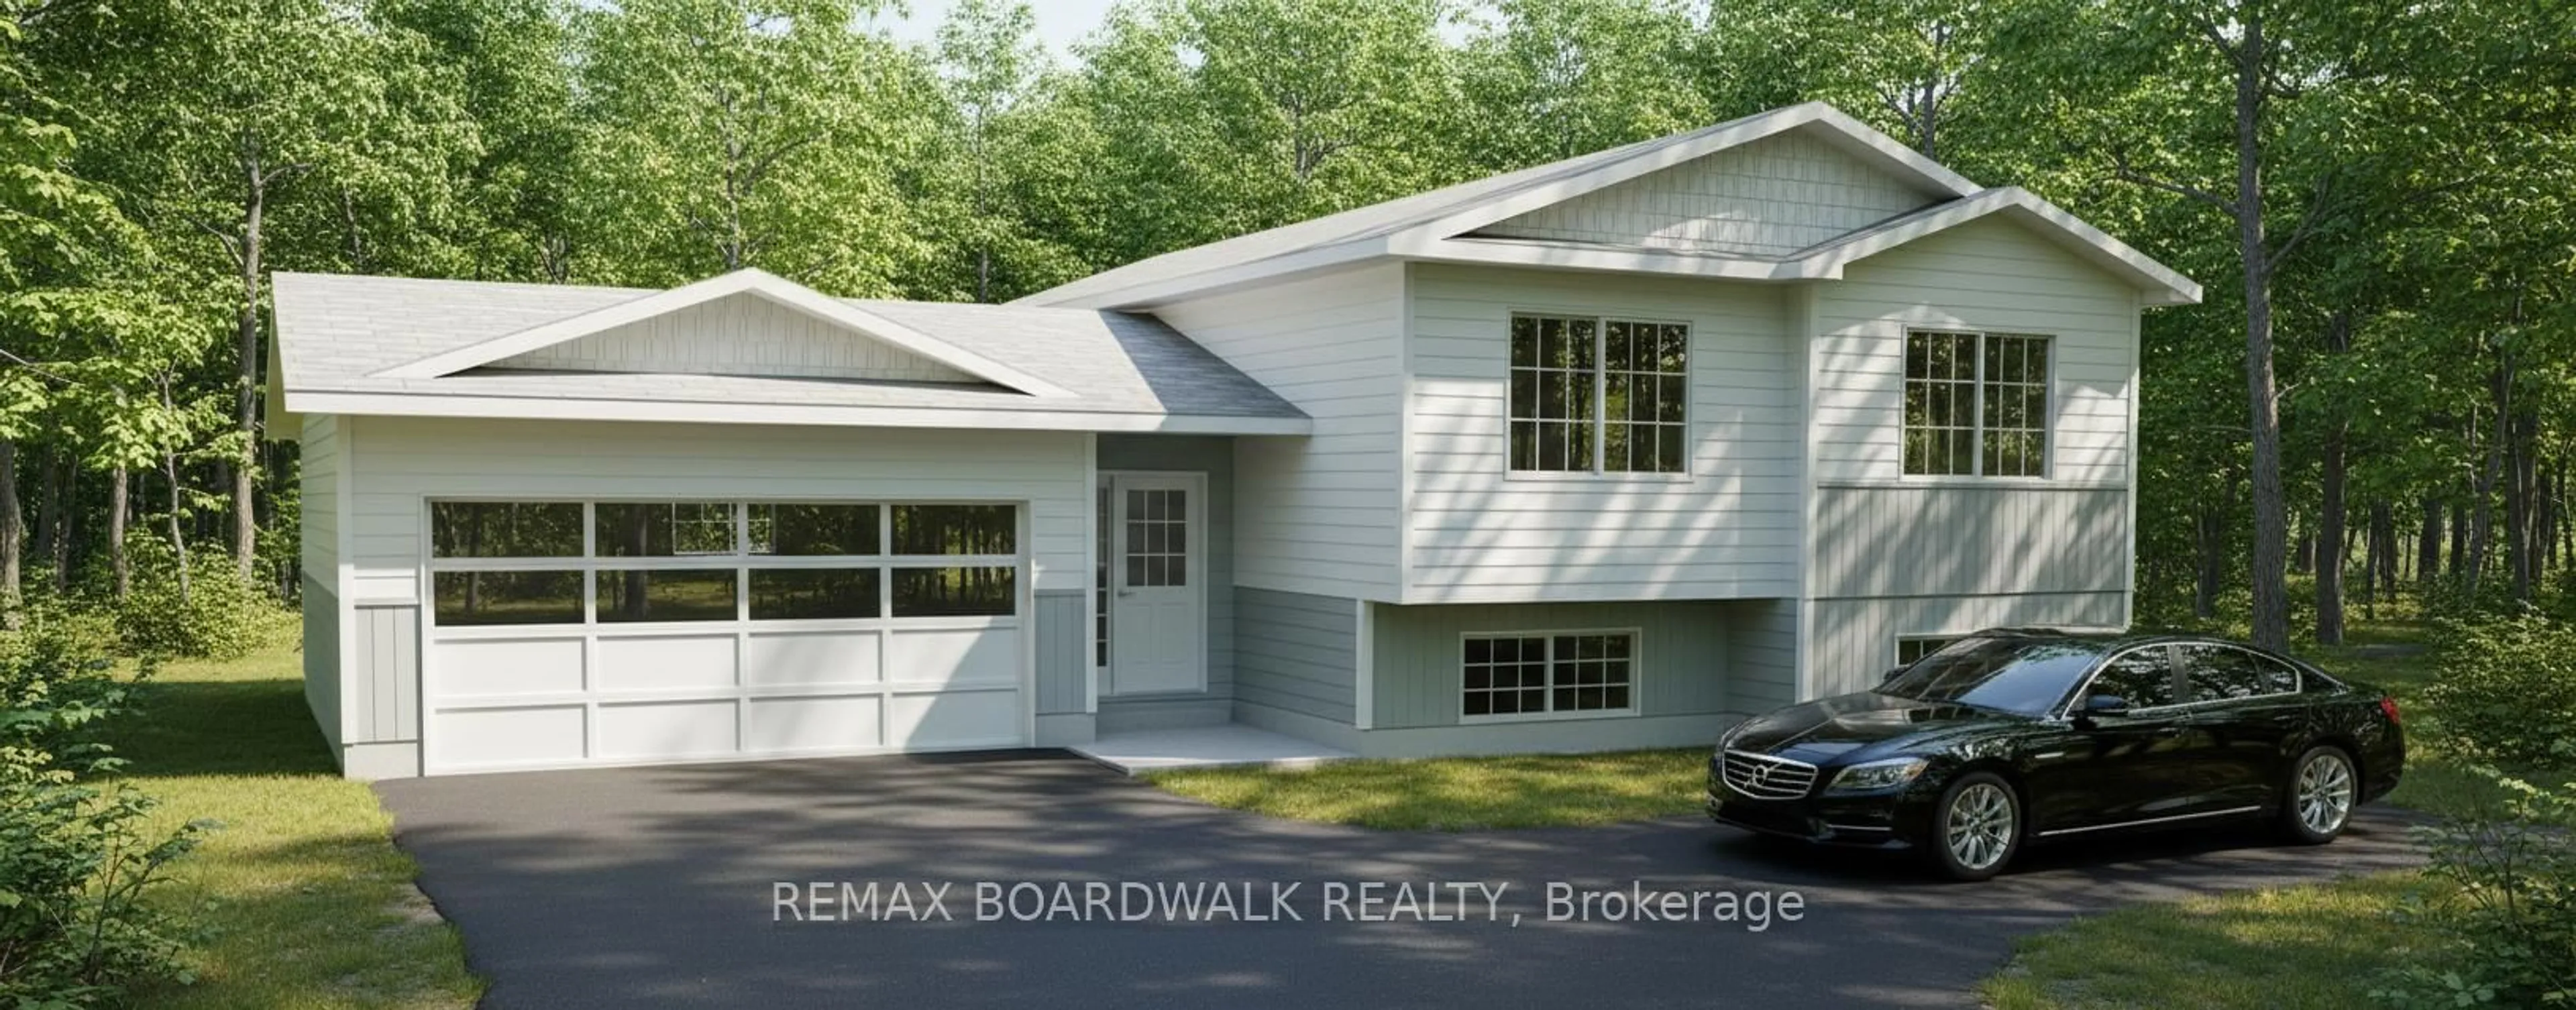
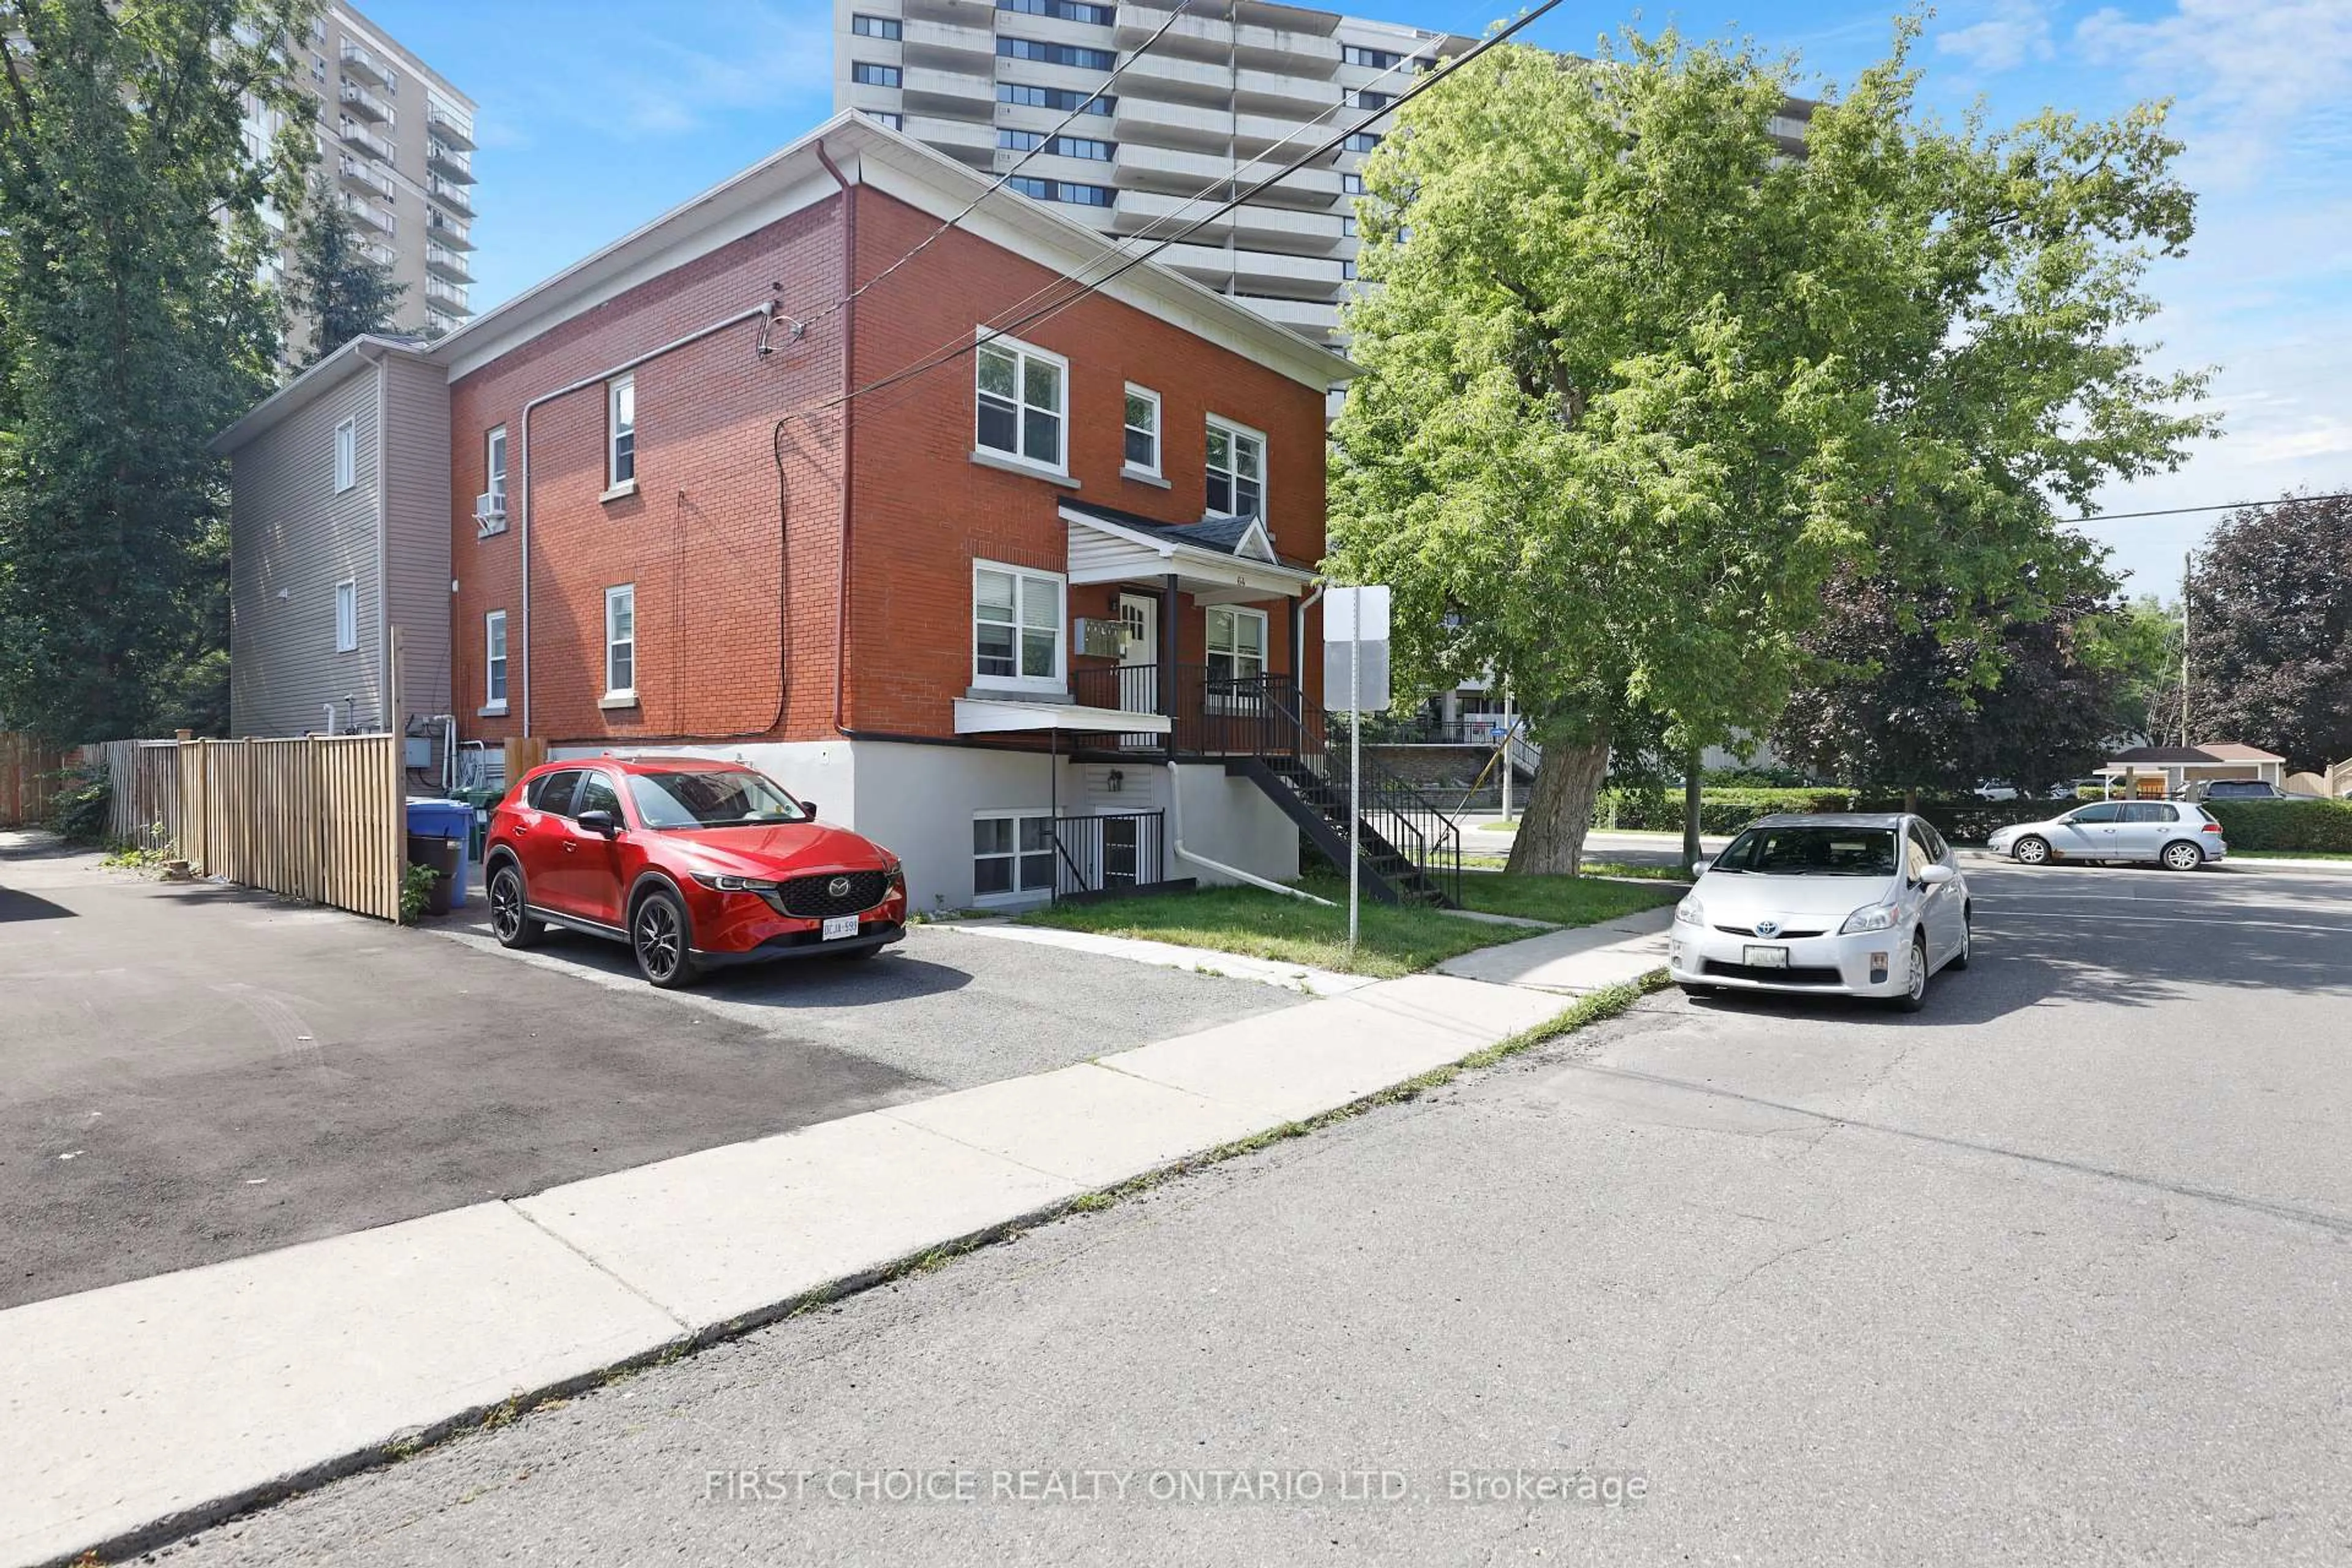
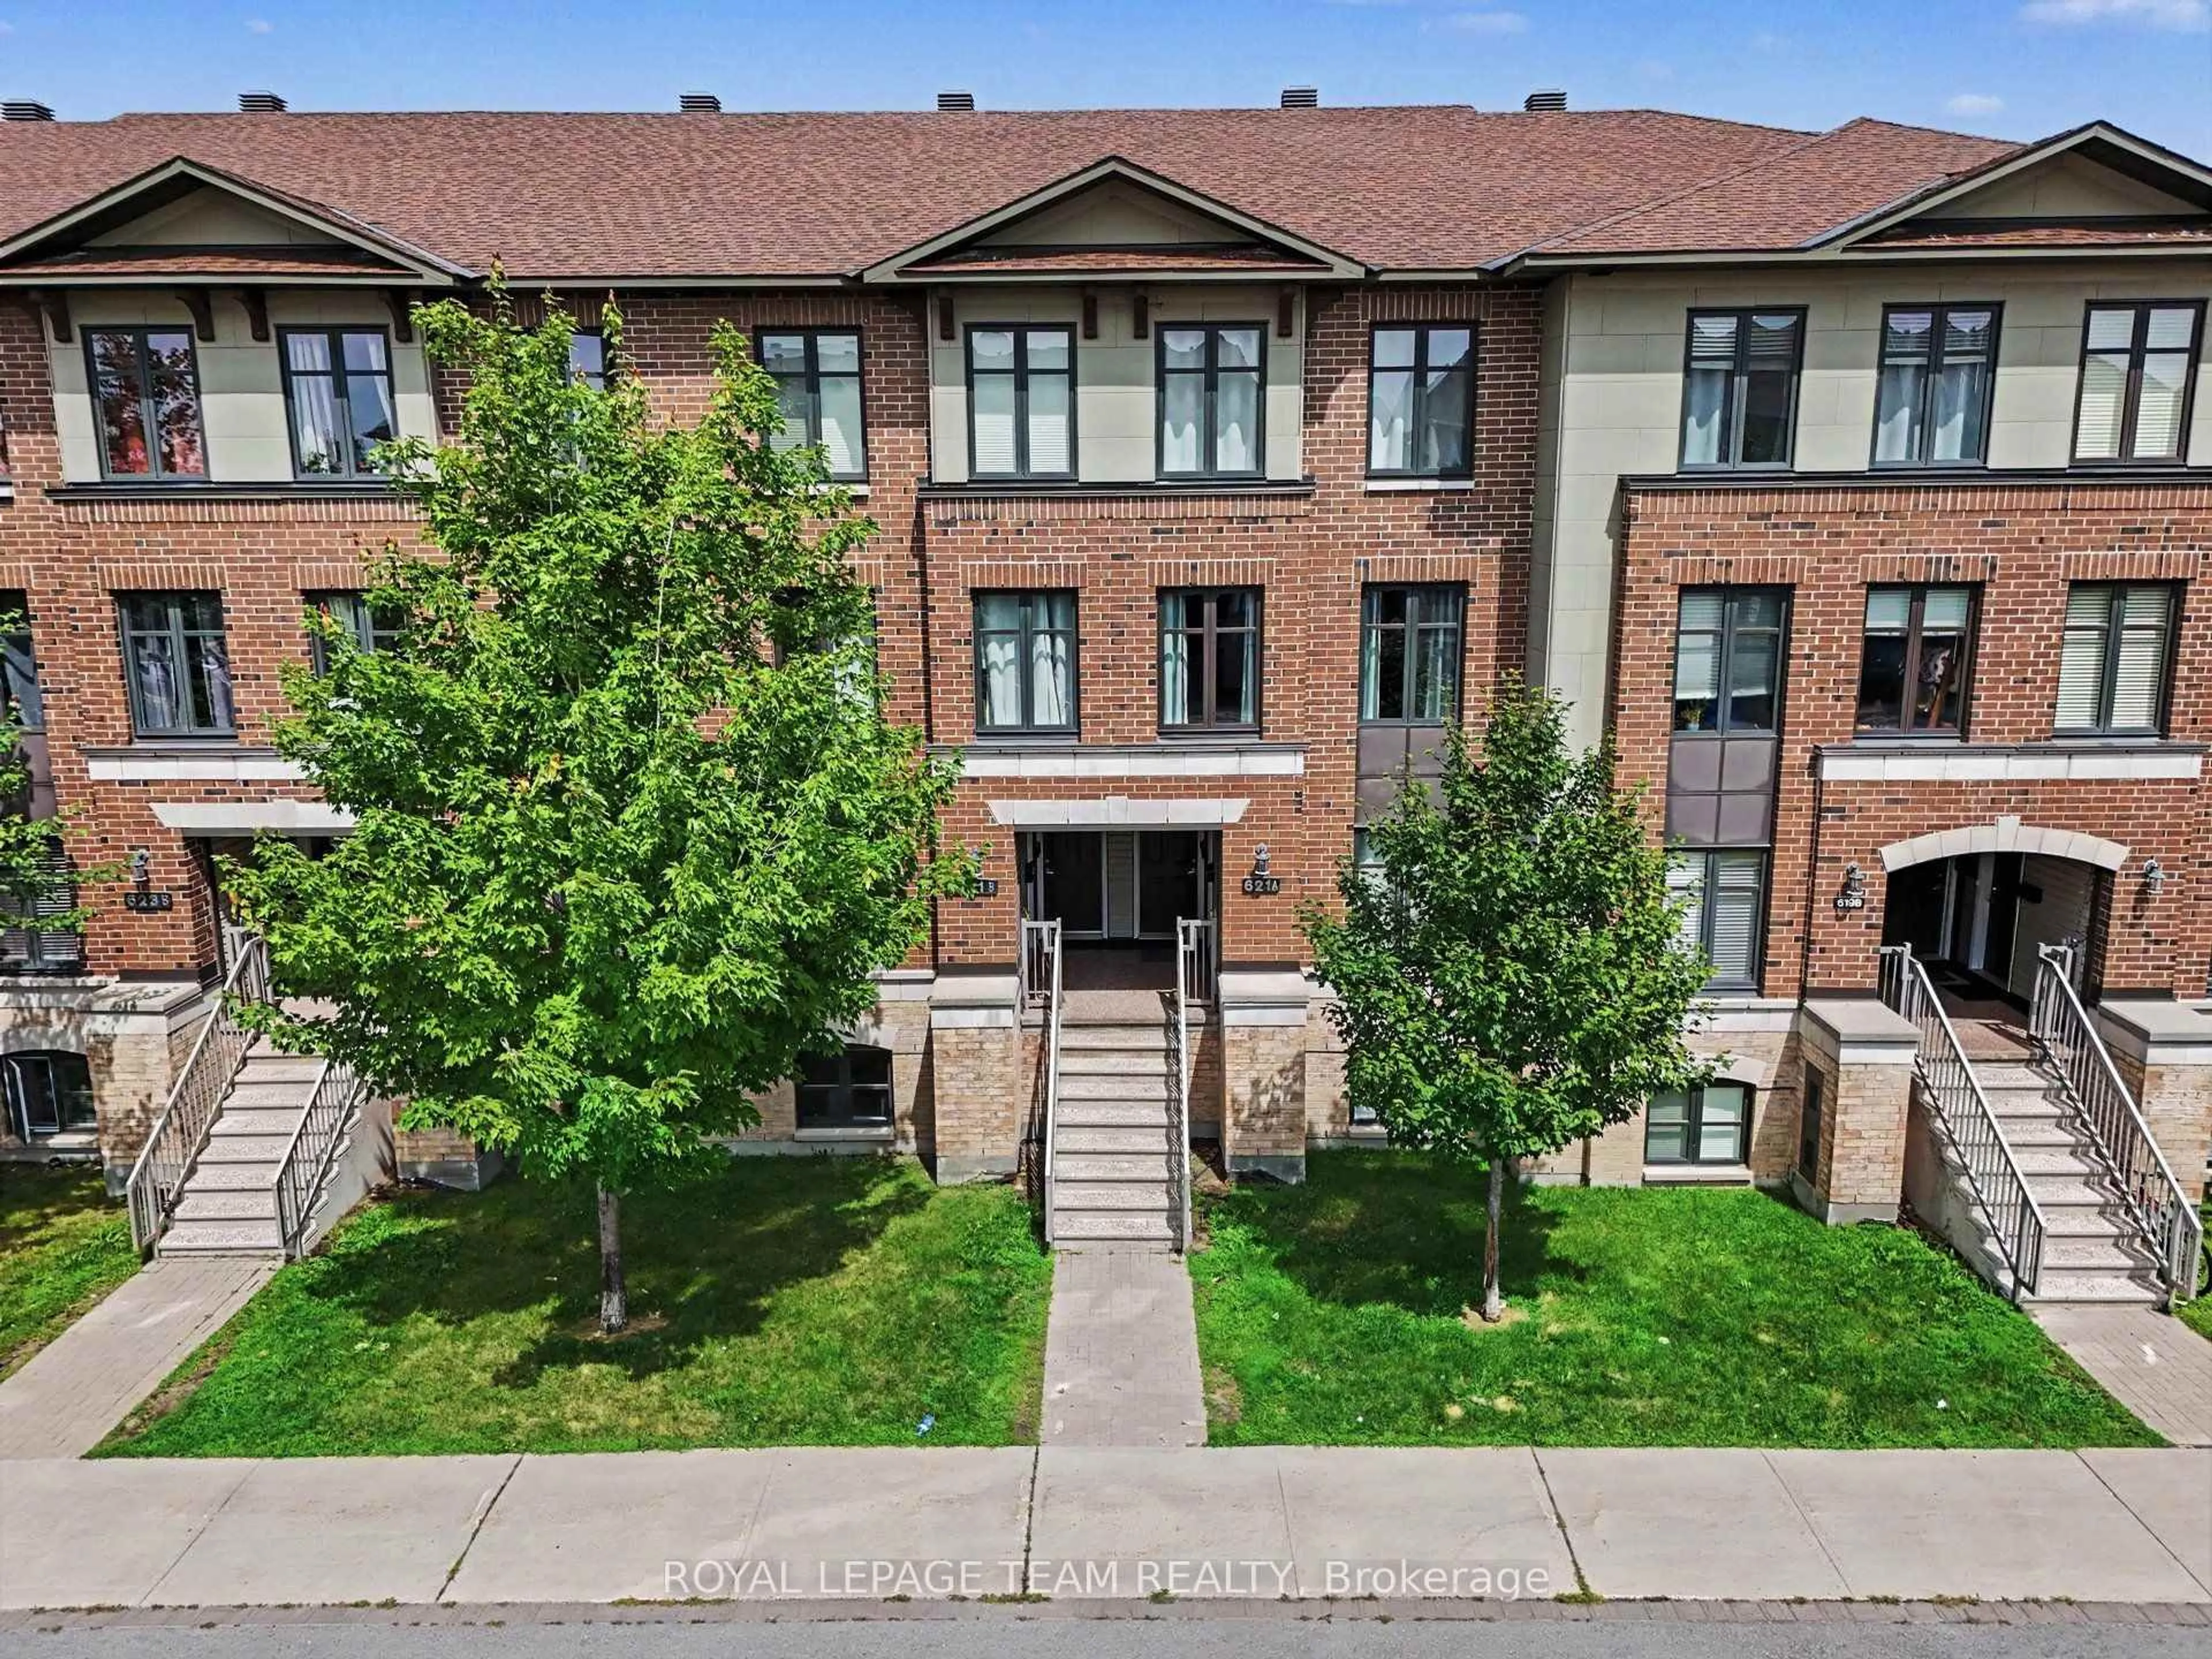
Just sold - City of Ottawa
View all
Top 5 Schools in City of Ottawa
Transportation
Car Friendly
Good access to freeways and major arteries, with a large amount of parking nearby
Pedestrian Friendly
Other transportation modes are needed to reach day-to-day needs
Transit Friendly
Transit is available for some trips
Shopping, Food and Nightlife
Cafes
Few or no cafés within walking distance
Groceries
At least one grocery store within a 30-minute walk
Nightlife
Few or no bars within walking distance
Shopping
Some shops within walking distance
Restaurants
Few or no restaurants within walking distance