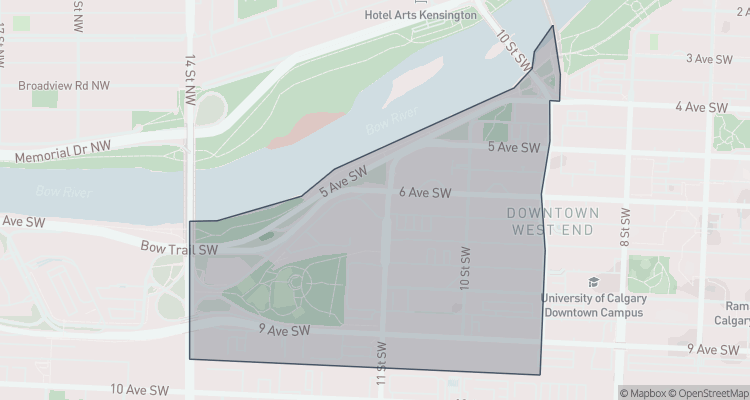
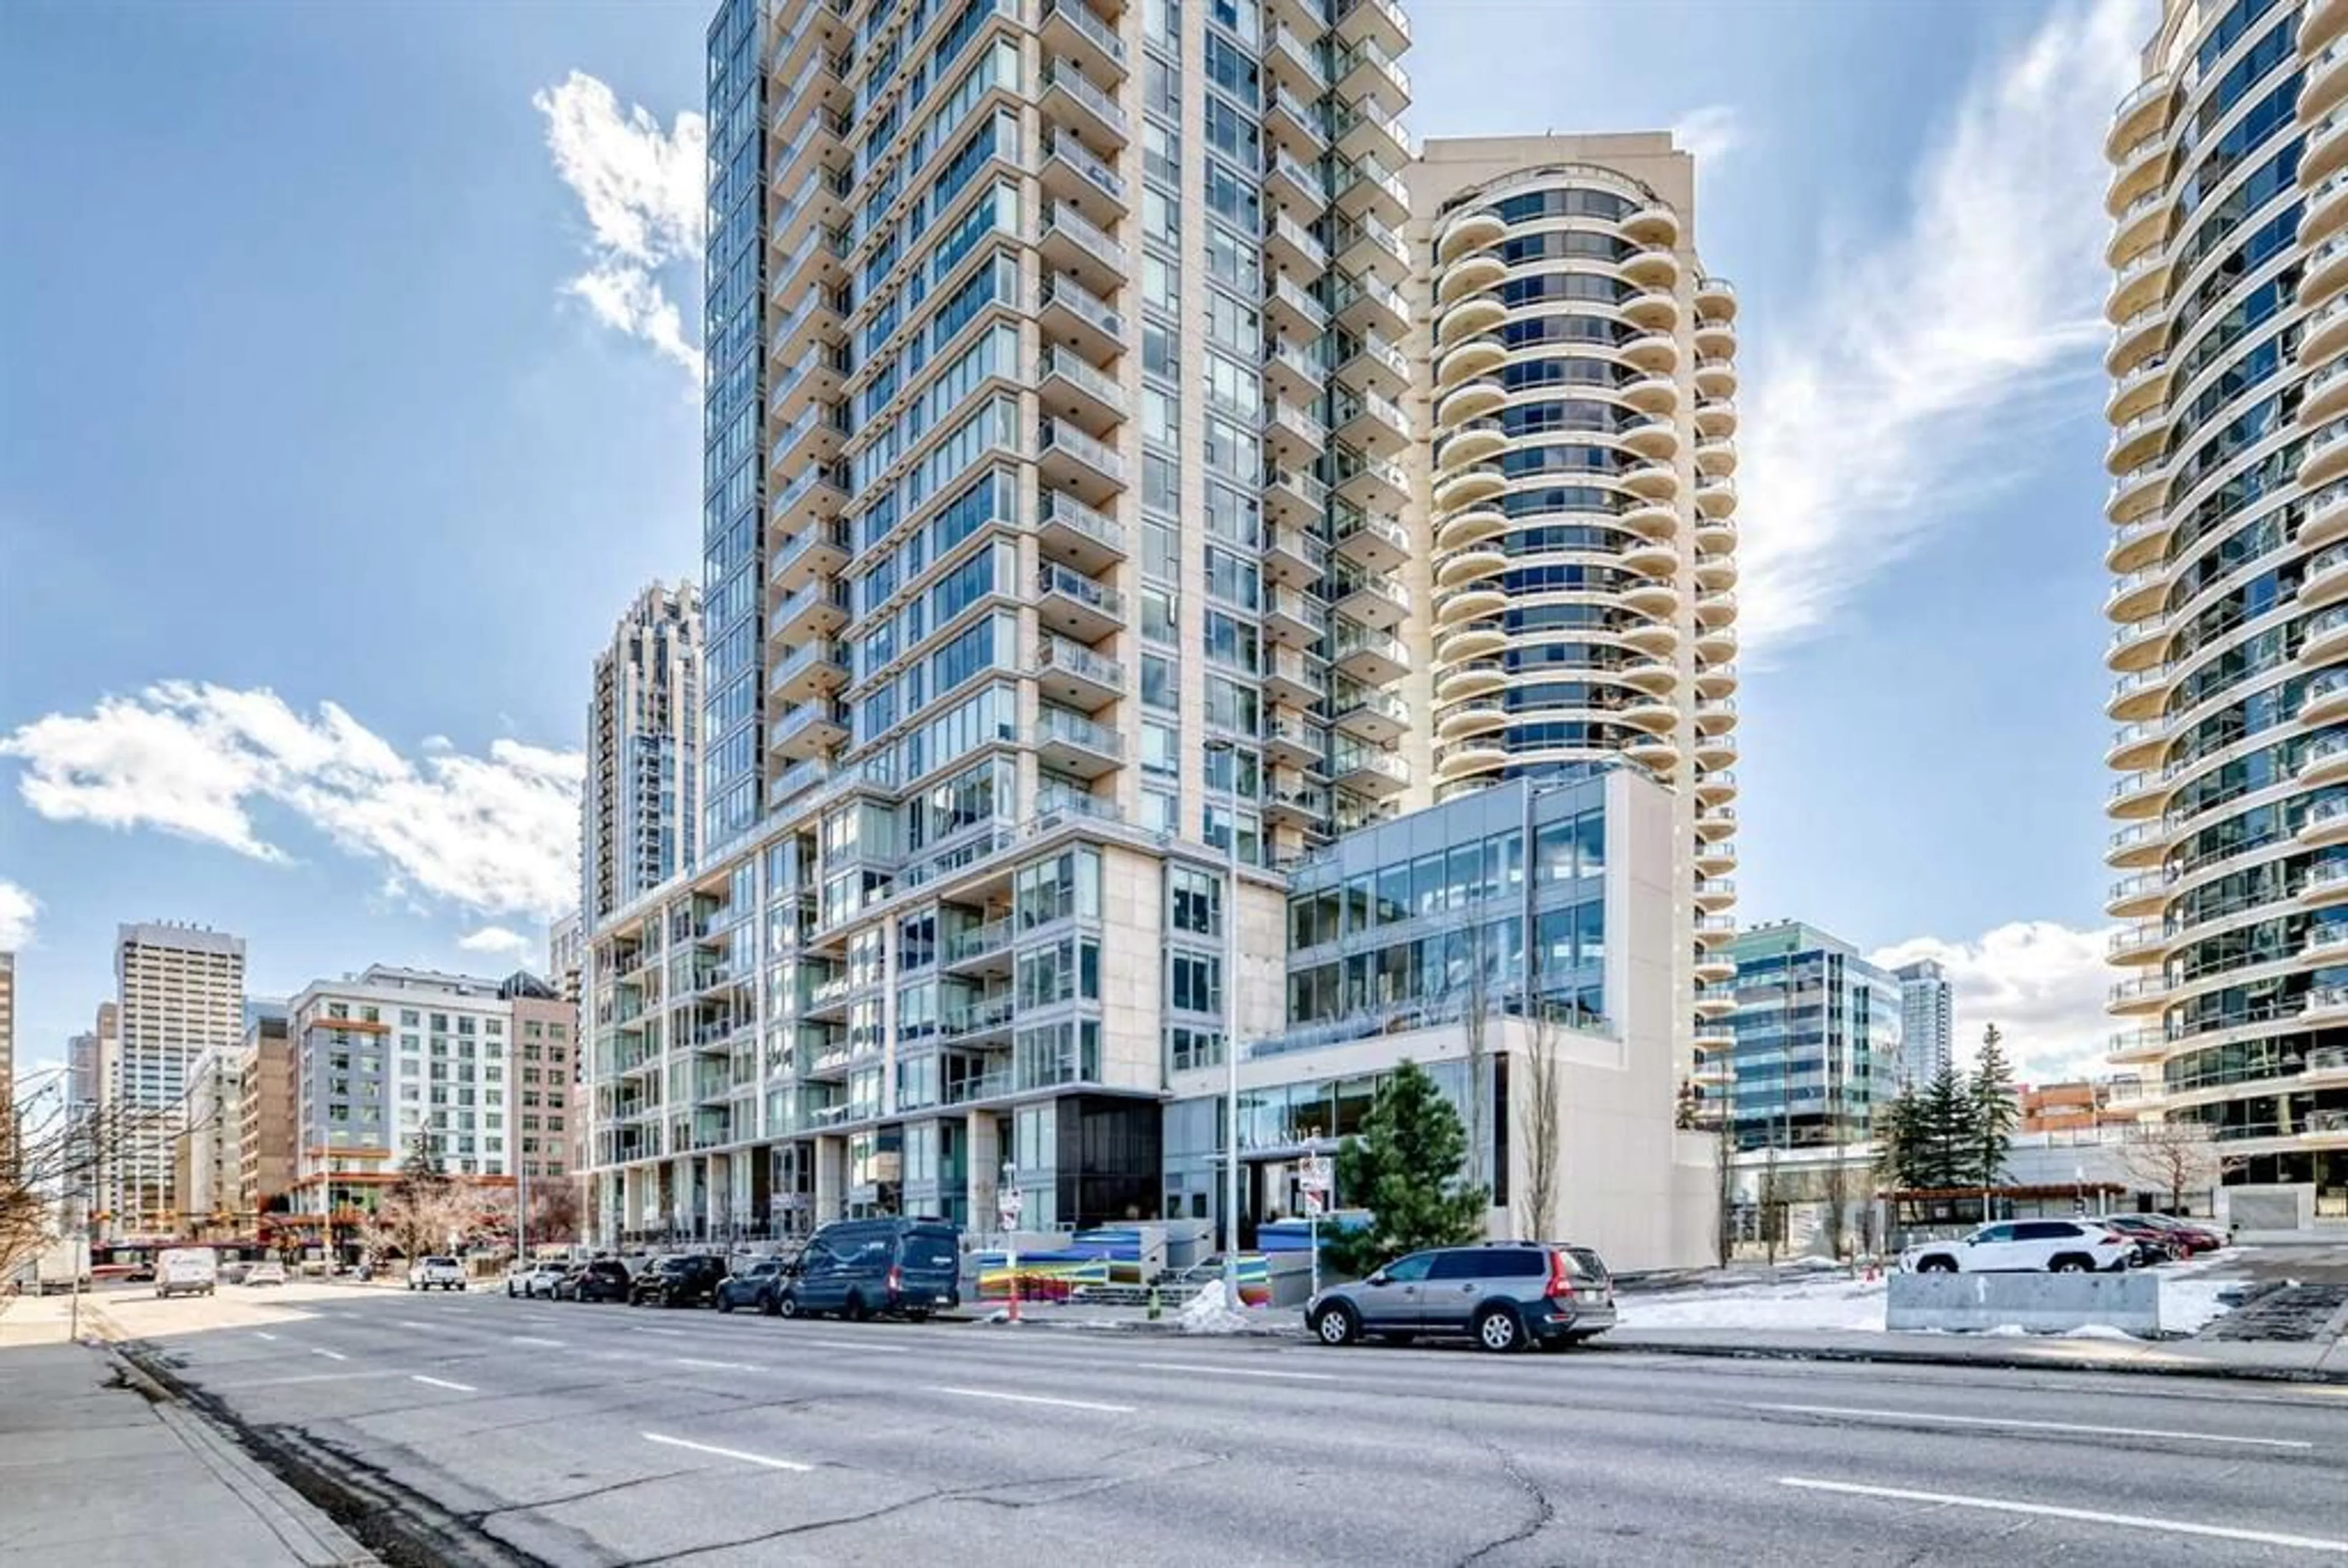
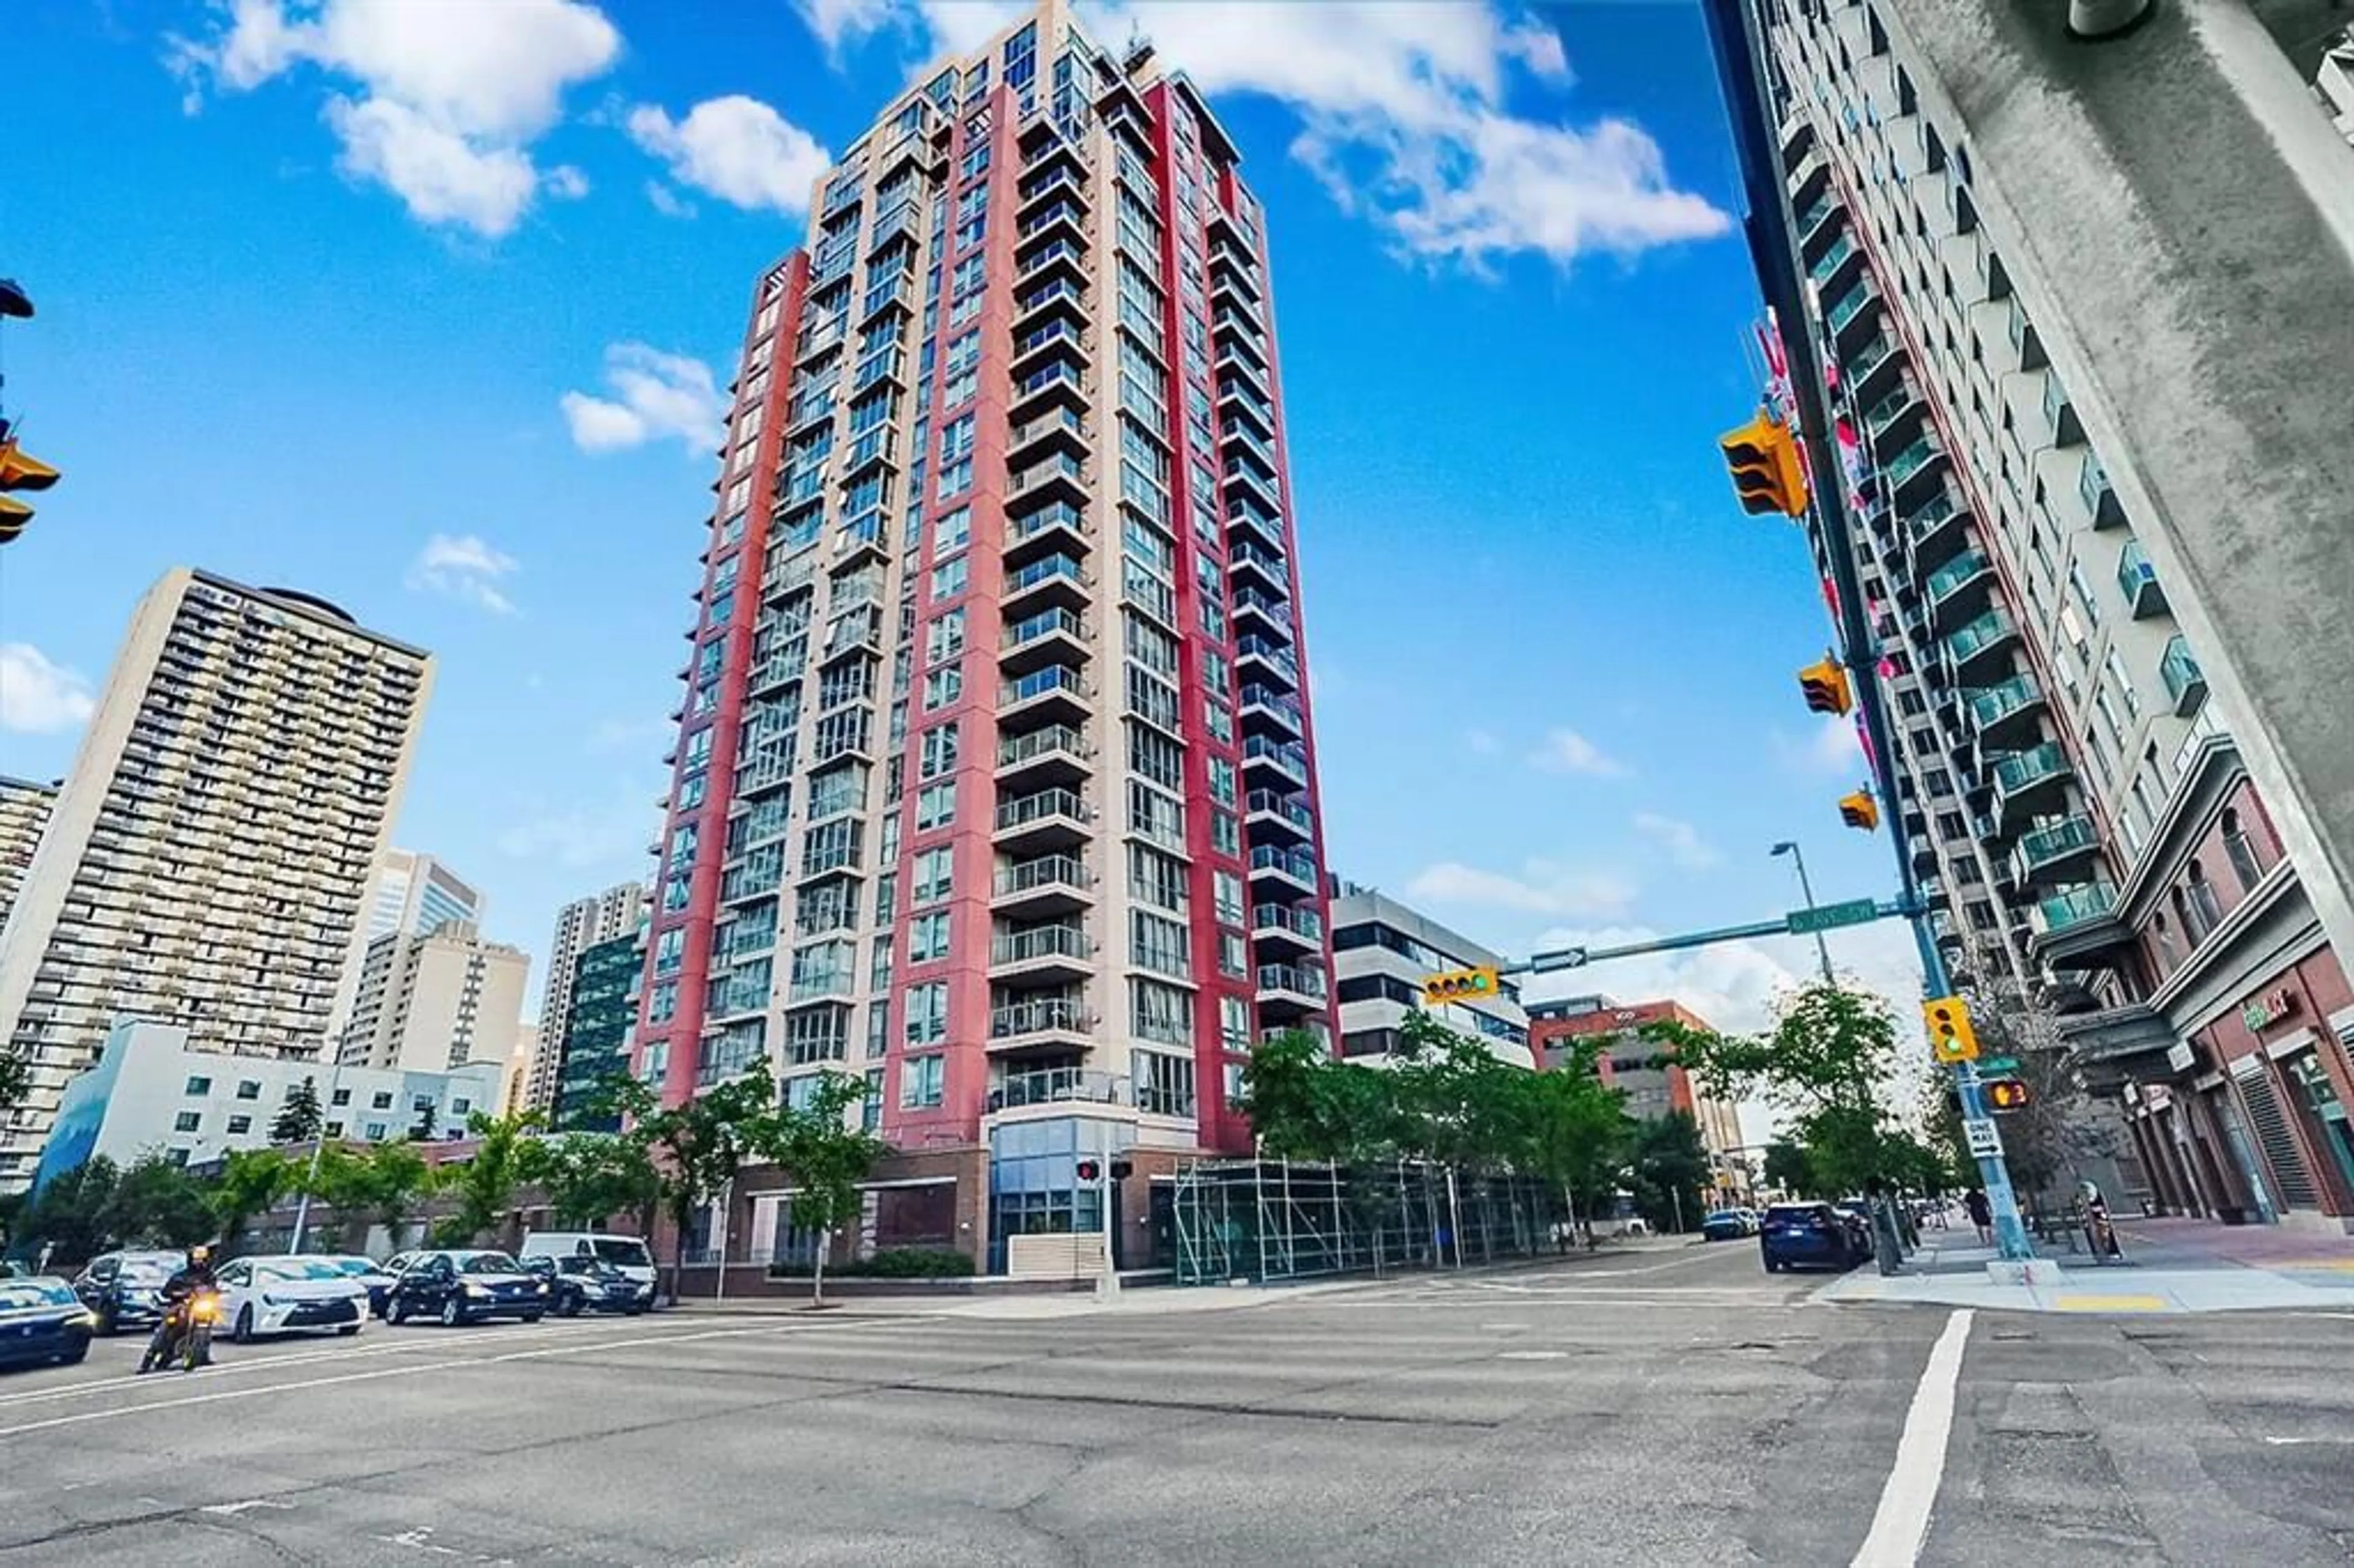
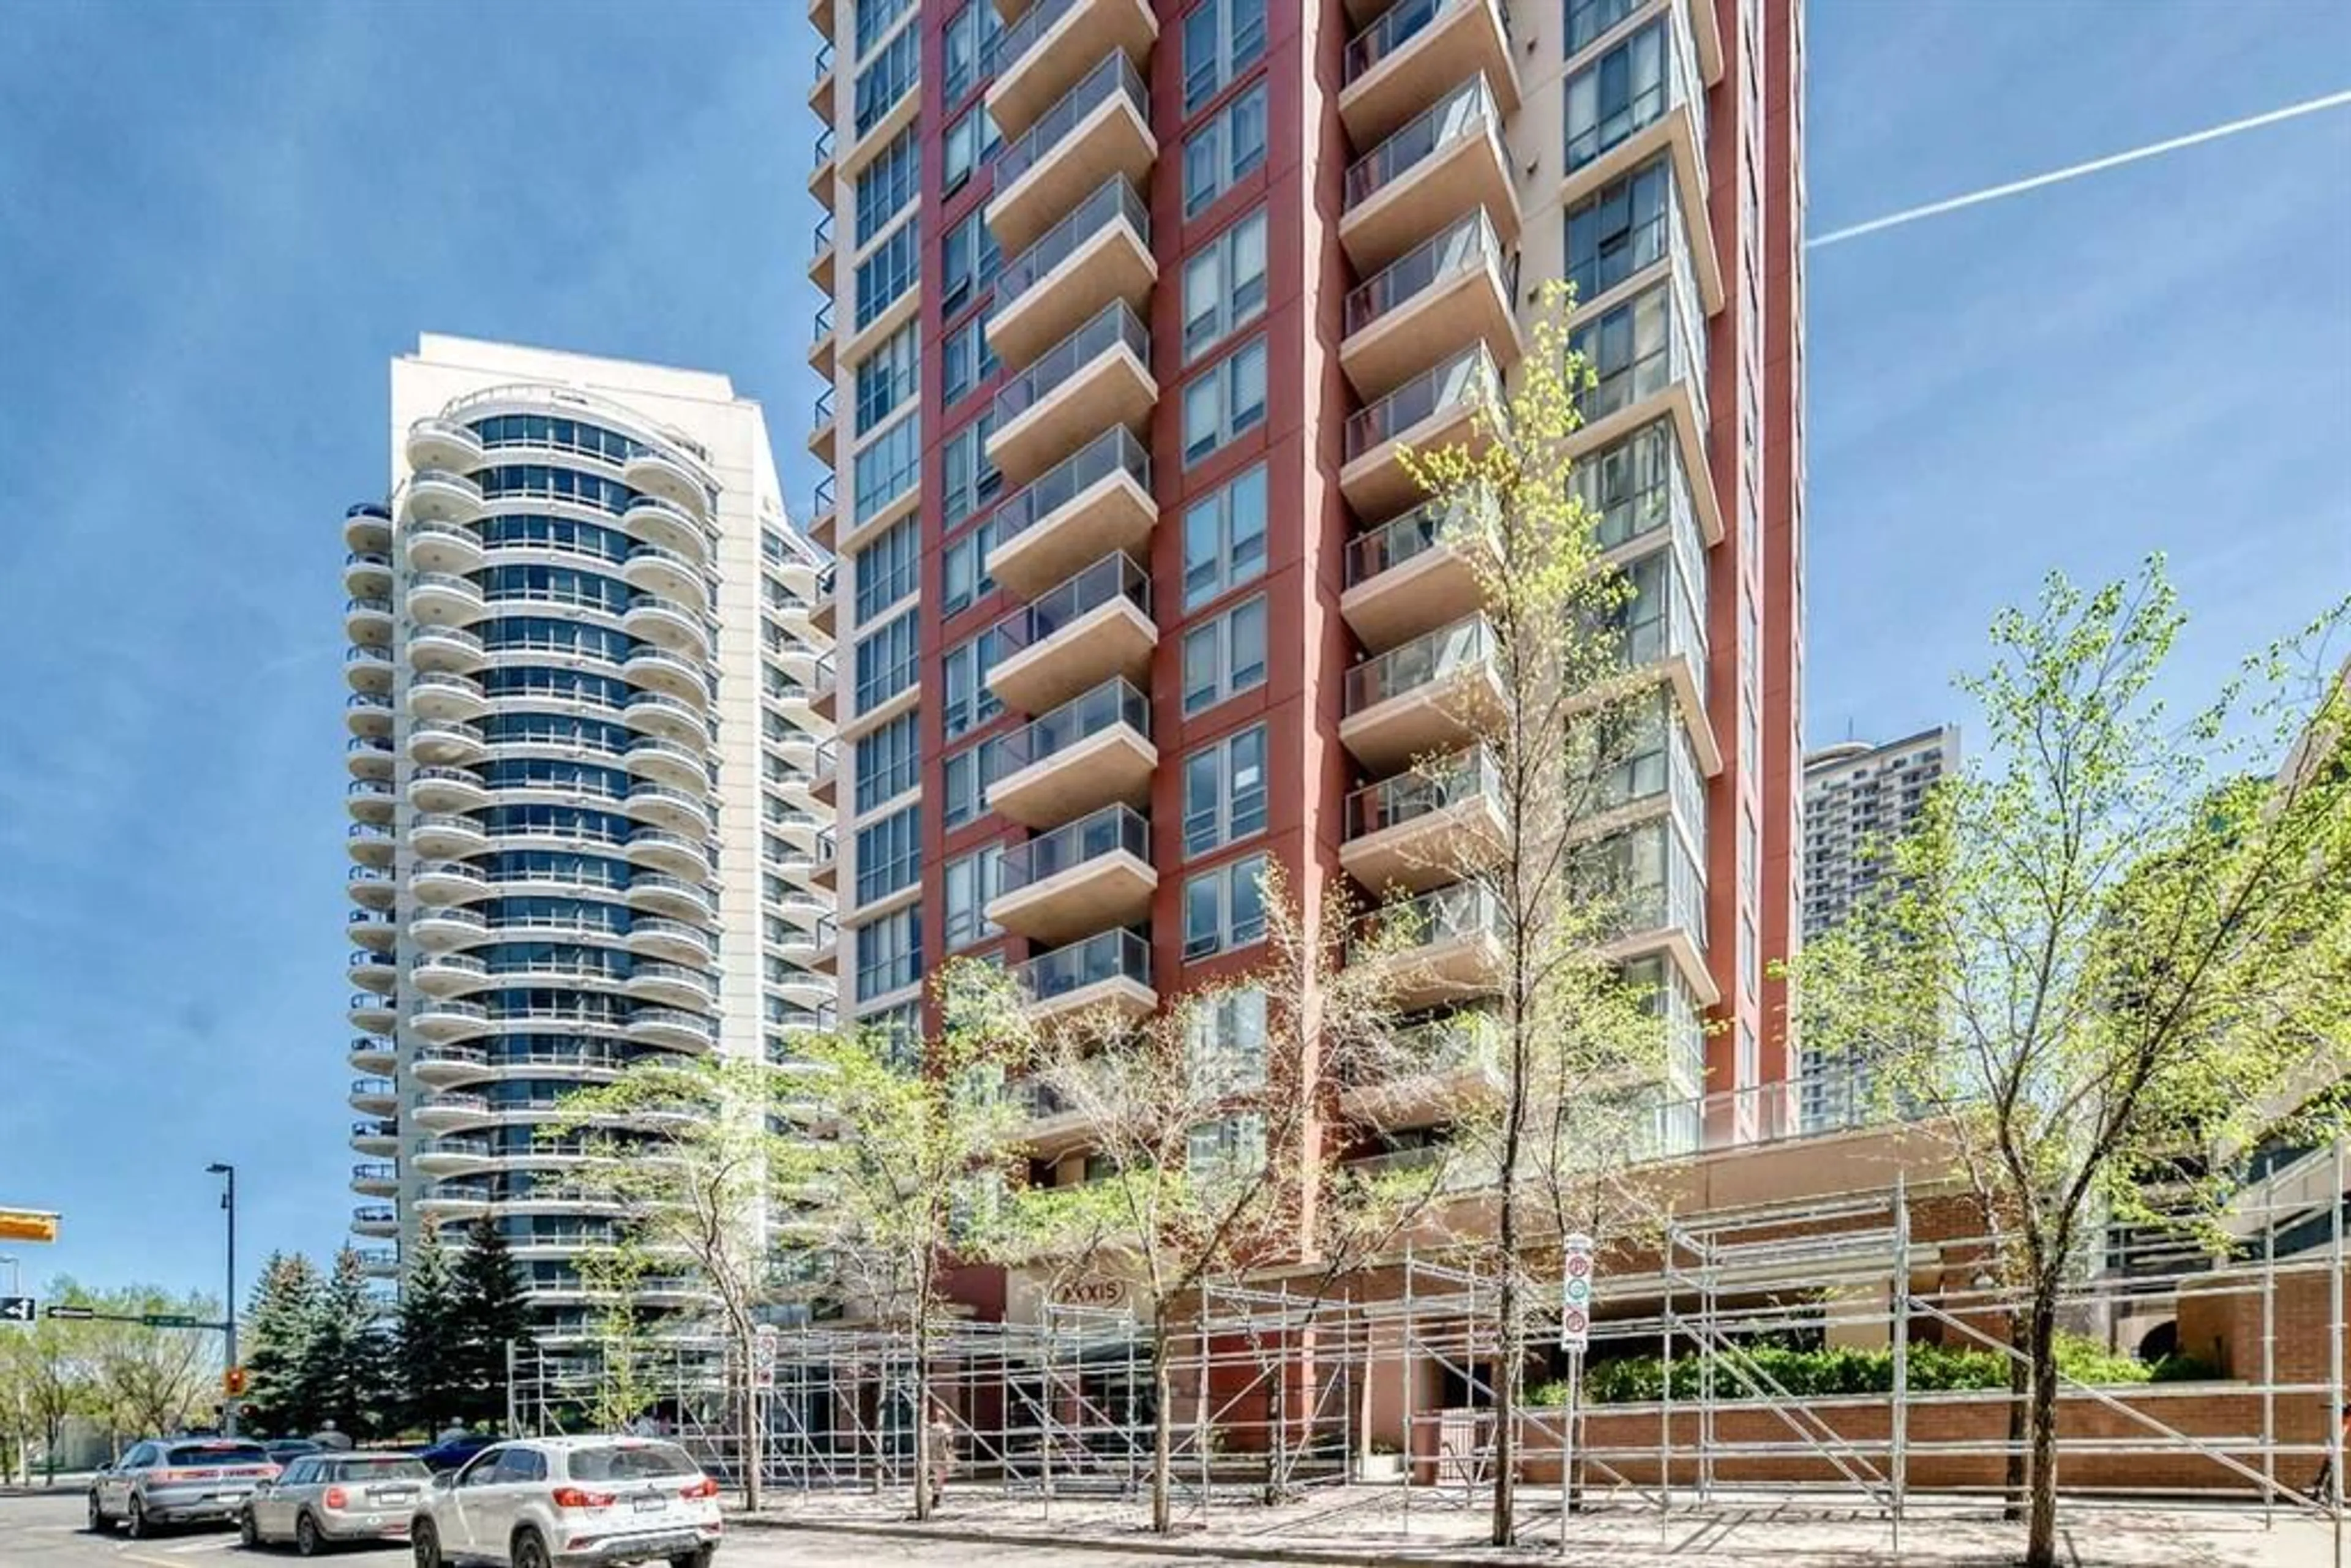
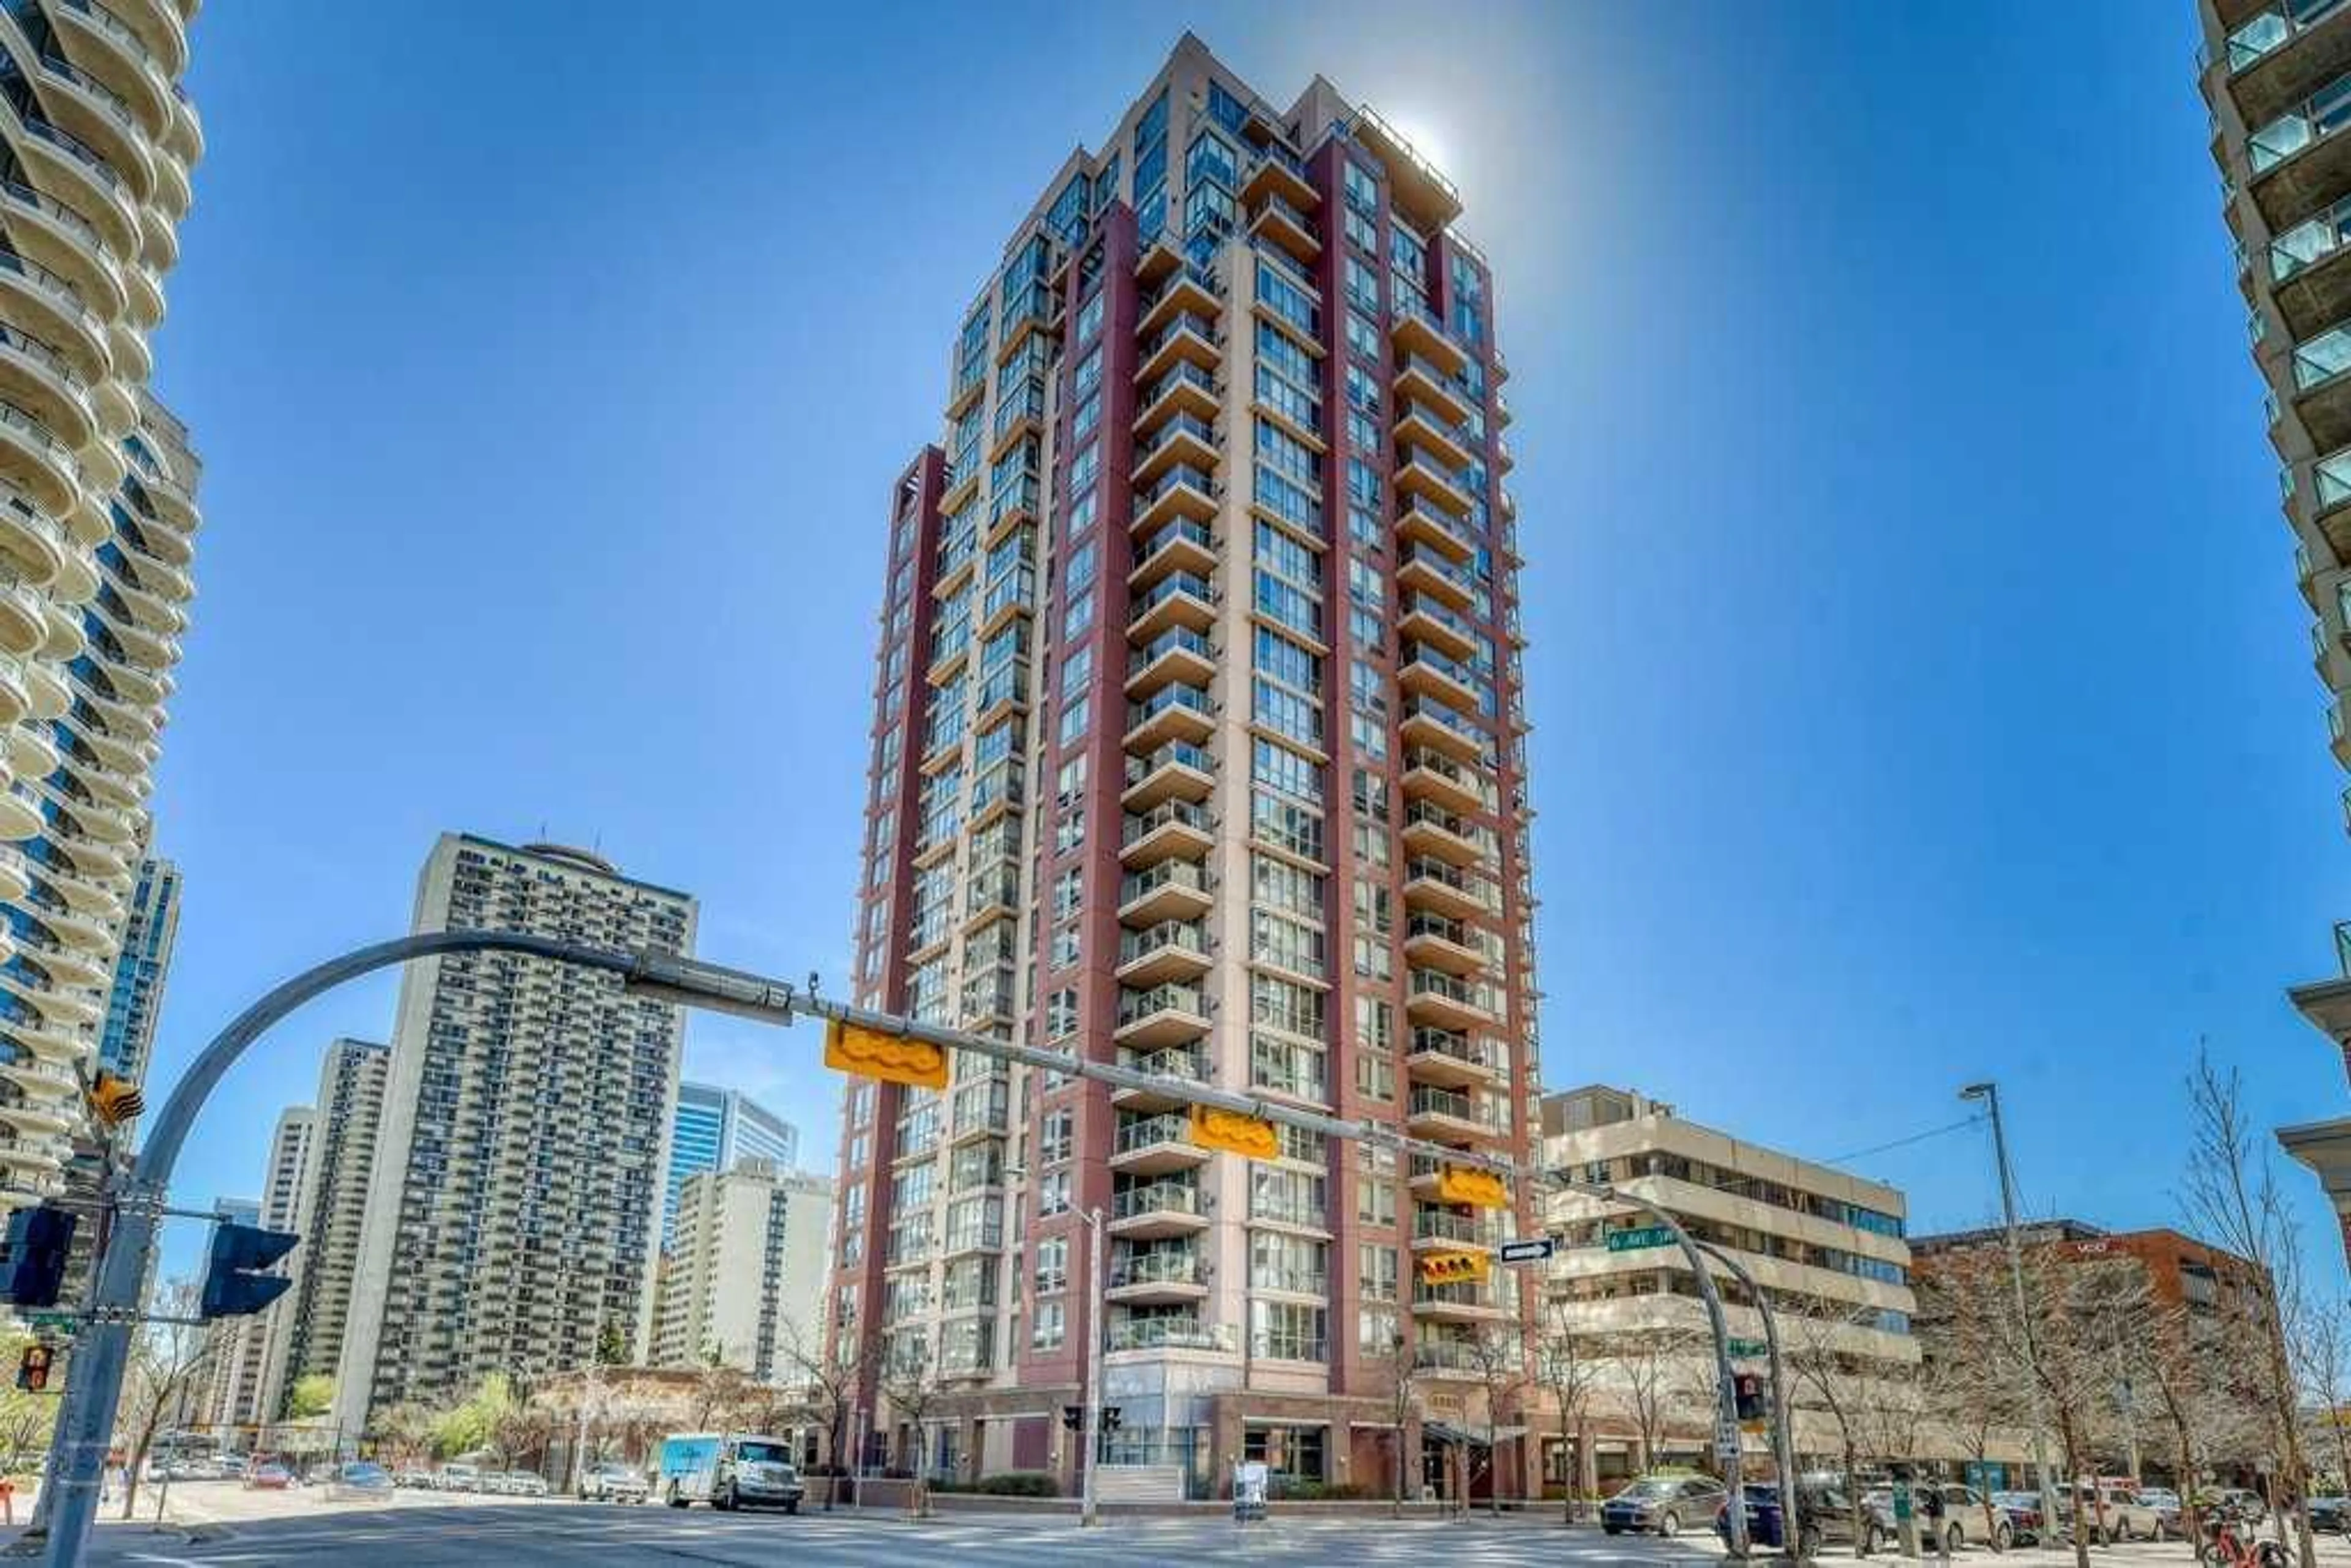
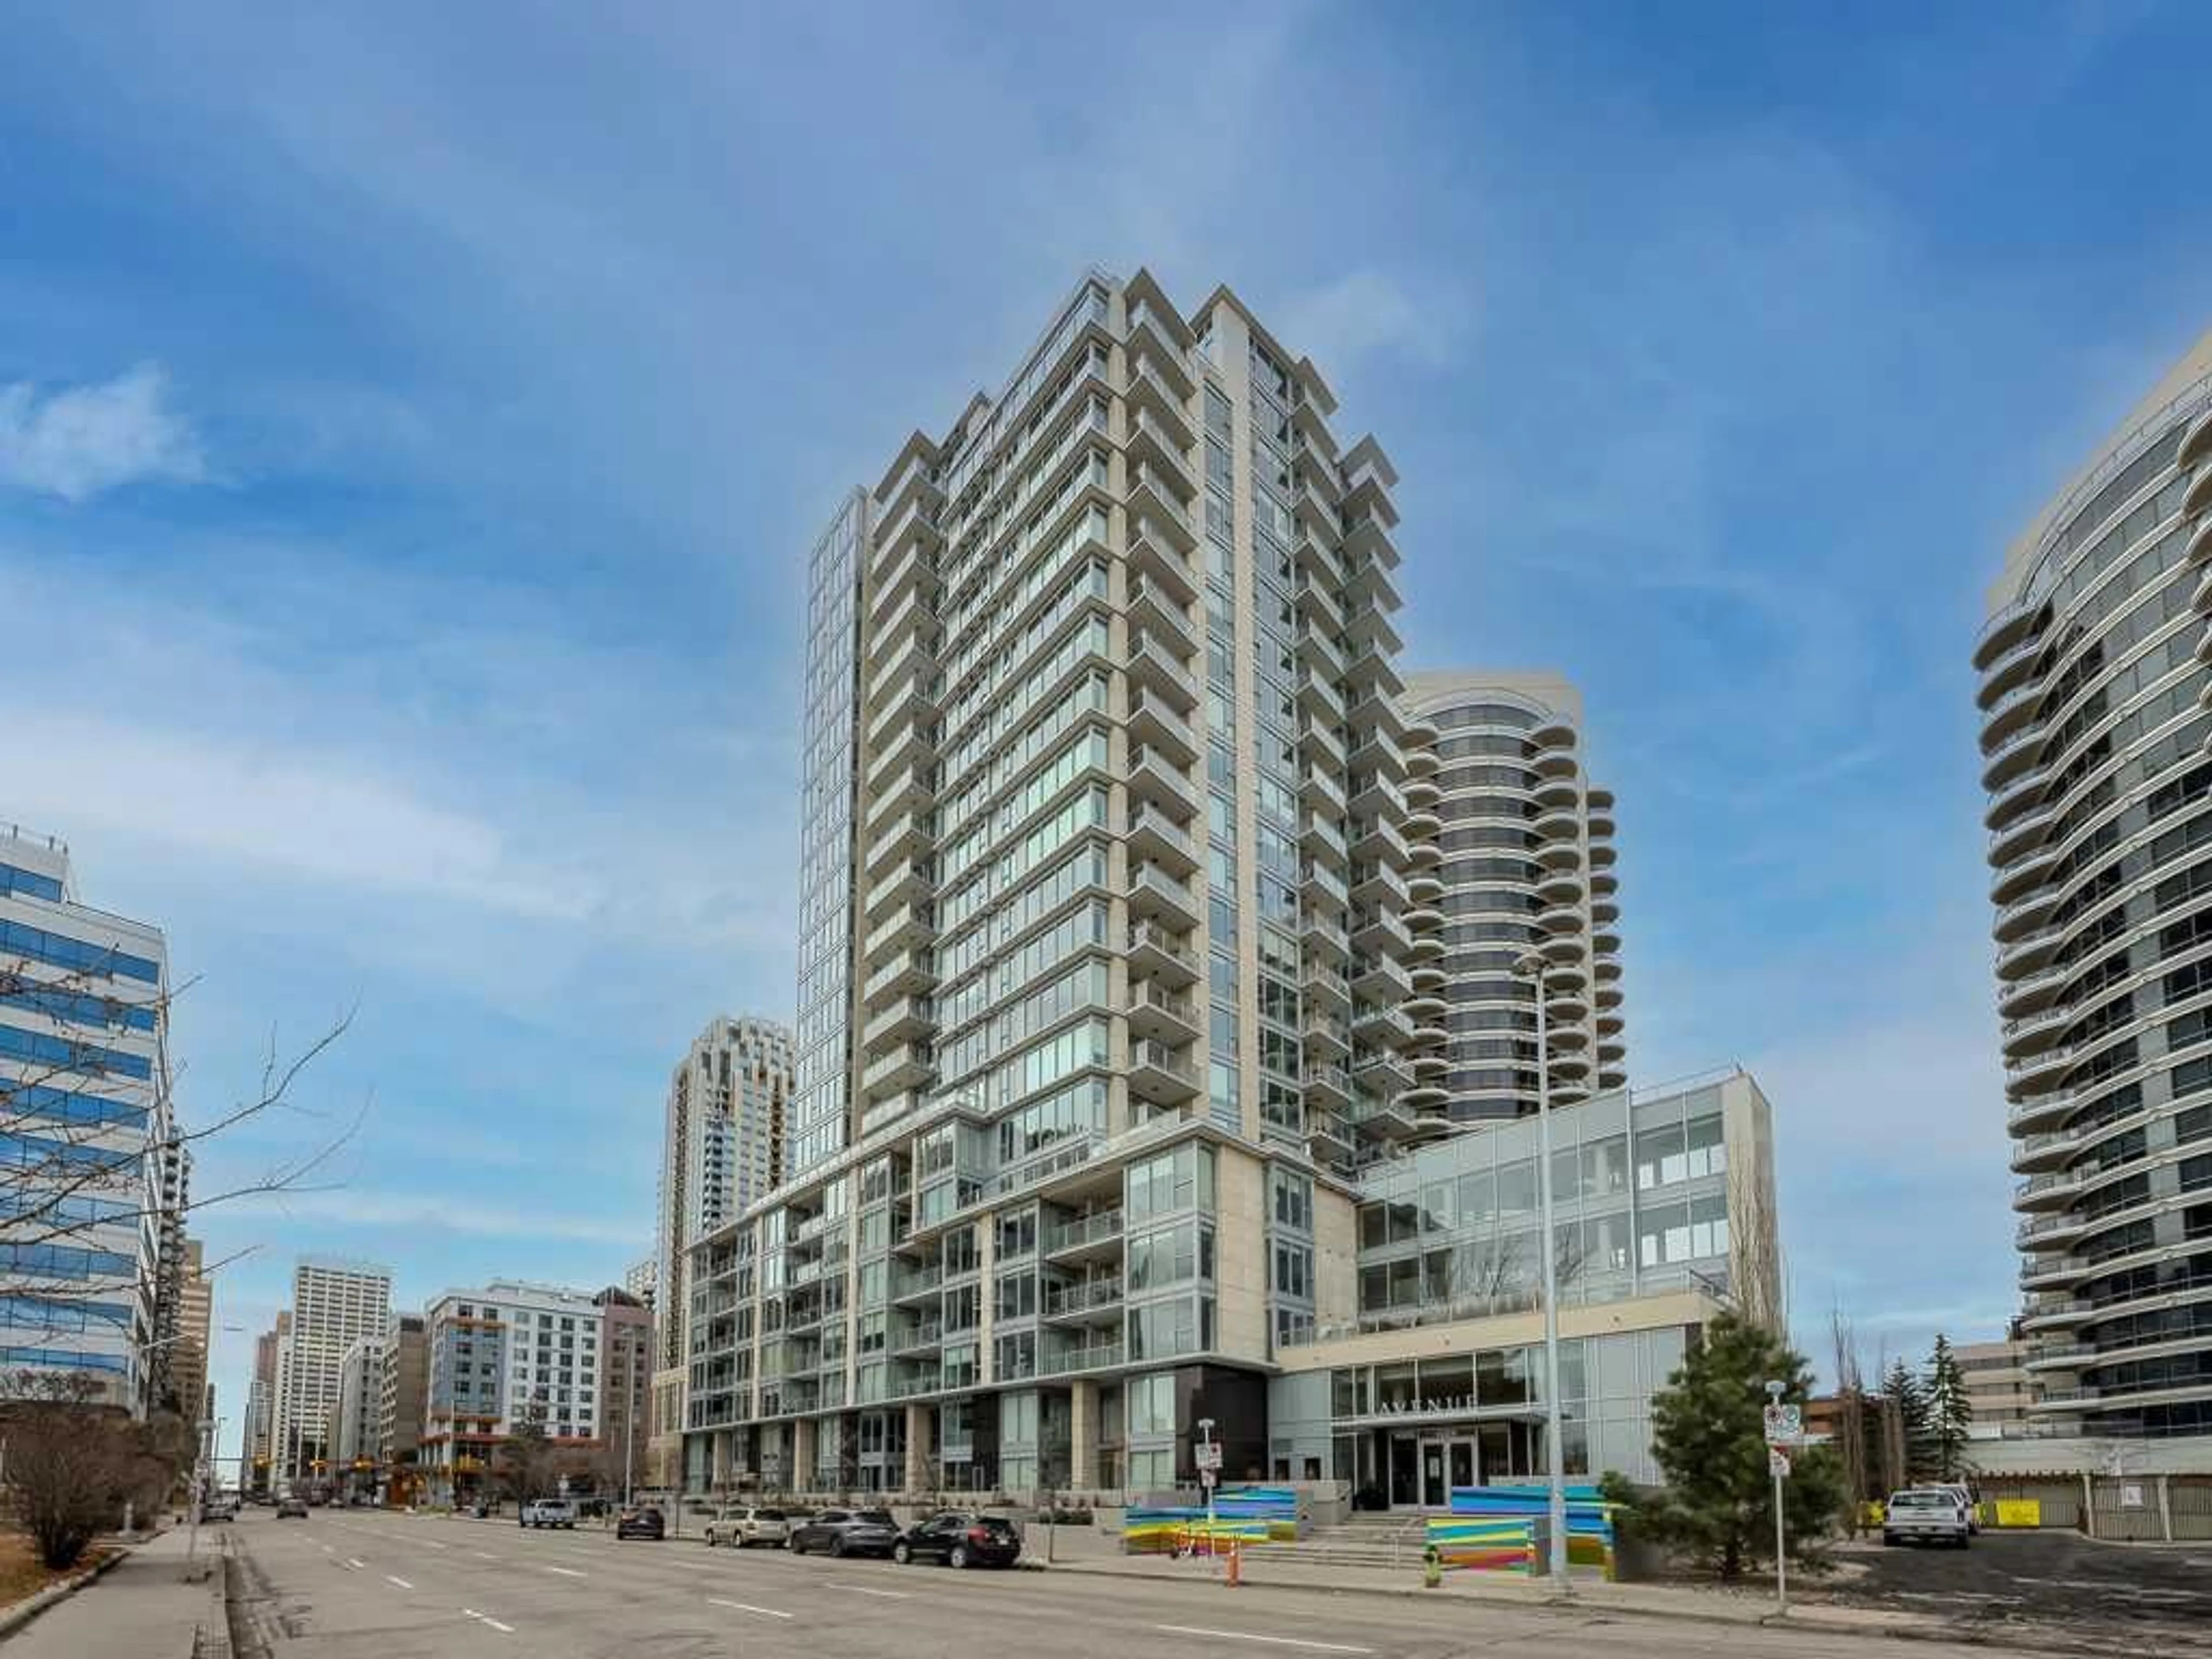
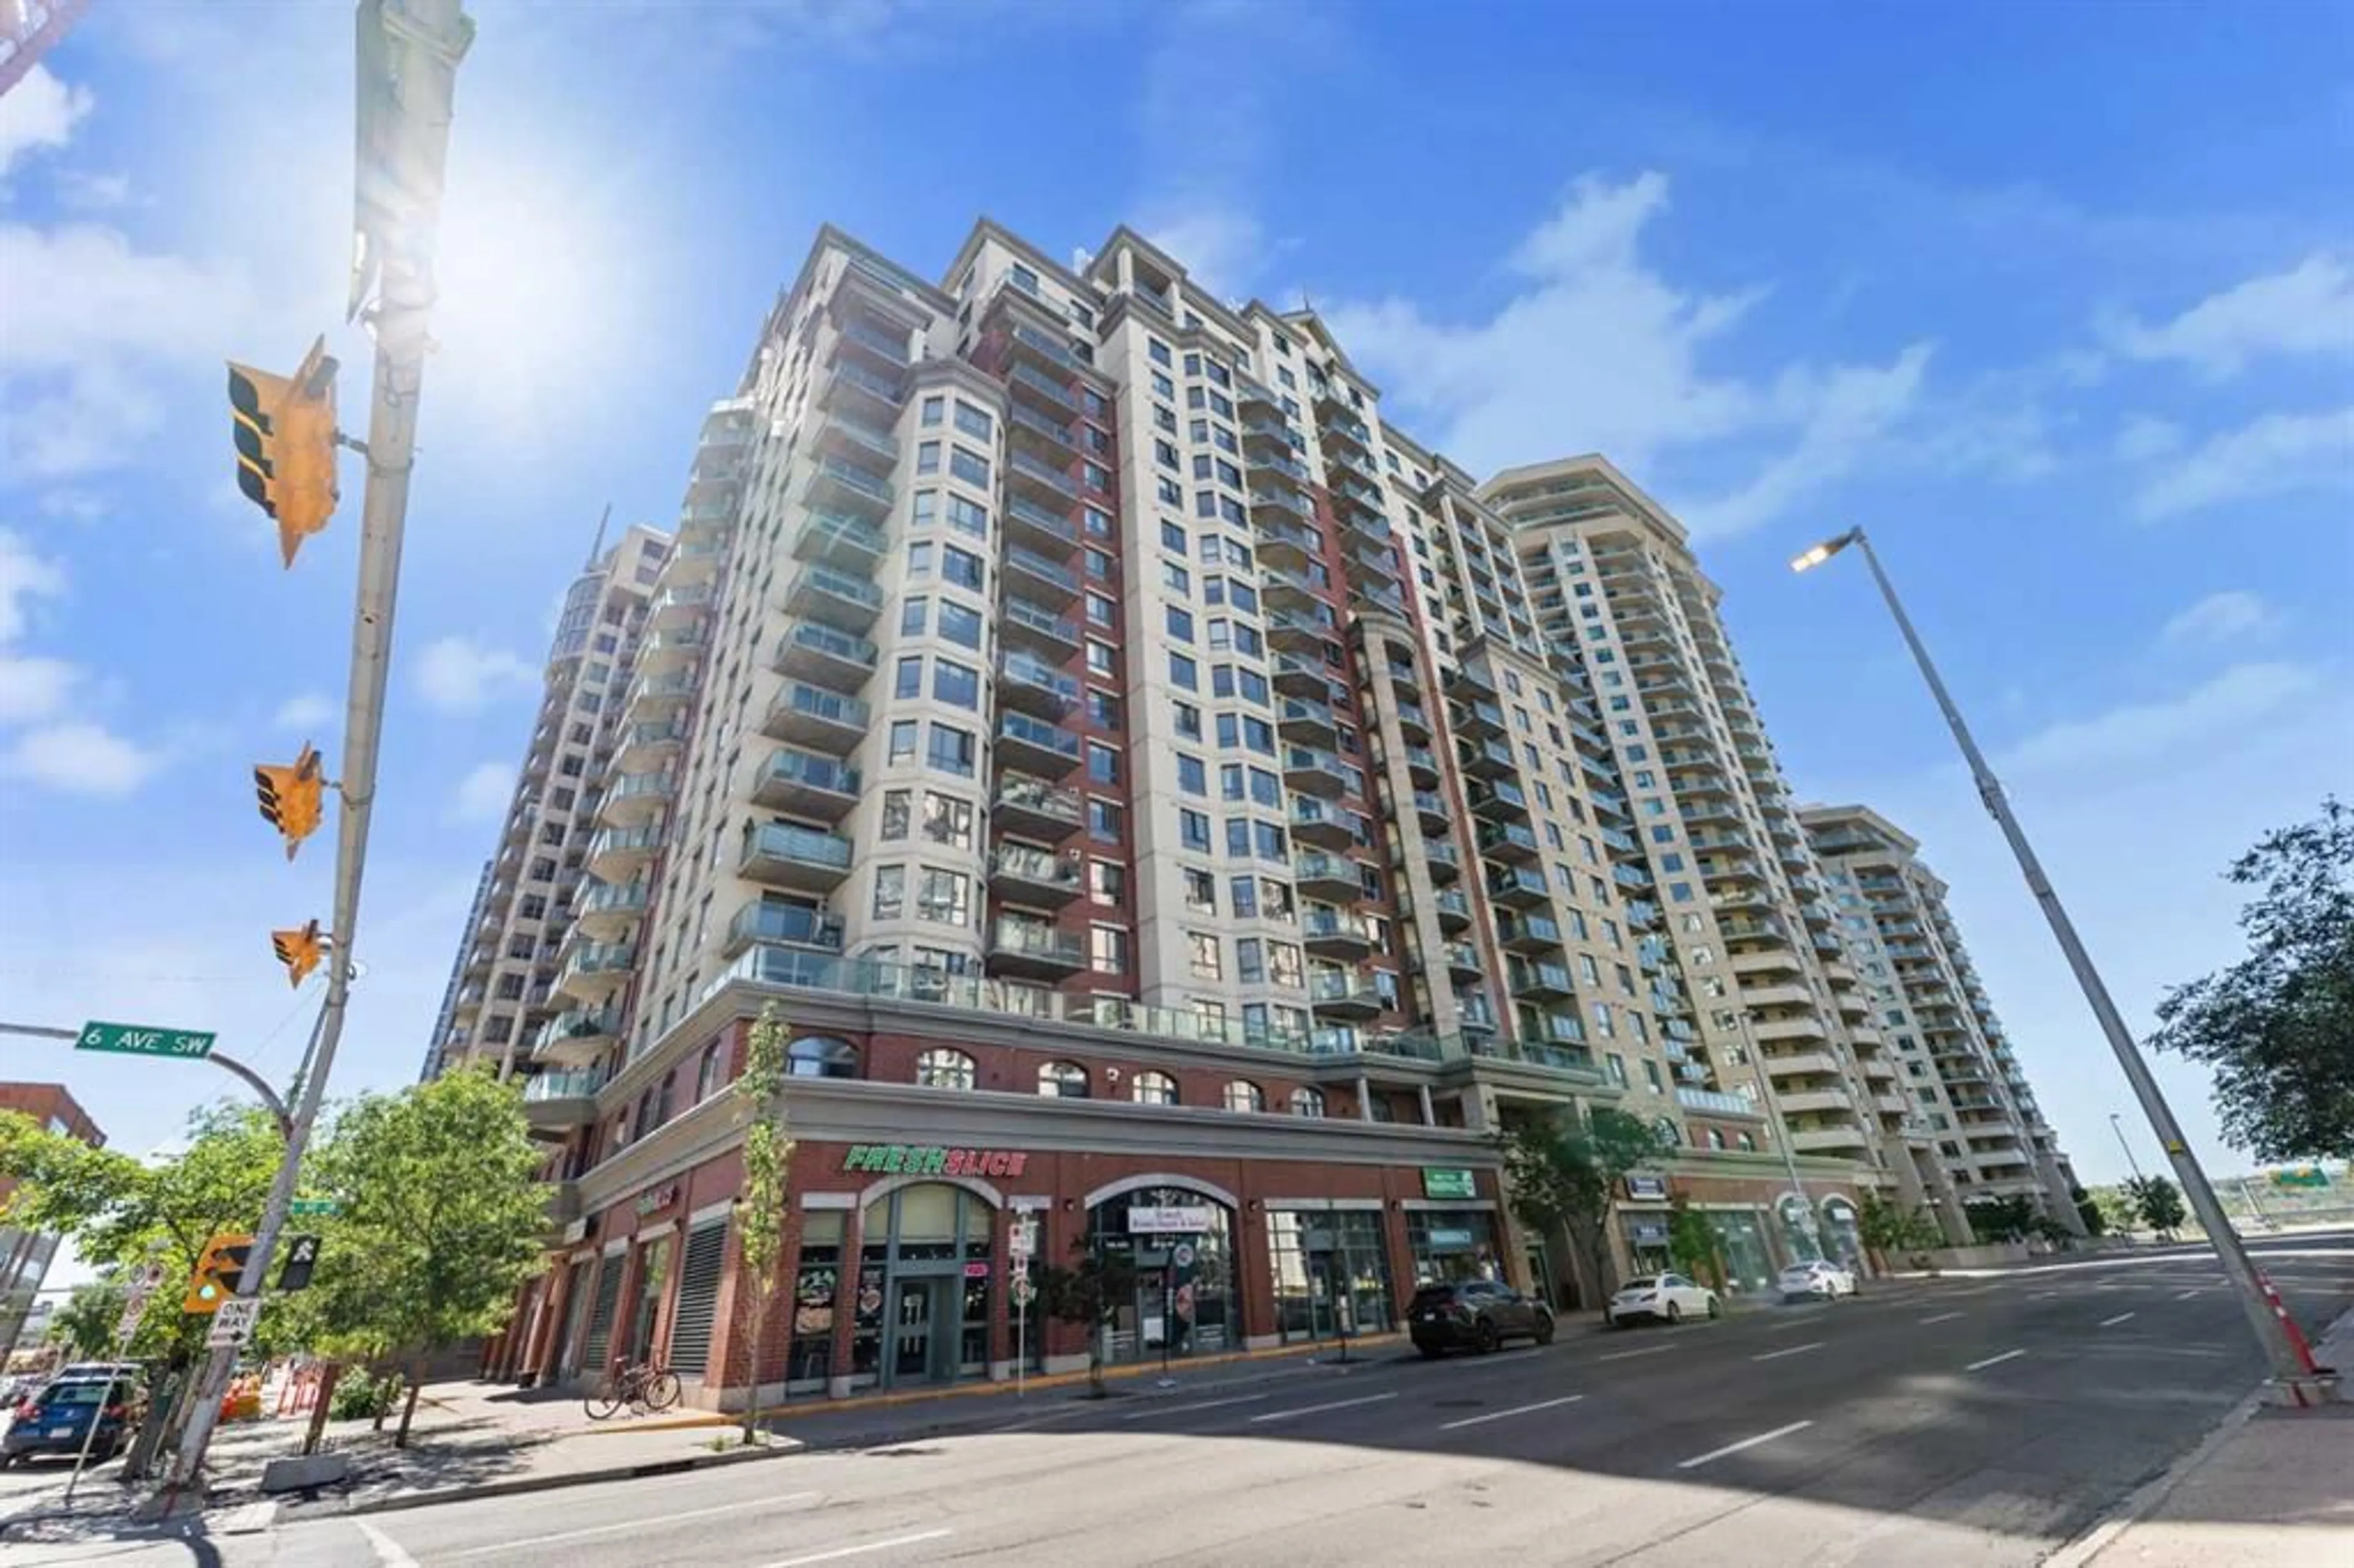
Downtown West End Housing Market Report
All types - for the month of June
8
62
Total Active Listings*
33 active
New
13(-27.78% YoY)
Relisted
-(- YoY)
Compared to number of active, same period, in 2025: 38, in 2024: 40, in 2023: 33
Total Sold Listings*
4 sold
Median Sold Price
$285,500
Avg Days on Market
62 days
Median Bidding
-$9,400
Compared to number of sold, same period, in 2025: 9, in 2024: 19, in 2023: 13
*Data is for the month of June
Median Sold Price vs Average Days and Average Total Days on Market - Downtown West End - All types
Sold vs Active vs New vs Relisted - Downtown West End - All types
Sold Price Distribution - Downtown West End - All types
Sold price distribution per the last 3 months's sold listings.
Property Type Distribution - Downtown West End - All types
Property type distribution based on data from the last 3 months.
Median Price - Downtown West End - All types
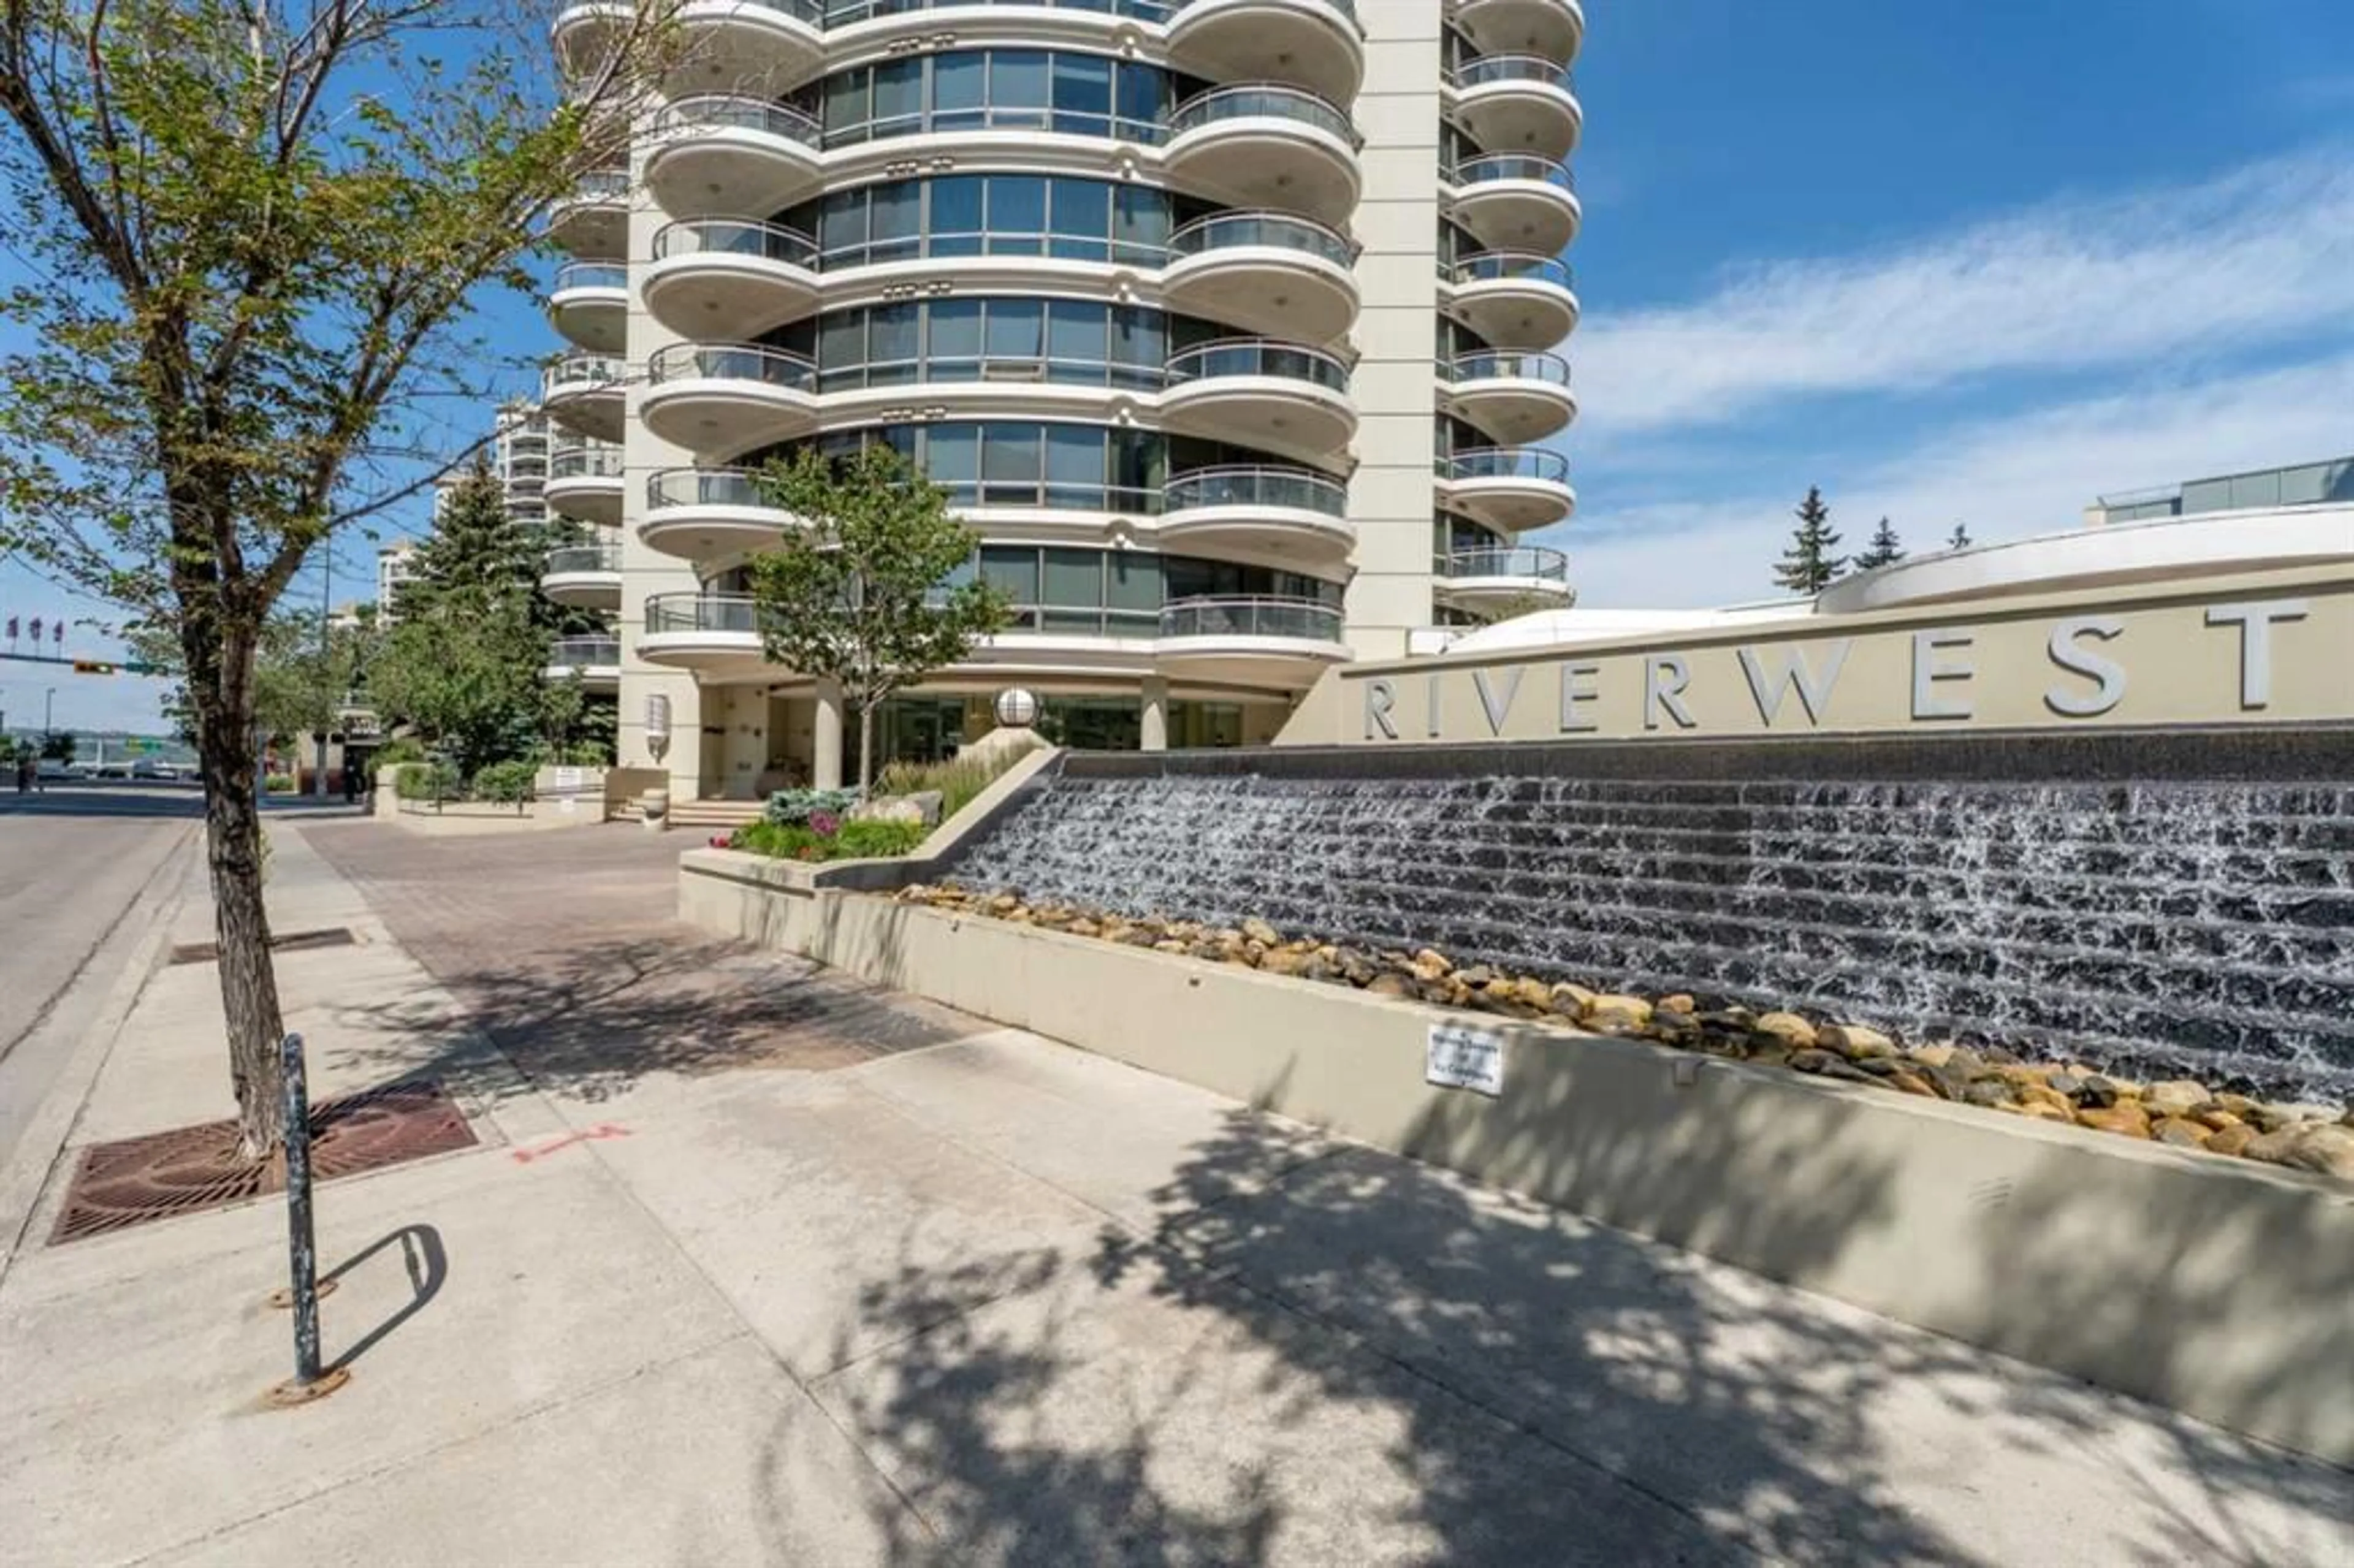
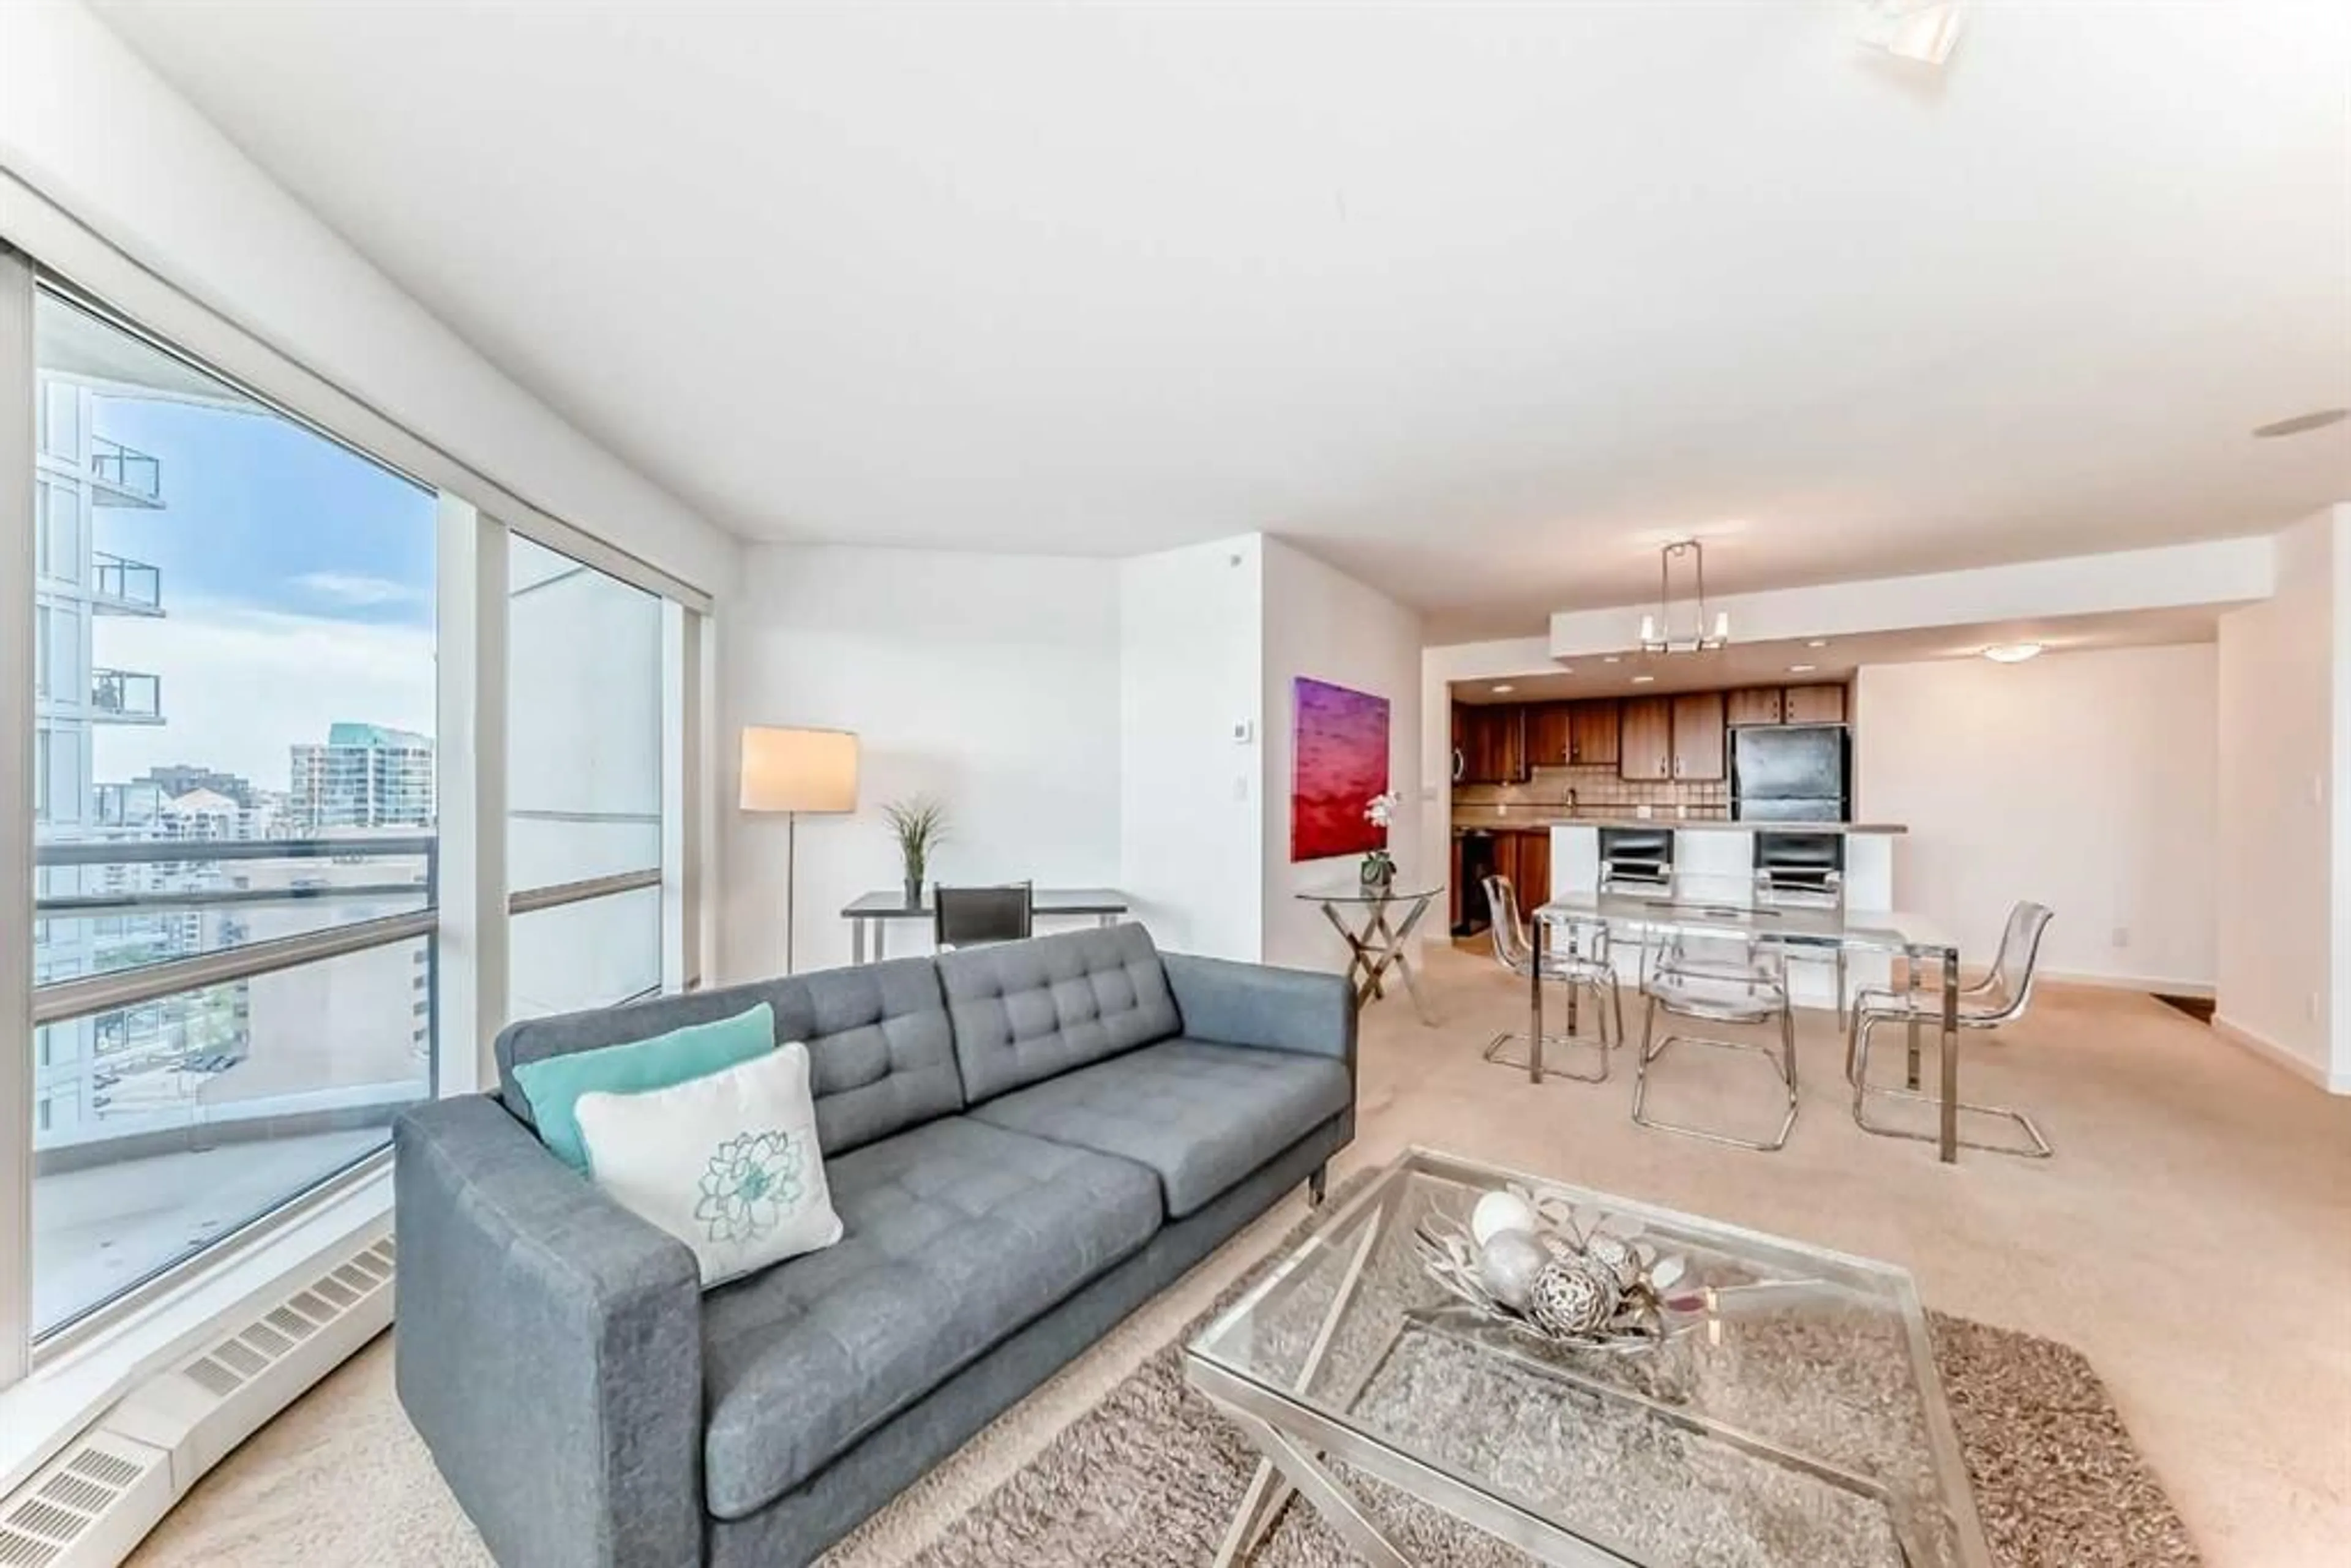
Just listed - Downtown West End
View all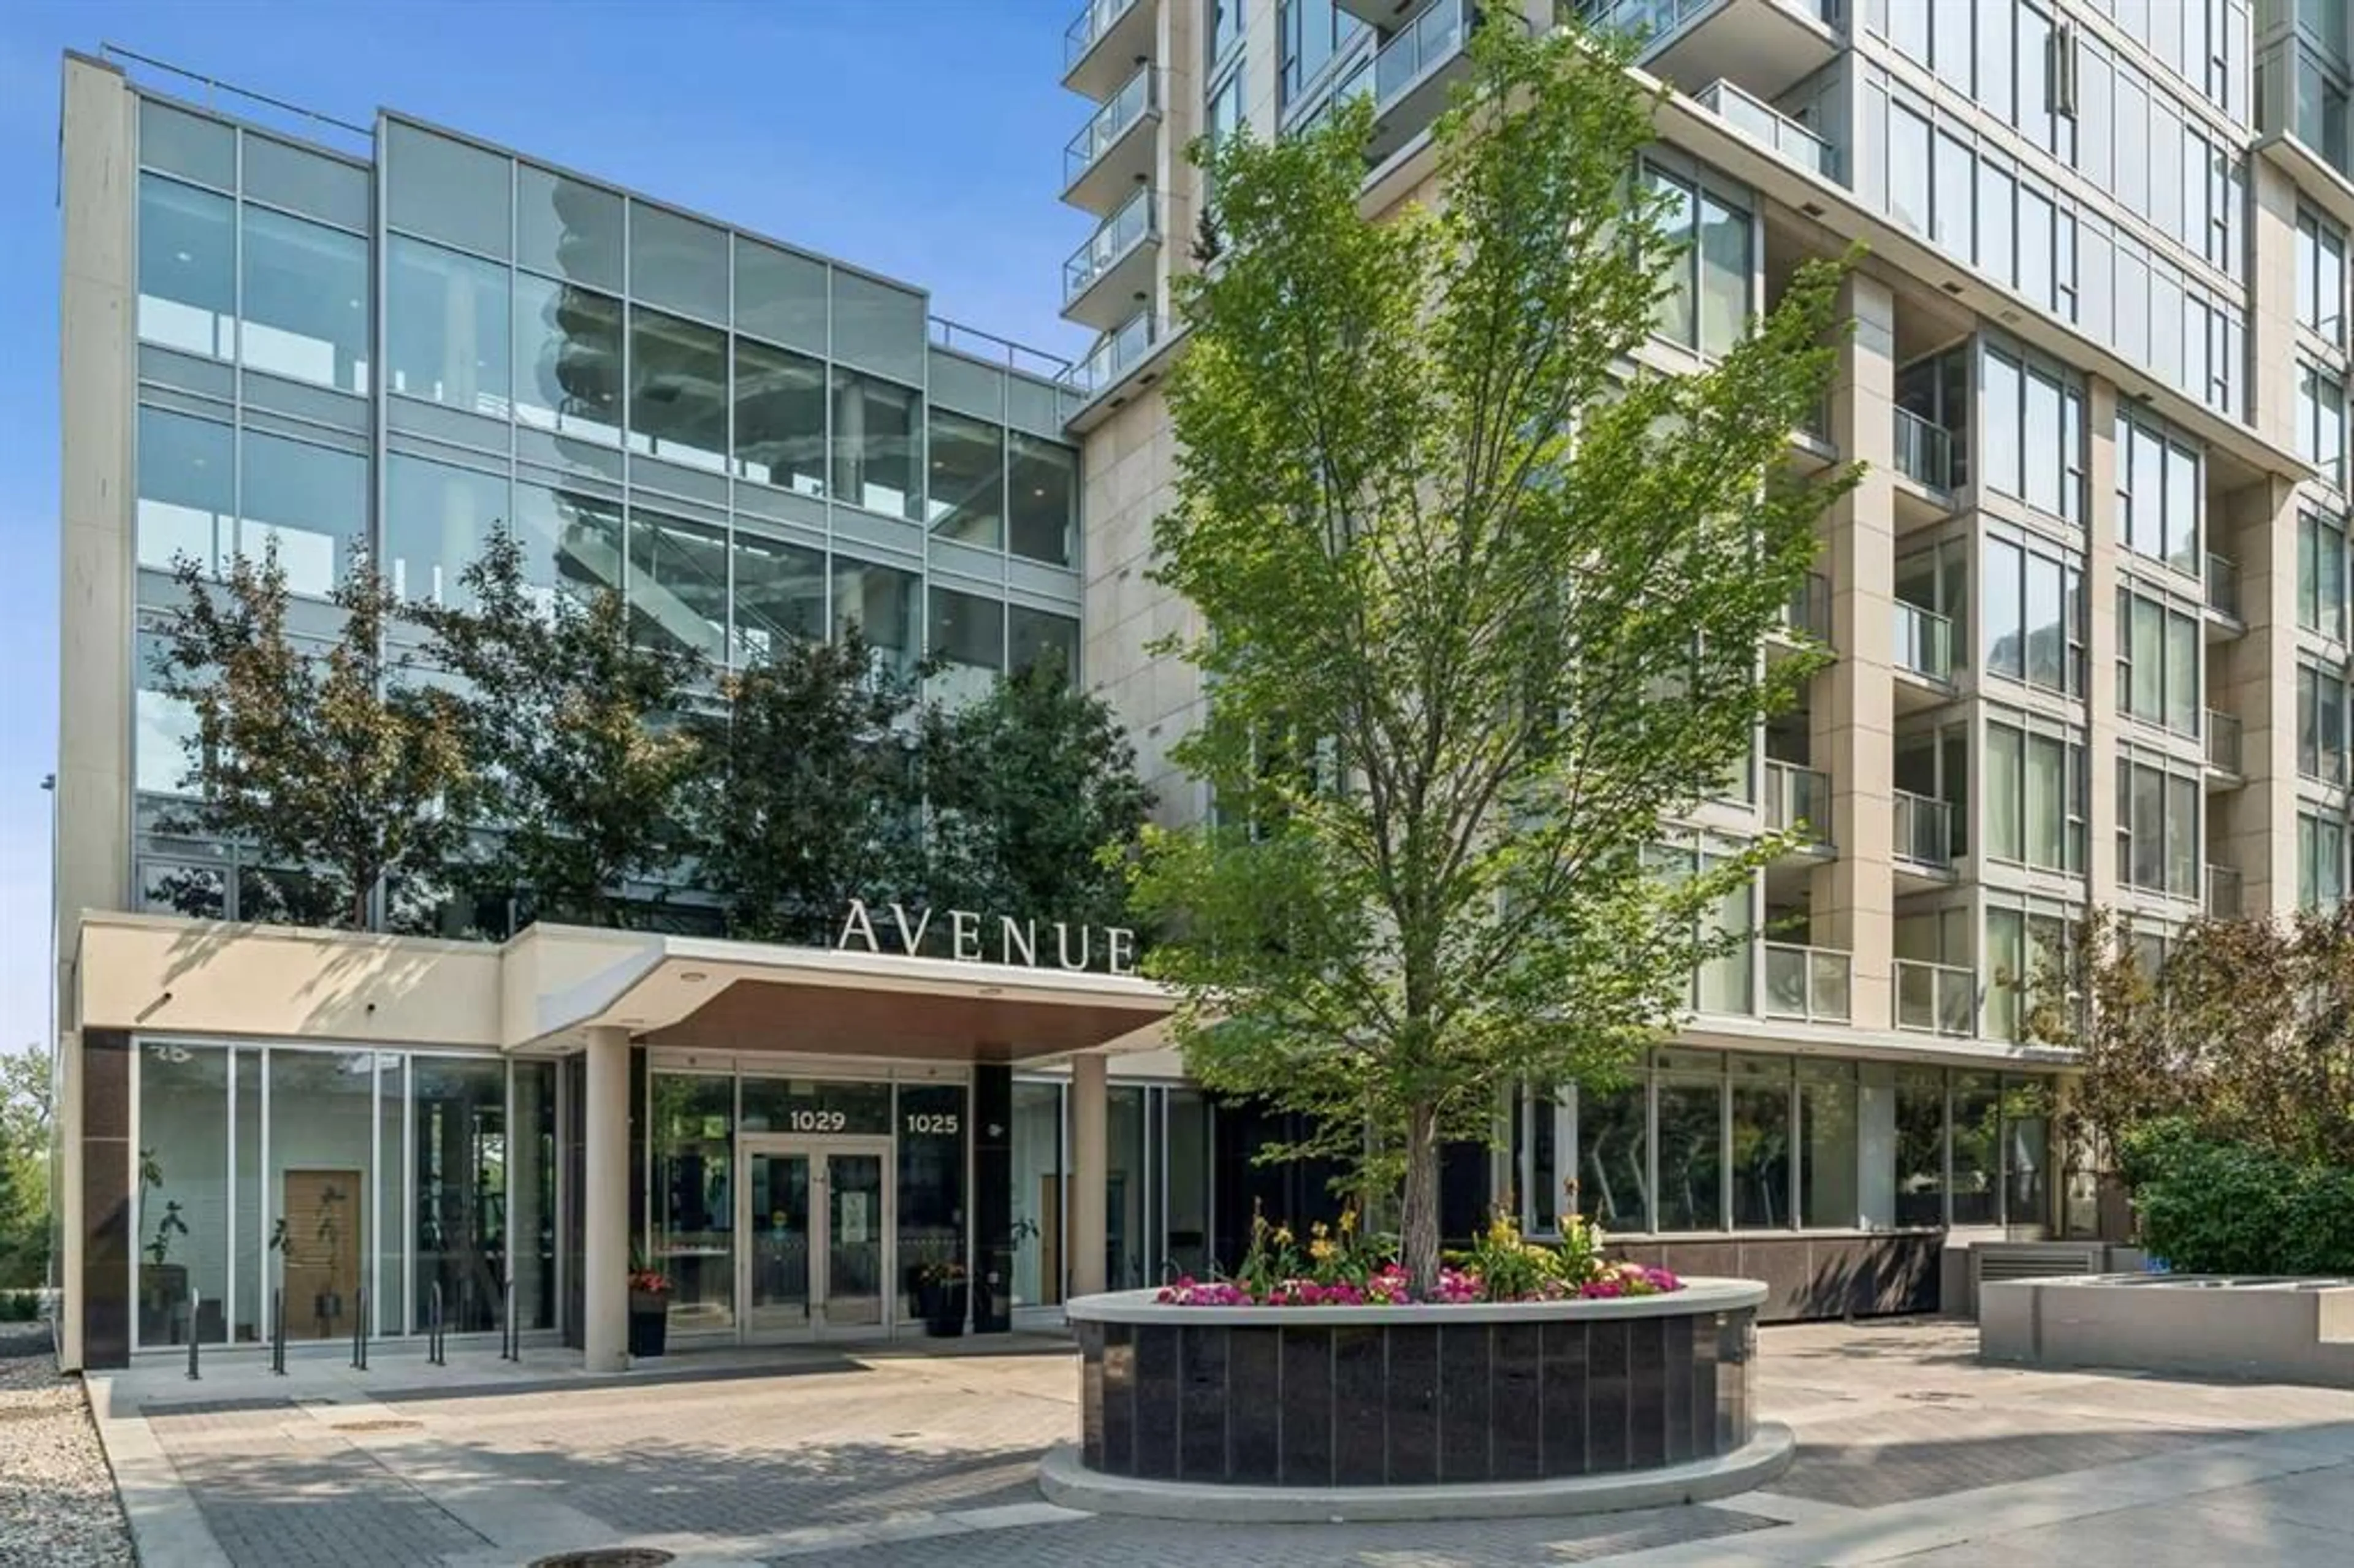


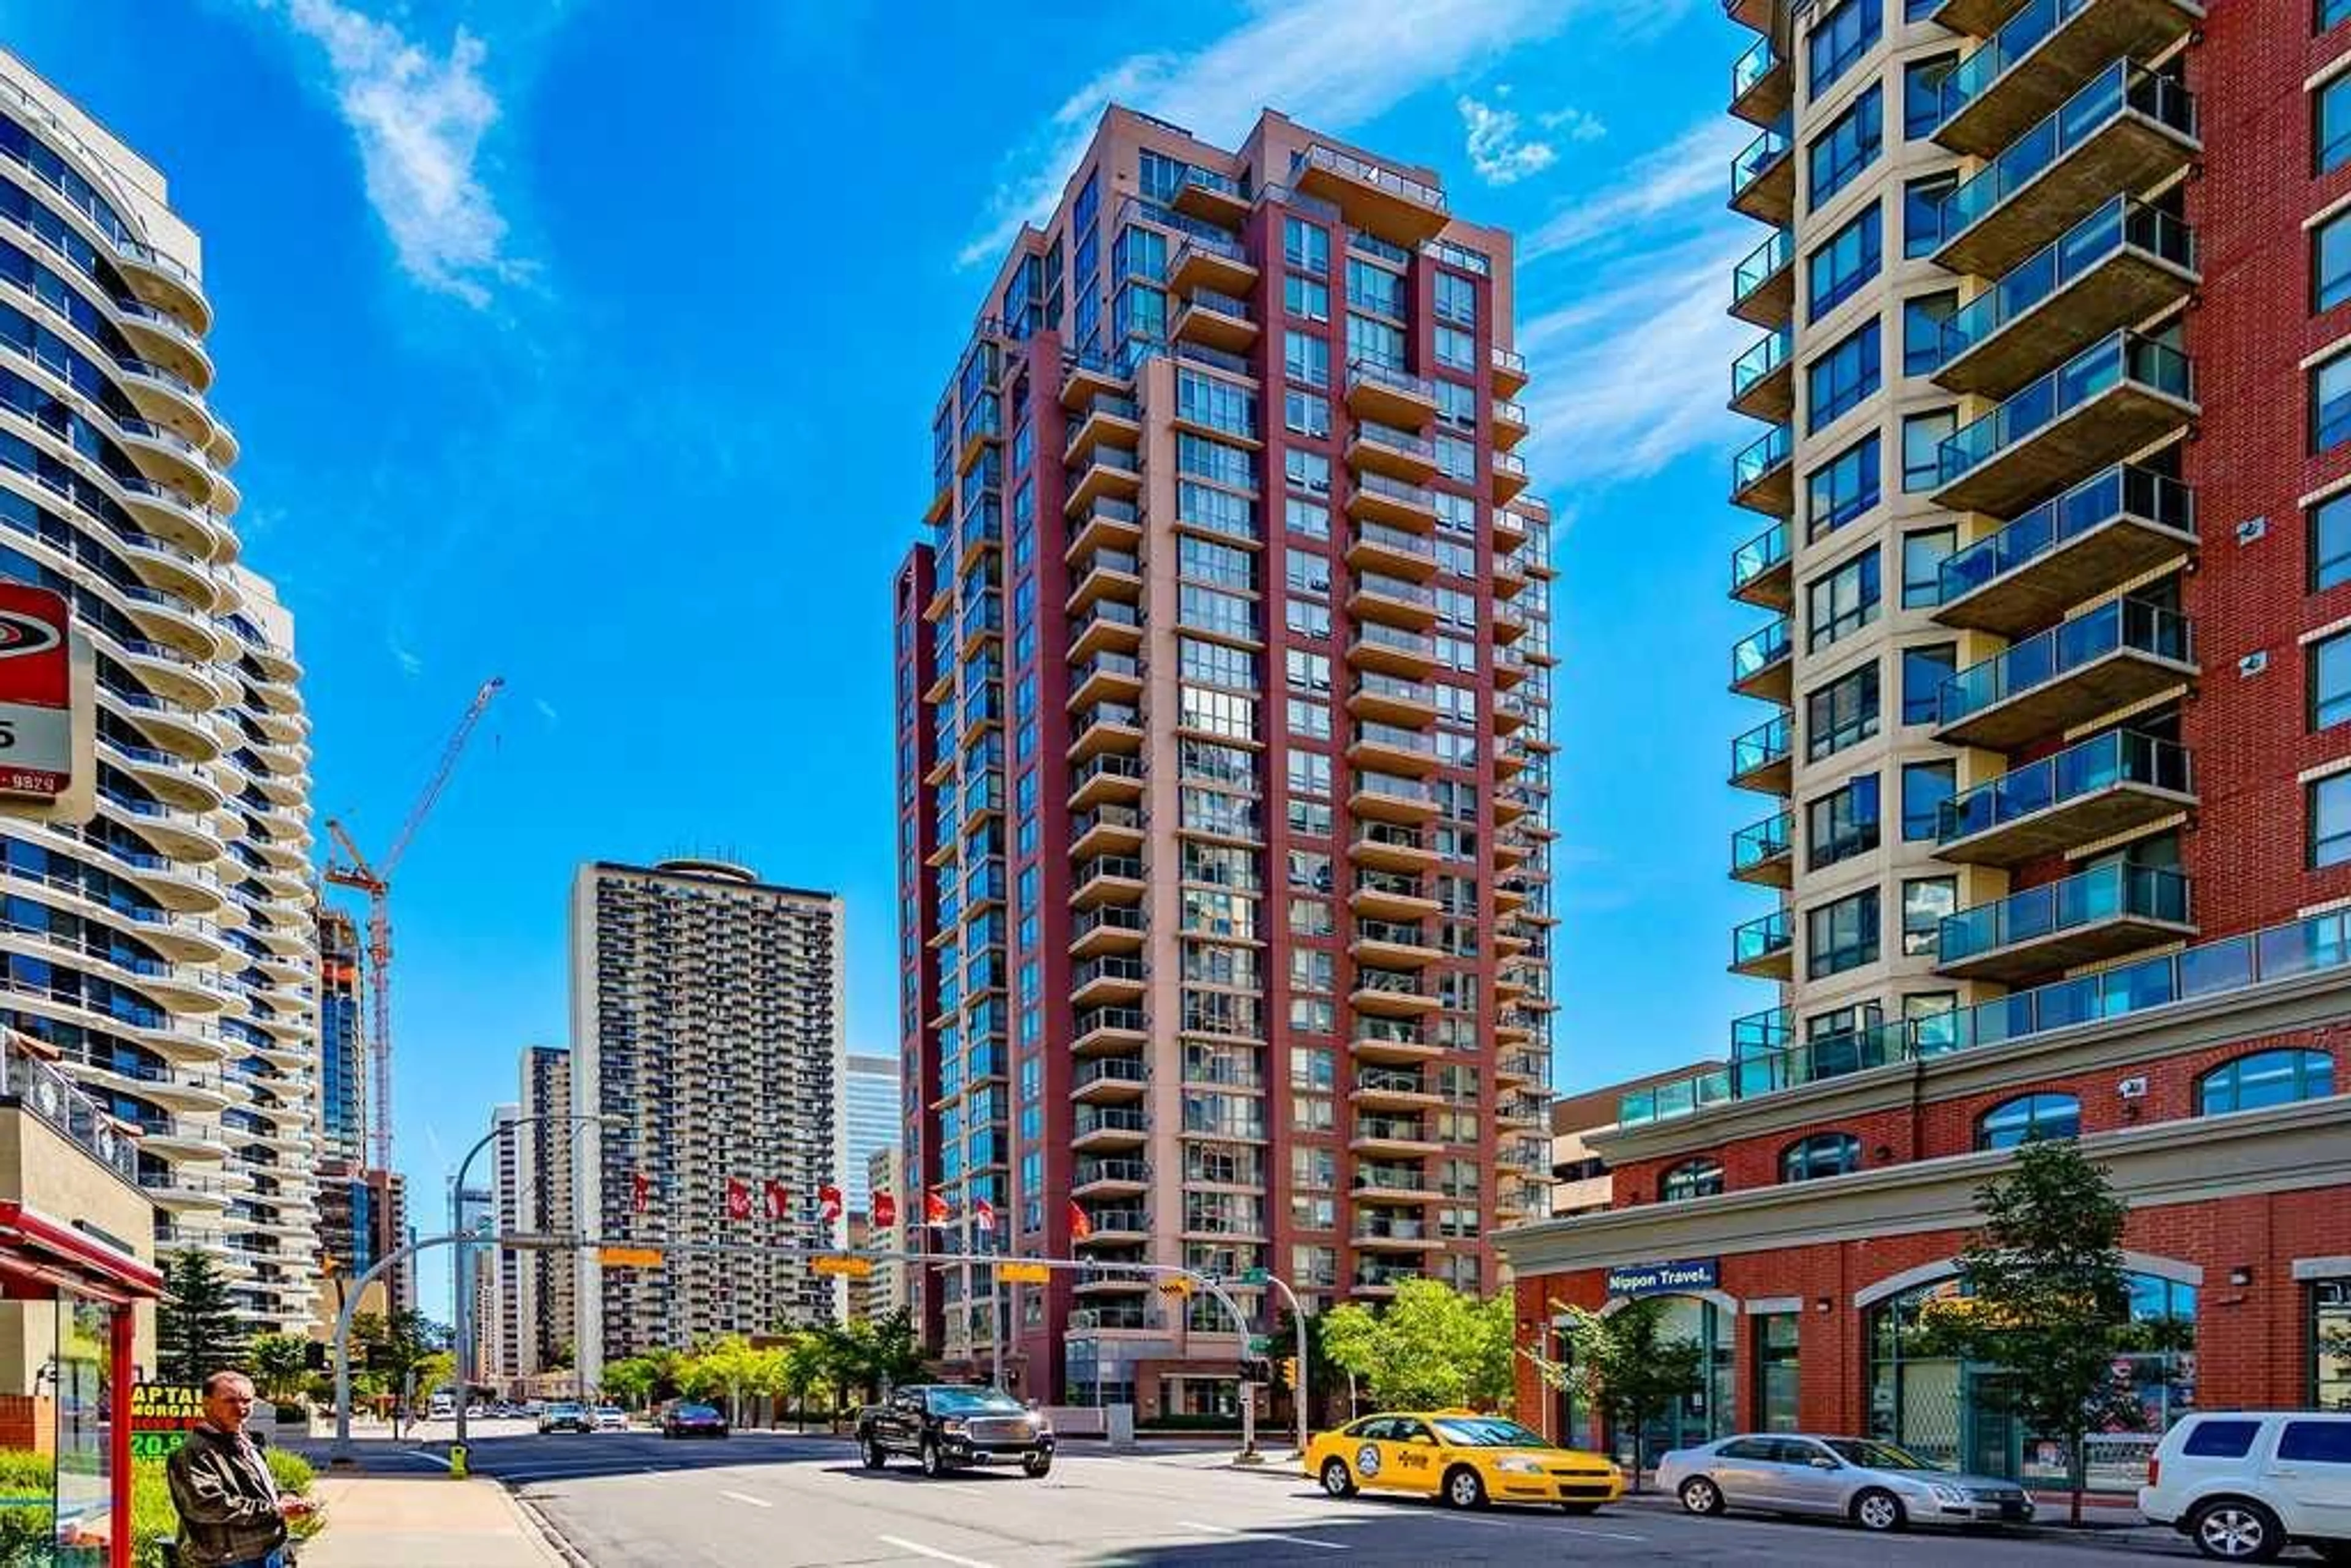


Just sold - Downtown West End
View all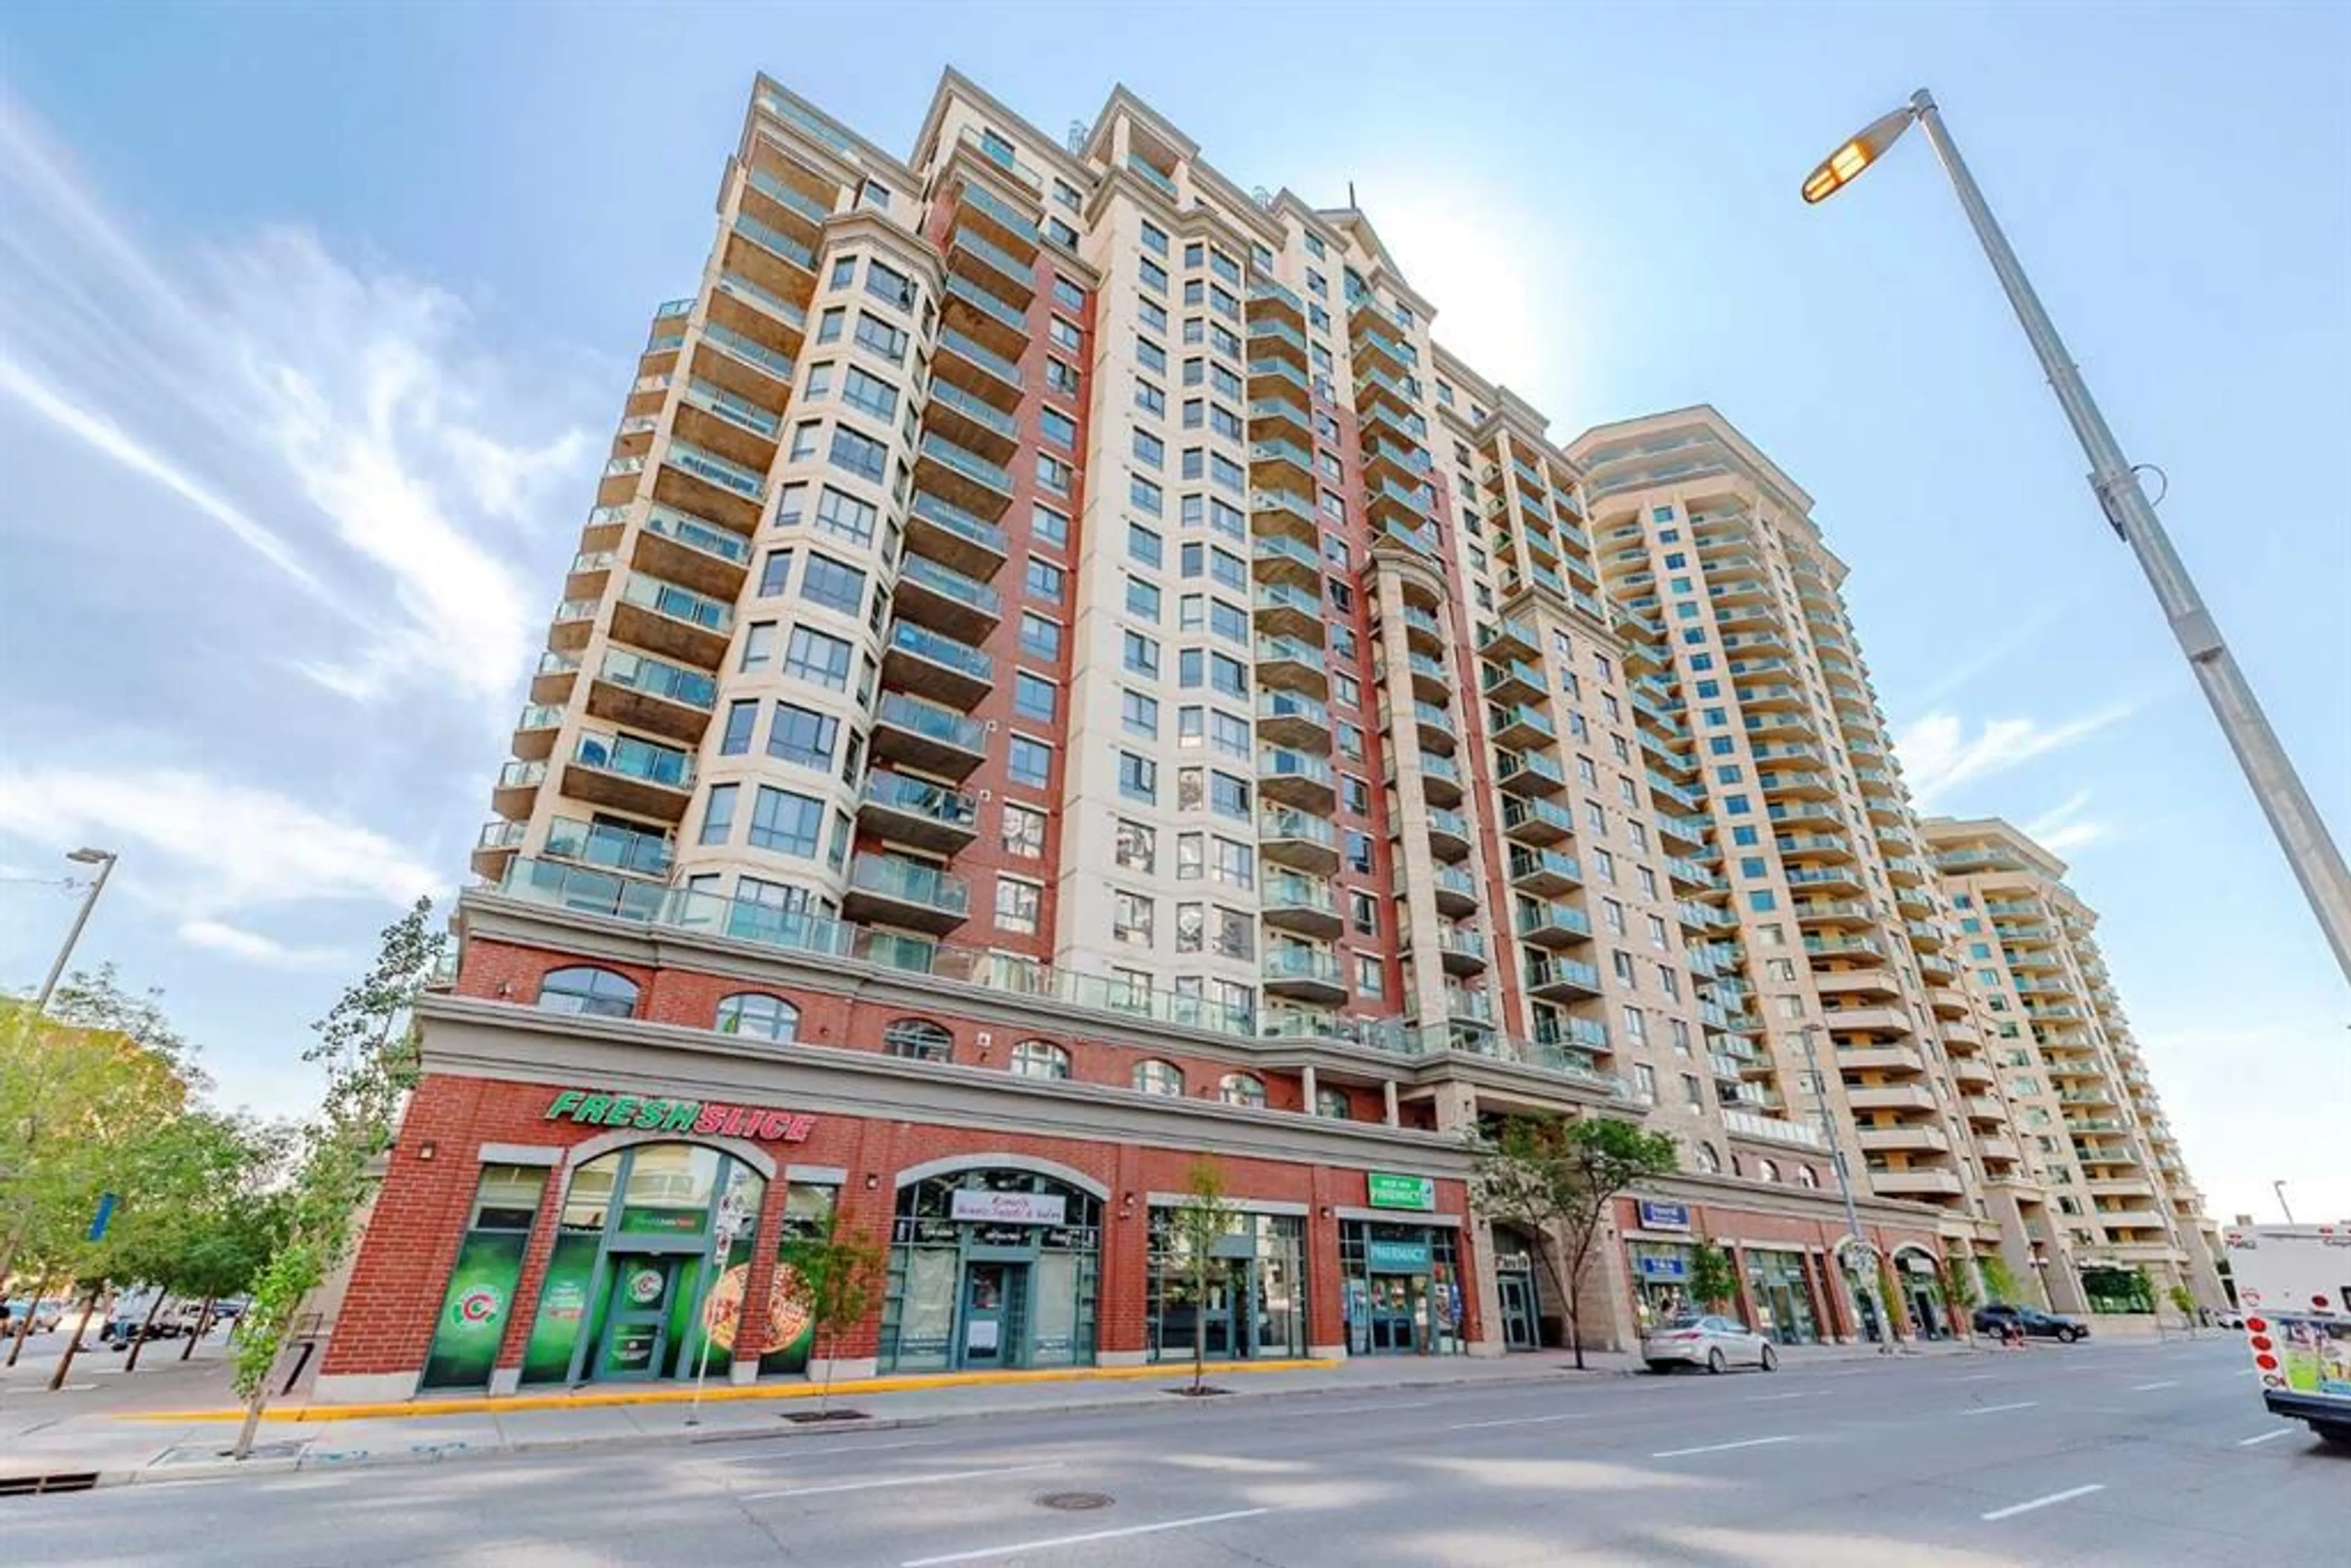


Population and Demographics
Overview
Age (%)
Household composition (%)
Mother tongue (%)
House tenancy (%)
Transportation
Car Friendly
Arteries nearby, but traffic congestion and parking problems are possible
Pedestrian Friendly
All day-to-day needs are within walking distance
Transit Friendly
Within walking distance of a subway and frequent bus lines
Shopping, Food and Nightlife
Cafes
Variety of cafés within walking distance
Groceries
At least one grocery store within a few minutes' walk
Nightlife
Variety of bars within walking distance
Shopping
Variety of shops within a few minutes' walk
Restaurants
Variety of restaurants within a few minutes' walk