Annapolis Royal
Annapolis Royal Housing Market Report
Balanced Market
All types - for the month of June
Buyer's market Seller's market
3
MOI in real estate tells you how long it would take to sell all the current homes on the market at the current sales pace if no new homes were listed. Typically, a MOI of 0-4 months indicates a seller’s market, where homes are selling quickly and there are more buyers than available homes.
86
DOM refers to Average Days on Market, which represents how long on average listings remain on the market before selling. DOM excludes listings that are pulled from the market without selling. A low DOM means it sold quickly, while a high DOM could mean it's overpriced or less in demand.
Total Active Listings*
10 active
New
2(-60.00% YoY)
Relisted
-(- YoY)
Compared to number of active, same period, in 2025: 14, in 2024: 7, in 2023: 7
Total Sold Listings*
3 sold
Median Sold Price
$260,000
Avg Days on Market
86 days
Median Bidding
-$12,900
Compared to number of sold, same period, in 2025: 2, in 2024: 6, in 2023: 2
*Data is for the month of June
Median Sold Price vs Average Days and Average Total Days on Market - Annapolis Royal - All types
Sold vs Active vs New vs Relisted - Annapolis Royal - All types
Sold Price Distribution - Annapolis Royal - All types
Sold price distribution per the last 3 months's sold listings.
Property Type Distribution - Annapolis Royal - All types
Property type distribution based on data from the last 3 months.
Median Price - Annapolis Royal - All types
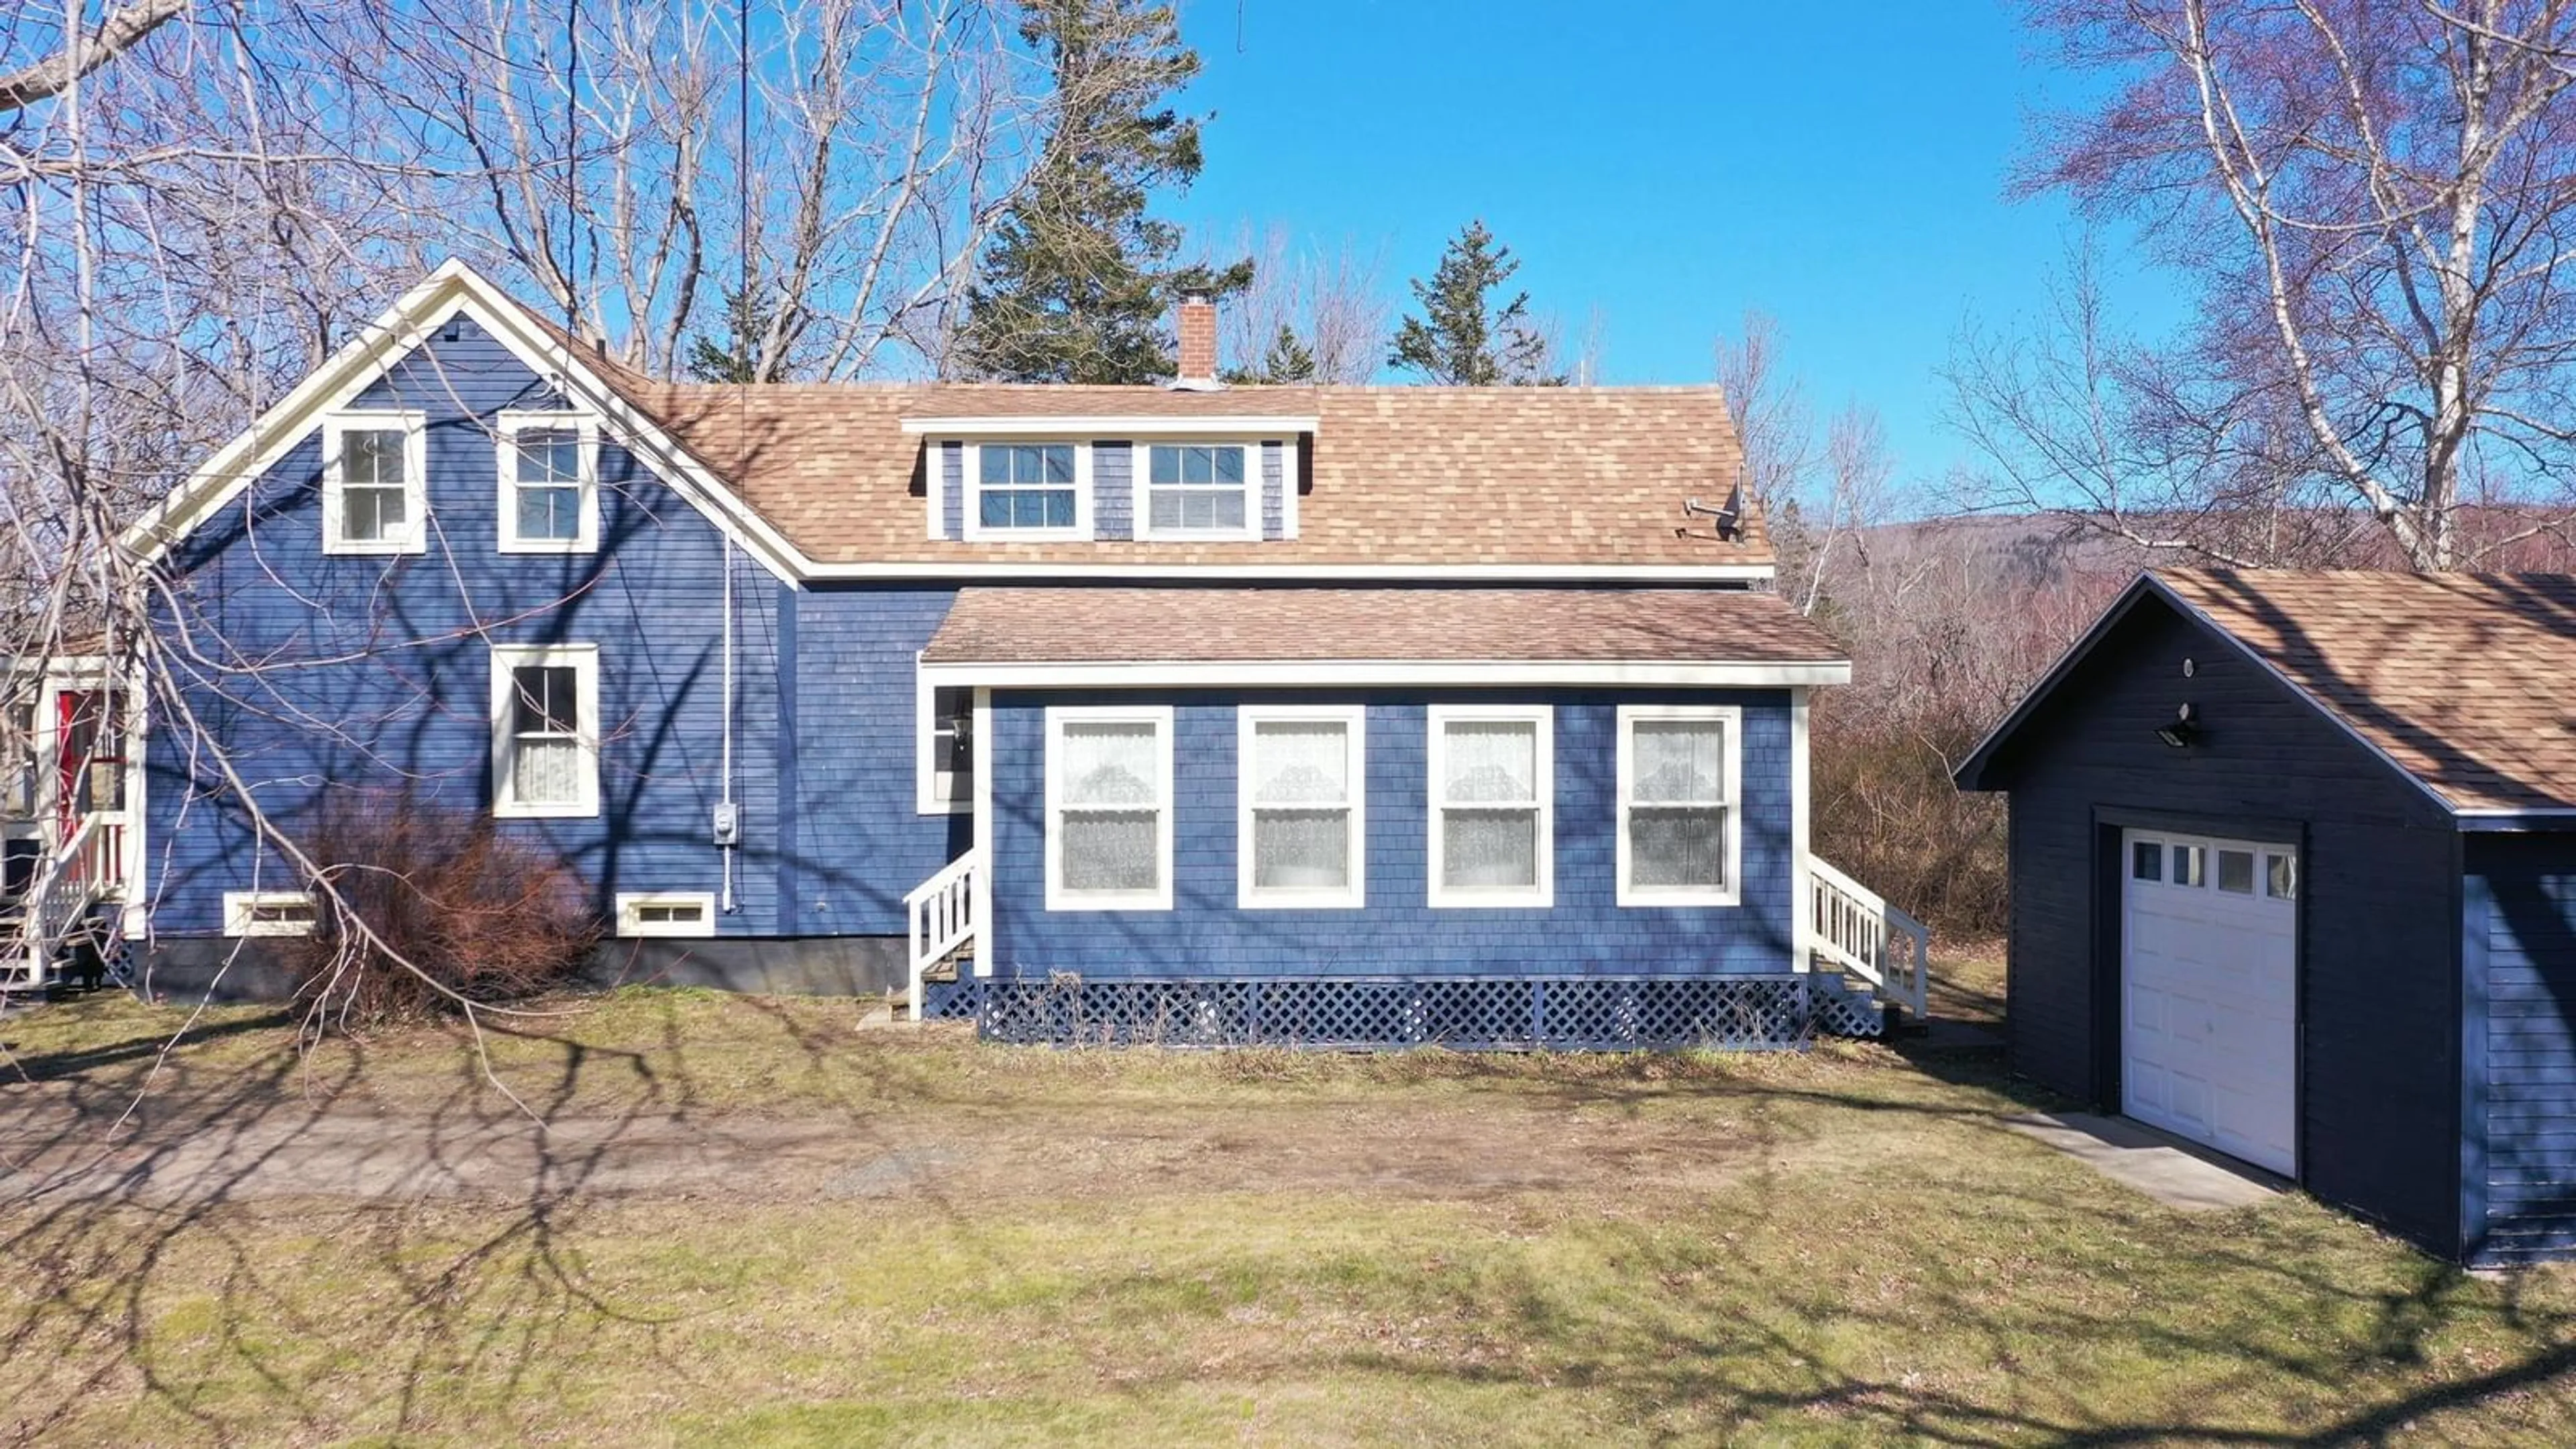
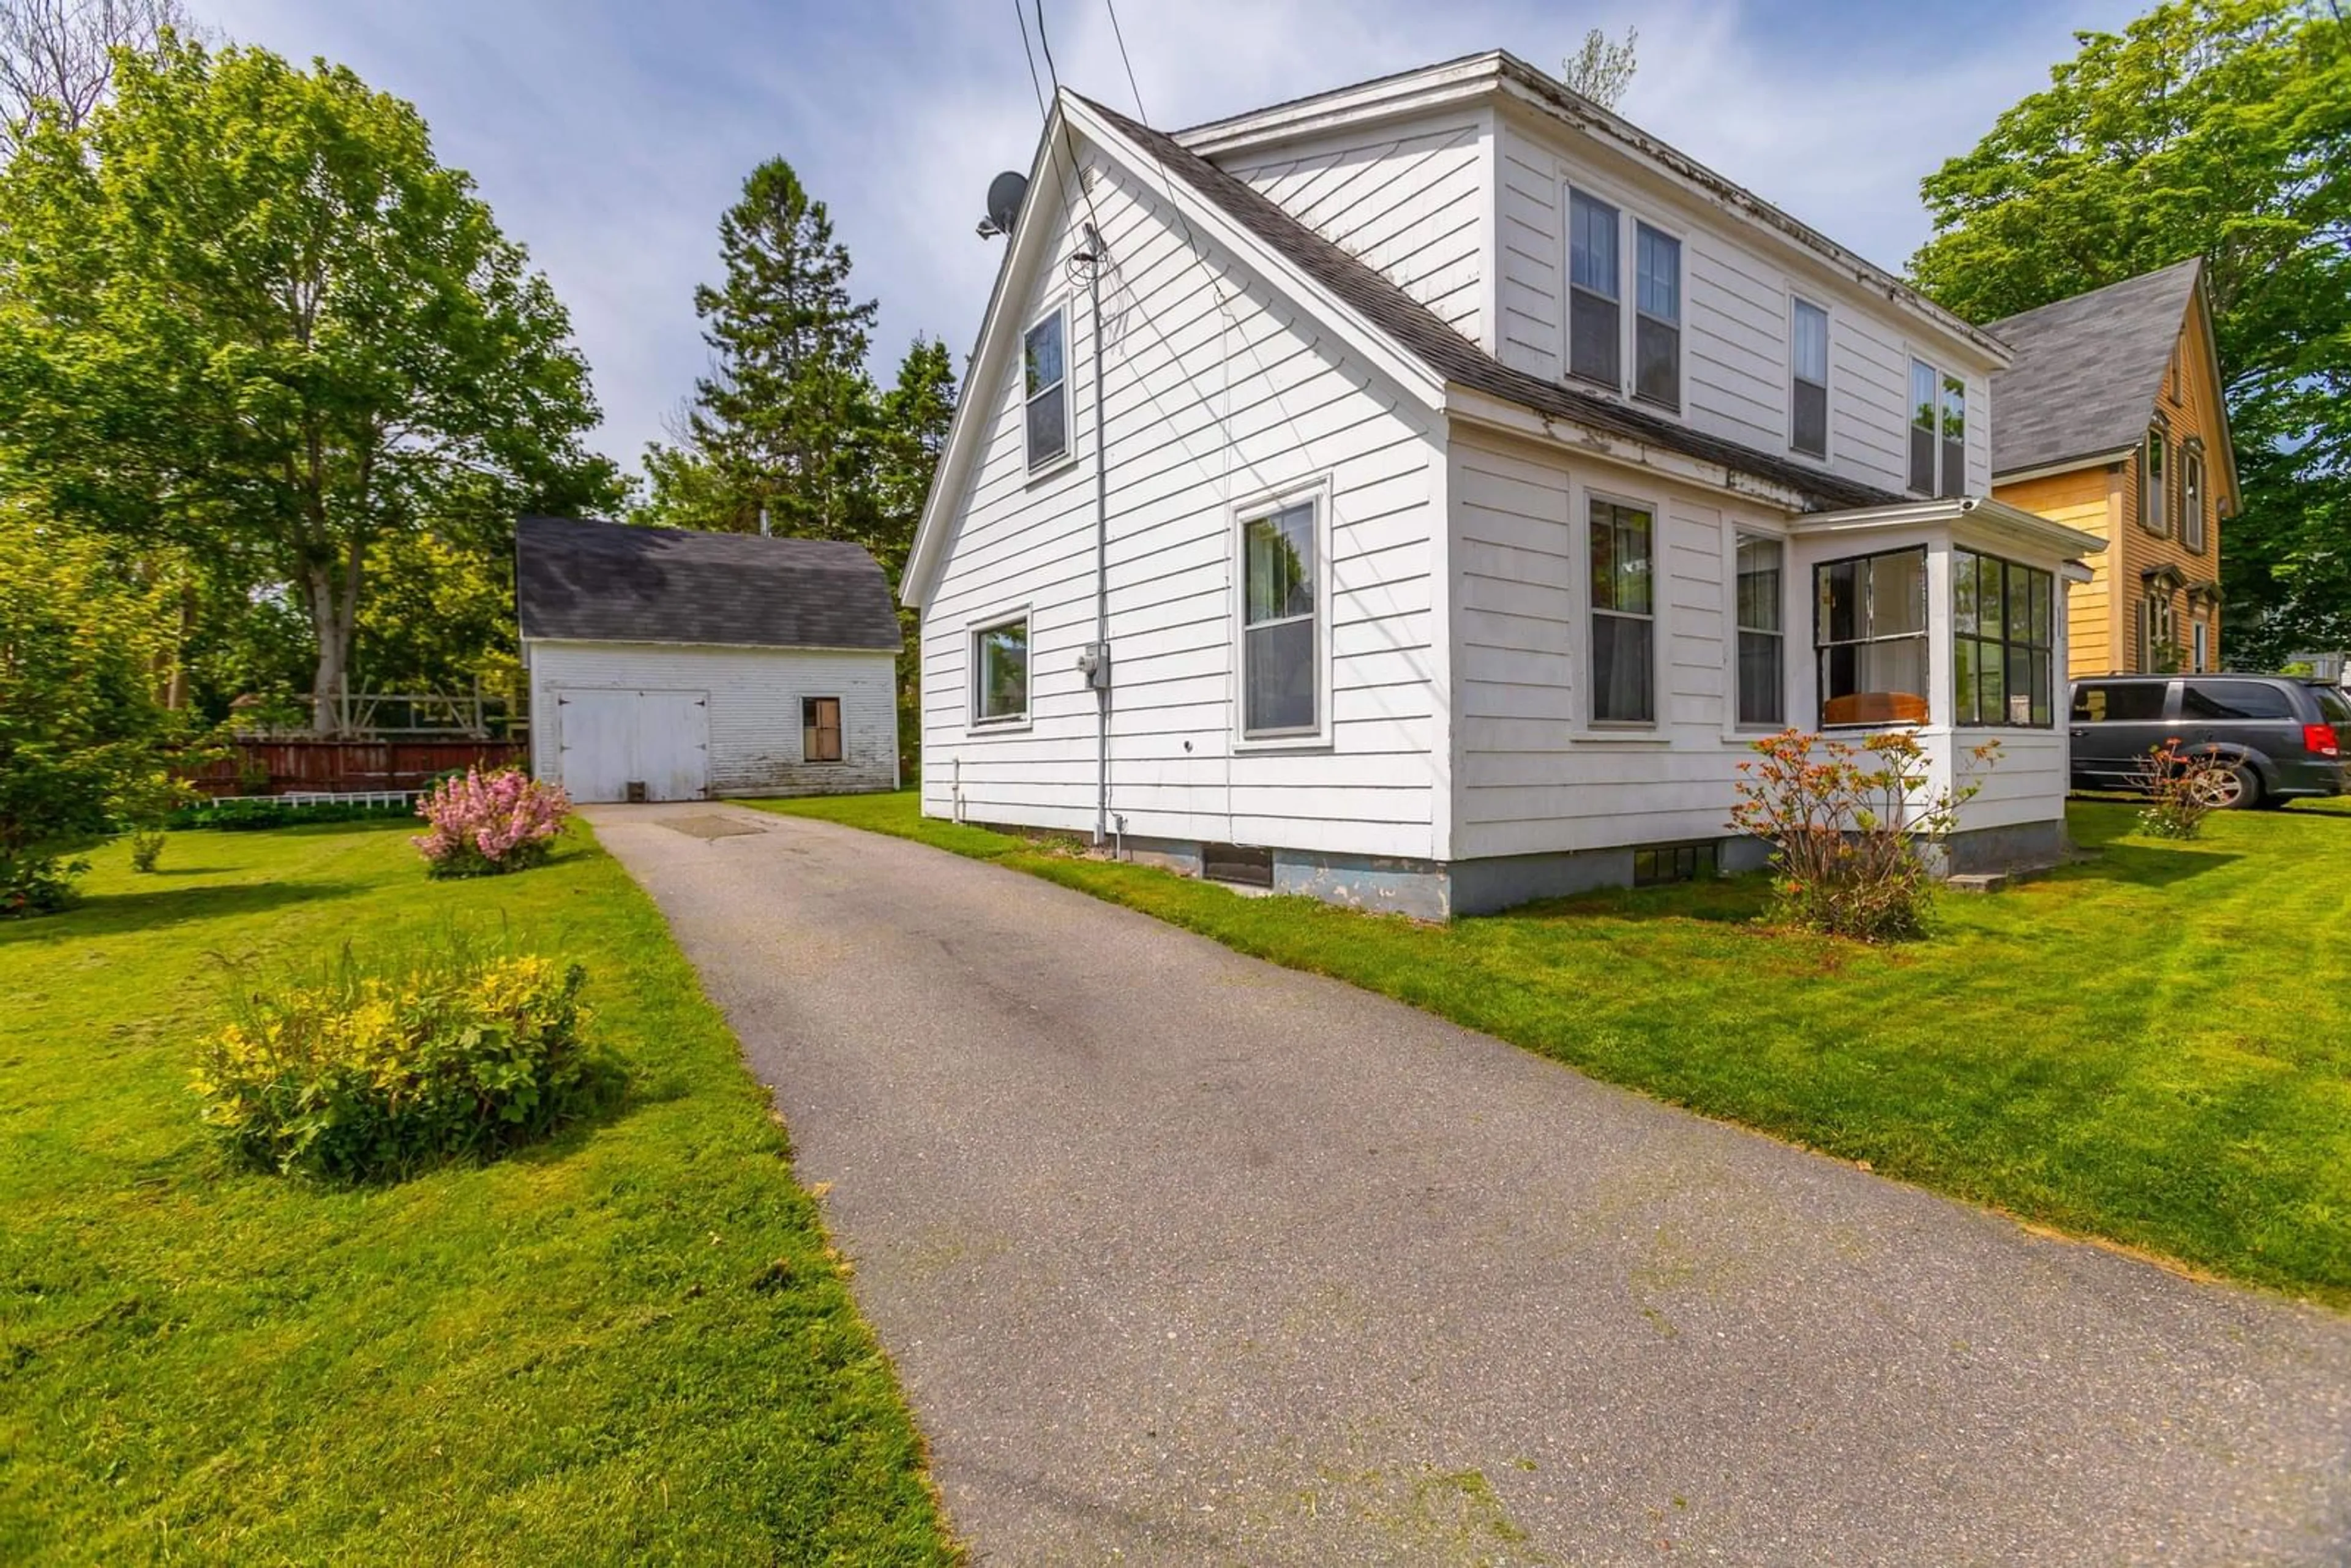
Just listed - Annapolis Royal
View all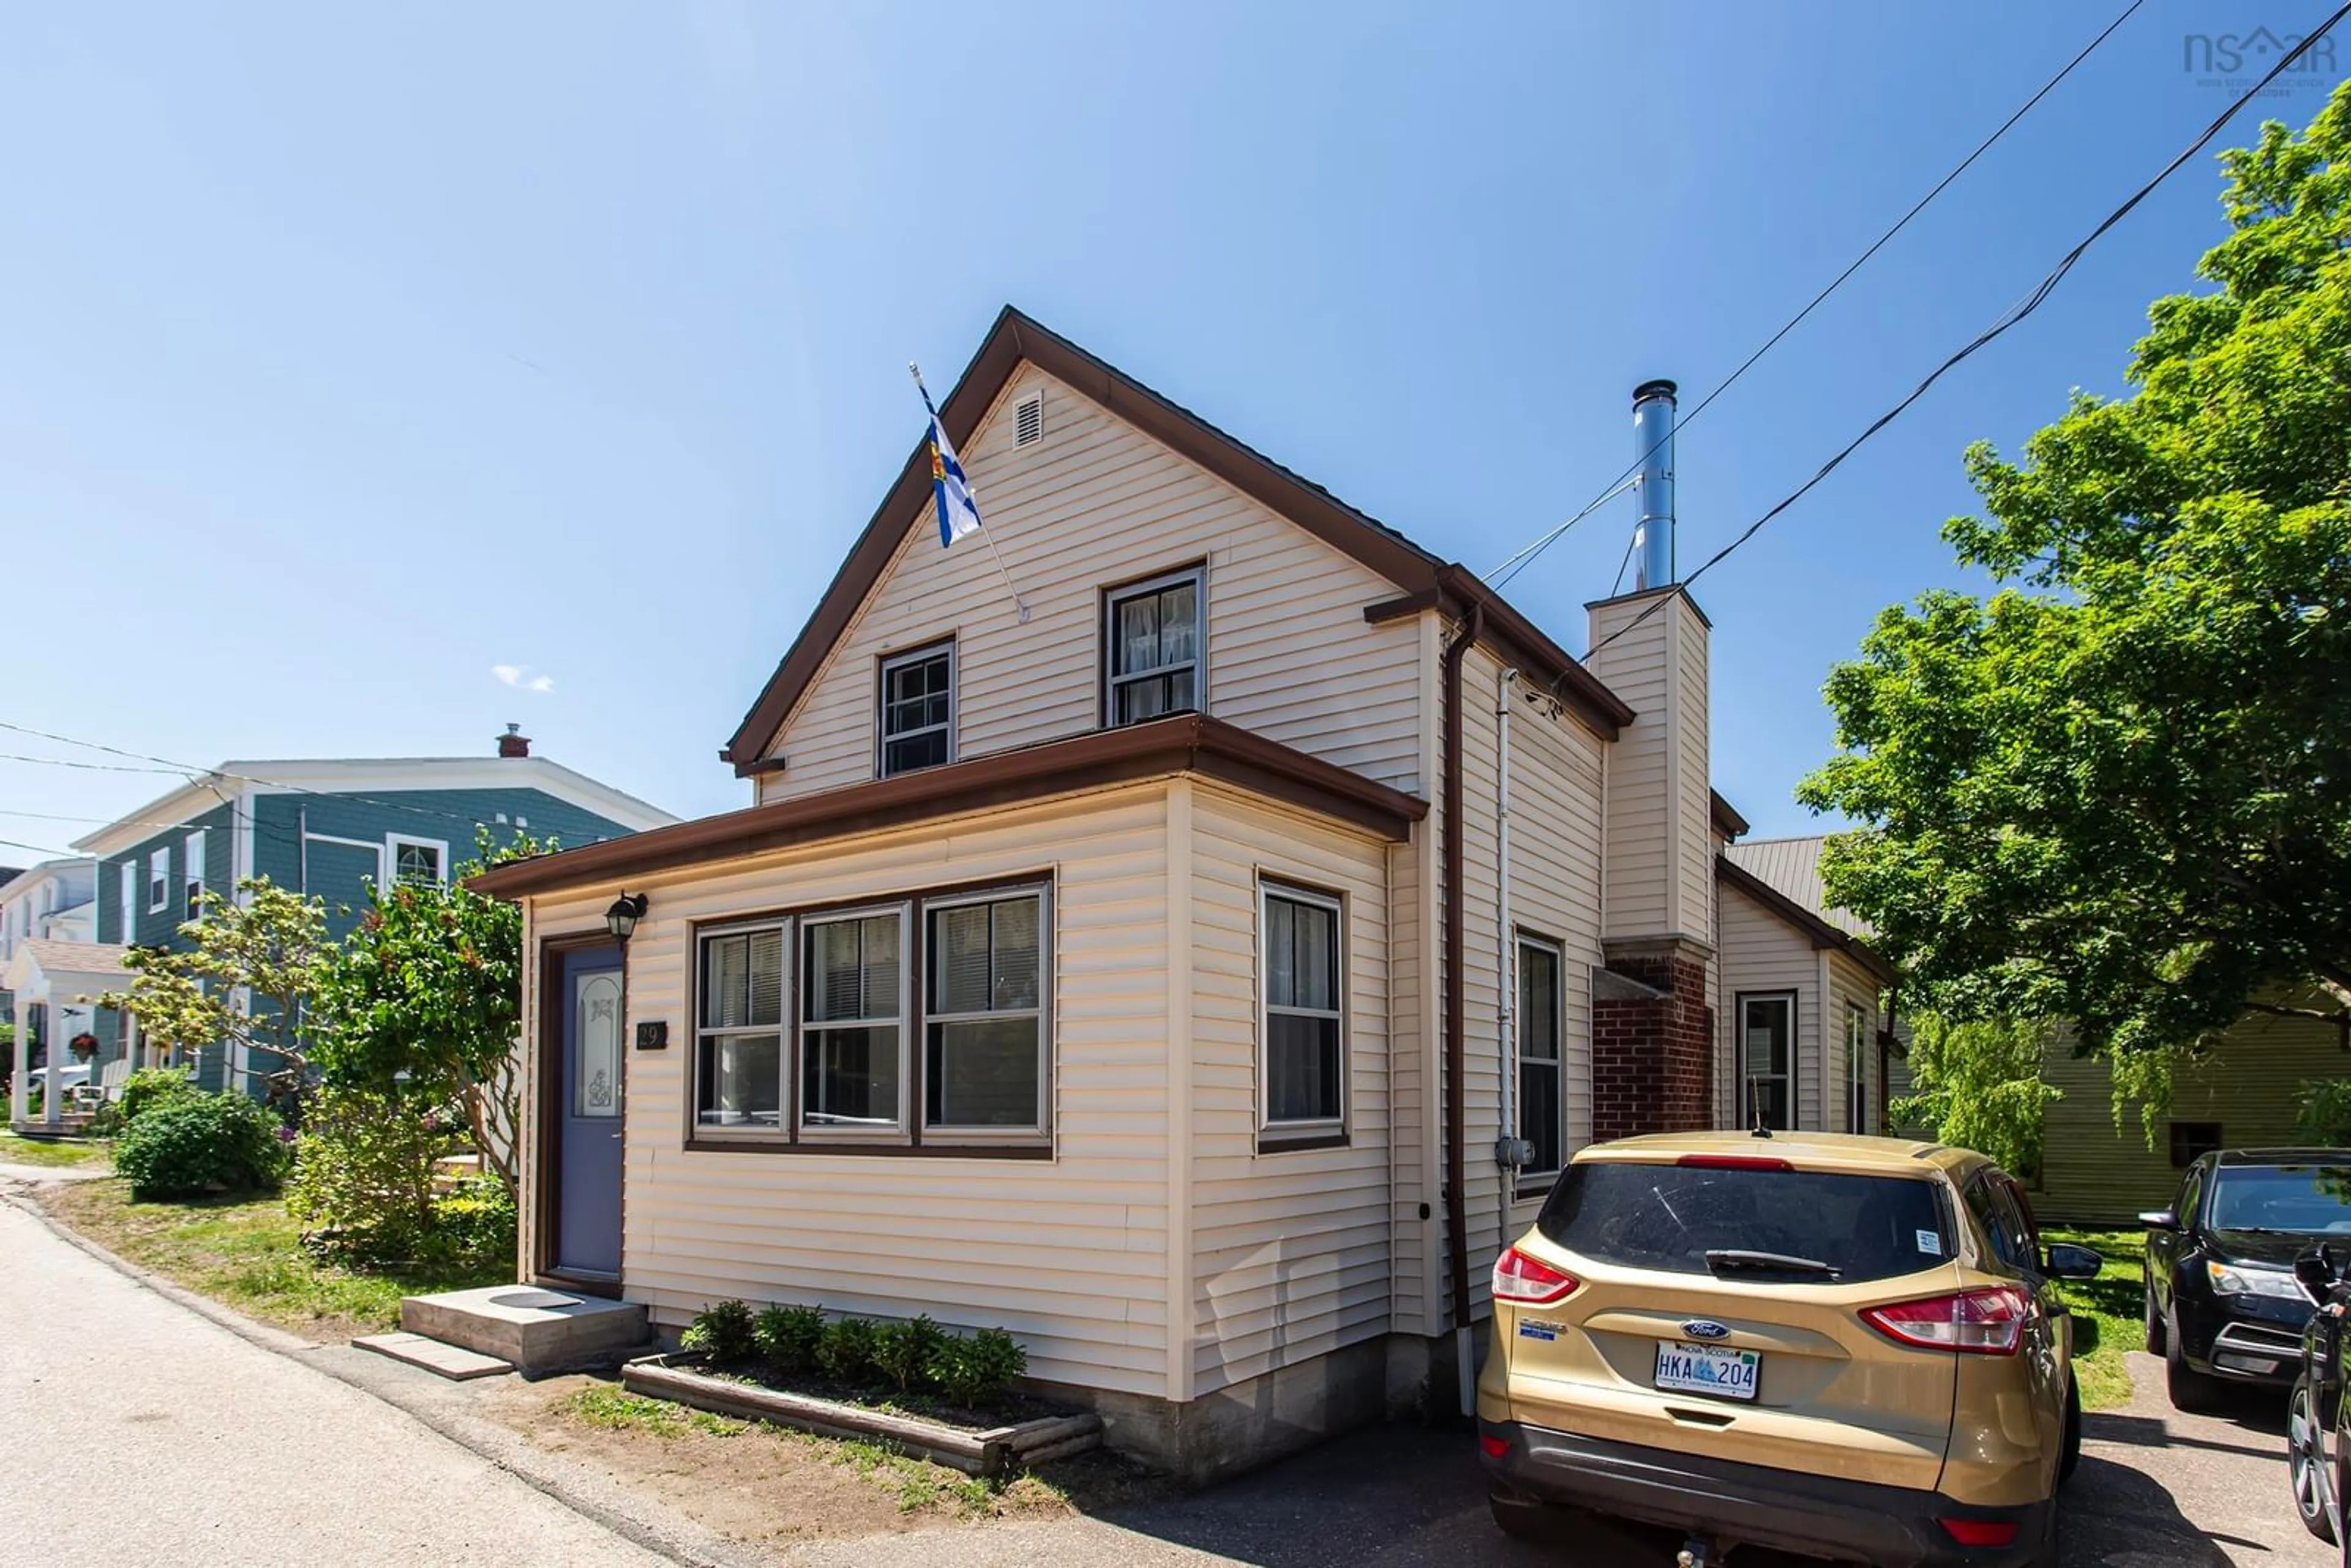


Just sold - Annapolis Royal
View all


Population and Demographics
Overview
Total population 447
Average household income $93,791
Age (%)
0 to 19
8%
20 to 34
8%
35 to 49
8%
50 to 64
26%
65 and plus
51%
Household composition (%)
Single person
53%
Single family
44%
Multi person
3%
Multi family
0%
Mother tongue (%)
English
94%
Others
2%
French
2%
German
1%
House tenancy (%)
Owners
57%
Renters
43%